1
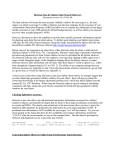
Pathfinder Technical Reference
Results
Navigation Mesh
Occupant Contour Mesh
Figure 13: Navigation Mesh vs. Occupant Contour Mesh
Contour values are calculated at the vertices of the triangles in the contour mesh and
are linearly interpolated across triangles to produce the shading. The contour mesh is
used only to display occupant contours and is independent from the navigation mesh
used during the simulation. The spatial resolution of the contour mesh as well as the
update frequency can be controlled using the Occupant Contours Properties dialog.
Smaller values for space and time resolution offer smoother contours at the cost of
greater calculation time and memory requirements.
Frames of contour data are produced throughout time depending on both the 3D results
data frames and the time step specified in the Occupant Contours Properties dialog as
discussed in the User Manual. Each contour frame lines up in time with a frame of
occupant animation data, though there does not have to be a one-to-one
correspondence. This ensures that contour data is only produced when occupants are at
known positions rather than interpolated positions. To view contour data at times
between contour frames, the data is linearly interpolated between frames.
Density
The density calculated at each vertex of the contour mesh is dependent on the location
of nearby occupants and the value of the Density Radius parameter. Any occupant
intersecting the circle around a vertex contributes to the density at that vertex.
Occupants who partially fall within the circle around a vertex contribute partially based
on intersection area.
Increasing the Density Radius parameter smooths out contours by eliminating peaks
and valleys in the density calculation. This effect will tend to be more visible near the
edges of dense flows and more stable within uniformly dense regions due to partial
attribution of occupants intersected by the density measurement radius.
49