1
DOC022.53.00782
DR 3800
USER MANUAL
January 2009 Edition 1
© Hach Company, 2009. All rights reserved. Printed in Germany.
ph/sk
2
Table of contents
Section 1 Specifications ........................................................................................................................................ 7
Section 2 General Information .............................................................................................................................. 9
2.1 Safety information .............................................................................................................................................. 9
2.1.1 Use of hazard information ......................................................................................................................... 9
2.1.2 Precautionary labels ................................................................................................................................. 9
2.1.3 Class 1 LASER ....................................................................................................................................... 10
2.1.4 Chemical and Biological Safety .............................................................................................................. 10
2.2 Overview of product ......................................................................................................................................... 10
Section 3 Installation ........................................................................................................................................... 11
3.1 Unpack the instrument ..................................................................................................................................... 11
3.2 Operating environment .................................................................................................................................... 11
3.3 Power connections ........................................................................................................................................... 12
3.4 Connection ....................................................................................................................................................... 13
3.5 Cell compartments, cuvette/sample cell adapters, light shield and Adapter Box ............................................. 14
3.5.1 Cell compartments and adapters ............................................................................................................ 14
3.5.2 Installation of the cuvette/sample cell adapters ...................................................................................... 15
3.5.3 Use of the light shield for measurements ................................................................................................ 17
3.6 Adapter Box ..................................................................................................................................................... 19
3.7 Beam path ........................................................................................................................................................ 20
Section 4 Start Up ................................................................................................................................................ 21
4.1 Power the instrument on and off ...................................................................................................................... 21
4.2 Language selection .......................................................................................................................................... 21
4.3 Self-Check ....................................................................................................................................................... 21
Section 5 Standard Operations ........................................................................................................................... 23
5.1 Overview .......................................................................................................................................................... 23
5.1.1 Tips for the use of the touch screen ........................................................................................................ 23
5.1.2 Use of the alphanumeric keypad ............................................................................................................ 23
5.1.3 Main Menu .............................................................................................................................................. 24
5.2 Instrument Setup mode .................................................................................................................................... 25
5.2.1 Operator ID ............................................................................................................................................. 25
5.2.2 Sample ID ............................................................................................................................................... 26
5.2.3 Date and time .......................................................................................................................................... 27
5.2.4 Display and sound preferences .............................................................................................................. 28
5.2.5 Lamp control ........................................................................................................................................... 29
5.2.6 PC and printer ......................................................................................................................................... 30
5.2.6.1 Printer setup ............................................................................................................................... 30
5.2.6.2 Print data .................................................................................................................................... 32
5.2.6.3 HACH Data Trans ....................................................................................................................... 32
5.2.6.4 Help Guide .................................................................................................................................. 33
5.2.7 Password ................................................................................................................................................ 33
5.2.7.1 Password deactivation ................................................................................................................ 35
5.2.8 Select color ............................................................................................................................................. 35
3
Table of Contents
5.3 Store, recall, send and delete data .................................................................................................................. 36
5.3.1 The data log ............................................................................................................................................ 36
5.3.1.1 Auto/manual data storage ........................................................................................................... 36
5.3.1.2 Recall stored data from the data log ........................................................................................... 36
5.3.1.3 Send data from the data log ....................................................................................................... 37
5.3.1.4 Delete stored data from the data log .......................................................................................... 38
5.3.2 Store, recall, send and delete data from wavelength scan and time course ........................................... 38
5.3.2.1 Data storage from wavelength scan or time course ................................................................... 38
5.3.2.2 Recall stored data from wavelength scan or time course ........................................................... 39
5.3.2.3 Send data from wavelength scan or time course ........................................................................ 40
5.3.2.4 Delete stored data from wavelength scan or time course ........................................................... 41
5.4 Stored Programs .............................................................................................................................................. 42
5.4.1 Select a saved test/method; entering user-specific basic data ............................................................... 42
5.4.2 Stored program options .......................................................................................................................... 42
5.4.3 Use of program timers ............................................................................................................................ 44
5.4.4 Set the reading mode .............................................................................................................................. 45
5.4.4.1 Take single wavelength measurements (single reading) ............................................................ 45
5.4.4.2 Take single wavelength measurements (continuous readings) .................................................. 45
5.4.5 Set the dilution factor .............................................................................................................................. 46
5.4.6 Run a standard adjust ............................................................................................................................. 47
5.4.7 Set the chemical form ............................................................................................................................. 47
5.4.7.1 Change of the default setting of the chemical form .................................................................... 48
5.4.8 Run a reagent blank ................................................................................................................................ 48
5.4.9 Analysis of samples ................................................................................................................................ 49
5.4.10 Add stored programs to the favorite programs list ................................................................................ 50
5.5 Barcode Programs ........................................................................................................................................... 51
5.5.1 Complete a barcode 13 mm test/vial ...................................................................................................... 52
5.5.2 Select the measuring range .................................................................................................................... 53
5.5.3 Select the chemical evaluation form ....................................................................................................... 53
5.5.3.1 Change of the default setting of the chemical form .................................................................... 53
5.5.4 Basic test-specific and sample-specific data settings ............................................................................. 54
5.5.5 Sample blank .......................................................................................................................................... 55
5.5.6 Update of a barcode test ......................................................................................................................... 55
5.5.7 Upgrade of the instrument software ........................................................................................................ 56
Section 6 Advanced Operations ......................................................................................................................... 57
6.1 User Programs ................................................................................................................................................. 57
6.1.1 Program a user method .......................................................................................................................... 57
6.1.1.1 Single wavelength settings ......................................................................................................... 59
6.1.1.2 Multi wavelength settings ............................................................................................................ 60
6.1.1.3 Calibration settings for single and multi wavelength mode ......................................................... 62
6.1.1.4 Store a user program .................................................................................................................. 66
6.1.1.5 Additional user-defined parameters and functions ..................................................................... 66
6.1.2 Free programming program type ............................................................................................................ 68
6.1.2.1 Measurement process ................................................................................................................ 68
6.1.2.2 Enter a new element of a measuring sequence ......................................................................... 69
6.1.2.3 Enter the calibration formula (evaluation formula) ...................................................................... 71
6.1.2.4 Enter variables ............................................................................................................................ 74
6.1.2.5 Save a free programming user program ..................................................................................... 74
6.1.3 Select a user program ............................................................................................................................. 75
6.1.4 Add, edit and delete user programs from the favorites list ...................................................................... 75
6.1.4.1 Add to Favorites .......................................................................................................................... 76
6.1.4.2 Edit .............................................................................................................................................. 76
6.1.4.3 Delete ......................................................................................................................................... 76
4
Table of Contents
6.2 Favorite Programs ........................................................................................................................................... 77
6.2.1 Recall a favorite program ........................................................................................................................ 77
6.2.2 Delete a favorite program ....................................................................................................................... 77
6.3 Standard Addition – monitoring/checking results ............................................................................................. 78
6.3.1 Complete a standard addition ................................................................................................................. 79
6.4 Single Wavelength (absorbance, concentration and transmittance measurements) ....................................... 83
6.4.1 Set up single wavelength mode .............................................................................................................. 83
6.4.2 Take single wavelength measurements (single reading) ........................................................................ 85
6.4.3 Take single wavelength measurements (continuous readings) .............................................................. 85
6.5 Multi-Wavelength mode – measurements at more than one wavelength ........................................................ 86
6.5.1 Set the reading mode at different wavelengths ....................................................................................... 86
6.5.2 Complete a measurement in the multi wavelength mode ....................................................................... 89
6.6 Wavelength Scan mode – recording of absorbance and transmittance spectrums ......................................... 90
6.6.1 Set up the wavelength scan .................................................................................................................... 90
6.6.2 Wavelength scan reading ....................................................................................................................... 93
6.6.2.1 Navigation of the wavelength scan graph or a wavelength scan analysis .................................. 94
6.6.3 Work with reference scans ...................................................................................................................... 95
6.7 Time course of absorbance/transmittance ....................................................................................................... 97
6.7.1 Time course setup parameters ............................................................................................................... 97
6.7.2 Time course scan reading ....................................................................................................................... 98
6.7.3 Analysis of time course data ................................................................................................................... 99
6.7.3.1 Navigation of a time scan or a time scan analysis .................................................................... 100
6.8 System checks ............................................................................................................................................... 101
6.8.1 Instrument information .......................................................................................................................... 101
6.8.2 Upgrade of the instrument software ...................................................................................................... 102
6.8.3 Optical checks ....................................................................................................................................... 102
6.8.3.1 Wavelength check .................................................................................................................... 103
6.8.3.2 Noise check .............................................................................................................................. 103
6.8.3.3 Stray light check ....................................................................................................................... 105
6.8.3.4 Absorbance check .................................................................................................................... 106
6.8.3.5 Drift check ................................................................................................................................. 107
6.8.3.6 Verification kit ........................................................................................................................... 108
6.8.4 Output checks ....................................................................................................................................... 110
6.8.5 Lamp history ......................................................................................................................................... 110
6.8.5.1 Factory service ......................................................................................................................... 110
6.8.6 Service time .......................................................................................................................................... 111
6.8.7 Instrument backup ................................................................................................................................ 112
Section 7 Maintenance ...................................................................................................................................... 115
7.1 Cleaning requirements ................................................................................................................................... 115
7.1.1 Spectrophotometer ............................................................................................................................... 115
7.1.2 Display .................................................................................................................................................. 115
7.1.3 Cuvettes/sample cells ........................................................................................................................... 115
7.2 Lamp replacement ......................................................................................................................................... 116
7.3 Filter pad maintenance .................................................................................................................................. 118
7.3.1 Filter pad replacement .......................................................................................................................... 118
Section 8 Troubleshooting ................................................................................................................................ 121
Section 9 Replacement Parts ............................................................................................................................ 123
Section 10 Contact Information ........................................................................................................................ 125
Section 11 Limited Warranty ............................................................................................................................. 127
Index .................................................................................................................................................................... 129
5
Table of Contents
6
Section 1
Specifications
Specifications are subject to change without notice.
Performance specifications
Operating Mode
Transmittance (%), Absorbance and Concentration
Source Lamp
Gas-filled Tungsten (visible)
Wavelength Range
320–1100 nm
Wavelength Accuracy
± 1.5 nm (wavelength range 340–900 nm)
Wavelength Reproducibility
≤ 0.1 nm
Wavelength Resolution
1 nm
Wavelength Calibration
Automatic
Wavelength Selection
Automatic, based on method selection
Scanning Speed
≥ 12 nm/s (in steps of 1nm)
Spectral Bandwidth
5 nm
Photometric measuring range
± 3.0 Abs (wavelength range 340–900 nm)
Photometric Accuracy
5 m-Abs at 0.0 to 0.5 Abs
1% at 0.50 to 2.0 Abs
Photometric Linearity
< 0.5% to 2 Abs
< = 1% at > 2 Abs with neutral glass at 546 nm
Stray Light
< 0.1% T at 340 nm with NaNO2
Data strorage
1000 measured values (Result, Date, Time, Sample ID, User ID)
User programs
50
Physical and environmental specifications
Width
368 mm (14.5 in.)
Height
144 mm (5.7 in.)
Depth
359 mm (14.1 in.)
Weight
6.4 kg (14.11 Ib)
Operating requirements
10–40 °C (50–104 °F), max. 80% relative humidity (non-condensing)
Storage requirements
–40–60 °C (-40–140 °F) max. 80% relative humidity (non-condensing)
Additional technical data
Mains connection
DR 3800 connected with:
External power supply: 100–240V/50–60Hz (input); 15V/30VA (output)
Interfaces
Use only shielded cable with max. length of 3 m.
1 x USB type A
1 x USB type B
Enclosure rating
IP3X
Safety class
Instrument: Class III
System: Class II
7
Specifications
8
Section 2
General Information
2.1 Safety information
Please read this entire manual before unpacking, setting up or
operating this equipment. Pay attention to all danger, warning and
caution statements. Failure to do so could result in serious injury to
the operator or damage to the equipment.
To ensure that the protection provided by this equipment is not
impaired, do not use or install this equipment in any manner other
than that specified in this manual.
2.1.1 Use of hazard information
DANGER
Indicates a potentially or imminently hazardous situation
which, if not avoided, will result in death or serious injury.
WARNING
Indicates a potentially or imminently hazardous situation
which, if not avoided, could result in death or serious injury.
CAUTION
Indicates a potentially hazardous situation that may result in
minor or moderate injury.
Important Note: Indicates a situation which, if not avoided, may
cause damage to the instrument. Information that requires special
emphasis.
Note: Information that supplements points in the main text.
2.1.2 Precautionary labels
Read all labels and tags attached to the instrument. Personal injury
or damage to the instrument could occur if not observed. A symbol,
if noted on the instrument, will be included with a danger or caution
statement in the manual.
This symbol, if noted on the instrument, references the instruction manual for operation and/or safety information.
Electrical equipment marked with this symbol may not be disposed of in European public disposal systems after
12 August of 2005. In conformity with European local and national regulations (EU Directive 2002/96/EC),
European electrical equipment users must now return old or end-of life equipment to the Producer for disposal at no
charge to the user.
Note: For return for recycling, please contact the equipment producer or supplier for instructions on how to return
end-of-life equipment, producer-supplied electrical accessories and all auxiliary items for proper disposal.
LASER CLASS 1
This symbol indicates that the instrument contains a Class 1 LASER device.
Data: 0.3 mW; l = 650 nm
9
General Information
2.1.3 Class 1 LASER
A Class 1 LASER is installed in this instrument. Class 1 LASERS
are products where the radiant power of the LASER beam
accessible (the accessible emission) is always below the Maximum
Permissible Exposure value. Therefore, for Class 1 LASERS the
output power is below the level at which it is believed eye damage
will occur. Exposure to the beam of a Class 1 LASER will not result
in eye injury. Class 1 LASERS may therefore be considered safe.
However, Class 1 LASER products may contain LASER systems of
a higher Class but there are adequate engineering control
measures to ensure that access to the beam is not reasonably
likely. Examples of such products include LASER printers and
compact disc players. CDRH assession number 0510555-02.
Data: 0.3 mW; wavelength = 650 nm
2.1.4 Chemical and Biological Safety
DANGER
Potential Chemical/ Biological Exposure Hazards. Handling
chemical samples, standards and reagents can be dangerous.
Users of this product are advised to familiarize themselves
with safety procedures and the correct use of chemicals, and
to carefully read all relevant Material Safety Data Sheets.
Normal operation of this instrument may involve the use of
hazardous chemicals or biologically harmful samples.
•
The user must observe all cautionary information printed on the
original solution containers and safety data sheet prior to their
use.
•
All waste solutions must be disposed in accordance with local
and national law.
•
The type of protective equipment must be selected according to
the concentration and amount of the dangerous substance at
the specific workplace.
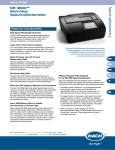
2.2 Overview of product
The DR 3800 Spectrophotometer is a VIS spectrophotometer with a
wavelength range of 320 to 1100 nm. The instrument comes with a
complete set of application programs and multi-language support.
The DR 3800 Spectrophotometer contains the following application
modes: Stored Programs (pre-installed tests), Barcode Programs,
User Programs, Favorite Programs, Single Wavelength Mode,
Multi-Wavelength Mode, Wavelength Scan and Time Course Mode.
The DR 3800 Spectrophotometer provides digital readouts in direct
concentration units, absorbance or percent transmittance.
When a user-generated or programmed method is selected, the
menus and prompts direct the user through the test.
This menu system can also be used to generate reports, statistical
evaluations of generated calibration curves, and to report
instrument diagnostic checks.
10
Section 3
Installation
WARNING
Electrical and Fire Hazards. Use only the provided power
supply. Only qualified personnel should conduct the tasks
described in this section of the manual.
3.1 Unpack the instrument
The DR 3800 Spectrophotometer comes packaged with the
following items:
•
DR 3800 spectrophotometer
•
Dust cover
•
External power supply, including 4 adapters for EU, UK, USA
and AUS/China
•
Adapter Box
•
3 different cuvette/sample cell adapters (A, B and C)
•
Light shield (already installed in the instrument)
•
DR 3800 User Manual
•
Quick start guide DR 3800
•
CD-ROM containing the HACH procedures
Note: If any of these items are missing or damaged, contact the
manufacturer or a sales representative immediately.
3.2 Operating environment
The following conditions are necessary to ensure correct
instrument operation and accurate results:
•
Place the instrument firmly on an even surface. Do not push
any objects under the instrument.
•
Maintain an ambient temperature of 10 to 40 ºC (50 to 104 ºF)
for proper instrument operation.
•
The relative humidity should be less than 80%; moisture should
not condense on the instrument.
•
Leave at least a 15 cm (6 in.) clearance at the top and on all
sides for air circulation to avoid overheating of electrical parts.
•
Do not operate or store the instrument in extremely dusty,
damp or wet locations.
•
Keep the surface of the instrument, the cell compartment and
all accessories clean and dry at all times. Splashes or spills on
and in the instrument should be cleaned up immediately (see
section 7.1 on page 115).
Important Note: Protect the instrument from temperature
extremes, including heaters, direct sunlight and other heat sources.
11
Installation
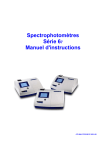
3.3 Power connections
Install the correct adapter plug on the supplied external power
supply (Figure 1) by sliding the adapter on until it "clicks" into
position. Correctly mounted, both housing of power supply and plug
are in line. Plug the external power supply cord into the connector
on the back panel of the instrument, then plug the supply into a
power outlet (100–240 V~ / 50–60 Hz). Press the power switch on
the back of the instrument to initialize power
(Figure 2 on page 13).
Figure 1 Power adapter
1
Power supply with EU adapter plug installed
3
USA adapter plug
2
UK adapter plug
4
AUS/China adapter plug
12
Installation
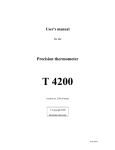
3.4 Connection
The DR 3800 has two USB interfaces as a standard feature,
located on the back of the instrument (Figure 2).
The USB Type A interface is used for communications with a
printer, USB memory stick, barcode scanner, or keyboard. A USB
memory stick is used to update instrument software.
The USB Type B interface is used for communications with a PC.
The optional Hach Data Trans software (see Section 9 on
page 123) must be installed on the PC for this use.
A USB hub may be used to connect several accessories at a time.
Note: USB cables must not be longer than 3 meters (10 feet).
These USB interfaces enable data and graphics to be output to a
Printer and a PC and upgrade of instrument software (see
section 6.8.2 on page 102).
Figure 2 Interfaces
1
USB type A
3
Plug in power supply
2
USB type B
4
On/Off switch
13
Installation
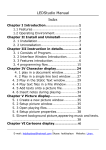
3.5 Cell compartments, cuvette/sample cell adapters, light shield and Adapter Box
3.5.1 Cell compartments and adapters
The DR 3800 has two cell compartments (Figure 3). Only one
cuvette/sample cell type at a time can be used for a measurement.
Cell compartment #1
•
13-mm and 16-mm round cuvettes/vials
Note: Cell compartment #1 contains a barcode reader for
cuvettes/vials.
Cell compartment #2
Cell compartment #2 uses adapters to accommodate different
cuvette/sample cell types.
•
1-inch square or 50-mm rectangular cuvettes/cells (can be
inserted directly into the cell compartment without using an
adapter).
•
Adapter A: 10-mm square cuvettes/cells
•
Adapter B: Pour-Thru cells (refer to the instruction sheet
supplied with the Pour-Thru cell) and multi-path cuvettes/cells
Note: Pour-Thru Cell must be used with Adapter B, not Adapter C.
•
Adapter C: 1-inch round cells and AccuVac® Ampules
Note: 1-inch round cells and AccuVac Ampules must be used with
Adapter C, not Adapter B.
Figure 3 Cell compartments
1
14
Cell compartment #1
2
Cell compartment #2
Installation
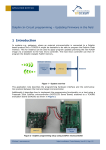
Figure 4 Cuvette/sample cell adapters
1
10-mm square cuvette/sample cell adapter (A)
2
1-inch Pour-Thru and multi-path adapter (B)
3
1-inch round cell adapter (C)
3.5.2 Installation of the cuvette/sample cell adapters
1. Open the cell compartment.
2. Select the correct adapter for the cuvette/sample cell type.
3. Insert the adapter so the arrow on top of the adapter points to
the left (Figure 5 on page 16) and the orientation tab fits the
groove in the compartment opening. The cuvette/sample cell
type imprint should be legible on the adapter (Figure 4).
Note: The arrow on top of the adapter indicates the direction of the light
beam path.
15
Installation
Figure 5 Installation of a cuvette/sample cell adapter
16
Installation
3.5.3 Use of the light shield for measurements
The light shield (Figure 6) prevents light interference when using
13-mm and 16-mm vial tests and must be in place before
measurements can be taken in cell compartment #1. The light
shield is required only when using 13-mm or 16-mm vial tests.
The DR 3800 is shipped with the light shield installed. Remove the
light shield before using cell compartment #2. The light shield can
be stored in the Adapter Box (Figure 8 on page 19).
Figure 6 Light Shield
17
Installation
Installation of the light shield
1. Open the cell compartment.
2. Insert the light shield so the arrow on the light shield points to
the left and the orientation tab fits the groove in the
compartment opening (Figure 7).
Figure 7 Light Shield in place
1
18
Light shield
Installation
3.6 Adapter Box
The inside of the Adapter Box (Figure 8) can be used for the
storage of the three cuvette/sample cell adapters. The
cuvette/sample cell adapter recesses in the Adapter Box are
marked with the corresponding letters and arrows of the adapter.
The arrows indicate the direction of insertion. When a
cuvette/sample cell adapter is in use and removed from the cover,
The light shield can be stored in the Adapter Box.
Figure 8 Adapter Box
1
Adapter Box
2
Adapter Box (inside view)
The inside of the Adapter Box is intended to house the
cuvette/sample cell adapters. The recesses for holding
the cuvette/sample cell adapters are marked with the
corresponding letters.
3
Adapter Box with with inserted cuvette/sample cell
adapter A in position A.
19
Installation
3.7 Beam path
Figure 9 shows the beam path of the DR 3800.
Figure 9 Beam path
1
Tungsten lamp
9
2
Entrance slit
10 Splitter mirror
3
Heat-protection glass
11 Reference-element
4
Grating
12 Cell compartment #2
5
LED
13 Lens
6
Chopper
14 Measurement element
7
Exit slit
15 Cell compartment #1
8
Lens
20
Filter wheel
Section 4
Start Up
4.1 Power the instrument on and off
1. Plug external power supply into an electrical outlet.
2. Turn the instrument on by pressing the power switch on the
back.
Note: Do not turn the instrument off and on in rapid succession. Always
wait about 20 seconds before turning the instrument on again, otherwise
the electronic and mechanical systems will be damaged.
4.2 Language selection
The spectrophotometer software includes several language
options. The first time the instrument is turned on, the language
selection screen will appear.
1. Select the desired language.
2. Press OK to confirm the language selection. The self check will
start automatically.
Changing the language setting
The instrument functions in the selected language until the option is
changed.
1. While turning the instrument on, touch the screen at any point
until the list for selecting a language appears (about
30 seconds).
2. Select the required language.
3. Press OK to confirm. The test program subsequently starts
automatically.
4.3 Self-Check
Each time the instrument is powered up, a series of diagnostic tests
is performed automatically to ensure operation of major system
components.
This procedure, which takes approximately two minutes, checks the
system, lamp, filter adjustment, wavelength calibration and voltage.
Each test that functions correctly is confirmed with a check mark.
The Main Menu is displayed when power up diagnostics are
completed.
Note: Further error messages during self check, see Section 8 on page
121.
21
Start Up
22
Section 5
Standard Operations
5.1 Overview
5.1.1 Tips for the use of the touch screen
The entire screen is touch-activated. To make a selection, press the
screen with a fingernail, fingertip, pencil eraser or a stylus. Do not
press the screen with a sharp object, such as the tip of a ball
point pen.
•
Do not place anything on top of the screen to prevent damage
or scratching on the screen.
•
Press keys, words or icons to select them.
•
Use scroll bars to move up and down long lists very quickly.
Press and hold the scroll bar, then move up or down to move
through the list.
•
Highlight an item from a list by pressing it once. When the item
has been successfully selected, it will be displayed as reversed
text (light text on a dark background).
5.1.2 Use of the alphanumeric keypad
This display is used to enter letters, numbers and symbols as
needed when programming the instrument. Unavailable options are
disabled (grayed out). The icons on the right and left of the screen
are described in Table 1.
The central keypad changes to reflect the chosen entry mode.
Press a key repeatedly until the desired character appears on the
screen. A space can be entered by using the underscore on the
YZ_ key.
Note: A USB keyboard (with US keyboard layout) or a USB Barcode
handset scanner can be used for input (see Section 9 on page 123).
Table 1 Alphanumeric keypad
Icon / key
Description
Function
ABC/abc
Alphabetic
When entering alphabetic characters (ex. user-entered units), this key allows to
toggle between upper and lower case letters.
#%
Symbols
Punctuation, symbols and numerical sub- and superscripts may be entered.
123
Numeric
For entering regular numbers.
CE
Clear Entry
Clear the entry.
Left Arrow
Backspace
Moves back one position. This deletes the character previously entered in the new
position.
Right Arrow
Advance
Moves to the next space in an entry when two adjacent characters occur on the
same key.
23
Standard Operations
5.1.3 Main Menu
A variety of modes may be selected from the Main Menu. The
following table briefly describes each menu option.
Table 2 Main Menu options
Option
Function
Stored Programs /
Barcode Programs
Stored programs are pre-programmed methods that make use of HACH reagents and vial tests.
The DR 3800 Procedures Manual contains illustrated, step-by-step procedures for analyzes
using HACH programs.
User Programs
User programs make "made to measure analysis" possible:
–Users can program methods they have developed themselves
–Existing HACH methods can be stored as user programs.
Favorite Programs
List of methods/tests created by the user to suit his own requirements.
Single Wavelength
Single wavelength measurements are:
Absorbance measurements: The light absorbed by the sample is measured in absorbance
units.
Transmittance measurements (%): The percentage of the light that passes through the sample
and reaches the detector is measured.
Concentration measurements: A concentration factor can be entered to enable the measured
absorbance values to be converted into concentration values.
Multi Wavelength
In the multi-wavelength mode, absorbance (Abs) or percent transmittance (%T) is measured at
up to four wavelengths and absorbance differences and absorbance relationships are calculated.
Simple conversions into concentrations can also be carried out.
Wavelength Scan
A wavelength scan shows how the light from a sample is absorbed over a defined wavelength
spectrum. This function can be used to determine the wavelength at which the maximum
absorbance value can be measured. The absorbance behavior is displayed graphically during
the scan.
Time Course
The time scan records the absorbance or % transmittance at a wavelength over a defined time.
System Checks
The system checks menu offers a number of options, including optical checks, output checks,
lamp history, instrument update, service time and instrument backup.
Recall Data
Stored data can be recalled, filtered, sent and deleted.
Instrument Setup
In this mode, user-specific or method-specific settings can be entered: Operator ID, Sample ID,
Date & Time, Display & Sound, Lamp Control, PC & Printer, Password and Select Color.
24
Standard Operations
5.2 Instrument Setup mode
1. Select Instrument Setup in the "Main Menu".
A selection of functions appears in order to configure the functions
of the instrument.
5.2.1 Operator ID
Use this option to enter up to 30 sets of operator initials (up to five
characters each) into the instrument. This feature helps record
which operator measured each sample.
1. Press Operator ID in the Instrument Setup.
2. Press New to enter a new Operator ID.
3. Use the alphanumeric keypad to enter a new Operator ID.
4. Press OK to confirm.
Select one of the four preset color palettes in the Select Color menu
to assign to the Operator ID.
5. Select a color category to highlight the color for the display
background.
Note: Press Cancel to select the default setting.
6. Press OK to confirm.
25
Standard Operations
7. The display shows the chosen Operator ID.
8. Press OK. The instrument will return to the Instrument Setup
screen and show the selected operator identifier.
9. The chosen Operator ID is activated.
Note: Press Delete to remove an Operator ID from the list.
Note: Alternatively, enter or change an Operator ID in measurement mode.
In the results screen, press Options>More>Instrument Setup or if an
Operator ID is already assigned, select the Operator ID symbol
immediately in the results screen.
5.2.2 Sample ID
Use this option to enter up to 100 Sample Identification tags (up to
13 characters each) into the instrument. Sample IDs can be used to
specify the sample location or other sample specific information.
1. Press Sample ID in the Instrument Setup.
2. Press New to enter a new Sample ID.
3. Use the alphanumeric keypad to enter a new Sample ID.
Note: If a USB Barcode handset scanner (see Section 9 on page 123)
is connected, Sample IDs can also be scanned. Sample IDs can also
be entered with a USB keyboard.
4. Press OK to confirm.
26
Standard Operations
5. To number the Sample IDs sequentially (e.g. Inflow (01 etc.)),
select Add Number.
•
Use the arrow keys to specify the first number of the
sequence.
•
Use the key between the arrow keys to enter the first
number of the sequence using the alphanumeric keypad.
6. Press OK to return to "Instrument Setup".
7. The Sample ID is activated. Each Sample ID is automatically
numbered in ascending order after a measurement. The
number is shown in parentheses behind the Sample ID.
Note: To remove a Sample ID, highlight the ID and press Delete.
Note: A Sample ID can be entered or changed in measurement mode. In
the results screen, press Options>More>Instrument Setup. If a Sample
ID is already assigned, select the Sample ID symbol in the results screen.
5.2.3 Date and time
1. Press Date & Time in the Instrument Setup.
2. The date and time are subdivided over a number of fields.
Press the appropriate field and use the arrow keys to change
the value.
3. Press OK to confirm. The instrument will return to
Instrument Setup.
27
Standard Operations
5.2.4 Display and sound preferences
1. Press Display & Sound in the Instrument Setup.
The following options will be displayed:
•
Display Brightness—Adjusts the display brightness to suit
lighting conditions.
•
Screen touch—Activates//Deactivates a short beep each time
the screen is pressed (Default:off).
•
Reading done—Activates/Deactivates a sound when a
reading is complete (Default: short beep every time a reading is
complete).
•
Timer—Adjusts the length of the timer sound. Select Short or
Long. Long beeps are recommended for noisy environments.
2. Select Long to change the number of audio signals.
Use the alphanumeric keypad to enter/specify the number of
audio signals (4–25).
Note: A high number of audio signals increases the duration of the
tones and a small number of audio signals reduces the duration of the
tones.
3. Press OK to confirm. The selected number of the audio signals
sounds as a corresponding acoustic signal.
4. Press OK to confirm. The instrument will return to
Instrument Setup.
28
Standard Operations
5.2.5 Lamp control
The tungsten lamp produces light in the wavelength spectrum
320 to 1100 nm.
The life span of the halogen lamp depends on the burning duration.
In order to extend the life span of the lamp, switch on the Lamp
control:
•
If the instrument is not used during a longer period
(1–12 hours).
•
If the instrument will never be switched off.
1. Press Lamp Control in the Instrument Setup.
2. Select On to switch on the Lamp.
3. Select Save: in order to define a time interval for the burning
time of the lamp.
4. Press the field below Save to select the lamp burning time.
5. Select the length of time the lamp will be switched on.
Note: After this period of time the lamp will automatically turn off after
no measurement has been made.
Note: The lamp will be restarted automatically for measurements.
6. Press OK to confirm.
29
Standard Operations
5.2.6 PC and printer
The instrument is provided with 2 USB interfaces, which are located
on the back of the instrument (see Figure 2 on page 13). These
interfaces can be used for exporting data and graphics to a printer,
updating data and for data communication to a personal computer.
These interfaces can be used for the connection of a USB stick, an
external USB keyboard or a USB Barcode handset scanner.
Note: A USB hub may be used to connect several accessories at a time.
A USB memory stick is used to upgrade data and software (see
section 6.8.2 on page 102).
Important Note: A screened USB cable must not be longer than
3 m!
Table 3 USB connector
USB Interfaces
Description
USB (Type B)
This USB interface is only intended for the connection DR 3800 - PC (with installation of the
HACH Data Trans Software).
USB (Type A)
This USB port can be used to connect a printer, a USB memory stick, a barcode scanner or
a keyboard.
1. Press PC & Printer in the Instrument Setup.
A list with information about the connections opens.
5.2.6.1 Printer setup
For reasons of compatibility, the printer language must be
HP PCL 3.
2. Press Printer.
3. Press Setup to display the Printer Setup screen.
30
Standard Operations
Printer Setup:
•
Resolution: Print quality
•
Paper: Paper size
Note: If an optional Thermal Printer is connected, the function "Auto Send"
on/off is available.
4. Select Auto-Send: On to send all measured data automatically
to the Thermal printer.
Note: The option Auto-Send is not available for any other printer (e.g. ink
jet printer).
5. Press Resolution to select the print quality.
Select between
•
100 dpi
•
150 dpi and
•
300 dpi
6. Press OK to confirm.
Note: Press OK again to return to the PC & Printer menu.
31
Standard Operations
7. Press Paper to select the paper size.
Select between
•
Letter
•
Legal
•
Executive
•
A4
8. Press OK to confirm.
Note: Press OK again to return to the PC & Printer menu.
5.2.6.2 Print data
1. Press Recall Data in the Main Menu.
2. Select the data source, where the data to be printed are stored.
3. A list is displayed. Data can be filtered. For more information
see section 5.3.1.2 on page 36.
4. Press the Printer icon to send the data (table, curve)
immediately to the printer.
5. Highlight Single point or Filtered data or All data and press
OK to confirm.
Sending Data... is displayed until the data have been printed.
5.2.6.3 HACH Data Trans
The optional HACH Data Trans software must be installed on the
PC for the subsequent to process for measurement data.
1. Press PC & Printer in the Instrument Setup.
2. Select PC.
3. Press Setup to display the PC Setup screen.
For further installation instructions, refer to the HACH Data
Trans user manual.
32
Standard Operations
4. Select Auto-Send: On to send all measured data automatically
to the PC.
Note: If Auto-Send: Off is selected, the PC & Printer icon must be
pressed, in order to send data to the PC.
Note: The remote function is only for monitoring the data transfer.
5.2.6.4 Help Guide
The Help Guide is a step-by-step guide for the DR 3800 to
complete a test/method in accordance with the working procedure.
The Help Guide is an accessory available on a USB memory stick.
The Help Guide is available for the most used Hach tests.
Note: For more information about available tests/methods, refer to the
documentation supplied with the Help Guide.
5.2.7 Password
The Password menu contains a variety of security settings to
control access to various functions. For example, prevent
unauthorized changes to stored programs or instrument
configurations.
1. Press Password in the Instrument Setup menu.
2. In order to highlight the Security List assign a password. Press
Set Password.
33
Standard Operations
3. Use the alphanumeric keypad to enter a new Password (up to
10 characters each) and press OK to confirm.
The access to the Security List is activated.
4. Press Security List to lock various functions for unauthorized
users.
5. Highlight the desired functions to control.
6. Confirm the Security List with OK to return to the Password
menu.
7. Press On to highlight the new settings of the Security List.
8. Enter the new Password again to confirm.
9. Press OK to return to Instrument Setup.
Note: The alphanumeric keypad to the Password inquiry appears when a
user tries to reach a locked setting.
34
Standard Operations
5.2.7.1 Password deactivation
1. Press Password in the Instrument Setup.
2. Use the alphanumeric keypad to enter the former Password
and press OK to confirm.
3. Press Off to deactivate the settings of the Security List.
4. Press OK to return to Instrument Setup.
Note: Use this function to delete the former Password or to enter a new
one.
5.2.8 Select color
Select one of the four preset color palettes in the Select Color
menu.
1. Press Select color in the Instrument Setup.
A color chart list will appear.
2. Select a color category to highlight the color for the display
background.
3. Press OK to return to Instrument Setup.
35
Standard Operations
5.3 Store, recall, send and delete data
5.3.1 The data log
The data log will store up to 1000 readings taken in the modes:
Stored Programs, Barcode Programs, User Programs, Favorite
Programs, Single Wavelength and Multi Wavelength. A complete
record of the analysis is stored, including the Date, Time, Results,
Sample ID and Operator ID.
5.3.1.1 Auto/manual data storage
The data storage parameter indicates whether data are to be stored
automatically or manually (in which case the user has to decide
which data to store).
1. Press Store: On/Off in the Options menu.
•
With the Store On setting, all measurement data are stored
automatically.
•
With the Store Off setting, no measurement data are
stored. However, this setting can be changed to Store On
in the result display through configuration. The reading
currently shown in the display is then stored.
Note: When the instrument's memory (data log) is full, the oldest data are
automatically deleted allowing the new data to be stored.
5.3.1.2 Recall stored data from the data log
1. Press Recall Data in the Main Menu.
2. Press Data Log.
A listing of the stored data is displayed.
3. Press Filter: On/Off.
36
Standard Operations
4. The function Filter Settings is used to search for specific
items.
5. Highlight On to turn on the filters to select data by
•
Sample ID
•
Operator ID
•
Start Date
•
Parameter
or any combination of the four.
6. Press OK to confirm the selection. The chosen items are listed.
7. Press View Details to get more information.
5.3.1.3 Send data from the data log
Data are sent from the data log as CSV (Comma Separated
Value) files through a USB memory stick to a file named
DATALOG. The file can then be processed using a spreadsheet
program. The file name will be formatted as:
DLYear_Month_Day_Hour_Minute_Second. CSV.
To send data to a Printer, see section 5.2.6.2 on page 32.
1. Plug in the USB device (Figure 2 on page 13).
2. Press Recall Data from the Main Menu. Press Options and
then the PC & Printer icon.
3. Select the data to send to the memory stick and press OK.
Note: The number in parenthesis is the total number of data sets
assigned to this selection.
To send measurement data to a PC:
The optional HACH Data Trans software must be installed on the
PC (see section 5.2.6.3 on page 32).
37
Standard Operations
5.3.1.4 Delete stored data from the data log
1. Press Recall Data in the Main Menu.
2. Press Data Log>Options>Delete.
3. Highlight Single Point or Filtered data or All data and press
OK to confirm.
Note: The number in parentheses is the total number of data sets
assigned to this selection.
5.3.2 Store, recall, send and delete data from wavelength scan and time course
The instrument can store 20 Wavelength Scans and 20 Time
Course Data sets.The data can be stored manually at the user's
discretion after viewing the data.
5.3.2.1 Data storage from wavelength scan or time course
1. Press the Store icon in the Options menu after a reading is
taken.
The Store Data list will be displayed.
2. Press Store to save the current scan to the highlighted
numbered line. A scan can also be overwritten.
38
Standard Operations
5.3.2.2 Recall stored data from wavelength scan or time course
1. Press Recall Data in the Main Menu.
a. Select Wavelength Scan or Time Course to recall data.
b. If a program is already in progress, press
Options>More>Recall Data.
2. Press Graph to look at details.
Note: Press View Summary to return to the Recall Data list.
3. Press Table to look at details.
Note: Press View Summary to return to the Recall Data list.
39
Standard Operations
5.3.2.3 Send data from wavelength scan or time course
Option1:
1. Press Recall Data in the Main Menu and then Wavelength
Scan or Time Course.
2. Press Options and then the PC & Printer icon to send the data
to a USB memory stick, to a printer or to a PC with Hach Data
Trans.
•
When a printer is connected, select how to send the data to
the printer (graph, table or both graph and table).
•
When a USB memory stick is connected, the files will be
automatically sent as CSV files (Comma Separated Value)
to a file ”WLData“ (Wavelength Scan Data) or ”TCData“
(Time Course Data) to the USB memory stick.
The file name will be formatted as: ”ScanData_X.csv“
(Wavelength Scan Data) or ”TCData_X.csv” (Time Course
Data).
X = number of scans (1–20)
For further processing use a spreadsheet program.
Note: The advice ”Data already exist. Overwrite?“ appears when the files
were already stored. Press OK to overwrite the stored data.
Option 2:
1. Press Wavelength Scan or Time Course and then
Options>More>Send Data to send the data to a USB memory
stick or to a printer.
•
When a printer is connected, select how to send the data to
the printer (graph, table or both graph and table).
•
When a USB memory stick is connected, the files will be
automatically sent as CSV files (Comma Separated Value)
to a file ”WLData“ (Wavelength Scan Data) or ”TCData“
(Time Course Data).
The file name will be formatted as:
”ScanData_Year_Month_Day_Hour_Minute_Second.CSV“
(Wavelength Scan Data) or
The file name will be formatted as:
”TCYear_Month_Day_Hour_Minute_Second.CSV“ (Time
Course Data).
40
Standard Operations
For further processing use a spreadsheet program.
5.3.2.4 Delete stored data from wavelength scan or time course
1. Press Recall Data from the Main Menu and then Wavelength
Scan or Time Course or Options>More>Recall Data.
A listing of the stored data is displayed.
2. Highlight any data to delete.
3. Press Delete in the Options menu and press OK to confirm.
41
Standard Operations
5.4 Stored Programs
The instrument contains more than 200 programmed procedures.
Most can be accessed through the Stored Programs menu.
5.4.1 Select a saved test/method; entering user-specific basic data
1. Press Stored Programs in the Main Menu to view an
alphabetical list of stored programs with program numbers.
The Stored Programs list will appear.
2. Highlight the required test.
Note: Select the program number by name or use the arrow keys to
scroll through the list quickly and highlight the program or press
Select by Number to search for a specific program number. Use the
alphanumeric keypad to enter the test number and press OK.
3. Press Start to run the program. After a program is selected, the
screen for that parameter will appear.
Note: All corresponding data (wavelength, factors and constants) are
already preset.
4. Follow the chemical procedures described in the corresponding
Procedures Manual.
5.4.2 Stored program options
1. From the Main Menu, select Stored Programs. Select the
necessary method and press Start.
2. Press Options for Parameter Setup. Refer to Table 4 on page
43 for stored program descriptions.
42
Standard Operations
Table 4 Stored programs options
Options
Description
More
For further Options
Store Off/On
With the Store On setting, all measurement data are stored automatically. With the Store Off
setting, no measurement data are stored.
% Trans/Conc/Abs
To switch to % transmittance, concentration or absorbance readings
Send Data icon /
Send Data
To send data to a printer, computer or USB memory stick (Type A)
Information icon
The Help Guide is an accessory available on a USB memory stick (see section 5.2.6.4 on
page 33).
Timer icon
This functions as a stopwatch. It helps to ensure that the steps of an analysis are correctly timed
(e.g. reaction times, wait times, etc., can be exactly specified). When the specified time has
elapsed, an acoustic signal is emitted. The use of the timer has no influence on the measurement
program.
Reading Mode
Single Reading Mode: A reading is only displayed after a measurement has been carried out
(press Read; standard setting) (see section 5.4.4.1 on page 45).
Continuous Reading Mode: After the zero measurement, all readings are displayed
automatically and continuously (see section 5.4.4.2 on page 45).
Dilution Factor Off/On
A corrective dilution factor can be entered in order to take account of certain properties.
The number entered at the dilution factor prompt will be multiplied by the result to compensate for
the adjustment. For example, if the sample has been diluted by a factor of 2, enter 2. The default
setting of the dilution factor is turned off.
Note: When a dilution is in effect, the dilution icon will appear on the display.
Standard Addition
This enables the accuracy of the measurements to be checked. The (working) procedure for a
test parameter contains a detailed explanation of how to use this function.
Standard Adjust
The (working) procedure for a test parameter indicates whether a standard adjustment is
necessary and, if so, how to proceed.
Chemical Form
Some of the stored tests/methods allow to select the chemical form and the measuring range.
Reagent Blank
Some of the stored tests/methods include the "Reagent Blank" function. This enables the reagent
blank value to be added to or subtracted from the subsequent readings. The reagent blank value
shifts the calibration curve along the y-axis, without changing the shape or gradient of the curve.
The effect corresponds to a y-axis intercept of the calibration straight line. This is made clear by
the following equation: Concentration = [(Conc. factor) * Abs] – (reagent blank value).
Save as User Program
To store the selected parameters as a User Program.
Recall Data
Call up saved measurement data, wavelength scans or time courses, (see section 5.3 on page 36).
Instrument Setup
Basic data of the instrument, (see section 5.2 on page 25).
43
Standard Operations
5.4.3 Use of program timers
Some procedures do not require the use of timers. Other
procedures require several timers. These timers are
pre-programmed into each Stored Program, along with a
description of the activity to be performed during the timed period.
1. Press the Timer icon on the display.
2. Press OK to start the first timer.
The timer will count down on the screen.
3. To start the next timed activity for the Stored Program, press
the Timer icon and OK.
Note: Press Close to view the measurement screen while the timer is
running. The time will be shown left side bottom instead of the date.
Note: Press Cancel to stop the timer midway through the countdown.
Note: The Timer will beep when the end of the running time is
reached.
A general purpose timer is also available in many programs. When
the timer icon is visible, press the icon and select General Timer.
A new screen will appear. Enter the length of the timed interval and
press OK to start the timer. The timer will beep when the timed
interval ends.
44
Standard Operations
5.4.4 Set the reading mode
1. To highlight the required mode, press Reading Mode.
2. Select the required mode, then press OK, then Return to return
to the result display.
5.4.4.1 Take single wavelength measurements (single reading)
1. Insert the blank cuvette/sample cell into the cuvette/sample cell
holder. Press Zero.
Note: The Read key is only active after the zero measurement has
been carried out.
2. Insert the sample cuvette/cell into the cuvette/sample cell
holder. Press Read.
Note: For data storage, see section 5.3.1 on page 36.
5.4.4.2 Take single wavelength measurements (continuous readings)
1. Insert the blank cuvette/cell into the cuvette/sample cell holder.
Press Zero.
Note: In the reading mode ”Continuous“ only the Zero key is shown to
start the reading. The reading sequence is started automatically.
2. Insert the sample cuvette/cell into the cuvette/sample cell
holder.
3. Press Options and then the Store icon to store the displayed
data in the Data Log.
Note: For data storage, see section 5.3.1 on page 36.
45
Standard Operations
5.4.5 Set the dilution factor
The Dilution Factor function is used to calculate the original
concentration of a sample that has been diluted by a known ratio.
For example, dilution factor can bring the analyzed concentration
within the test range.
1. Press Options>More…>Dilution Factor.
The number entered at the dilution factor prompt will be
multiplied by the result to compensate for the adjustment.
For example, if the sample has been diluted by a factor of 2,
enter 2. The default setting of the dilution factor is turned off.
2. Press OK to confirm. Press again OK.
3. Press Return to return to the result display.
4. Confirm ’Store present reading again?’ to save the current
measured value if necessary.
Note: When a dilution is in effect, the dilution icon will appear on the
display.
Note: If using undiluted samples, set the dilution factor off again.
46
Standard Operations
5.4.6 Run a standard adjust
The Standard Adjust function allows the calibration curve for a
stored program to be adjusted based on analysis of a known
standard solution. The Accuracy Check section of written
procedures often suggests a standard solution concentration for
this purpose.
Read a standard before setting Standard Adjust to On.
1. Follow the entire procedure, using a known standard for the
sample.
2. After reading the concentration, press
Options>More>Standard Adjust.
3. If Standard Adjust is set to Off, turn it On.
The Current Reading will show the concentration. The box on
the right will show the default standard value for the test, as
mentioned in the procedure.
4. If the measurement used a standard concentration that is
different from the one displayed in the box, press the box on the
right to enter a different standard value and enter the new
value. Press OK to confirm.
5. Press Adjust to enable the Standard Adjust. The Standard
Adjust icon will appear.
Note: The adjustment must be within certain limits, which vary with
each program. The allowable percentage is shown after "Adjustment“.
Note: When a Standard Adjust is in effect, the Standard Adjust icon
will appear on the display.
5.4.7 Set the chemical form
Some Stored Programs allow a variety of chemical forms to
be selected.
Press the unit (e.g. mg/L) or the chemical representation of the
evaluation form (e.g. Al3+). A list of available evaluation forms is
displayed. Select the required form by pressing the corresponding
entry in the list.
Note: To exit from the program, the evaluation form reverts to the standard
setting.
An alternative way of changing the standard setting:
47
Standard Operations
1. Press Options>More>Chemical Form.
2. Select the Chemical Form.
Note: The stoichiometric conversion of the measurement result is
carried out automatically.
Note: The selected Chemical Form will appear on the display. Test
results will be calculated and displayed in this chemical form
5.4.7.1 Change of the default setting of the chemical form
1. Insert the sample cuvette/cell or blank (depending on the
working procedure) into the cell compartment.
2. In the result display, press Options>More>Chemical Form.
3. A list of available evaluation forms appears. Select the new
default setting.
4. Press Save as Default.
The current result and all further measurements will be displayed in
the new chemical form.
5.4.8 Run a reagent blank
Some of the stored tests/methods include the "Reagent Blank"
function. This enables the reagent blank value to be measured and
then taken into account in calculating the measurement result.
Measurement/analysis of a reagent blank:
1. Prepare the test/method in accordance with the (working)
procedure. Instead of a sample, deionized water is used to
determine the reagent blank value.
2. Select the test. If required by the (working) procedure, insert
the cell with deionized water into the cell compartment. Press
Zero.
3. Insert the prepared sample cuvette/cell into the cell
compartment. Press Read. The result is displayed.
48
Standard Operations
4. Press Options>More>Reagent Blank.
5. Press On to highlight the Reagent Blank function.
6. The concentration shown on the key is the measured value of
the reagent blank. To use this value for more analyses of this
parameter, press OK.
7. If the measurement does not need to be saved, press the key
and use the alphanumeric keypad to enter a previously
recorded reagent blank value.
8. Press OK.
Note: The Reagent Blank function is deactivated when the measurement
program is left. To use the same blank value later for other tests using the
same reagent lot, enter the value per step 7.
Note: The results calculated using the reagent blank value must lie within
the limits of the measuring range of the test/method.
Note: The reagent blank icon is shown in the result display (see arrow)
when the function is active.
5.4.9 Analysis of samples
1. Press Stored Programs and select a program.
2. Insert the blank cuvette into the cuvette/sample cell holder.
3. Press Zero.
49
Standard Operations
4. Remove zero solution and insert sample cuvette/cell into the
cell compartment.
5. Press Read. The result will be displayed.
6. For data storage, see section 5.3.1 on page 36.
5.4.10 Add stored programs to the favorite programs list
The Favorites menu simplifies test selection by creating a list of the
most frequently used tests from the Stored Programs and
User Programs.
1. Press Stored Programs in the Main Menu. The Stored
Programs list will appear.
2. Highlight the selection by pressing it or Select by Number to
search for the program by number.
3. Press Add to Favorites and press OK to confirm.
The program can now be selected from Favorite Programs
menu in the Main Menu.
50
Standard Operations
5.5 Barcode Programs
A special barcode reader in cell compartment #1 automatically
reads the barcode on the 13-mm cuvette/vial as the cuvette/vial
completes a single rotation. The instrument uses the barcode
identification to automatically set the correct wavelength for the
analysis and calculates the result immediately with the help of the
stored factors.
In addition, measured values are recorded at 10 different positions
during a rotation. A special outlier-elimination program is run and
then the average of the measured values is calculated. Cuvette/vial
errors and soiling are recognized and highly precise results are
obtained.
Figure 10 Cell compartment #1 for barcode 13-mm/ 16-mm cuvettes/vials
51
Standard Operations
5.5.1 Complete a barcode 13 mm test/vial
1. Insert the light shield in cell compartment #2.
2. Prepare the barcode 13-mm cuvette/vial in accordance with the
working procedure and insert the cuvette/vial in cell
compartment #1.
•
When a coded cuvette/sample vial is placed in cell
compartment #1 (Figure 10), the corresponding
measurement program is automatically activated in the
Main Menu.
•
Otherwise, press Barcode Programs in the Main Menu.
and insert the blank or sample cuvette/vial (depending on
the working procedure) in cell compartment #1.
The measurement is started automatically and the results are
displayed.
To evaluate other cuvette/vial tests and other parameters, insert the
prepared cuvette/vial into the cell compartment and read the result.
Note: The control bar displayed on the right of the screen shows the
relationship of the measurement result to the measuring range. The black
bar shows the measured result independently of any dilution factor that
was entered.
52
Standard Operations
5.5.2 Select the measuring range
Some tests can be used for different measuring ranges. After the
sample cuvette/vial has been inserted, a list of the different
measuring ranges is displayed.
Select the required measuring range by highlighting the appropriate
line.
Press Start Permanent if this measuring range is to apply to all
subsequent measurements.
Changing the standard setting
In the result display, press Options>More>Permanent: On. The
key will change to Permanent: Off.
5.5.3 Select the chemical evaluation form
The chemical form of the test result of a number of parameters can
be selected individually.
In the result display, press the unit (e.g. mg/L) or the chemical
representation of the evaluation form (e.g. PO43––P). A list of
possible evaluation forms is displayed, from which the required
form can be selected. Press OK to confirm.
Another way of changing the standard setting is:
1. In the result display, press Options>More>Chemical Form.
A list of available evaluation forms appears.
2. Select the required chemical form and press OK to confirm.
Note: The selected chemical form is displayed, but does not become
the default. To change the default, see section 5.5.3.1.
5.5.3.1 Change of the default setting of the chemical form
1. Insert the blank or sample cuvette/vial (depending on the
working procedure) into the cell compartment.
2. In the result display, press Options>More>Chemical Form.
3. A list of available evaluation forms appear. Select the new
default setting.
4. Press Save as Default.
The current result and all further measurements will be displayed in
the new chemical form.
53
Standard Operations
5.5.4 Basic test-specific and sample-specific data settings
Press Options to change test or sample-specific settings.
Table 5 Barcode program options
Options
Description
More
For further Options
Store Off/On
With the Store On setting, all measurement data are stored automatically. With the Store Off
setting, no measurement data are stored.
Abs % Trans
To switch to % transmittance or absorbance readings
Send Data icon /
Send Data
To send data to a printer, computer or USB memory stick (Type A)
Timer icon
This functions as a stopwatch. It helps to ensure that the steps of an analysis are correctly timed
(e.g. reaction times, wait times, etc., can be exactly specified). When the specified time has
elapsed, an acoustic signal is emitted. The use of the timer has no influence on the measurement
program.
Information icon
The Help Guide is an accessory available on a USB memory stick (see 5.2.6.4 on page 33).
Dilution Factor Off/On
A corrective dilution factor can be entered in order to take account of certain properties.
The number entered at the dilution factor prompt will be multiplied by the result to compensate for
the adjustment. For example, if the sample has been diluted by a factor of 2, enter 2. The default
setting of the dilution factor is turned off.
Note: When a dilution is in effect, the dilution icon will appear on the display.
Note: If undiluted samples are used, set the dilution factor off.
Chemical Form
Some of the stored tests/methods allow to select the chemical form and the measuring range.
Edit
To modify an existing program
Save as User Program
To store the selected parameters as a User Program
Recall Data
Call up saved measurement data, wavelength scans or time courses (see section 5.3 on
page 36).
Instrument Setup
Basic data of the instrument (see section 5.2 on page 25).
54
Standard Operations
5.5.5 Sample blank
Turbidity and color in the sample matrix can falsify the results of a
photometric analysis. The interference factors come from the
sample or are created by reactions with the reagents.
The influence of turbidity and/or color can be eliminated or reduced
by taking a sample blank reading.
In the barcode mode, a special cuvette/vial (TNT 919) containing
the sample blank is placed in cell compartment #1 after the sample
reading has been taken and is automatically measured. The
sample reading is then corrected by adding or subtracting the blank
value. The final result is displayed, with the message "After blank
value corr.".
Some barcode tests do not require a sample blank value to be
determined, as turbidity and color are dealt with during the test
procedure.
5.5.6 Update of a barcode test
Using the data provided in the barcode, the instrument
automatically sets the measurement wavelength and factors. If a
discrepancy is detected between the barcode data and the stored
data or a new test is identified, the instrument requests an update
(see section 5.5.7).
55
Standard Operations
5.5.7 Upgrade of the instrument software
To obtain the software for the update from the Internet at
www.hach.com:
1. Go to http://www.hach.com.
2. On the DR 3800 product page, click Lab System
Software/Software Update Downloads under Downloads.
3. Locate the appropriate download and follow the prompts for
saving the file(s) to the USB memory stick.
4. On the DR 3800, press Instrument Update in the System
Checks menu.
5. Connect the USB stick to the USB interface on the DR 3800,
(see section 3.4 on page 13). Press OK. The link is established
automatically and the software is updated.
6. Press OK to return to the System Checks menu.
Note: When the instrument software has been updated, a prompt to restart
the instrument is displayed.
56
Section 6
Advanced Operations
6.1 User Programs
User programs provide the opportunity to complete "made to
measure" analysis.
The User Programs database is empty when the instrument leaves
the factory and is used to accommodate programs created by
users' specific needs. Here are a few examples of entries:
•
Programming of user-created procedures. The analysis
procedure must be developed first, before it can be
programmed. The user must define or determine the program
sequences, calculation formulas, measurement wavelengths,
factors, measuring range limits, etc.
•
Modified tests
•
Assignment of user programs to the favorites menu for
frequently used tests.
•
Creation of a specific selection of methods and tests.
Press User Programs in the Main Menu and then
Program Options. The Program Options menu contains several
input and editing options (Table 6):
Table 6 Program options user programs
Options
Description
New
Select New to program a new user program.
Note: The first time Program Options is selected, only the New option is available. The other
options remain inactive (grey) until the first program has been created.
Add to favorites
Select Add to favorites to add an existing user program to the list of frequently used programs.
Edit
Select Edit to modify an existing program.
Delete
Select Delete to remove a program from the list of user programs. The program will be
simultaneously deleted from the Favorites list.
6.1.1 Program a user method
All input steps and their significance and options are explained in
the following sections.
1. Select New in the Program Options menu.
57
Advanced Operations
Program Number:
Specific test number with which the program can subsequently be
called up from the selection list in the User Programs menu or the
Favorites menu.
2. Use the alphanumeric keypad to enter a program number
between 950 and 999. The lowest available number appears
automatically.
3. Press OK.
Note: If the program number is already assigned to another user
program, a message appears, asking whether the existing program
should be replaced. Press OK to overwrite the existing program.
Program Name:
4. Use the alphanumeric keypad to enter a program name. The
name can be a maximum of 28 characters long.
5. Press Back to go back to the previous program point or press
Next to continue with the input of the program data.
Program Type:
6. Select the required option (Table 7) and press Next.
7. If the Single Wavelength (section 6.1.1.1 on page 59) or Multi
Wavelength (section 6.1.1.2 on page 60) is selected, define the
units, wavelength, absorbance formula, wavelength λx,
concentration factor Kx, concentration resolution, chemical
form and calibration equation.
More information on Free Programming parameters see
section 6.1.2 on page 68.
Table 7 Program descriptions
Program Type
Description
Single Wavelength
Measurements at a defined wavelength
Multi Wavelength
In the Multi Wavelength mode, absorbance values can be measured at up to four wavelengths
and the results can be mathematically processed to obtain sums, differences and relationships.
Free Programming
This is an advanced form of programming for original user-developed methods. In Free
Programming, the user defines the measurement process, variables and calculations involved in
obtaining a reading.
58
Advanced Operations
6.1.1.1 Single wavelength settings
If the Single Wavelength mode is selected, the following
parameters can be defined:
Units:
Select the required units from the list and press Next.
Note: Units of measure not included in this list can be added in the edit
program under Program Options, Edit. Select Units, Edit and then New.
Wavelength (single wavelength program type):
Use the alphanumeric keypad to enter the measurement
wavelength. The entered wavelength must be in the range from
320–1100 nm.
Press Next to proceed.
Concentration resolution (number of decimal places)
Select the required number of decimal places from the displayed
list and press Next.
59
Advanced Operations
Chemical form:
Enter the chemical formula used in the display to represent the
analysis parameter.
Use the alphanumeric keypad to enter the chemical form and press
Next to enter Calibration settings.
6.1.1.2 Multi wavelength settings
If the Multi Wavelength mode is selected, the following parameters
can be defined:
Units:
Select the required units from the list and press Next.
Note: Units of measure not included in this list can be added in the edit
program under Program Options, Edit. Select Units, Edit and then New.
Absorbance formula (multi-wavelength program type):
The Absorbance Formula menu is used to define the wavelengths
and the coefficients used in the formula. The absorbance formula
defines the calculation for the multi-wavelength measurement.
Press the appropriate key to edit the input.
Press the Formula key.
In the displayed list, select the formula for the program and press
OK to confirm.
60
Advanced Operations
List of available absorbance formulas
A1 is the absorbance at wavelength 1,
A2 is the absorbance at wavelength 2 and so on
K1 is the factor at wavelength 1,
K2 is the factor at wavelength 2 and so on
If a subtraction has to be completed, the factors can be entered
with a minus sign.
Wavelength λx:
Press a λx key and use the alphanumeric keypad to enter a
wavelength. Press another λx key and enter the next wavelength. If
necessary, repeat until all the wavelengths for the formula have
been entered. The wavelengths must be in the range from
320–1100 nm. Press OK.
Concentration Factor Kx
Multiplication factor for converting absorbance values into
concentration values.
Press a factor key and use the alphanumeric keypad to enter a
factor. If the formula includes more than one factor, press another
factor key and enter another factor and repeat until all the factors
have been entered. Press OK. When all the relevant data have
been entered, press Next.
Note: Up to five digits can be entered, including a maximum of 4 decimal
places to the right of the decimal.
Concentration resolution (number of decimal places)
Select the required number of decimal places from the displayed
list and press Next.
61
Advanced Operations
Chemical form:
Enter the chemical formula used in the display to represent the
analysis parameter.
Use the alphanumeric keypad to enter the chemical form and press
Next to enter Calibration settings.
6.1.1.3 Calibration settings for single and multi wavelength mode
A method is calibrated by determining the absorbance values of
several standard solutions of known concentration.
There are three ways to create and store a calibration curve.
Instructions for each method follows (Table 8).
Table 8 Calibration settings
Mode
Descriptions
Enter values
A calibration table is created by entering the concentration values and the absorbance values of
the analyte solutions. The absorbance values are plotted versus standard concentrations and the
calibration curve is displayed as a graph (page 62).
Read Standards
A calibration table is created by entering the concentration values of the standard solutions and
then measuring the absorbance of the analyte solutions. The absorbance values are plotted
versus standard concentrations and the calibration curve is displayed as a graph (page 64).
Enter Formula
If the calibration curve can be determined from the mathematical relationship between
concentration and absorbance by linear regression, etc., the corresponding formula can be
selected (linear, 2nd or 3rd order polynomial) from a list and the appropriate factors can be
entered (page 65).
Calibration by entering calibration values
Entering concentration/absorbance
1. Select the Enter Values and press Next.
62
Advanced Operations
2. To enter the standard concentrations and corresponding
absorbance values in the displayed table, press the "+" symbol.
Use the alphanumeric keypad to enter the value.
Press OK and enter the corresponding absorbance value.
Press OK.
The entered data are displayed in the table. Repeat the
sequence for each data point to enter it.
3. To change a value in the table, highlight the appropriate line,
press the unit key (e.g. mg/L) or Abs and enter the changed
value via the alphanumeric keypad.
4. When the data have all been entered, press Graph.
Note: The correlation coefficient (r2) is shown on the left below the
axes.
5. The linear equation corresponds to the standard setting. Press
Next Curve to display the polynomial 2nd order curve. Press
Next Curve again, to display the polynomial 3rd order curve.
6. Press Force 0 to change the setting from Off to On. The curve
now passes through the origin of the coordinate system.
Note: This may have an adverse effect on the correlation coefficient
(r2).
7. Press Table to display the table again.
8. When the table has been completed and the curve type has
been chosen, press Done when the graph is displayed or Exit
when the table is displayed. Go to section 6.1.1.4 on page 66.
63
Advanced Operations
Calibration by reading standards
1. Press Read Standards and press Next.
2. To enter the standard concentrations in the displayed table,
press the "+" symbol. Use the alphanumeric keypad to enter
the standard concentration. Press OK.
3. Press the "+" symbol again (see arrow) and enter the next
standard concentration. Repeat this sequence until all standard
conentrations (maximum of 24 solutions) have been entered.
4. Highlight the line with the appropriate concentration and insert
the cuvette/cell with the corresponding standard solution.
5. Insert the zero solution into the cell compartment. Press Zero.
6. Insert the first standard solution into the cell compartment.
Press Read.
Insert the second standard solution into the cell compartment.
Press Read.
Repeat this sequence until all the standard solutions have been
measured (maximum of 24 solutions).
The entered and measured data are displayed in the table.
Note: To delete a standard concentration, highlight the appropriate line and
press the Delete icon.
The timer icon shown in the display helps to ensure, when
necessary, that the steps of an analysis are correctly timed (e.g.
reaction times, wait times, etc., can be exactly specified). When the
specified time has elapsed, an acoustic signal is emitted. The use
of the timer has no influence on the measurement program.
7. When the data have all been entered and the measurements
have all been completed, press Graph.
8. The linear curve corresponds to the standard setting. Press
Next Curve to display the polynomial 2nd order curve.Press
Next Curve again to display the polynomial 3rd order curve.
64
Advanced Operations
9. Press Force 0 to change the setting from Off to On. The curve
then passes through the origin of the coordinate system.
Note: This may have an adverse effect on the correlation coefficient
(r2).
10. Press Table to display the table again.
11. When the table has been completed and the curve type has
been chosen, press Done when the graph is displayed or Exit
when the table is displayed. Go to section 6.1.1.4 on page 66.
Calibration by entering the formula
1. Press Enter Formula and press Next.
2. Press the formula key.
A list of available formulas (linear and 2nd and 3rd order
polynomial) is displayed. Up to 4 coefficients can be entered,
depending on the selected formula. Press the required formula.
3. Depending on the selected formula, the required coefficients
(a, b, c...) are displayed. Press the coefficient keys and enter
the corresponding values via the alphanumeric keypad. After
each entry, press OK to confirm.
Note: The coefficients can have 5 digits and can have a positive or a
negative sign.
65
Advanced Operations
6.1.1.4 Store a user program
The input of the basic data is complete. An overview of the variable
program data is displayed.
1. To enter more specifications or change existing ones, highlight
the appropriate line and press Edit.
2. Select Store to save the user program.
3. Press the PC & Printer icon to send the program data to a
printer or to a USB memory stick (connect the USB memory
stick to the USB interface first).
Note: The test data will be formatted in the preinstalled PrgData folder
as a .csv and as a .lst file.
4. To transfer the program data from one instrument to another
create a new folder on the USB memory stick named dbhlc
and copy the .lst files into this folder.
5. Use the USB memory stick to update the instrument software.
6.1.1.5 Additional user-defined parameters and functions
In addition to the previously defined basic data, additional
parameters and functions can be defined for user programs:
•
measuring range upper and lower limits
•
timer functions
•
chemical forms
Upper and lower limits of the measuring range
It is possible to enter a maximum (upper) and minimum (lower)
measurement value. An error message is displayed if a reading is
above the upper limit or below the lower limit.
6. Highlight the appropriate line in the overview of the program
data and press Edit.
7. Set On and press the 0.000 key to enter the measuring range
limit. Confirm the entry by pressing OK.
66
Advanced Operations
Timer 1 / Timer 2 / Timer 3 / Timer 4:
This function can define time intervals for up to four timers. Timer
designations such as Shake, Wait and Swirl can be assigned.
8. Highlight the appropriate line in the overview of the program
data and press Edit.
9. The timers are activated or deactivated with the check boxes in
the left part of the display. In the next column, a selection can
be made from a list of names that designate the corresponding
work step. In the third column, the times for each timer are
entered (in mm:ss).
Chemical form 2 / chemical form 3 / chemical form 4:
If a Chemical Form 1 has been defined, up to three additional
alternative forms can be entered here.
10. Highlight the appropriate line in the overview of the program
data and press Edit.
11. The chemical forms are activated or deactivated with the check
boxes in the left part of the display.
12. Press the left key to enter another chemical form with the
alphanumeric keypad and press OK to confirm. Press the right
key to enter the conversion factor to calculate the concentration
of the additional chemical form from the concentration of
Chemical Form 1 and press OK to confirm.
13. Press Store to save the program data. Press Cancel to return
to the Main Menu.
67
Advanced Operations
6.1.2 Free programming program type
Free Programming is an advanced option for entering original
user-developed methods. When the Free Programming option is
selected, an overview of the specifications of the programmed test
is displayed. Each input option can be modified to develop the user
method. Refer to Table 9 for more information. To modify an input
option, select the appropriate line and press Edit.
Important Note: Perform steps 1–6 of Programming a New User
Method (section 6.1.1 on page 57) before proceeding with Free
Programming.
Highlight the line containing the program point that is to be edited or
defined and press Edit.
Table 9 Definitions of the program points
Program point
Description
Name
Name of the analysis parameter
Version
An abbreviation or version number assigned by the user is entered here.
Measurement Process
Exact definition of the test: the number of wavelengths at which measurements are made, the
number of absorbance measurements needed, the keys to be used, any waiting periods between
measurements, etc.
Formula
Definition of the formulas with which the test result is calculated.
Variables
The number of variables shown in the display depends on the definition of the measurement
process and the formulas. Input of the numerical values of the wavelengths, factors, constants,
etc.
Timer 1, Timer 2,
Timer 3, Timer 4
Used to enter abbreviations and defined times for up to four timers. Highlight the appropriate line
and press Edit. The timers are activated or deactivated with the control boxes on the left of the
display. In the next column, a selection can be made from a list of names that describe the
corresponding work step. In the third column, the times for each active timer are entered.
6.1.2.1 Measurement process
The measurement process defines the handling and the
measurements of the test:
68
•
At which and how many wavelengths should measurements be
completed
•
How many absorbance measurements must be completed?
•
When should the zero measurement and the sample
measurement be completed?
•
Are waiting times necessary between measurements?
Advanced Operations
•
Should individual program sequences be repeated?
The elements of a measuring sequence, such as zero and sample
measurements and the timer(s) (reaction times, waiting times, etc.)
are individually defined.
6.1.2.2 Enter a new element of a measuring sequence
Important Note: Each component of the measurement process
must be entered in the order in which it will be completed.
1. Highlight the Measurement Process line in the data overview
and press Edit.
2. Press Edit again and then New.
Content and definition of the keys
[Z] key / Zeroing
1. Press the [Z] key to program a zero measurement. Confirm
with OK.
2. Press New and then Zeroing... and use the alphanumeric
keypad to enter the wavelength at which the zero measurement
is to be completed. Press OK and confirm the input by pressing
OK again.
3. If zero measurements are to be carried out at a number of
wavelengths, repeat the above two steps for each wavelength.
Note: The entered measurement sequence is displayed.
69
Advanced Operations
Process Timer key
1. Press the Process Timer key to enter any waiting, reaction or
handling times that have to be taken into account. Use the
alphanumeric keypad to enter the time. Press OK and confirm
the input by pressing OK again.
Note: This time is integrated into the measurement process.
Note: The entered measurement sequence is displayed.
[R] key / Reading...
1. Press the [R] key to program a measurement of the substance
that is to be analyzed. Confirm with OK.
2. Press New and then Reading... and use the alphanumeric
keypad to enter the wavelength at which the measurement is to
be completed. Press OK and confirm the input by pressing OK
again.
3. If measurements are to be completed at a number of
wavelengths, repeat the above two steps for each wavelength.
Note: The entered measurement sequence is displayed.
{ } key
Elements of the measurement sequence that are to be repeated
are placed in brackets.
The left bracket "{"marks the start of the sequence that is to be
repeated and the right bracket "}" marks the end.
Note: The key showing the right bracket remains inactive until a left bracket
is entered.
1. Press {.
2. Press the key that defines the sequence that is to be repeated:
[Z] or [R]. Confirm with OK.
3. Press New and then press Zeroing... or Reading... and use
the alphanumeric keypad to enter the wavelength at which the
measurement should be completed. Press OK and confirm the
input by pressing OK again.
4. Press } to end the sequence.
Note: If an action such as a zero measurement recurs at different
stages of a measurement sequence, the series of actions is numbered
sequentially (e.g. Z1, Z2, etc.).
70
Advanced Operations
Deleting an element of a measuring sequence
Select the appropriate line and press Delete. The element is
deleted.
Inserting an element of a measuring sequence
Select the line in the measuring sequence where the insertion is be
made and press New.
A new element can be entered at the selected position.
When the input is complete, press OK in the "Measurement
Process" display. The data overview is then displayed.
6.1.2.3 Enter the calibration formula (evaluation formula)
The calibration formula (evaluation formula) defines the calculation
and display of intermediate and final results. The previously defined
elements of the measuring sequence are the basis for calculating
the concentrations.
Enter calibration formula C1
1. Highlight the Formula line in the data overview and press Edit.
2. Highlight the line C1: Off and press Edit.
3. Select C1: Off again and press Edit. The display changes to
C1: On.
4. Highlight the next line C1 = to define the formula and press
Edit.
71
Advanced Operations
Refer to Table 10 for detailed information on the Edit
formula keys.
Note: The evaluation formula is built up successively in the display in
accordance with the input.
Note: The arrow key deletes the most recently entered element of the
formula.
Table 10 Edit formula key descriptions
Screen
72
Key
Description
Abs/Variables
Press the Abs/Variables key to select, from the
displayed list, the required element of the defined
measuring sequence and, therefore, the corresponding
measurement wavelength, so that this can be taken into
account in the formula.
New Number
Press New Number to enter a new factor or constant.
Advanced Operations
Table 10 Edit formula key descriptions (continued)
Screen
Key
+– ÷x
>=<
Description
Press +– ÷x, to enter a mathematical operation.
Select the operation and press OK to confirm.
The available choice of mathematical operations
depends on the defined formula.
This means that functions such as "( )", "ln" or "log" etc.
are only active if a term in parentheses or the calculation
of a logarithm is mathematically permissible in the
defined formula (this also applies to the basic
mathematical operations).
The following mathematical operations are available:
•
+ (Addition)
•
– (Subtraction)
•
÷ (Division)
•
x (Multiplication)
•
^ (Exponent)
•
Ln (Natural logarithm)
•
Log (Common logarithm)
Press >=< to include logic statements/links/conditions in
the formula. The following functions are available:
= (Equal to), < (Less than), > (Greater than), <= (Less
than or equal to), >= (Greater than or equal to), IF,
THEN, ELSE
When the evaluation formula C1 has been entered
completely, press OK to confirm. Press OK again to
return to the Formula display.
When the formula C1 has been entered and confirmed,
the parameter name, upper and lower limits of the
measuring range and display result (yes, no) can be
entered.
Entering the next calibration formula (C2 or Cn)
1. Highlight C2: Off and press Edit.
2. Select C2: Off again and press Edit. The display switches to
C2: On.
3. Highlight the next line C2 = to define the formula and press
Edit.
In addition to the keys described in Table 10, only one other
function is available:
73
Advanced Operations
Select Conc. key
If an already defined formula, in this case C1, is to be taken into
account in the formula for C2, press Select conc.
Enter the number of the formula (e.g. 1 for C1) and press OK to
confirm.
Cn can now be linked with a mathematical operation.
Note: The Cn concentrations that are to be calculated are numbered in
sequence: C1, C2, C3, etc.
Note: When the first Cn formula has been defined, the Formula list is
automatically extended by Cn+1.
6.1.2.4 Enter variables
1. Highlight the Variables line in the data overview and press
Edit.
2. Select the variable to be edited, press Edit and use the
alphanumeric keypad to enter the data specified in the working
procedure (for F1, F2, λ1, U1 etc.). Press OK to confirm each
entry.
Abbreviation of Variables:
F1: Factor 1
F2: Factor 2
λ1: Wavelength 1
U1: Conversion Factor 1 for the first chemical form
U2: Conversion Factor 2 for the further chemical form etc.
6.1.2.5 Save a free programming user program
1. Press Store to save the entered data. The data can be stored
under any data point (Measurement sequence, Formula, Timer,
etc.).
2. Press the PC & Printer icon to send the program data to a
printer or to a USB memory stick (connect the USB memory
stick to the USB interface first).
Note: The test data will be formatted in the preinstalled PrgData folder
as a .csv and as a .lst file.
3. To transfer the program data from one instrument to another
create a new folder on the USB memory stick named dbhlc
and copy the .lst files into this folder.
4. Use the USB memory stick to update the instrument software.
74
Advanced Operations
6.1.3 Select a user program
1. Press User Programs in the Main Menu to view an
alphabetical list of user programs with program numbers.
The User Programs list will appear.
2. Highlight the selection by pressing it or press Select by
Number to search for the program by number.
Note: Use the scroll bar to scroll through the list quickly. Use the
alphanumeric keypad to enter the test number (program number) and
press OK to confirm.
3. Press Start to run the program.
6.1.4 Add, edit and delete user programs from the favorites list
The most frequently used tests/methods in the User Program menu
can also be added to the list of favorites to simplify their selection.
1. Press User Programs in the Main Menu.
The User Programs list will appear.
2. Highlight the selection by pressing it or press Select by
Number to search for the program by number.
Note: Use the scroll bar to scroll through the list quickly. Use the
alphanumeric keypad to enter the test number (program number) and
press OK to confirm.
3. Press Program Options.
4. Press Add to Favorites, Edit or Delete and press OK to
confirm.
Note: If the stored program is deleted in User Programs, it will also be
deleted in Favorites Programs.
75
Advanced Operations
6.1.4.1 Add to Favorites
1. Press Add to Favorites and press OK to confirm.
The program is added to the Favorites.
6.1.4.2 Edit
1. Press Edit and press OK to confirm.
An overview of the specifications of the programmed test is
displayed. More information about the input options is provided
in the section 6.1.2 on page 68.
6.1.4.3 Delete
1. Press Delete and press OK to confirm.
The program is deleted from the list of User Programs.
Note: If the stored program is deleted in User Programs, it will also be
deleted in Favorites Programs.
76
Advanced Operations
6.2 Favorite Programs
The most frequently used tests/methods in the Stored Programs
menu and the User Programs menu can also be added to the list
of favorites to simplify their selection.
To add Stored Programs and/or User Programs to the favorites
list or the favorite programs, see section 6.1.4 on page 75 and
section 5.4.10 on page 50.
6.2.1 Recall a favorite program
1. Press Favorite Programs in the Main Menu.
The Favorite Programs list will appear.
2. Highlight the selection by pressing it or press Select by
Number to search for the program by number.
Note: Use the scroll bar to scroll through the list quickly. Use the
alphanumeric keypad to enter the test number (program number) and
press OK to confirm.
3. Press Start.
6.2.2 Delete a favorite program
1. Press Favorite Programs in the Main Menu.
The Favorite Programs list will appear.
2. Highlight the selection by pressing it or press Select by
Number to search for the program by number.
Note: Use the scroll bar to scroll through the list quickly. Use the
alphanumeric keypad to enter the test number (program number) and
press OK to confirm.
3. Press Remove Program and press OK to confirm.
Note: If a Favorite Programs is deleted, it will stay in the User
Programs or Stored Programs.
Note: If the stored program is deleted in User Programs, it will also be
deleted in Favorite Programs.
77
Advanced Operations
6.3 Standard Addition – monitoring/checking results
The accuracy of measured values (their correspondence with the
actual concentration of the analyte in the sample) and their
precision (correspondence of the measurement results obtained
from several samples containing the same concentration of the test
analyte) can be determined or improved using the standard addition
method.
This method (also referred to as spiking) serves to identify
sample-specific interference factors, e.g. substances in the sample
that falsify the analysis (sample matrix effect), a defective
measuring instrument or contaminated reagents.
Method:
A defined amount (concentration) of a standard solution of the test
substance is added to the sample. The detection rate should be
close to 100%.
Measured value after a standard addition
Detection rate = ------------------------------------------------------------------------------------------------------------Expected value after a standard addition
Detection rate
Conclusion
100%
Probability that the measurement results are correct
is high.
< 100%
Assumption: The analysis was falsified by
substances in the sample (sample matrix effect)
Test to determine whether a sample matrix effect
is present:
Use distilled water instead of the sample. Add
standard solution as described in the procedure.
Detection rate
Conclusion
100%
Ions in the sample are
interfering with the
analysis, causing false
results to be obtained.
≠ 100%
No interfering ions consider other
interference factors.
Measures to identify other interference factors:
Checklist:
1. Check if the procedure is completed correctly:
a. Are the reagents added in the correct order?
b. Is enough time allowed for color development?
c. Is the correct glassware in use?
d. Is the glassware clean?
78
Advanced Operations
e. Does the test require the sample to be at a certain
temperature?
f.
Was the pH of the sample in the correct range?
g. Is the pipette volume correct?
2. Check the used reagents by repeating the standard addition
procedure with freshly prepared reagents.
Detection rate
Conclusion
100%
The originally used reagents were defective.
Check the standard solution:
Repeat the standard addition procedure with a
freshly prepared standard solution.
Detection rate
Conclusion
100%
The originally used
standard solution was
defective.
If none of these measures resolves the problem, please contact the
manufacturer or a sales representative.
6.3.1 Complete a standard addition
Carry out the standard addition in accordance with the
corresponding procedure.
There are two different methods:
Peak volume (Standard addition):
Defined volumes of a standard solution are added step by step to
an already analyzed sample. The sample is measured again after
each addition.
Sample volume:
A defined volume of a standard solution of known concentration is
added to the volume of sample specified in the procedure and the
sample is measured after each addition. In most cases three
different standard solutions are prepared and the procedure is
repeated for each of them.
Note: The units and chemical forms used for the sample are used for the
standard solutions. Be careful to ensure that to use the correct units for
subsequent entries.
79
Advanced Operations
Peak volume/sample volume methods
1. Select Stored Programs in the main menu. Select the required
program.
2. Press Start.
3. Analyze a sample without added standard solution in
accordance with the instructions in the Procedures Manual.
When the measurement is complete, leave the sample
cuvette/cell in the cuvette/sample cell holder.
4. Press Options>More>Standard Additions.
An overview of the data of the standard addition procedure is
displayed.
5. Press OK to accept the standard values for standard
concentration, sample volume (total) and standard addition
volume. Press Edit to change any of these values.
80
Advanced Operations
6. Press the key of the value to change it. Use the alphanumeric
keypad to change the value. Press OK to confirm.
7. Press the keys to enter the standard addition volumes. Use the
alphanumeric keypad to enter the new data and press OK.
Description of the table of readings
•
The first column shows the standard addition volume. 0 mL
stands for a sample containing no added standard.
•
The second column shows the reading of the samples with and
without added standard.
•
The third column shows the detection rate of the added
standard.
Note: The black highlighted line is active.
8. The reading of the sample in the instrument, without added
standard, is automatically shown under 0 mL.
9. Prepare the standard addition solution as described in the
procedure.
10. Use the arrow keys to select the first standard addition volume
in the table and insert the cuvette with the corresponding
volume of added standard into the cell compartment.
Press Read.
Repeat the procedure from point 8 with all the other standard
addition solutions.
81
Advanced Operations
11. After all the standard addition solutions have been measured,
press Graph.
The regression line through the standard addition data points is
displayed.
The correlation coefficient r2 indicates how close the data
points are to the line.
If the correlation coefficient = 1, the curve is linear.
The concentration shown above the curve is the estimated
concentration of the sample without the added standard.
Note: In the curve menu, the name on the Curve key switches to
Table. Press Table to display all the data in the table again.
12. Press Ideal line to display the relationship between the added
standard solutions and the ideal line (detection rate 100%).
82
Advanced Operations
6.4 Single Wavelength (absorbance, concentration and transmittance
measurements)
The Single Wavelength mode can be used in three ways. For
sample measurements at a single wavelength, the instrument can
be programmed to measure the absorbance, % transmittance or
concentration of the analyte.
Absorbance measures the amount of light absorbed by the sample,
in units of Absorbance.
% transmittance measures the percentage of the original light that
passes through the sample and reaches the detector.
Turn the concentration factor on to select a specific multiplier for
converting absorbance readings to concentration. In a graph of
concentration versus the absorbance, the concentration factor is
the slope of the line.
6.4.1 Set up single wavelength mode
Press Single Wavelength in the Main Menu. Press Options for
Parameter Setup.
Table 11 Single wavelength setup options
Options
Description
More
For further Options
Store Off/On
With the Store On setting, all measurement data are stored automatically. With the Store Off
setting, no measurement data are stored.
% Trans/Abs
To switch to % transmittance, concentration or absorbance readings
λ Wavelength
To enter the measurement wavelength. Use the alphanumeric keypad to enter the measurement
wavelength. The entered wavelength must be in the range from 320–1100 nm.
Timer icon
This functions as a stopwatch. It helps to ensure that the steps of an analysis are correctly timed
(e.g. reaction times, wait times, etc., can be exactly specified). When the specified time has
elapsed, an acoustic signal is emitted. The use of the timer has no influence on the measurement
program.
Concentration Factor
Multiplication factor for converting absorbance values into concentration values.
Concentration
Resolution
To select the position of the decimal point in the calculated concentration readings.
83
Advanced Operations
Table 11 Single wavelength setup options (continued)
Options
Description
Reading Mode
Single Reading Mode: A reading is only displayed after a measurement has been carried out
(press Read; standard setting) (see section 6.4.2 on page 85).
Continuous Reading Mode: After the zero measurement, all readings are displayed
automatically and continuously (see section 6.4.3 on page 85).
Save as User Program
To store the selected parameters as a User Program
Recall Data
Call up saved measurement data, wavelength scans or time courses (see section 5.3 on
page 36).
Instrument Setup
Basic data of the instrument (see section 5.2 on page 25).
Concentration factor:
1. Press Concentration Factor: Off in the Options menu. Press
On to highlight this feature.
2. Press the ”Factor“ key and use the alphanumeric keypad to
enter the factor by which absorbance readings are to be
multiplied. Press the ”Unit“ key to select the units for
concentration measurements or to create a new unit.
3. Press OK to confirm.
Concentration resolution:
1. Press Concentration Resolution in the Options menu.
2. Select the resolution and press OK to confirm.
84
Advanced Operations
Reading mode:
1. To highlight the required mode, start by pressing Reading
mode.
2. Select the required mode, then press OK, then Return to return
to the result display.
6.4.2 Take single wavelength measurements (single reading)
1. Insert the blank cuvette/cell into the cuvette/sample cell holder.
Press Zero.
Note: The Read key is only active after the zero measurement has
been completed.
2. Insert the sample cuvette/cell into the cuvette/sample cell
holder. Press Read.
3. For data storage, see section 5.3.1 on page 36.
6.4.3 Take single wavelength measurements (continuous readings)
1. Insert the blank cuvette/cell into the cuvette/sample cell holder.
Press Zero.
Note: In the reading mode ”Continuous“ only the Zero key is shown to
start the reading. The reading sequence is started automatically.
2. Insert the sample cuvette/cell into the cuvette/sample cell
holder.
3. Press Options and then the Store icon to store the displayed
data in the Data Log.
Note: For data storage, see section 5.3.1 on page 36.
85
Advanced Operations
6.5 Multi-Wavelength mode – measurements at more than one wavelength
In the multi-wavelength mode, absorbance values can be
measured at up to four wavelengths and the results can be
mathematically processed to obtain sums, differences and
relationships.
Absorbance measures the amount of light absorbed by the sample,
in units of Absorbance.
% Transmittance measures the percentage of the original light that
passes through the sample and reaches the detector.
Turning on the concentration factor allows selection of a specific
multiplier for converting absorbance readings to concentration. In a
graph of concentration versus the absorbance, the concentration
factor is the slope of the line. Concentration is calculated using a
single factor for each wavelength, which is input by the user.
6.5.1 Set the reading mode at different wavelengths
Press Multi Wavelength in the Main Menu. Press Options for
Parameter Setup.
Table 12 Multi-wavelength setup options
Options
Description
More
For further Options
Store Off/On
With the Store On setting, all measurement data are stored automatically. With the Store Off
setting, no measurement data are stored.
% Trans/Abs
To switch to % transmittance, concentration or absorbance readings
λ Wavelength
To enter the measurement wavelength. Use the alphanumeric keypad to enter the measurement
wavelength. The entered wavelength must be in the range from 320–1100 nm.
Timer icon
This functions as a stopwatch. It helps to ensure that the steps of an analysis are correctly timed
(e.g. reaction times, wait times, etc., can be exactly specified). When the specified time has
elapsed, an acoustic signal is emitted. The use of the timer has no influence on the measurement
program.
Concentration Factor
Multiplication factor for converting absorbance values into concentration values.
Concentration
Resolution
To select the position of the decimal point in the calculated concentration readings.
Absorbance Formula
Calculation basis for evaluating samples
Save as User Program
To store the selected parameters as a User Program
86
Advanced Operations
Table 12 Multi-wavelength setup options (continued)
Options
Description
Recall Data
Call up saved measurement data, wavelength scans or time courses (see section 5.3 on
page 36).
Instrument Setup
Basic data of the instrument (see section 5.2 on page 25).
λ / Absorbance formula:
1. Press Absorbance Formula.
2. The formula selected in the top key determines the number of
wavelength and coefficent keys that will appear below. To
change the absorbance formula, press the top key, select a
formula from the displayed list and press OK. When a new
formula is selected, the number of variables below changes to
match.
The following formulas are available:
K1A1+K2A2
K1A1+K2A2+K3A3
K1A1+K2A2+K3A3+K4A4
K1A1/K2A2
(K 1 A 1 + K 2 A 2 ) / K 3 A 3
(K 1 A 1 + K 2 A 2 ) / (K 3 A 3 + K 4 A 4 )
A 1 refers to the absorbance at wavelength 1
A 2 refers to the absorbance at wavelength 2, etc.
K 1 refers to the coefficient at wavelength 1
K 2 refers to the coefficient at wavelength 2, etc.
Coefficients can be set negative where subtraction is required.
87
Advanced Operations
3. To change a wavelength, press one of the ”λx:“ keys. Enter the
desired wavelength coefficient into the numeric keypad.
Press OK to confirm.
4. To change a coefficient, press one of the ”KX:“ keys. Enter the
desired coefficient into the numeric keypad.
Press OK to confirm.
Note: The instrument allows entry of up to 5 significant digits, with a
maximum of 4 significant digits after the decimal point.
Concentration factor:
1. Press Concentration Factor: Off in the Options menu. Press
On to highlight this feature.
2. Press the ”Factor“ key to enter the factor by which
absorbance readings are to be multiplied. Press the ”Unit“ key
to select the units for concentration measurements or to create
a new unit.
3. Press OK to confirm.
Concentration resolution:
1. Press Concentration Resolution in the Options menu.
2. Select the resolution and press OK to confirm.
88
Advanced Operations
6.5.2 Complete a measurement in the multi wavelength mode
1. Insert the blank cuvette/cell into the cuvette/sample cell holder.
Press Zero.
Note: The Read key does not become active until the zero
measurement has been completed.
2. Insert the sample cuvette/cell into the cuvette/sample cell
holder. Press Read.
3. For data storage, see section 5.3.1 on page 36.
89
Advanced Operations
6.6 Wavelength Scan mode – recording of absorbance and transmittance
spectrums
In the wavelength scan mode, the absorbance of the light in a
solution over a defined wavelength spectrum is measured.
The measurement results can be displayed as a curve, as percent
transmittance (%T) or as Absorbance (Abs). The collected data
can be printed as a table or a curve.
The data are available for formatting changes. These include
automatic scaling and zoom functions. Maximum and minimum
values are determined and shown as a table.
The cursor can be moved to any point on the curve for the purpose
of reading off the absorbance or transmittance value and the
wavelength. The data associated with each data point can also be
shown as a table.
6.6.1 Set up the wavelength scan
Press Wavelength Scan in the Main Menu. Press Options for
Parameter Setup.
Table 13 Wavelength scan setup options
Option
Description
More
For further Options
Store icon
To store the scan data
Reference Off/On
From the displayed list of stored scans, a record is selected for use as a reference
scan/superimposed scan. This can be highlighted or shown in the background in comparison
with the actual measured scan.
Note: This option is only available when there are stored scans with the same wavelength range
and step.
λ
To enter the wavelength spectrum and the scan interval
Select View
Enables the user to switch the display back and forth between the scan data tables
(wavelength/absorbance) and the graph of the curve.
Note: Select View will be activated after the first reading.
Cursor Mode
To select Track or Peak/Valley. The selection for this menu item determines to which points on
the graph the cursor moves.
Send Data
To send Data to a printer, computer or USB memory stick (Type A)
Integral: On/Off
The integral gives the area and the derivative of the integral gives the original function
90
Advanced Operations
Table 13 Wavelength scan setup options (continued)
Option
Description
Scale & Units
Scale: In the automatic scaling mode, the y-axis is automatically adjusted so that the total scan is
displayed.
The manual scaling mode allows sections of the scan to be displayed.
Units: Choice of absorbance or transmittance.
Recall Data
Call up saved measurement data, wavelength scans or time courses (see section 5.3 on
page 36).
Instrument Setup
Basic data of the instrument (see section 5.2 on page 25).
λ Setting wavelength
1. Press the λ key in the Options menu to select the wavelength
range and the wavelength step.
2. Press the upper left key to open the numeric keypad and select
the minimum wavelength. Press OK to confirm.
3. Press the upper right key to open the numeric keypad and
select the maximum wavelength. Press OK to confirm.
Note: Do not select the same wavelength for minimum and maximum.
4. Highlight the required wavelength step.
Note: Scan recordings of high resolution data take a longer time than
recordings of low resolution data.Selecting a larger step allows the
instrument to scan faster, but decreases the resolution of the collected
data.
91
Advanced Operations
5. According to the selected wavelength range, select the interval
from the actively displayed wavelength steps. In summary
maximally 780 measuring steps can be accomplished during a
Scan.
Note: The maximum wavelength adjusts automatically if the difference
between the maximum and minimum wavelength is not a multiple of
the interval.
6. Press OK to return to the scan mode. Selected parameters are
displayed along the graph‘s x-axis.
Select view (displaying table)
1. Press Select View in the Options menu after a reading is
taken.
2. A table with the results is displayed.
3. To return to the graph press Options and then View Graph.
Cursor mode
1. Press Cursor Mode: Track in the Options menu.
2. The selection for this menu item determines what data are
displayed in the table. Highlight Track or Peak/Valley.
3. Press OK to confirm.
4. Press Return to return to the scan mode.
Integral
The Integral applies to the whole wavelength range of the scan.
1. Press Integral: Off in the Options menu.
2. Highlight On to show the Integral. To find the integral of other
wavelength ranges, change the wavelength range and scan
again.
3. Press OK to confirm.
92
Advanced Operations
4. Press Return to return to the scan mode.
Note: The Integral is shown instead of the date on the display.
Note: For the next scan measurement the setting for the Integral will be
On.
Scale & units
1. Press Scale & Units.
2. Highlight the required units (Abs or %T).
3. Highlight Auto or Manual scaling on the graph´s y-axis .
Note: If manual scaling is selected, use the alphanumeric keypad to set the
limits ymin. and ymax.. The graph is adjusted to display only the values in the
selected range. If automatic scaling is selected, the instrument sets the
limits automatically so that the total range can be displayed.
4. Press OK.
5. Press Return to return to the scan mode.
6.6.2 Wavelength scan reading
After the scanning parameters have been selected, the baseline
must be scanned. Changing any of the scanning parameters
requires a new baseline scan. When the baseline has been
scanned, the instrument is ready to scan one or more samples.
1. Press Wavelength Scan in the Main Menu.
2. Insert the blank cuvette/cell into the cuvette/sample cell holder.
93
Advanced Operations
3. Press Zero. ”Zeroing....“ appears below the graph as the
baseline scan begins.
4. Insert the prepared sample cuvette/cell into the cuvette/sample
cell holder.
5. Press Read. Below the graph ”Reading...“ appears and a graph
of the absorbance or transmittance values at the scanned
wavelengths is displayed continuously.
The Wavelength Scan is complete, if
•
the graph is shown full size,
•
the scaling of the x-axis fits automatically,
•
the Cursor functions in the vertical navigation bar are
highlighted.
6.6.2.1 Navigation of the wavelength scan graph or a wavelength scan analysis
Table 14 Navigating the wavelength scan
Cursor Function/
Zoom Function
Description
Curve Icon
Choice of Cursor Mode Peak/Valley (cursor moves between minimum/maximum absorbance
(Choice of Cursor Mode) values) or Cursor Mode Tracking (cursor moves over each data point of the scan).
Arrow keys
The arrow keys are used (right/left) to move the cursor (depending on the selected mode) to the
next data point. The data of the data point (wavelength/absorbance or transmittance value) are
highlighted on the x and y axes.
Note: Press any point on the curve to display the associated data.
Zoom Icon
This function is used to magnify the section of the curve in the vicinity of the cursor. The original
curve size can be restored by pressing the zoom icon again.
94
Advanced Operations
6.6.3 Work with reference scans
There are two options to work with Reference Scans:
First option:
1. Press Reference: Off in the Options menu to select another
scan to display on the same screen with the current scan.
Highlight the required scan number and press
Highlight Reference.
Note: After selecting a reference scan the Reference: Off key in the
Options menu turns into Reference: On.
Note: Only scans that have the same wavelength range and step can
be displayed using the overlay option.
2. The reference curve is shown in orange. The absorbance or
transmittance value and the associated wavelength are
highlighted in orange.
Note: A black and an orange box are shown in the left corner of the
display. The orange box relates to the reference scan and the black
one relates to the current wavelength scan.
3. To complete the wavelength scan reading, see section 6.6.2 on
page 93.
•
The newly plotted wavelength scan curve is shown in
black.
•
The absorbance or transmittance value and the associated
wavelength are highlighted in black.
•
In addition, the display shows the difference between the
wavelength scan curve and the reference curve against the
wavelength.
4. Press the black or orange small box in the left upper corner on
the screen to switch between the actual wavelength scan and
reference scan.
95
Advanced Operations
Second option:
1. Insert the blank cuvette/cell into the cuvette/sample cell holder.
Press Zero.
2. Insert the sample cuvette/cell into the cuvette/sample cell
holder. Press Read.
•
The newly plotted wavelength scan curve is shown in
black.
•
The absorbance or transmittance value and the associated
wavelength are highlighted in black.
3. Press Options and then Reference: Off in the Options menu
to select another scan to display on the same screen with the
current scan. Highlight the required scan number and press
Highlight Reference.
Note: After selecting a reference scan the Reference: Off key in the
Options menu turns into Reference: On.
Note: Only scans that have the same wavelength range and step can
be displayed using the overlay option.
4. The reference curve is shown in orange. The absorbance or
transmittance value and the associated wavelength are
highlighted in orange.
•
Additionally the difference of the absorbance and/or
transmittance value between the two scans (measured
scan and reference scan) is indicated/highlighted at each
position of the cursor.
Note: A black and an orange box are shown in the left corner of the
display. The orange box relates to the reference scan and the black
one relates to the current wavelength scan.
5. Press the black or orange small box in the left upper corner on
the screen to switch between the actual wavelength scan and
reference scan.
96
Advanced Operations
6.7 Time course of absorbance/transmittance
The Time Course Mode is used to collect data in either absorbance
or transmittance for a user-specified length of time. After the data
are collected, they can be displayed in either graphic or tabular
format.
6.7.1 Time course setup parameters
Press Time Course mode in the Main Menu. Press Options to
configure parameters.
Table 15 Time course setup options
Option
Description
More
For further Options
Store icon
To store the scan data
Time & Interval
To input the total time for data collection and the time interval between the collection of data
points
λ
To input the wavelength setting
View Table
To display readings in absorbance, transmittance or concentration. This can be changed after
sample data are collected
Scale & Units
Scale: In the automatic scaling mode, the y-axis is automatically adjusted so that the total scan is
displayed.
The manual scaling mode allows sections of the scan to be displayed.
Units: Choice of absorbance or transmittance.
Send Data
To send Data to a printer, computer or USB memory stick (Type A)
Recall Data
Call up saved measurement data, wavelength scans or time courses (see section 5.3 on
page 36).
Instrument Setup
Basic data of the instrument (see section 5.2 on page 25).
97
Advanced Operations
Time & interval:
1. Press Time & Interval in the Options menu.
2. Input the total time and the reading time and press OK to
confirm.
Note: In total 500 measuring steps are possible. To select a total time and
a time interval that would cause this number of measurements to be
exceeded, the time interval is defined automatically and the OK key is
inactivated.
Scale & units:
1. Press Scale & Units in the Options menu.
2. Highlight Abs or %T as the required units.
3. Highlight Auto or Manual scaling on the graph's y-axis.
Note: If manual scaling is selected, use the alphanumeric keypad to set the
limits ymin. and ymax.. The graph is adjusted to display only the values in the
selected range. If automatic scaling is selected, the instrument sets the
limits automatically so that the total range can be displayed.
4. Press OK to confirm.
5. Press Return to return to the scan mode.
6.7.2 Time course scan reading
After the parameters have been selected, the instrument must be
blanked, then the sample can be analyzed.
1. Insert the blank cuvette/cell into the cuvette/sample cell holder.
Press Zero. The blank reading is shown on the display.
2. Insert the sample cuvette/cell into the cuvette/sample cell
holder. Press Read. Start collecting time course (kinetic) data.
Note: During the measurement the Zero and Read keys change to
Mark and Stop.
98
Advanced Operations
•
Select Mark to mark the next data point collected. This mark is
not used by the instrument, but is available for the user and
may indicate a significant event, such as the addition of a
sample or other reagent. The mark is also shown in the table.
•
Select Stop to stop taking sample readings.
6.7.3 Analysis of time course data
After the data are collected, the following manipulations can be
done on the graphic data:
The Time Course Program is complete, if
•
the sound is turned on, the instrument beeps when the
readings are done
•
the graph is shown fullsize,
•
the scaling of the x-axis occurs automatically,
•
the Cursor functions in the vertical navigation bar are
highlighted.
99
Advanced Operations
6.7.3.1 Navigation of a time scan or a time scan analysis
After a time scan has been completed, the time and the
absorbance/transmittance data are displayed as a curve.
Where the cursor is positioned on the curve, the elapsed time up to
this point and the corresponding absorbance are highlighted.
Table 16 Navigating the time scan
Cursor Function/
Zoom Function
Description
Delta mode: A second cursor is highlighted. The position of the fixed cursor was previously
defined in Cursor Mode Single. Use the active cursor to select any point on the measurement
curve. The difference to the fixed cursor is shown on the curve. The delta values are
Curve Icon
correspondingly highlighted and displayed on the x and y axes.
(Choice of Cursor Mode) The gradient of the curve and the correlation coefficient (r2) between the cursor points in the
Delta mode are shown under the curve.
Cursor Mode Single: The cursor moves to each selected measurement point of the scan.
Arrow keys
The arrow keys (right/left) are used to move the cursor (depending on the selected mode) to the
next data point. The data of the data point (wavelength/absorbance or transmittance value) are
highlighted on the x and y axes.
Note: Press any point on the curve to display the associated data.
Zoom Icon
This function is used to magnify the section of the curve in the vicinity of the cursor. The original
curve size can be restored by pressing the zoom icon again.
100
Advanced Operations
6.8 System checks
1. Press System Checks in the Main Menu.
The System Checks menu contains instrument information and
various performance tests.
6.8.1 Instrument information
1. Press Instrument Information in the System Checks menu.
2. The model, serial number and software version are displayed.
101
Advanced Operations
6.8.2 Upgrade of the instrument software
To obtain the software for the update from the Internet at
www.hach.com.
1. Go to http://www.hach.com.
2. On the DR 3800 product page, click Lab System
Software/Software Update Downloads under Downloads.
3. Locate the appropriate download and follow the prompts for
saving the file(s) to the USB memory stick.
4. On the DR 3800, press Instrument Update in the System
Checks menu.
5. Connect the USB stick to the USB interface on the DR 3800,
(section 3.4 on page 13). Press OK.The link is established
automatically and the software is updated.
6. Press OK to return to the System Checks menu.
Note: When the instrument software has been updated, a prompt to restart
the instrument is displayed.
6.8.3 Optical checks
For each optical check, the measured results must be evaluated
against user-specific requirements. The check options do not
define tolerances.
1. Press Optical Checks in the System Checks menu.
The Optical Checks menu contains programs for checking the
wavelength accuracy, stray light and photometric accuracy.
An optional test filter set (Verification Kit) (Section 9 on page 123)
containing 6 precision glass filters, target values, tolerances and
instructions is available and is recommended as an aid for carrying
out comprehensive in-house instrument checks.
102
Advanced Operations
6.8.3.1 Wavelength check
The Wavelength Check test is used to check wavelength accuracy
at 807 nm.
1. Press Wavelength Check in the Optical Checks menu.
2. Insert the adapter (A) for 10-mm rectangular cells in the cell
compartment #2 and insert the sample cuvette/cell (Neodym or
BG20/2) in the adapter. Close the cell compartment.
Press Start.
3. The result is displayed and is to be compared with the
nominal/standard data (given in the quality control certificate) of
the sample cuvette/cell.
4. Press Cancel to return to Optical Checks.
6.8.3.2 Noise check
The Noise Check test is used to test the photometric noise in the
instrument.
However, this test can be used to test noise at any wavelength and
at an absorbance level determined by using a sample.
1. Press Noise Check in the Optical Checks menu.
2. Press λ to input the wavelength.
3. Input the wavelength and press OK to confirm.
103
Advanced Operations
4. Press Zero.
5. Insert sample cuvette/cell into the cell compartment #2.
6. Press Start.
7. The result will be displayed. Thirty readings are averaged for
the blank. The ”Average“ and ”Std Deviation“ are calculated
from 100 consecutive absorbance readings.
•
Noise
•
Sample
•
Reference
8. Press PC & Printer icon to send data to a PC or Printer.
9. Press Cancel to return to Optical Checks.
104
Advanced Operations
6.8.3.3 Stray light check
The Stray Light test is used to measure the stray light in the
instrument at 340 nm.
1. Press Stray Light Check in the Optical Checks menu.
2. Remove any cuvette/sample cell from the cell compartment.
3. Insert the adapter (A) for 10-mm rectangular cells in the cell
compartment #2. Press Zero.
4. Insert the sample cuvette/cell or reference filter into the cell
compartment #2. Close the cell compartment. Press Start.
5. The ”Average“ and ”Std Deviation“ are calculated from
100 successive absorbance measurements. The result is
displayed and is to be compared with the nominal/standard
data (given in the quality control certificate) of the sample
cuvette/cell.
Note: Failings and passings will be defined by the user.
6. Press Cancel to return to Optical Checks.
105
Advanced Operations
6.8.3.4 Absorbance check
The Absorbance Check test is used to test the photometric
accuracy and repeatability of the instrument.
This test can be used to test absorbance at any wavelength by a
specific sample or test filter set (Refer to section 6.8.3.6 on
page 108).
1. Press Absorbance Check in the Optical Checks menu.
2. Press λ to input the wavelength.
3. Input the wavelength and press OK to confirm.
4. Remove any cuvette/sample cell from the cell compartment
and press Zero.
5. Insert sample cuvette/cell into the cell compartment and press
Read.
6. 10 Replicates of blanking and reading lead to results.
7. The result is displayed and is to be compared with the nominal
data of the sample cuvette/cell.
8. Press Cancel to return to Optical Checks.
106
Advanced Operations
6.8.3.5 Drift check
The Drift Check test is used to test the stability of the instrument.
Note: The Drift Check runs 1 hour.
1. Press Drift Check in the Optical Checks menu.
2. Press λ to input the wavelength.
3. Input the wavelength and press OK to confirm.
4. Press Start.
5. The Drift Check runs 1 hour.
This test takes a reading every minute for one hour. Every
fifteen minutes, linear regression is used to calculate the slope
(rate of change) for the previous fifteen minute interval.
107
Advanced Operations
6. The last reading and slope for each 15 minute interval are
displayed. At the end of the hour, the overall values are
calculated and displayed. The test proceeds to completion.
7. Press Cancel to return to Optical Checks.
6.8.3.6 Verification kit
The Verification Kit, (see Section 9 on page 123) is designed for
periodic monitoring of scattered light, photometric accuracy and the
wavelength accuracy of the spectrophotometers.
When results exceed allowable tolerances (given in the quality
control certificate to the test record), contact the manufacturer.
1. Press Verification Kit in the Optical Checks menu.
2. Press Nominal Values.
3. Press Edit.
An automatic menu guidance queries values (filters,
wavelength, nominal values and tolerances) given in the quality
control certificate to the following specifications:
•
Stray Light
•
Photometric accuracy
•
Wavelength accuracy
4. Press OK when all values are entered and the overview is
displayed.
108
Advanced Operations
5. Press Verification.
6. Insert the adapter A (Figure 4 on page 15) in cell
compartment #2.
7. Remove any cuvettes/cells from the cell compartment and
press Start.
8. Insert the different filters in the given order one after the other.
Press Next after inserting a filter.
109
Advanced Operations
After the last measurement the results are displayed.
9. Press the PC & Printer icon to send the data to a USB memory
stick, PC or to a printer.
The files will be stored automatically as CSV file (Comma
Seperated Value). The file name will be formatted as
“Verification.csv“.
6.8.4 Output checks
If a printer is connected a test printing of the current screen will be
printed.
6.8.5 Lamp history
The Lamp History menu provides the amount of time that the lamp
has been on (Hours).
After a lamp is replaced and the Lamp History is reset, the display
of the total operating time is reset to 0.
1. Press Lamp History in the System Checks menu.
2. Press Reset VIS and the Visible Lamp will be reset.
3. Press OK to return to System Checks.
6.8.5.1 Factory service
The Factory Service menu is password protected. This menu is not
intended for customer use.
110
Advanced Operations
6.8.6 Service time
In order to ensure a regular inspection, an automatic memory
reference for the service times can be entered. After switching the
instrument on this memory reference will be activated and indicated
at the appropriate time.
1. Press Service Time in the System Checks menu.
2. Select On and then Last Service to enter the date of the last
inspection.
3. Press OK to confirm.
4. Select Next Service to determine a specific period of time up to
the next inspection.
5. Press OK to confirm.
If the next service is due, the message "Next service is due!" is
displayed after switching on the instrument.
6. Press OK to return to the Main Menu.
Contact the manufacturer or distributor to arrange an appointment
for the next service.
111
Advanced Operations
6.8.7 Instrument backup
Before the next service date the Instrument Backup menu offers
the possibility to store all programs, measuring data, Operator ID,
Sample ID, passwords and all adjustable data on a USB stick.
1. Press Instrument Backup in the System Checks menu.
2. Connect the USB memory stick (section 3.4 on page 13).
3. Press Store to start a Backup.
Note: If the USB stick is not connected, the message "Please insert USB
Memory" is displayed. Connect a USB stick in order to store the data.
Press OK to confirm and press Store again.
Note: If the Backup was already stored before, the message "Data already
exists. Overwrite?" is displayed. Press OK to overwrite the data.
112
Advanced Operations
If the file was stored the message Instrument Backup is stored to
USB memory will be displayed.
4. Press OK to return to the System Checks menu.
Restore backup data:
Important Note: All current data will be overwritten when restoring
the Backup file!
1. Press Instrument Backup in the System Checks menu.
2. Connect the USB memory stick containing the Backup
(section 3.4 on page 13).
3. Press Restore to pass back the data.
Note: If the USB stick is not connected, the message "Please insert USB
Memory" is displayed. Connect a USB stick, in order to store the data.
Press OK to confirm and press Restore again.
113
Advanced Operations
4. Press OK to confirm after the message “Instrument Backup
from S/N XXXXXXX. Restore?“ is displayed.
5. After the backup start the instrument again.
114
Section 7
Maintenance
CAUTION
Potential Chemical, Biological Eye and Skin Hazards.
Only qualified personnel should conduct the tasks described
in this section of the manual.
Important Note: Remove any cuvettes/cells that are still in the
instrument and dispose of them or their contents using an approved
disposal method.
7.1 Cleaning requirements
CAUTION
Potential Pinch, Eye, Burn and Chemical Hazards.
Always disconnect power from the instrument before
attempting any cleaning operations.
Important Note: Under no circumstances should the instrument,
display or the accessories be cleaned with solvents such as white
spirit, acetone, etc.
7.1.1 Spectrophotometer
•
Clean the enclosure, cuvette/sample cell compartments and all
accessories with a soft damp cloth. A mild soap solution can
also be used. Do not get excess water in the cuvette/sample
cell compartments. Do not insert a brush or sharp object into
Cell Compartment #1 to avoid damaging the mechanical
components.
•
Dry the cleaned parts carefully with a soft cotton cloth.
•
Take care not to scratch the display. Do not touch the screen
with ball pens, pencils or similar pointed objects.
•
Clean the display with a soft, lint-free and oil-free cotton cloth.
Diluted window cleaner liquid can also be used.
7.1.2 Display
7.1.3 Cuvettes/sample cells
CAUTION
Potential Chemical/ Biological Exposure Hazards.
Use proper laboratory practices whenever there is a risk of
chemical exposure.
1. After performing a procedure, clean glass cuvettes/sample cells
with cleaning agents.
2. Afterwards, rinse the cuvettes/sample cells several times with
tap water and then thoroughly with deionized water.
Important Note: Glass cuvettes/sample cells that have been used
for organic solvents (such as chloroform, benzene, toluene, etc.)
must be rinsed with acetone before being treated with cleaning
agents. In addition, another rinse with acetone is necessary as a
final treatment step before the cuvettes/sample cells are dried.
115
Maintenance
7.2 Lamp replacement
1. Remove the cuvette/vial from the cell compartment.
2. Switch the instrument off.
3. Unplug the power cord.
WARNING
Burn Hazard. Wait until the lamp cools down. Contact with the
hot lamp can cause burns.
4. Use a screwdriver to remove the cover from the back of the
instrument (the screws may be slotted or cross-head).
5. Remove the cover.
6. Carefully fold the fan forward (see instrument label 1).
116
Maintenance
WARNING
Burn Hazard. Wait until the lamp cools down. Contact with the
hot lamp can cause burns.
7. Push down on the pressure spring (see instrument label 2).
8. Remove the halogen lamp complete with the plug panel (see
instrument label 3).
9. Carefully unplug the halogen lamp from the plug panel.
Important Note: Hold the lamp by the fitting only. Avoid touching
the glass, as substances on the skin can bake onto the lamp bulb
and thus accelerate the aging process of the lamp.
10. Plug a new halogen lamp to the panel.
11. Insert the halogen lamp with the half rounded part pointing up.
12. Press the plug with slight pressure into the direction of the
halogen lamp and push the pressure spring up, so that it will
engage.
13. Carefully insert the lamp fitting again.
14. Fold the fan again, so that it engages.
15. Use a screwdriver to screw the back cover to the instrument.
16. Plug in the power supply.
17. Reset the Lamp History, see section 6.8.5 on page 110.
117
Maintenance
7.3 Filter pad maintenance
To determine when the filter mat needs to be replaced, inspect the
filter mat every 3–6 months (in a relatively dust-free environment,
this interval can be longer).
1. Remove any cuvettes and cuvette/sample cell adapter from the
cell compartment.
2. Turn the instrument off.
3. Unplug the power cord.
4. Lift the instrument and check the color of the filter mat. Replace
the filter mat if is dark gray or black.
7.3.1 Filter pad replacement
5. Carefully turn the instrument over and place it on a soft surface.
6. Use a screwdriver (standard or cross-head) to open the
filter grid (Figure 11, item 1).
7. Lift the filter grid (Figure 11, item 1).
118
Maintenance
8. Remove the old filter pad (Figure 11, item 3) and replace it with
a new one.
9. Screw the grid back in place.
10. Carefully stand the instrument upright.
11. Plug the instrument in.
Figure 11 Base of DR 3800 with filter grid
1
Filter grid
2
Phillips screw
3
Filter pad
119
Maintenance
120
Section 8
Troubleshooting
Problem/Display screen
Likely Cause
Action
Attention!
Please insert the light shield.
Measurements with barcode cuvettes
generally require the light shield.
Insert the light shield.
Press OK.
Absorbance > 3.5!
The measured absorbance exceeds 3.5
Dilute the sample and repeat the
measurement
Concentration too high!
Calculated concentration is higher than
999999
Dilute the sample and repeat the
measurement
Error
Barcode controlnumber?
Please update program data!
Deviation to the stored data
Data updating
Error
Program not available.
Please update program data!
Barcode cuvette test missing
Error
Clean Cuvette
The cuvette is soiled or there are
undissolved particles in the cuvette
Clean the cuvette; allow the particles to
settle
Error
Selfcheck stopped.
Please check the lamp.
Please close the lid.
Error [xx]
Self Check Test stops while starting the
instrument
Check the lamp and replace, if
necessary.
Close the lid.
Press Start Again.
Error
Selfcheck stopped.
Please remove the cuvette
Please close the lid.
Self Check Test stops while starting the
instrument
Remove the cuvette/sample cell from
the cell compartment.
Press OK.
Error
Selfcheck stopped.
Hardware error.
Error [x]
Electronic defect
Contact the manufacturer or a sales
representative and indicate the error
number
Error
Too much ambient light!
Move device into shade
or close the lid!
The instrument sensors detects too
much ambient light.
Reduce ambient light. (Avoid direct sun
light.)
Close the lid.
Negative result!
The calculated result is negative
Check the concentration of the sample
No evaluation!
Error in the test database / user
database
Check the programming
Contact the manufacturer or a sales
representative
Over measuring range
The measured absorbance is above the
calibration range of the test
Dilute the sample and repeat the
measurement
Under measuring range
The measured absorbance is below the
calibration range of the test
If possible, select a test with a lower
measurement range or use a cuvette
with a longer path length
Data updating
121
Troubleshooting
122
Section 9
Replacement Parts
Description
Cat. No.
Tungsten Lamp
LZV565
Cuvette adapter 10 mm (A)
LZV583
Cuvette adapter 1 inch round (C)
LZV584
Light shield
LZV646
Cuvette adapter for Pour-Thru Cell (B)
LZV585
Power supply, external
LZV610
USB-Memory Stick
2946900
USB-Interface Cable (1 m)
5924000
USB-Keyboard (keyboard layout: US)
LZV582
USB-Barcode Scanner (hand-held scanner)
LZV566
Pour-Thru Kit
5940400
Adapter Box
LZV743
Sample cells, glass, 1 inch square, 10 mL, matched pair
2495402
Sample cells, glass, 1 cm square matched pair
2095100
Sample cell, glass, 50 mm
2629250
Sample cell with cap, plastic, 1 cm, 10 mL
4864302
Hach Data Trans (PC software for data transfer)
LZY274
Certified test filter set for self-checks (Verification Kit)
(6 precision glass filters with target values)
LZV537
Dust cover
HYH020
Filter pad
Citizen PD-24 Thermal Printer, 1 roll of paper
LINK2SC software (SD SanDisk card, USB adapter, and user manual)
A23766
2960100
LZV774
123
Replacement Parts
124
Section 10
Contact Information
HACH Company
World Headquarters
P.O. Box 389
Loveland, Colorado
80539-0389 U.S.A.
Tel (800) 227-HACH
(800) -227-4224
(U.S.A. only)
Fax (970) 669-2932
[email protected]
www.hach.com
Repair Service in the
United States:
HACH Company
Ames Service
100 Dayton Avenue
Ames, Iowa 50010
Tel (800) 227-4224
(U.S.A. only)
Fax (515) 232-3835
Repair Service in Canada:
Hach Sales & Service
Canada Ltd.
1313 Border Street, Unit 34
Winnipeg, Manitoba
R3H 0X4
Tel (800) 665-7635
(Canada only)
Tel (204) 632-5598
Fax (204) 694-5134
[email protected]
Repair Service in
Latin America, the
Caribbean, the Far East,
Indian Subcontinent, Africa,
Europe, or the Middle East:
Hach Company World
Headquarters,
P.O. Box 389
Loveland, Colorado,
80539-0389 U.S.A.
Tel +001 (970) 669-3050
Fax +001 (970) 669-2932
[email protected]
HACH LANGE GMBH
Willstätterstraße 11
D-40549 Düsseldorf
Tel. +49 (0)2 11 52 88-320
Fax +49 (0)2 11 52 88-210
[email protected]
www.hach-lange.de
HACH LANGE LTD
Pacific Way
Salford
GB-Manchester, M50 1DL
Tel. +44 (0)161 872 14 87
Fax +44 (0)161 848 73 24
[email protected]
www.hach-lange.co.uk
HACH LANGE LTD
Unit 1, Chestnut Road
Western Industrial Estate
IRL-Dublin 12
Tel. +353(0)1 46 02 5 22
Fax +353(0)1 4 50 93 37
[email protected]
www.hach-lange.ie
DR. BRUNO LANGE
GES. MBH
Industriestraße 12
A-3200 Obergrafendorf
Tel. +43 (0)27 47 74 12
Fax +43 (0)27 47 42 18
[email protected]
www.hach-lange.at
DR. BRUNO LANGE AG
Juchstrasse 1
CH-8604 Hegnau
Tel. +41(0)44 9 45 66 10
Fax +41(0)44 9 45 66 76
[email protected]
www.hach-lange.ch
HACH LANGE FRANCE
S.A.S.
33, Rue du Ballon
F-93165 Noisy Le Grand
Tél. +33 (0)1 48 15 68 70
Fax +33 (0)1 48 15 80 00
[email protected]
www.hach-lange.fr
HACH LANGE SA
Motstraat 54
B-2800 Mechelen
Tél. +32 (0)15 42 35 00
Fax +32 (0)15 41 61 20
[email protected]
www.hach-lange.be
DR. LANGE NEDERLAND
B.V.
Laan van Westroijen 2a
NL-4003 AZ Tiel
Tel. +31(0)344 63 11 30
Fax +31(0)344 63 11 50
[email protected]
www.hach-lange.nl
HACH LANGE APS
Åkandevej 21
DK-2700 Brønshøj
Tel. +45 36 77 29 11
Fax +45 36 77 49 11
[email protected]
www.hach-lange.dk
HACH LANGE AB
Vinthundsvägen 159A
SE-128 62 Sköndal
Tel. +46 (0)8 7 98 05 00
Fax +46 (0)8 7 98 05 30
[email protected]
www.hach-lange.se
HACH LANGE S.R.L.
Via Riccione, 14
I-20156 Milano
Tel. +39 02 39 23 14-1
Fax +39 02 39 23 14-39
[email protected]
www.hach-lange.it
HACH LANGE S.L.U.
Edif. Arteaga Centrum
C/Larrauri, 1C- 2ª Pl.
E-48160 Derio/Vizcaya
Tel. +34 94 657 33 88
Fax +34 94 657 33 97
[email protected]
www.hach-lange.es
HACH LANGE LDA
Av. do Forte nº8
Fracção M
P-2790-072 Carnaxide
Tel. +351 214 253 420
Fax +351 214 253 429
[email protected]
www.hach-lange.pt
HACH LANGE SP.ZO.O.
ul. Opolska 143 a
PL-52-013 Wrocław
Tel. +48 (0)71 342 10-83
Fax +48 (0)71 342 10-79
[email protected]
www.hach-lange.pl
HACH LANGE S.R.O.
Lešanská 2a/1176
CZ-141 00 Praha 4
Tel. +420 272 12 45 45
Fax +420 272 12 45 46
[email protected]
www.hach-lange.cz
HACH LANGE S.R.O.
Roľnícka 21
SK-831 07 Bratislava –
Vajnory
Tel. +421 (0)2 4820 9091
Fax +421 (0)2 4820 9093
[email protected]
www.hach-lange.sk
HACH LANGE KFT.
Hegyalja út 7-13.
H-1016 Budapest
Tel. +36 (06)1 225 7783
Fax +36 (06)1 225 7784
[email protected]
www.hach-lange.hu
HACH LANGE S.R.L.
Str. Leonida, nr. 13
Sector 2
RO-020555 Bucuresti
Tel. +40 (0) 21 201 92 43
Fax +40 (0) 21 201 92 43
[email protected]
www.hach-lange.ro
HACH LANGE
8, Kr. Sarafov str.
BG-1164 Sofia
Tel. +359 (0)2 963 44 54
Fax +359 (0)2 866 04 47
[email protected]
www.hach-lange.bg
HACH LANGE SU
ANALİZ SİSTEMLERİ
LTD.ŞTİ.
Hilal Mah. 75. Sokak
Arman Plaza No: 9/A
TR-06550 Çankaya/ANKARA
Tel. +90 (0)312 440 98 98
Fax +90 (0)312 442 11 01
[email protected]
www.hach-lange.com.tr
HACH LANGE D.O.O.
Fajfarjeva 15
SI-1230 Domžale
Tel. +386 (0)59 051 000
Fax +386 (0)59 051 010
[email protected]
www.hach-lange.si
ΗΑCH LANGE E.Π.Ε.
Αυλίδος 27
GR-115 27 Αθήνα
Τηλ. +30 210 7777038
Fax +30 210 7777976
[email protected]
www.hach-lange.gr
HACH LANGE E.P.E.
27, Avlidos str
GR-115 27 Athens
Tel. +30 210 7777038
Fax +30 210 7777976
[email protected]
www.hach-lange.gr
125
Contact Information
126
Section 11
Limited Warranty
Hach Company warrants its products to the original purchaser against any defects that are due to faulty
material or workmanship for a period of one year from date of shipment unless otherwise noted in the
product manual.
In the event that a defect is discovered during the warranty period, Hach Company agrees that, at its
option, it will repair or replace the defective product or refund the purchase price excluding original
shipping and handling charges. Any product repaired or replaced under this warranty will be warranted
only for the remainder of the original product warranty period.
This warranty does not apply to consumable products such as chemical reagents; or consumable
components of a product, such as, but not limited to, lamps and tubing.
Contact Hach Company or your distributor to initiate warranty support. Products may not be returned
without authorization from Hach Company.
Limitations
This warranty does not cover:
•
Damage caused by acts of God, natural disaster, labor unrest, acts of war (declared or undeclared),
terrorism, civil strife or acts of any governmental jurisdiction
•
Damage caused by misuse, neglect, accident or improper application or installation
•
Damage caused by any repair or attempted repair not authorized by Hach Company
•
Any product not used in accordance with the instructions furnished by Hach Company
•
Freight charges to return merchandise to Hach Company
•
Freight charges on expedited or express shipment of warranted parts or product
•
Travel fees associated with on-site warranty repair
This warranty contains the sole express warranty made by Hach Company in connection with its
products. All implied warranties, including without limitation, the warranties of merchantability and fitness
for a particular purpose, are expressly disclaimed.
Some states within the United States do not allow the disclaimer of implied warranties and if this is true in
your state the above limitation may not apply to you. This warranty gives you specific rights, and you
may also have other rights that vary from state to state.
This warranty constitutes the final, complete, and exclusive statement of warranty terms and no person
is authorized to make any other warranties or representations on behalf of Hach Company.
Limitation of Remedies
The remedies of repair, replacement or refund of purchase price as stated above are the exclusive
remedies for the breach of this warranty. On the basis of strict liability or under any other legal theory, in
no event shall Hach Company be liable for any incidental or consequential damages of any kind for
breach of warranty or negligence.
127
Limited Warranty
128
Index
A
Absorbance Check ................................................ 106
Absorbance Formula ......................................... 86, 87
Alphanumeric keypad .............................................. 23
Audio signals ........................................................... 28
B
Barcode Programs ................... 24, 51, 52, 53, 54, 55
editing ................................................................ 54
Basic data .......................................................... 42, 54
C
Calibration formula ................................................... 71
Calibration Settings .................................................. 62
Cell adapter ............................................................. 15
Chemical Form ............................................43, 47, 54
Chemical form .......................................................... 53
Cleaning
Display ..............................................................115
Spectrophotometer ...........................................115
Color selection ......................................................... 35
Concentration Factor ............................ 83, 84, 86, 88
Concentration Resolution ..................... 83, 84, 86, 88
Continuous Reading .......................................... 43, 45
Control bar ............................................................... 52
Cursor Mode ...................................................... 90, 92
Cuvettes/cells .........................................................115
D
Data ......................................................................... 36
deleting ........................................................ 36, 38
recalling ....................................................... 36, 38
sending ........................................................ 36, 38
storing .......................................................... 36, 38
Data Log .................................................................. 36
Data Storage ............................................................ 38
Date and Time ......................................................... 27
Dilution Factor ..............................................43, 46, 54
Display .......................................................23, 35, 115
Display and Sound ................................................... 28
Disposal ................................................................... 10
Drift Check ............................................................. 107
E
Editing Tests ............................................................ 50
F
Factory Service .......................................................110
Favorites ............................................... 24, 50, 76, 77
deleting ........................................................ 76, 77
editing ................................................................ 76
recalling ............................................................. 77
Filter Settings ........................................................... 37
Free programming ..........................68, 69, 71, 74, 76
H
HACH Data Trans .................................................... 37
Hazard Information .................................................... 9
I
Instrument Backup ..........................................112, 113
Instrument Information ........................................... 101
Instrument Setup .........24, 25, 43, 54, 84, 87, 91, 97
Integral ............................................................... 90, 92
Interfaces ................................................................. 30
Internet ............................................................. 56, 102
L
Lamp, see VIS-Lamp
Language ................................................................. 21
M
Main Menu ............................................................... 24
Maintenance ...........................................................115
Marking .................................................................... 99
Measurement Process ............................................. 68
Measuring sequence ................................................ 69
Multi Wavelength ............... 24, 60, 62, 86, 87, 88, 89
N
Noise Check ........................................................... 103
O
Operator ID .............................................................. 25
creating .............................................................. 25
deleting .............................................................. 26
Optical Checks ............. 102, 103, 105, 106, 107, 108
Output Checks ........................................................110
Overview of Product/Function .................................. 10
P
Password ................................................................. 33
activating ........................................................... 33
deactivating ....................................................... 35
PC and Printer ................................................... 30, 32
Printer Setup ............................................................ 30
Printing data ............................................................. 32
Programm overview ................................................. 24
Programming ........................................................... 57
R
Reading Mode ....................................... 43, 45, 84,
Reagent Blank ................................................... 43,
Recall Data ..................24, 39, 43, 54, 84, 87, 91,
Reference Scan ................................................. 90,
85
48
97
95
S
Safety Information ...................................................... 9
Sample blank ........................................................... 55
Sample ID ................................................................ 26
creating .............................................................. 26
deleting .............................................................. 27
Save as User Program .......................... 43, 54, 84, 86
Scale & Units ........................................ 91, 93, 97, 98
Security List ............................................................. 33
Select View .............................................................. 92
Self Check ................................................................ 21
Send Data .......................................37, 43, 54, 90, 97
Service Time ........................................................... 111
Single Reading ......................................................... 43
Single Wavelength .......24, 43, 45, 59, 62, 83, 84, 85
Software ........................................................... 56, 102
Spezifications ............................................................. 7
Standard Addition .............................................. 43, 78
Standard Adjust ................................................. 43, 47
Stored Data .............................................................. 36
129
Stored Programs ..........24, 42, 43, 44, 46, 47, 48, 50
sending Data ..................................................... 43
Stray Light Check .................................................. 105
System Check ...................................................21, 111
System Checks .....24, 101, 103, 105, 106, 107, 108,
110, .........................................................................112
T
Time & Interval ................................................... 97, 98
Time Course ..............24, 38, 39, 40, 41, 97, 99, 100
Time Course Scan Reading ..................................... 98
Timer ........................................ 28, 43, 44, 54, 83, 86
Touch Screen .......................................................... 23
Troubleshooting ..................................................... 121
U
Unpacking the instrument .........................................11
Update ............................................................. 55, 102
Updating Tests ......................................................... 50
User Programs ................................................... 24, 57
V
Variables .................................................................. 74
Verification Kit ........................................................ 108
View Table ............................................................... 97
VIS-Lamp
Lamp Control
Lamp History ....................................................110
W
Warranty ................................................................ 127
Wavelength ........................................................ 83, 86
Wavelength Check ................................................. 103
Wavelength Range .................................................. 91
Wavelength Scan .........24, 38, 39, 40, 41, 90, 91, 94
Wavelength setting .................................................. 97
Wavelength spectrum .............................................. 90
130