1
Page 1
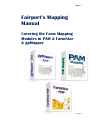
Fairport’s Mapping
Manual
Covering the Farm Mapping
Modules in PAM & FarmStar
& gpMapper
Copyright Fairport Technologies
Page 2
Chapter 1
Installation and Getting started
5
5
Welcome to Fairport’s Suite of Mapping Software
6
Licence and warranty information
7
Software licence
Update Policy
Warranty
Trademark Acknowledgments
Registering the Mapping programs
About this manual
How can we help you get the best from your software?
What you need to run the Mapping software
Data file compatibility
Program operating speed
7
7
8
9
10
11
11
12
13
13
Installation
13
How to start your mapping program
Help !!
What can’t I do in the demonstration version?
What can I do in the demonstration version?
Getting started
14
14
14
14
14
Chapter 2
Let’s Go Mapping…
17
17
General tips and Concepts…
Navigating around the map
Zooming In
Zooming Out
Panning
Hot Tips
Drawing Overview and Tips
The Layer Quick Selector
The Drawing Toolbar
Finishing drawing an object
Traps for young players
Setting the style of an object
Snapping Points
Selecting an object for editing or deleting
The Layer Manager
Photos and images - how do we get them?
Aerial photography
18
21
21
22
23
23
24
25
26
27
27
28
29
30
31
33
33
Copyright Fairport Technologies
Page 3
Installing or Importing an aerial photo or other image
Geo-locating your image
Editing the shape of an image
Exporting an Image
The Measurement tool
35
36
38
39
40
Chapter 3
Printing Your Maps
42
42
The Steps for Printing your Maps
The Print Prepare Screen
Manually Resizing the Map
Displaying Multiple Maps on your Printout
Saving and Using Saved Layouts
Setting the Scale of Map Sections
42
44
45
46
47
48
Chapter 4
PAM Data and Your Maps
49
49
The Demo Farm & other Demo Maps & Views
Setting up your farm maps and views to work with PAM data.
To draw paddocks
To draw arable areas
Associating your paddocks and arable areas to their map objects
Setting up “Views” for data entry and map reports
Should I use the map for data entry?
Creating paddock names…
Using your Maps for Entering Crop Data
Using your Maps for Moving Stock
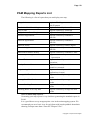
PAM Mapping Reports List
How to Make Map Reports…
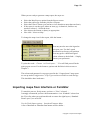
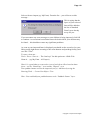
Importing maps from Interfarm or FarmStar
50
50
50
51
51
52
53
53
53
56
58
58
59
Chapter 5
Importing and Exporting Map Data
61
61
Types of Map Data you can import
Special instructions for creating MapInfo “MIF” files
for importing into Fairport’s mapping programs
Steps for setting up a Farm Map with a GPS logger
or with SkyMapper
Exporting to another gpMapper or PAM program
Exporting to other Mapping Software
61
61
62
62
63
Chapter 7
Live Mapping with gpMapper or FarmStar
64
64
Satellite Information
65
Copyright Fairport Technologies
Page 4
GPS Offset
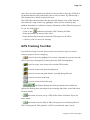
GPS Tracking Tool Bar
Hot Keys
Draw Options
Automatic Settings
Drawing Waypoints
Interface to Garmin GPS Unit
Using the Garmin GPS Interface
Creating Polylines and Polygons
GPS Tracking Tool Bar
Hot Keys
Draw Options
Automatic Settings
Drawing Waypoints
Interface to Garmin GPS Unit
Using the Garmin GPS Interface
Creating Polylines and Polygons
65
66
67
67
69
69
69
70
70
67
68
68
69
70
70
70
71
Index
72
Copyright Fairport Technologies
Page 5
Chapter 1
Installation and Getting started
Contents
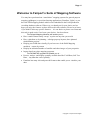
Welcome to Fairport’s Suite of Mapping Software
The Fairport Mapping Modules will enable you to...
The FARMSTAR upgrade will enable you to...
Software licence
Update Policy
Warranty
Trademark Acknowledgments
Registering the Mapping programs
About this manual
Symbols and conventions used in this manual
How can we help you get the best from your software?
The program error trapping system
What you need to run the Mapping software
Data file compatibility
Program operating speed
How to start your mapping program
Help !!
What can’t I do in the demonstration version?
What can I do in the demonstration version?
Can I delete all the demo map views?
Getting started
Copyright Fairport Technologies
6
6
6
7
7
8
9
10
11
11
11
12
12
13
13
14
14
14
14
14
14
Page 6
Welcome to Fairport’s Suite of Mapping Software
You may have purchased our “stand alone” mapping systems for general purpose
mapping (gpMapper) or precision farming applications (FarmStar „Light‟) or you
have the PAM mapping module which come embedded in the PAM production
recording database software. Either way, we thank you for your choice and we
hope you enjoy the features we have delivered in this software. Please let us know
if you think it lacks any specific features… it is our desire to please our clients and
this task is made easier if we know your desires. Just let us know.
The Fairport Mapping Modules will enable you to...
Have a multi-featured map “on tap” to print out any time you need it
Have a platform to do planning - redesign property layouts, draw planned
rehabilitation projects
Display your PAM data visually (if you have one of the PAM Mapping
modules) - season by season
Display an unlimited number of satellite and other images of your properties.
Import data from other mapping programs.
The FARMSTAR upgrade will enable you to...
Process, analyse and display spatially variable data like Yield Data, Soil Test
Data… any data that varies spatially.
FarmStar has many rich and powerful features that enable you to visualise your
data.
Copyright Fairport Technologies
Page 7
Licence and warranty information
Software licence
FTI (1997) Pty Ltd, PO Box 1046, South Perth, Western Australia ("Licensor" which expression includes its
subsidiaries, agents, successors and assigns) is authorised to license this mapping software and related
documentation (collectively "the Software").
Upon opening the sealed package and by using the Software , the end user ("You") accepts a non-exclusive,
non-transferable Licence to use the Software on a single computer with a single CPU in accordance with the
terms of this Licence. You may not sub-license the Software.
You may not use (or cause to be used) the Software for rental or for any similar purpose. You may not
modify, network, loan, distribute or create derivative works based upon the Software in whole or in part.
You may not electronically transfer the Software from one computer to another over a network.
Restrictions on Use
You may not distribute unauthorised copies of the Software or accompanying written materials to others.
You may not modify, adapt, translate, reverse engineer, decompile, disassemble, or create derivative works
based on the Software. You may not modify, adapt, translate, or create derivative works based on the written
materials without the prior written consent of Licensor.
Backup Copies
You are allowed to make one backup copy of the Software. You must reproduce the copyright notice on the
backup copy.
Licence Fee
You must pay the Licence fee as determined at the time of entering into this Licence to Licensor or to one of
Licensor's nominated dealers or distributors.
Title
Licensor retains title and ownership of the Software recorded on the original disks and all subsequent copies
of the Software, regardless of the form or media in or on which the original and other copies may exist. The
Licence is not a sale of the original Software or any copy.
Industrial and Intellectual Property Rights
You acknowledge that any and all of the trademarks, trade names, trade secrets, copyright, and all other
intellectual property rights used or embodied in connection with the Software are the sole property of
Licensor. You will not during or at any time after the expiry or termination of the Licence in any way
question or dispute the ownership by Licensor of any such rights.
Termination
The Licence continues in effect until terminated. The Licence will terminate automatically without notice
from Licensor if you fail to comply with any provision of this Licence or if Licensor refunds the Licence fee
to you. If the Licence is terminated, you must return to the Licensor the written materials and all copies of
the Software, including backup copies, if any.
Update Policy
Licensor may create, from time to time, updated versions of the Software. At its absolute discretion, Licensor
may make such updates available to you if you have paid the update fee and returned the Registration Form to
Licensor. Any update provided by Licensor to you will be governed by the terms and conditions of this
Licence and a reference to Software in this Licence means and includes any such update.
Copyright Fairport Technologies
Page 8
Warranty
Licensor warrants to you that the disks upon which the Software is recorded are free from defects in materials
and workmanship under normal use and service for a period of ninety (90) days from the date of delivery as
evidenced by a copy of the receipt.
If within ninety (90) days you notify Licensor of a defect in the Software which is not caused by use, abuse,
accident or misapplication, then Licensor will at its discretion either:
(a) Return the Licence fee; or
(b) Replace the Software.
In the event that the Software is replaced pursuant to this clause, then the replacement will be warranted for
the remainder of the original warranty period or thirty (30) days, whichever is longer.
Licensor does not warrant that the Software is error free or that use of the Software shall be uninterrupted.
Liability of Licensor
Except as expressly provided to the contrary in this Agreement, all terms, conditions, warranties,
undertakings, inducements or representations whether express, implied, statutory or otherwise relating in any
way to this Agreement, are excluded. Without limiting the generality of the preceding sentence, Licensor is
not under any liability to You in respect of any loss or damage (including consequential loss or damage)
however caused (whether by negligence or otherwise and whether as a result of loss of, damage to or
corruption of data or otherwise) which may be suffered or incurred or which may arise directly or indirectly
in respect of the Software or the failure or omission on the part of Licensor to comply with its obligations
under this Agreement.
Where any Act or Parliament implies in this Agreement any term, condition or warranty, and that Act avoids
or prohibits provisions in a contract excluding or modifying the application of or exercise of, or liability
under such term, condition or warranty, such term, condition or warranty will be deemed to be included in
this Agreement, but the liability of Licensor for any breach of such term, condition or warranty will be
limited, at the option of Licensor, to any one or more of the following:
(a) if the breach relates to goods;
(i) The replacement of the goods or the supply of equivalent goods;
(ii)The repair of such goods;
(iii)The payment of the cost of replacing the goods or of acquiring equivalent goods; or
(iv)The payment of the cost of having the goods repaired; and
(b) If the breach relates to services:
(i) The supplying of the services again; or
(ii) The payment of the cost of having the services supplied again.
You warrant that you have not relied on any representation made by Licensor which has not been stated
expressly in this Agreement or on any descriptions or illustrations or specifications contained in any
document including any catalogues or publicity material produced by Licensor.
Waiver
Subject to this clause, any failure by Licensor to enforce any clause of this Licence, or any forbearance, delay
or indulgence granted by Licensor to you, will not be construed as a waiver of Licensor's rights under this
Licence.
Entire Agreement
This Licence constitutes the entire agreement between the parties for the subject matter referred to herein.
Any prior arrangements, agreements, representations or undertakings are superseded. No modification or
alteration of any clause of this Licence will be valid except in writing signed by each party.
Severability
If any provision of this Licence is held invalid, unenforceable or illegal for any reason, this Licence shall
remain otherwise in full force apart from such provision which shall be deemed deleted.
Governing Law
This Licence will be governed by and construed according to the laws of the State of Western Australia. You
hereby consent to the jurisdiction of the courts of Western Australia.
Rights Reserved
All rights not expressly granted in this Licence are reserved by Licensor.
Copyright Fairport Technologies
Page 9
Trademark Acknowledgments
Windows, Access, Works and Excel are registered trademarks of Microsoft
Other products and marks mentioned in this documentation are trademarks or registered trademarks of the
respective owners.
Copyright Fairport Technologies
Page 10
Registering the Mapping programs
If you are installing one of the “stand alone” versions of the Fairport mapping
programs… on your first run of the program you will be requested to enter your
trading name, address and other details. This information is required by the
program before it can operate.
The program needs a serial number entered into it before it is completely
"unlocked"… However, you will be able to run the program 20 times. After the
20th run, you will still be able to print a registration form and unlock your
program but you can no longer gain access to the program proper.
Each time you run the software before it is registered, you will see a panel
indicating the number of runs you have left. You‟ll also see the Print Rego
Form button and the Register button.
A special program registration form must be printed from the program. This form
has on it a 15 digit number which Fairport Technologies will use to generate your
9 digit customer serial number. To receive you unlock number, please fax the
form to the number printed on it.
By registering, you will help us to know your hardware configuration and you will
be entitled to the following benefits:
Fairport Club membership for six months which entitles you to
use our Toll Free 1800 help line and receive free minor
upgrades.
Information on upgrades or revisions to the software
Free support "help notes" (which are mailed out from time to time to all
registered users).
Copyright Fairport Technologies
Page 11
About this manual
This user's manual is a comprehensive guide that contains all of the procedures
you need to operate the program efficiently and effectively.
The program has "on-line" help which can be accessed by pressing the <F1>
function key.
Symbols and conventions used in this manual
Program menu items are written in Italics and if we are referring to a sub-menu
item or a sub-sub-menu item, we write it thus ...
Main menu item/Sub-menu item/Sub-sub-menu item.
Mouse buttons are also in italics but we put “Quotes” around the button caption.
When we refer to the ARROW keys or the CURSOR keys we are talking about
the keys used to move the cursor or menu selection highlight bar.
When referring to a key on your keyboard we use angled braces: <Enter>
When referring to key combination we use this method : <Alt+F7>
Meaning : Hold down the <Alt> key then press <F7>.
When referring to a mouse button we use :
Click on the Cancel button.
When referring to things you need to type we use courier font :
A:\setup.exe
How can we help you get the best from your
software?
Fairport Technologies has the following support strategy. For the first six months
you have free access to Fairport‟s Toll Free help line (Australia only). Thereafter
you will be invited to pay a fee for this service. The fee also entitles you to
Fairport Club membership which has other benefits like automatic software
updates.
Before you call either Fairport or your dealer, check in the printed material that
comes with the program for answers to your questions. Use the index table and the
table of contents to locate the area in the manual most likely to cover the problem.
You should also check the on-line help system in the program for possible clues.
Access this everywhere with <F1>. If the answer can't be found your next step is
to contact Fairport or the dealer who sold you the program.
Copyright Fairport Technologies
Page 12
Fairport Technologies offers a back-up help service to all dealers. If they can't
solve your problem, they will contact Fairport Technologies and we will do our
best to help you as soon as possible.
When using this service please bear in mind that the more information you can
give us, the more able we will be to answer the problem. If at all possible a fax is
preferable to a phone call. A fax will give us “hard copy” of your query and we
can then prepare a written response.
Fairport Technologies can be contacted on the Internet... our email address :
[email protected]
We also have a web site .... http://www.fairport.com.au
The program error trapping system
The program has an error trapping system to catch any program errors that may
have missed our testing processes.
If you should ever see the error trapping system warning message you will see that
you are given a range of choices.
In general it is advisable to select Abort.
A file is maintained behind the scenes and the information that is contained in this
file is very handy to us when attempting to locate and fix the problem. So, please
take a moment to print the error messages, should you see one on your screen.
You can then either email, fax or post the printout to Fairport Technologies and
we will act on the problem as quickly as possible.
What you need to run the Mapping software
It will work with most IBM and compatible computers available today. Although
in theory it will operate on any IBM PC that is capable of running Microsoft
Windows® 95, 98 or NT, it does require a reasonably powerful computer to run
well... but, as a general rule of thumb, if your computer is able to run Microsoft
Windows® 95, it is powerful enough to run it.
The minimum requirements are :
A computer with one hard disk a CD ROM drive or one floppy disk drive and
640k of RAM, 16 megabytes of Upper memory and the Windows 95
operating system. We recommend a Pentium processor 150 Mhz or better and
32 Megabytes of RAM or better.
Screen type : a SVGA screen or better is recommended operating at a
resolution of 800 X 600 or better. We recommend that your screen is set to
display more than 256 colours. To set your computer to operate with these
settings, seek help from your hardware supplier.
Printer requirements: it will print out on any printer supported by Windows.
Copyright Fairport Technologies
Page 13
Data file compatibility
The data files used by this program are 100% Microsoft Access 97 compatible.
Any text output files created by this program are in ASCII text format. They can
be edited by any word processing program.
Program operating speed
This program is a true "relational" database system and the operation involves a
lot of disk reading and writing. The speed of operation will depend greatly upon
the speed of your hardware (ie. the "clock" speed of your processor and the disk
drive access speed). As the data files grow in size, the time needed to access that
data will increase. This should be more obvious in reporting than in other areas of
program operation.
This is a fact of life in large database systems. Much effort has been and will
continue to be devoted to reducing the processing time throughout the program
wherever possible.
It will run much faster on more modern computers especially those which have
extra memory installed.
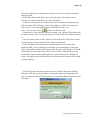
Installation
If your program arrived on a CD ROM, insert it in your CD drive and it will
“Auto-run”. You will see a series of selection buttons… some are to run the
guided tour of either PAM or other Fairport products, some are for installing our
software. Select the software you are intended to install by clicking on its button.
If your software arrived on floppy disks do this :
1. Select the Run option on the “Start” menu
2. Type
A:\SETUP in the Open box.
3. Click
OK
The installation procedure creates the directory PAM on your hard disk, then
copies the files into that directory. The program files will then be "unpacked" - a
process which may take several minutes.
The installation process will create an icon on your desktop area as well as a menu
option in your “Start” menu (look under Programs).
If you are installing the “stand alone” version of the mapping software… The icon
will bear the name gpMapper or FarmStar Light.
Copyright Fairport Technologies
Page 14
How to start your mapping program
The installation program will create an icon on your desktop area of your
computer. There will also be a new option on your “Start/Programs” menu…
Select one of these… either the desktop icon or the Start menu item to run the
program.
Help !!
The on-line help system is quite comprehensive, in fact it is really a manual “on
line”.
To access the help system, either press F1 or click on the Help option on the
menu.
What can’t I do in the demonstration version?
You can‟t set up new maps. This means that the only map you can look at and
play with is the ones we ship with the demo.
You can‟t save your data… so all the work you do will be deleted at the end of
your runtime. You can‟t load any new images.
What can I do in the demonstration version?
You can draw objects, add layers, create layer groups… In fact you have full
access to all facilities except loading new images.
You should spend time testing the functionality of the software using the
demonstration map views… Get familiar with the drawing tools, the navigating
and zooming tools. The next chapter will guide you through those tasks.
Can I delete all the demo map views?
By all means. When you register your program and the system will then enable
you to save your work… delete all or any of the demonstration map views.
Getting started
The first step is to run the program... do this by double clicking on the program
icon in Windows.
If you are a running the PAM Production database software with integrated
Mapping it is important that you first set up your properties and production units
(paddocks, blocks, fields etc) via the PAM Configuration menu. The mapping
system will then look for the farm data directory to associate the areas you draw
with the production units in your database.
Copyright Fairport Technologies
Page 15
In the next chapter we‟ll talk about some of the general program concepts…
Layers, views, map objects, symbols etc. I recommend you read it before you
move on to use the program.
Copyright Fairport Technologies
Page 16
The next chapter will guide you through the most important aspects of the
program… If you read nothing else, make sure you read Chapter 2.
Do you know about “RIGHT MOUSE ZOOMING” ?
Before you get starting with PAM’s mapping module, check out
the Help system for the concept of RIGHT MOUSE ZOOMING.
While you’re there, make sure you check out the concept of
“Views”
Copyright Fairport Technologies
Page 17
Chapter 2
Let’s Go Mapping…
Contents
General tips and Concepts…
A Map Object…
A Layer…
A View…
A Map…
A Layer Group…
More on Layers…
Navigating around the map
Zooming IN
Zooming OUT
Zooming to Full View
Zooming to a Selected Object
Panning
Drawing Overview and Tips
The Layer Quick Selector
The Drawing Toolbar
Finishing drawing an object
The “Style” button
Traps for young players
Setting the style of an object
A polygon, rectangle or circle style
A line style
Text style
Symbol style
Snapping Points
Zooming in and out while drawing
Panning while drawing
Selecting an object for editing or deleting
The Layer Manager
Add, Delete, Rename and Move a Layer Group
Copyright Fairport Technologies
18
18
19
20
20
21
21
21
21
22
22
22
23
23
25
26
27
27
27
28
28
28
28
29
29
29
30
30
31
31
Page 18
Add, Delete, Rename and Move a Layer
Photos and images - how do we get them?
Aerial photography
Image Resolution
Accuracy of aerial photography
Satellite imagery
Installing or Importing an aerial photo or other image
Geo-locating your image
If you know the location of two points on your image:
Editing the shape of an image
When would you want to do this?
Exporting an Image
The Measurement tool
How do you measure polygons on your layers?
General tips and Concepts…
We recommend that you read this chapter before leaping into creating your own
maps. We also recommend that you familiarise yourself with the following
concepts and instructions using the demonstration maps supplied with the
software.
When you have mastered these few and simple concepts you are well on your way.
Like all comprehensive and sophisticated software, our mapping programs have
several concepts that you need to understand before you really start flying…
A Map Object…
Map objects are:
Polygons: Polygons are closed areas which are defined by individual points
that draw on the map. These are used to draw the filled areas such as areas of
salt. For polygons you can specify their colour, the pattern of the filled area
and the thickness of the border.
Lines: These are used for objects such as Power Lines, Roads and Cables.
For lines you can specify the line style, colour and the line thickness.
Circles: Circles are used to represent Circular Production areas, “centre
pivot” irrigation systems or whatever you may care to use them for.
Copyright Fairport Technologies
31
33
33
34
34
34
35
36
36
38
38
39
40
40
Page 19
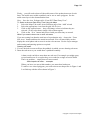
Rectangles: Rectangles have a special purpose… for creating print areas. You
may also find rectangles useful for another purpose… perhaps other regular
shaped objects. Rectangles can be used as representatives of production units
(eg. Paddocks, fields, blocks) when connecting to the PAM production
recording database.
Points: Use points to represent small objects (single point locations) like soil
sample or crop monitoring sites.
Symbols: Use symbols to represent things like gates, buildings, pumps,
windmills, air strips, bridges and other man made objects and structures.
Text: Add labels to your map. Labels can be attached to any layer. Labels can
be scaled and will grow and shrink as you zoom in and out… or you can make
them a fixed size. We‟ll look at these options in more detail later.
A Layer…
A layer is a collection of map objects that you draw or import (eg. Aerial photos).
You decide which objects belong together on a layer. A layer can either be on
display or not… when a layer is on display, all objects on that layer are on display
together. We provide you with a “Layer Manager” and a “Quick Layer Selector”
to manage your layers.
A layer can be any one of, and indeed any combination of the following:
“Raster” images or photos (eg. Scanned aerial photos) or satellite images, yield
maps, soil type images… any views of the world in a “raster” format!
“Vector” data… lines, circles, polygons, points that someone has drawn using a
mouse… These objects represent objects on the earth‟s surface… sometimes
objects like rivers, lakes, height contour lines (natural features) and sometimes,
roads, fences, telephone lines, power lines and other man made features (cadastral
data).
Symbols… small icons that represent objects on the earth‟s surface… usually man
made objects like dams, tanks, buildings,
Layers can be on display or not… It‟s a simple mouse click to show or hide a
layer.
You can “Lock” a layer… this is a useful feature… it stops you from accidentally
editing or deleting an object on a layer. If you want to unlock a layer to enable the
editing or deleting of a map object that is just a single mouse click.
How many layers can you have on a map? As many as you want!
So to re-cap… a layer is a collection of map objects that you draw or import (eg.
Aerial photos). You decide what objects belong together on a layer. A layer can
either be on display or not… when a layer is on display, all objects on that layer
are on display together. We provide you with a “Layer Manager” and a “Quick
Layer Selector” to manage your layers.
Copyright Fairport Technologies
Page 20
A View…
A view is a set of visible map layers within a defined area. In our case the
bounding area is a computer screen. To create a view you use the zooming and
panning facilities to zoom in to or out to an area of the map you would like to save
as a view. Then decide on the layers you want visible in your view… set the
required layers “on”… then save the view using a name that has a relevant
meaning. Use File/Save View As… to save your new views.
How many views of your map can you have? As many as you want!
You‟ll find views are an extremely useful and powerful feature of the program.
Your map can consist of as many views of the world as you like. Let‟s just think
of it as your complete set of views of the world!
The most complex job you‟re going to face is managing your layers. To assist you,
we provide you with a Layer Manager. This enables you to
Create new layers
Delete unwanted layers
Rename layers
Change the display order of layers… Generally you‟ll want to keep your
images (scanned aerial photos etc) on the bottom layer, your vector (drawn)
layers stacked on top.
Organise your layers into “Layer Groups”
We also provide a “Layer Quick Selector”… (the Hot Key to see this is F4)
this sits on the left side of your screen (when it’s on view) and enables
you to
quickly hide or show layers,
select layers for editing (ie. Adding more objects to a layer, and
editing existing objects)
lock or unlock layers (to enable selection with the mouse for editing).
We provide a “View Quick Selector”…(the Hot Key to see this is F5) this also sits
on the left side of the screen (when it‟s on view) and enables you to quickly move
from one view to another.
A Map…
A map is a set of layers of objects that are representations of the earth‟s surface…
One map can have many (unlimited) views of the world. It can have an unlimited
number of farming properties on it with an unlimited number layers.
Copyright Fairport Technologies
Page 21
A Layer Group…
A Layer Group is a collection of layers that you can create and name. They enable
you to keep your layers better organised. Layer groups can be added, named,
renamed and deleted.
How many layer groups can you have on a map?
As many as you want!
You could have a layer group called “Maps of the world”, another called “Current
Farm Layout”, another called “Future plans”.
More on Layers…
As mentioned above, layers can be a combination of object types. Lines, polygons,
points, images, labels, circles, rectangles. This is a powerful feature... even your
scanned aerial photo belongs to a layer that can also have labels or any other
object on it.
When you hide your “Aerial Photo” layer, all objects on that layer are hidden.
So when you create a new layer, you are not required to define an object type for
your new layer… because you can have any object type on it!
Each object type on a layer can have its own style…
A object‟s style can be defined as one of or a combination of the following
(depending on the type of object it is)
line pattern, line colour, line thickness
font, font size, font style, font colour
fill pattern, fill colour
We provide you with a style selector to enable the setting and editing of
object styles.
Navigating around the map
Zooming In
There are two ways to zoom in on the map. Zooming in allows you to focus on a
smaller area of the map.
Copyright Fairport Technologies
Page 22
Method 1 : We call it “Right Mouse Zooming”
Decide which area of the map you would like to zoom in on... then, move the
mouse cursor to the top left corner of that area, hold down the RIGHT mouse
button and drag the mouse down to the bottom right corner of the area. You will
see the area you have selected outlined on the screen.
Release the RIGHT mouse button and the screen will redraw with the area
selected, enlarged to the display area size.
Method 2
Select the “Zoom In” button from the main toolbar. This will enlarge
the map by 20%
Zooming Out
Zooming out allows you to see more of the map.
Method 1
Select the “Zoom Out” button from the toolbar. This reduces the zoom
by 20%
Method 2
If you want to zoom out to the full scale view the quickest way to do this is to
click your left mouse button on the “Reset View” button on the tool bar.
Zooming to Full View
Click this button to revert your zoom to the full view (that is your
currently selected view).
Please Note: A view is a set of visible map layers within a defined
area. If you have switched any layers “on” that were not
originally visible they will be turned “off” by clicking this button.
Zooming to a Selected Object
Click this button to zoom to an object that you‟ve selected.
How do you select an object?… You make sure you have the “Selector”
button down then click on the object (always with the left mouse
button). You‟ll know when you‟ve selected an object… its “Drag
Handle(s)” will be on show. You‟ll find the “Selector” button will be your most
useful button.
Copyright Fairport Technologies
Drag Handles
Page 23
Panning
Panning is the name for moving the map about the screen.
To pan, select the “Drag View” or “Panning” button on the tool bar…
click the left mouse button on the map and holding it down, drag it in
whichever direction you like… Notice that the mouse cursor changes to
a small Hand shaped object… The map will move with your mouse. The best way
to understand this functionality is to experiment with it. You will soon discover
how simple it is.
Hot Tips
Right Clicking on this window gives you access to
many useful facilities…
Add – Add a new Layer or
Layer Group
Delete – Either the selected
Layer or Layer
Group
Rename – Either the selected Layer or Layer Group
Hide All & Show All – Layers within the selected Layer Group
Move Up & Move Down – Move the selected Layer or Layer Group
Zoom to – The selected Layer
Note also the +ve and –ve signs down the left of the layer list. Use these to
collapse and expand your layer groups.
Copyright Fairport Technologies
Page 24
Drawing Overview and Tips
To begin drawing, you must first select the layer on which you want to create
objects, from either the Layer Manager or from the Layer Quick Selector list…
On the Layer Quick Selector click on the layer name… you‟ll see a pencil icon
alongside the name to indicate that you‟re in drawing mode.
Copyright Fairport Technologies
Page 25
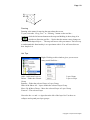
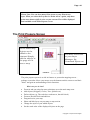
The Layer Quick Selector
Access this list by press F4 or by selecting Show / Layer Quick Select. You‟ll see
the currently available layers listed in their layer groups listed in the order that you
can set in the Layer Manager.
The Padlock indicates this layer is
“Locked”
The light globe indicates
this layer is on display
Unlocked, not on dislpay.
Selected for drawing or editing
So... get into drawing mode by
1. Selecting a layer
2. Clicking on the Drawing Tools button… see on the following page.
3. Then click on the new object type button… and then the “Create Object”
button.
There are seven object types you can draw or add.
Polygons: Polygons are closed areas which are defined by individual points
that draw on the map. These are used to draw the filled areas such as areas of
salt. For polygons you can specify their colour, the pattern of the filled area
and the thickness of the border.
Lines: These are used for objects such as Power Lines, Roads and Cables.
For lines you can specify the line colour and the line thickness.
Circles: Circles are used to represent Circular Production areas, “centre
pivot” irrigation systems or whatever you may care to use them for.
Rectangles: Rectangles: Rectangles have a special purpose… for creating print
areas. You may also find rectangles useful for another purpose… perhaps
other regular shaped objects. Rectangles can be used as representatives of
production units (eg. Paddocks, fields, blocks) when connecting to the PAM
production recording database.
Points: Use points to represent small objects (single point locations) like soil
sample or crop monitoring sites.
Copyright Fairport Technologies
Page 26
Symbols: Use symbols to represent things like gates, buildings, pumps,
windmills and other man made objects and structures.
Text: Add labels to your map. Labels can be attached to any layer. Labels can
be scaled and will grow and shrink as you zoom in and out… or you can make
them a fixed size. We‟ll look at these options in more detail later.
The Drawing Toolbar
Firstly you‟ll see that the drawing toolbar has some familiar buttons. Like the
main mapping toolbar, the drawing toolbar has “Panning” and “Selector”
buttons… also the “Layer Manager” button.
The first row of buttons:
Pan, Select, Add Points, Delete Points, Move points, New Object, Delete Object
See the
section on
Currently
snapping
Selected
later this
Layer
chapter
The buttons on the second row are used when you are creating new objects… use
them to tell the program the object type you are adding.
From the left: Polygon, Circle, Rectangle, Lines (“Polylines”), Text, Symbols,
Points.
Polygons
Drawn by left clicking at a starting point then clicking around the boundary with
the left mouse. You‟ll see the polygon evolving as you proceed. Right mouse click
to end.
Circles
Drawn by left clicking the top-left corner then the bottom right.
Rectangles
Drawn by left clicking the top-left corner then the bottom right.
Lines
Drawn by left clicking at a starting point then along the line with the left mouse.
Right mouse click to end.
Copyright Fairport Technologies
Page 27
Text
Added by left clicking on the map the position of the text… then type the text into
the text editor provided… click “OK” when done.
See Font/Style setting later this chapter.
Symbols
Added by selecting a symbol style using the “Styles” button (see more details later
this chapter)… then left click on the map to position the symbol.
Points
Added by clicking on the map with the left mouse. You‟ll notice that once you are
in add points mode, you‟ll remain in that mode… unlike some other add modes
which end when you click on the right mouse button.
Finishing drawing an object
When you are drawing a line or a polygon you will reach a point where you need
to stop drawing… “the end!”
You‟ll notice as you draw a polygon that it will always be closing itself back to
your starting point.
How do you tell the program you‟re finished?
To end a line or polygon object when drawing… Click once on
your right mouse button.
The “Style” button
This will pop up the object style setting form… if you are adding or editing text,
you‟ll see a font style and size selection form… if you are adding or editing
symbols you‟ll see a symbol selector otherwise you see the line and polygon styles
form. More on that later.
Traps for young players
Before you can start drawing an object you need to have selected a layer to draw it
on. You‟ll soon get used to this trap. Use either the Quick Layer Selector or the
Layer Manager to select your layer.
It is so easy to edit an object that you should not get too concerned with perfection
when drawing it.
The add points and subtract points modes are very quick simple and intuitive to
use… Even deleting an entire object and starting again is not onerous.
Copyright Fairport Technologies
Page 28
Please Note: The drawing toolbar can always remain on your
screen… it does not stop you from performing other tasks.
Setting the style of an object
A polygon, rectangle or circle style
Click on the “Style” button on the drawing toolbar.
To change the line width, style and colour choose the appropriate pick list and
choose the appropriate style or colour.
To change the fill colour, pattern and pattern colour… select the appropriate picklist and then the appropriate colour or pattern.
Please Note: If you prefer not to have a filled area, choose a
transparent fill style by checking the “Transparent” check box.
A line style
Using the same procedure as above… you only need to set the line style and
colour
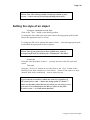
Text style
Using the “Pick Font” button on text entry form or the “Style” button on the
Drawing Tools form (whichever is convenient)… choose a font, choose its style
(normal, bold, italic, underlined)… now to choose its size…
If you want the text label to remain the same size regardless of
the zoom level or scale… choose the sizing option of “Points”…
these are the same points that you use when you are using a word
processor. You would tend to use this size option in the print
preview screen… we’ll talk about that later.
Copyright Fairport Technologies
Page 29
If you want the text label to remain in a size relative to your zoom
level ( recommended ! ) then use a sizing option of metres or
kilometres (depending on the scale of the map)… For farm
names try 500 metres. You may need to experiment with the sizes
until you are familiar with them.
Symbol style
Click on the style button on the drawing toolbar.
From there you can select the type of symbol to use for the job at hand and its
colour and size. The size of a symbol can either be in points or a distance (eg.
Metres). If you want a symbol to remain a constant size regardless of the zoom
level… use points, otherwise to make your symbols change size and remain
relative to your zoom level, use metres or kilometres.
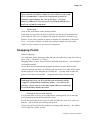
Snapping Points
What is snapping?
You will notice on the drawing toolbar that you can either have Snap off or have it
set to “Fine”, “Medium” or “Coarse”…
Snapping makes it easier for you to draw adjoining map objects… ones that share
a common boundary.
As you draw objects (particularly polygons and lines) on your map you turn
corners or change directions, by clicking your left mouse. You may need to draw
another polygon or line alongside an existing one… you may want to share the
points of one object with another… snapping makes this job much easier.
With snap turned on, you’ll see the line you are drawing will be
“snapped” automatically to adjoining points… try it and see for
yourself… If you want to see all other points (that you could snap
to) check the Show Points check box.
Zooming in and out while drawing
You‟ll notice that if you try to use right mouse zooming while you‟re drawing
you‟ll immediately end the drawing task. Oops!
You‟ll also notice that if you choose to click on either the zoom in or zoom out
buttons… that will end your drawing task as well.
Check your on-line help for the method of zooming while drawing… this facility
is to be added in a future version.
Copyright Fairport Technologies
Page 30
Panning while drawing
You‟ll notice that if you choose to click on the panning buttons… that will end
your drawing task as well. Check your on-line help for the method of zooming
while drawing… this facility is to be added in a future version.
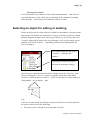
Selecting an object for editing or deleting
Before an object can be edited, deleted or added (for that matter!) you must ensure
that the layer on which it sits is unlocked. If a layer is locked you will see a small
padlock alongside its name in the Layer Quick Selector or you will see the word
“Locked” along side its name in the Layer Manager. Click you left mouse on the
padlock or the word “Locked”… depending upon the Layer Management list
you‟re looking at.
The Padlock indicates this layer is
“Locked”… Editing is not
enabled
The Pencil indicates this layer is
selected for drawing or editing
Once the layer is unlocked and selected for editing, select the “Drawing” tools.
Now by clicking the “Selector” button you put the system into select mode…
click on or inside an object to select it… you‟ll see the object is selected when its
“drag handles” are on display… thus
Tips
If you are in select mode and clicking on objects but they are not being selected…
the cause could be one of the following:
The object you are clicking is on a layer that is Locked
Copyright Fairport Technologies
Page 31
You are clicking on a line type object and you are not clicking near a point
along the length of it… always aim to click near a line‟s end or at a corner in
the line.
The system is still in another mode… try clicking on the “Panning” button
and then on the “Selector” button. Some of the program‟s modes are very
subtle and are there for a reason… we‟re trying to make the program learn
from you as you use it… sometimes it can guess wrongly!
Please Note: As you move your mouse over selected objects you
will notice the changes in the mouse cursor. The cursors indicate
the mouse mode… The hand cursor indicates “dragging” or
moving mode (ie. The whole object will move), the cross-hair
cursor indicates “point selecting” mode. When a point is selected
it can be moved individually.
You‟ll soon get the idea of the mouse cursor “modes”. Like the whole drawing,
editing, selecting system… they are very intuitive and you‟ll soon be comfortable
with them.
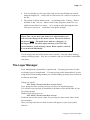
The Layer Manager
Layer management is potentially a complex task… Keeping your house in order,
not letting it get too complicated… You may not get to this situation but if you are
using the precision farming module you will most likely get many layers of data in
a relatively short time.
Things you can do…
Add, Delete, Rename and Move a Layer Group
Layer groups are there to help you keep your layers in organised groups.
You can move layer groups up and down to put them in a preferred order in your
list of layer groups.
Within a layer group you can…
Add, Delete, Rename and Move a Layer
Each time you need to create a layer for your map you must create it here in the
layer manager.
Once a new layer has been created its name will appear on your Layer Quick
Selector.
Copyright Fairport Technologies
Page 32
You should decide the “Stack Order” of your new layer. Do you want it on top of
all other layers? Do you want underneath all other layers? If it‟s an aerial photo
you most likely do.
Please Note: You can either use your left mouse to drag and drop
the layer names to change the stack order of your layers or you
can select the layer name then use the Move up, Move down
buttons.
Some layers in the PAM Mapping Modules are “Fixed layers”… these can not be
deleted but instead, all objects on those layers can be deleted simply by selecting
“Delete” in the Layer Manager.
Layer groups and Layers are
created here in the Layer Manager.
Layer and Layer Group “Stack Order” is
The using
columns
“Visible”
are self explanatory. They work in the same
altered
the “Move
Up”and
and“Editable”
“Move
way as
the light
globe
icon and
(on/off)
and the padlock (locked/unlocked) icon on the
Down”
buttons
(or by
dragging
dropping
Quick Selector.
theLayer
layer names).
The Show/Hide status and the
Locked/Unlocked status can also be set here.
Copyright Fairport Technologies
Page 33
The Padlock indicates this layer is
“Locked”… Editing is not enabled
The Light Globe indicates that the
layer is on display
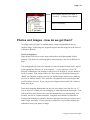
Photos and images - how do we get them?
An image can be any type of scanned photo, scanned topographical map or
satellite image. At this stage the program requires that the image be in the form of
a Windows Bitmap.
Aerial photography
Many people will have at some stage purchased an aerial photograph of their
property. The ideal size of photograph for each property is the size of half an A4
page.
The photograph will need to be scanned to create an image file that can be copied
to the appropriate directory on your computer… or you can have it on a CD.
Fairport Technologies can arrange for this process to be done if you are unable to
locate a scanner. Your image needs to be in the form of a Windows Bitmap file “BMP” file. Modern computer screens can display images which can be made up
of 16 to 16 million colours! This software is designed to work with images that
are 256 colours or better. If you can get your images scanned with 256 colours or
better, then do so.
Some state mapping departments can provide your images on a disk for you. If
you are not sure, contact your local mapping or lands department and enquire. You
will most likely need to provide as much information as you can regarding your
location. Section or Location numbers, Longitude and Latitude co-ordinates or
Easting and Northing co-ordinates, distance and direction from your nearest town
and a rough “mud map” of your property would all be very useful in helping the
authorities locate your photo or image.
Copyright Fairport Technologies
Page 34
Image Resolution
Resolution refers to the clarity of the scanned image when displayed on your
computer screen. The higher the resolution (the more “dots per inch”), the clearer
the image. Also the higher the resolution of the image, the larger the image file
size, the slower it takes to display on your screen. There is always a trade-off
between image resolution and display time.
If you have access to a scanner, it would be handy to have two images created
from your aerial photography - one at a high resolution to obtain a clearer image
when zooming in, and one with a lower resolution for looking at the full scale
view.
When ordering your scanned image, the rule(s) of thumb for scanning resolution
are :
Windows Bitmap file format (BMP), 256 colours or more.
The larger the scanned image, the longer it will take to display on your screen,
however we recommend you have your images scanned at 150 dpi. Or more.
If possible ask the image supplier to write down for you, the TOP-LEFT Corner
and BOTTOM-RIGHT Corner geo-locations (co-ordinates) of your property
boundary and also supply a photocopy of the exact location of those coordinates. The co-ordinates can be in longitude and latitude or in “XY” (UTM)
co-ordinates (in Australia these are called “AMG” or Australian Map Grid coordinates).
Accuracy of aerial photography
As you are probably aware, aerial photographs can be inaccurate in terms of their
representation of the earth‟s surface. Due to aircraft movement and to the lens
error of the camera used, aerial photographs can be “out” by tens of metres. There
is a process known as rectification that can be carried out to correct the errors.
Fairport Technologies can arrange for this process to be done if you require.
However, before we can proceed with rectifying we will need at least nine known
reference points on the image. That is nine surveyed points or G.P.S. readings to
work from. Please enquire if you require this service.
Using the editing facilities within the program you can shrink and stretch the
images in either length or breadth.
Satellite imagery
Satellite images can be used as your basic underlying image for drawing your
paddocks. While satellite imagery is relatively accurate compared to aerial
photography in terms of its “geo-location” the resolution of the images make it
difficult to see the smaller features. The most readily available satellite imagery is
“Landsat TM” which has 30m X 30m pixels (dots). “SPOT” imagery, which may
also be available for your area, has 20m X 20m pixels (that‟s 0.04 Ha in a dot).
Copyright Fairport Technologies
Page 35
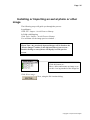
Installing or Importing an aerial photo or other
image
The following steps will guide you through the process
In gpMapper:
Click File / Import / Aerial Photo or Bitmap
In PAM with Mapping
Click Tools / Import / Aerial Photo or Bitmap
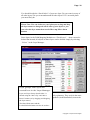
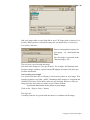
You will then see the image preview window…
Please Note: Any previously imported images will be listed on the
“Known Images” outline on the left hand side of your screen…
Double clicking on one of those will display it on the preview
screen.
Click this button to :
Show, delete and rename an image or to
set the view ing method of the image list
Click Select image…
Now, using the file location dialog,
Copyright Fairport Technologies
Page 36
find your image either on your hard disk or on a CD, floppy disk or wherever it is
located. When you have selected the image file (as shown above), click Open.
You will see this box…
Enter a meaningful description for
your image… eg. “Newlands Farm
Photo”
Now the image is registered in the
“Known Images” list…
The next step is geo-locating the image.
Note that some images are “pre-geo-located”. For example, Old Interfarm and
Farmstar images and those exported from ER Mapper all import with their geolocation information.
Geo-locating your image
You will need to have the co-ordinates of at least two points on your image. This
mapping software uses either “AMG” (Northings and Eastings) or Longitude and
Latitude (WGS 84 or GDA 2000) values for geo-locating. Be sure to ask your
image provider for at least two points in one of these formats.
If you know the location of two points on your image:
Click on the “Digitise Points” button.
The steps are:
Carefully locate the two points with the known co-ordinates on the image.
Copyright Fairport Technologies
Page 37
Please Note: When choosing two points, be sure to use points that
are as diagonally opposite each other as you can.
Ideally… Top Left and Bottom Right or Top Right and Bottom
Left corners.
Not doing this may cause undesirable results and distortion.
1.
Click on the first point with your left mouse button then a special dialog
appears…
enter the northing and easting value (or
longitude and latitude) for that point.
You can use the “Zoom” buttons to
assist you in this process if required…
or use your right mouse zooming
capability (ie. Lets assume you want to
zoom into a specific area of your
image…Click your right mouse on the
top-left corner of that area… now
holding down your right mouse button,
drag the mouse to the bottom right hand
corner of that area… now let the mouse button up)
2. Now click your left mouse on your second point and enter those co-ordinates in
the space provided. If you have made a mistake and want to abort, click on the
“Abort” button.
3. When you have done that, click on “Save”.
4. Now, if the program calculates that your image is not accurate, you will
warned.
Please Note: When choosing two points, be sure to use points that
are as diagonally opposite each other as you can. Not doing this
may cause additional errors and distortion.
If you make a mistake entering the co-ordinates for a point, you can choose
“Abort” or “Start Again”… depending on the circumstances.
Copyright Fairport Technologies
Page 38
If your image needs to be rotated to align it North-South, the program will perform
that task for you.
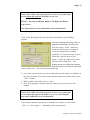
When you have your image geo-located, click on “Import Image to Layer”.
You are then asked to nominate a layer for your image… Yes! An image is placed
on a layer… You can have as many images for your map as you like. Each image
can either be placed on its own layer.
Close without importing an image
If some of the image has a coloured
(eg white) background, you can
change it
The program will display the Layer Manager for you to select your chosen layer
for this new image. Notice that the “Aerial Photos” layer is auto-selected.
Layers can be stacked in your chosen order when displaying them on your
screen… Obviously it would be wise to have one of you images (usually the main
aerial photo) as the base layer of all your map layers.
So remember…You can have any number of background images
for your map and each of those images can be put on their own
layer… and those layers can be stacked on top of each other in
your preferred stack order.
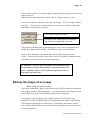
Editing the shape of an image
When would you want to do this?
If you have established a farm (or other) map using a DGPS system in conjunction
with logging software (like SkyMapper)… you may find that your image(s) are not
exactly lined up with the lines and shapes that you have imported.
For example, using SkyMapper and a DGPS system you can log lines and
polygons of a farm or property layout. This information can then be imported into
your mapping system and saved into layers. Generally this information will be
very accurate (within half a metre) and therefore may show up some discrepancies
in your aerial photos.
Copyright Fairport Technologies
Page 39
If you have an aerial photo layer under your imported logger data and you would
like to re-shape your photo to best match the data,
The image can be re-shaped using the following steps…
Click on the “Selector” button to get into select mode
Ensure the layer on which your image sits is Unlocked… perhaps you should
lock other layers to avoid selecting them in error
Click your left mouse on the edge of the image … you should now see its drag
handles
Using the drag handles (ie. Move your mouse over to one of the image drag
handles) hold down your mouse button while carefully dragging the image
shape into the preferred shape.
If the image is shaped ok but it is sitting in the wrong area… click on the body of
the image somewhere to display the hand shaped (dragging) cursor… holding
down the mouse button, drag the
image to its correct location.
Remember to “Lock” the layer that you have been working with when you are
finished.
Please Note: As you move your mouse over the image and close to
the “drag handles” will change the mouse cursor from a hand, to
a cross-hair. These cursors indicate the mouse mode… The hand
cursor indicates “dragging” mode, the cross-hair cursor indicates
“stretching” mode.
Exporting an Image
To import an image to be used by another Fairport Mapping system user or in
SkyMapper or any of the other software products that import our images…
Choose File or Tools / Export / Aerial Photo.
The export process is quite similar to the import system…
Select the image to be exported from the list.
Then click on the “Export” button. You can export the image file to a floppy disk
or any other disk drive on your computer.
Copyright Fairport Technologies
Page 40
You must supply a file name… always use a meaningful name that you can
recognise later.
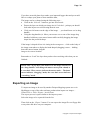
The Measurement tool
To measure lengths and or areas:
Click the “Measure
Distance/Area” button…
Now, start your measuring by clicking your left
mouse on the starting point…
The measure report panel pops onto the screen…
Now move to the next point and…
As you move your mouse you‟ll see the distance
changing… and the bearing displayed.
Now click... and as you move your mouse to the next point you‟ll see the area
changing. The area being calculated is the area from where your mouse is… back
to your first point.
As you continue measuring lengths, their total length is accumulated.
To stop measuring, click your right mouse button. Close the report panel by
clicking the [X] window icon.
How do you measure polygons on your layers?
As mentioned above, you can measure ad hoc polygons “on the go” with the
measuring tool… however you will obviously need to measure your drawn
polygons from time to time.
Here are the steps:
Ensure you have the “Selector” button down.
Click inside a polygon (or a series of overlapping or stacked polygons will display
a list of polygons and their areas.
Copyright Fairport Technologies
Page 41
If you only click inside one polygon, the area is displayed in the status bar across
the bottom of the screen.
You‟ll notice that the area you selected will have its “drag handles” showing. The
distance displayed is the polygon‟s perimeter.
You can only select and display a polygon’s area when its
layer is unlocked.
Copyright Fairport Technologies
Page 42
Chapter 3
Printing Your Maps
Contents
The Steps for Printing your Maps
Draw Print Rectangle(s)…
Layout via Current View
Layout via “Print Areas”
The Print Prepare Screen
What can you do here?
Displaying Multiple Maps on your Printout
Setting the position and size of map sections
Adding Additional Map Sections (Print Areas) to Your
Page
Setting layers on or off in different map sections
Saving and Using Saved Layouts
New Layout
Open Layout
Save Layout
Save Layout As…
Setting the Scale of Map Sections
Deleting a Scale Bar
In this chapter you will learn how to select print areas on your maps and how to
set up a presentable printed map.
The Steps for Printing your Maps
On the File menu in gpMapper (or the Tools button menu in PAM with Mapping),
choose the option Print Prepare.
This displays a submenu with the following options:
Copyright Fairport Technologies
42
43
43
43
44
44
45
46
47
47
47
47
47
47
47
48
48
Page 43
Draw Print Rectangle(s)…
This option enables you to draw one or more rectangles on your map that will be
used in the print prepare screen. You can have as many sections of a map on your
printed output as you want.. Obviously the page size will restrict you to only a few
map sections, however you will find this feature quite useful.
How To
Select the menu option… you will find yourself in drawing mode… the drawing
tools bar on display and the “Rectangle” object selected, the “Create Object”
button selected… ready for drawing.
Draw your print areas
By clicking in the top left corner of the designated area… moving the mouse down
to the bottom right corner then click the left button again.
You can repeat this process to draw a second area and as many extra areas you
might need for the current print job.
These print areas (rectangles) are recorded and saved for future print jobs… of
course if you don‟t require them again, simply delete them in the same way you
would delete any other map object.
Once you‟ve created your print areas… select the Layout via “Print Areas” option
to use your print areas.
Note that Print Areas belong in the “System” layer group. This layer group is used
for non-user mapping objects.
Layout via Current View
This option takes you to the print prepare screen using the current map screen
view and visible layers.
To make best use of this facility… zoom in or out and pan to the required part of
your map before selecting this option.
Layout via “Print Areas”
This option takes you to the print prepare screen using the currently available print
areas.
To use this facility, ensure you have defined one or more print areas using the
Draw Print Rectangle(s)… option.
Copyright Fairport Technologies
Page 44
Please Note: You can have many Print Areas on your Print Areas
layer. When you select the Layout via “Print Areas” option, only those
print areas that are fully in view on your current View will be displayed
and available on the Print Prepare screen.
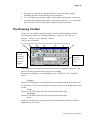
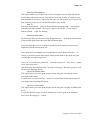
The Print Prepare Screen
All the usual map
objects can be
added to the
printout! Simply
add the objects to
the page as if it
were a map.
You have full access
to your Layer
Manager. Eg.
Unwanted layers can
be turned off.
The print prepare system is as rich in features as your main mapping screen…
perhaps even richer. Move your mouse over the buttons on this screen to read their
“hints” and gain an understanding of their functions.
What can you do here?
Zoom in and out using the same techniques as on the main map sreen.
Add objects (Polygons, Circles, Text, symbols etc)
Delete objects (eg. The scale bar, north arrow, the title block)
Zoom to the title block and add text.
Drag and resize your map
Show and hide layers on your map or map section
Change the styles of your added objects
Set the stack order of the displayed objects on the page
Copyright Fairport Technologies
Page 45
Set the scale for each map section that you select to be on your printout.
Using the Layer Manager on this screen you can turn layers on or off to suit. To
find out about the Layer Manager turn to chapter 2.
Please Note: The Layer Manager can only be accessed when you
have a map section selected. Select the map sections on the page
by clicking on them.
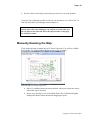
Manually Resizing the Map
Click inside the map rectangle this will “Select” the map. You will see a Black
Point on the Top Left & Bottom Right corners of the rectangle.
Once the Map is selected you can –
Move it by holding down the mouse button, when you release the mouse
button the map is released.
Resize it by moving to one of the Black Point (Top Left/Bottom Right)
holding the Mouse button down and dragging the point.
Copyright Fairport Technologies
Page 46
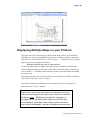
Displaying Multiple Maps on your Printout
Using the Draw Print Rectangle(s) option on the main screen, you can define
multiple (one or more) map sections as print areas. When you choose the menu
option File or Tools/Print/Print via “Print Area(s)…” you will see on your print
prepare screen your multiple selections.
Setting the position and size of map sections
Choose the map section to adjust using your mouse, drag and resize the map
section using the mouse to suit your needs. Notice that each map section has its
own scale bar… it‟s unlikely that each map section you created and selected has
the same scale.
Individual scale bars can be deleted if they‟re not required. To delete a scale bar,
select it then click the “Delete” button.
If you need to delete an entire map section simply select it by clicking on it …
then choose the “Delete” button.
Please Note: As you move your mouse over the map sections you
will notice the changes in the mouse cursor. The cursors indicate
the mouse mode… The hand cursor indicates “dragging” or
moving mode (ie. The whole object will move), the cross-hair
cursor indicates “stretching” mode. When a point is selected it
can be moved individually... thereby stretching the selected object.
Copyright Fairport Technologies
Page 47
Adding Additional Map Sections (Print Areas) to Your Page
The Tools / Add Map Section(s) from Your Main Map enables you to display
multiple instances of your drawn print areas or map sections.
Choose the option and the map sections will automatically add to your print
prepare page. You can then delete any unwanted sections, change the scales of any
section and change the visible layers and their stack order of any section.
Please Note: Sometimes map sections can be hiding behind
others… always check for this if you have “lost” a map section on
your page.
Setting layers on or off in different map sections
You may also want to show some layers on and some off in the different sections.
Simply…
select the section then…
using the layer manager on the print prepare screen make your adjustments.
Saving and Using Saved Layouts
Under the File menu you‟ll find the options:
New Layout
Beware! This option is designed to “blow away” your currently displayed map or
map sections and all the features on the print prepare layout… giving you a “clean
sheet”.
Open Layout
Select this option to see a list of pre-saved print layouts. This is a list that you will
add to as time goes by. A saved layout has on it all layers, text, objects, the scale
and indeed the complete print layout as it was when you saved it! Of course any
objects on a layer that have either been created or deleted or altered will reflect
those changes.
Save Layout
When you create a new layout or you update an existing layout, select this option
to update it.
Save Layout As…
After creating a new layout or after updating an existing layout, select this option
to save it under a new layout name.
Copyright Fairport Technologies
Page 48
Setting the Scale of Map Sections
On your print prepare page your map section will have a scale bar. You can easily
change the scale of a map by dragging/stretching the map section to the required
size.
The other method is to select the map section then choose the required scale from
the scale list.
If you don‟t want your scale bars to stay locked to your map sections, check the
Options menu for the Scales stick to Maps option.
If you want to see what the current map section scale is set to… zoom in on its
scale bar.
Deleting a Scale Bar
If you want to delete the scale bar, click on it to select it, then click the “Delete
Object” button.
Copyright Fairport Technologies
Page 49
Chapter 4
PAM Data and Your Maps
Contents
The Demo Farm & other Demo Maps & Views
Setting up your farm maps and views to work with PAM data.
To draw paddocks
To draw arable areas
Associating your paddocks and arable areas to their map objects
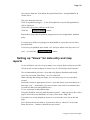
Setting up “Views” for data entry and map reports
Should I use the map for data entry?
Creating paddock names…
Using your Maps for Entering Crop Data
To Select an Area at Data Entry Time Using the Maps
What if you need to draw one or more sub areas
Drawing sub areas
Odd shaped sub areas ... examples
Using your Maps for Moving Stock
Setting up
PAM Mapping Reports List
How to Make Map Reports…
Importing maps from Interfarm or FarmStar
In this chapter you will learn how to generate map-based reports and how to enter
your data using the maps.
Copyright Fairport Technologies
50
50
50
51
51
52
53
53
53
54
54
54
54
55
56
58
58
59
Page 50
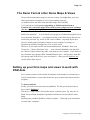
The Demo Farm & other Demo Maps & Views
We provide demonstration maps so you can see how you might draw your own
farm layout and as examples of views, layers and layer groups.
Q. Should I delete the demo farm and other maps when I install?
A. If you want to, but if you are upgrading to PAM from Interfarm or
Farmstar leave the demo maps in tact until you have imported your old maps
(See the topic “Importing Maps from Interfarm or FarmStar”).
Back to the question!… it won‟t hinder your progress or bother the program if you
leave the demo farm there… you might just delete some of the layers that are not
needed for you farm. Eg. Areas of Salt, Areas of Bush... Any map objects on a
layer are totally ignored and don‟t impact on your computer‟s memory or
operation speed unless brought into view on your screen.
However, if you want to delete the demonstration farm “Kambah” from your
Views list… Choose File/Open View … now select the Kambah view and click
the “Delete” button. Delete any other views that you don‟t require. If you delete a
layer from the layer group called “Standard Farm Layers”, and you have used this
layer group (and its layers) for your own farm(s)… then you will definitely not
want to delete these layers!
Setting up your farm maps and views to work with
PAM data.
Let‟s assume you have followed the instructions in the manual or on-line help to
load in a farm photo or some other method to get your basic farm layout into the
program…
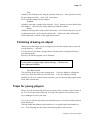
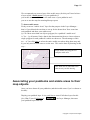
To draw paddocks
Firstly, you will want to draw all your paddocks. For this you‟ll need to have a
layer called “Paddocks”,
The choice of layer names for all other layers is entirely yours. Eg. Any one of:
Bush, Areas of Bush, Remnant Vegetation could be used to describe the same
thing.
Drawing your paddock should be relatively simple… following your aerial photo
or some other “template”.
Copyright Fairport Technologies
Page 51
We recommend you create a layer of the arable areas (for this you‟ll need to have
a layer called “Arable Areas”) of your paddocks if:
your arable areas are different to the total areas of your paddocks and…
you are to use the map for meaningful map reports
To draw arable areas
Firstly create an “Arable Areas” layer for that purpose in the Layer Manager…
that is if you deleted the one that we set up for the demo farm. Now zoom into
each paddock and draw your arable areas.
Q. Can I draw more than one object (polygon) for a paddock‟s arable area?
A. Yes… by all means. Notice that in the demonstration farm we chose to draw a
single polygon for each paddock‟s arable area however. The advantages of this
are… a) You click once to select the entire arable area when doing data entry and
b) you only need to click once to see the area This can be done by drawing in this
way…
Single arable area polygon for a
complex arable area.
This small area is connected to the
other area by careful drawing.
Associating your paddocks and arable areas to their
map objects
Once you have drawn all your paddocks (and their arable areas if you‟ve chosen to
do that):
Display your paddock layer. It is a good idea to turn off all other layers for this
job. (Hint: Turn off all layers in
the Layer Manager, then turn
your paddock layer back on).
Copyright Fairport Technologies
Page 52
Now choose from the Tools Menu the option Data Links / Assign Paddocks &
Arable Areas.
The steps from this point are :
Click on a paddock polygon… A list of all paddocks in your PAM paddock list
will be displayed.
Choose the appropriate paddock on the click.
Click the
button.
Repeat these steps until all paddock polygons have been assigned their paddock
name.
To assign your arable area polygons to their paddocks, repeat the process above
but ensure that:
Your have your paddock layer turned “off” and your arable areas layer turn “on”.
And… you click the
button.
Setting up “Views” for data entry and map
reports
As you will know, you can set up as many views of your farm or farms as you like.
Check out the section in chapter 2, about views in “General tips and Concepts”.
We recommend that you have a view that only displays Paddocks and Arable
Areas for your main “Data Entry” view for each farm.
When entering data using your maps, you can choose any view you may have
created…
Sometimes it may be appropriate to have a view that shows your aerial photo as a
data entry view… particularly if you need to draw a sub area for a treatment that
covered less than your total paddock area.
To use your maps to add paddock data:
Using the Paddock Activities Add Wizard as normal… when you get to the wizard
page to select the areas (Paddocks or Crops), click on the “Map” tab…
If you don‟t see a map displayed, choose a view from the views list on this tab
page.
Now click on the areas treated or if you need to draw a “sub-area” click on the
Draw Sub Areas… button to draw the area(s) treated.
Copyright Fairport Technologies
Page 53
For map reports, you can use a view that has only the Paddock layer on display…
Why? Because the map objects (polygons) that “contain” the data will be
displayed when you generate map reports…
For cropping and related reports, these will be the arable areas polygons, paddock
polygons or the sub-areas polygons that you draw at data entry time.
For livestock reports, these will be the paddock polygons.
Should I use the map for data entry?
The main purpose of providing you with a map at data entry time is to enable the
drawing of “Sub Areas”… that is where you have treated or planted less than the
whole area of a paddock.
You may find it quicker and easier to use the pick lists to enter data for activities
that covered the entire paddock or cropped area… the choice is yours!
Creating paddock names…
In the demo map we created a layer called Paddock Names for our paddock names.
You could use that layer (if you haven‟t deleted it!) if you want to… or you could
create another layer called “All labels” and add the names of all your map objects to
that layer… or you could add the paddock names directly on to the Paddocks layer.
Remember though that all objects on a layer are “ON” together.
To add more labels, use Drawing tool bar…Click on the “Create New Object”
button … then click on the Text button.
You can then add labels by clicking on the map on the spot where you want to add
the text… type the text into the dialog that pops up. Change the style of the text if
you want to… by clicking on the “Pick Font” button… I recommend you use a font
size of 150 metres or more depending on the overall scale of your map.
You can set text styles in advance by clicking on the “Style” button on the drawing
tool bar.
Using your Maps for Entering Crop Data
Before you can use your maps as a method of entering data you should create
appropriate views for each of the farms listed in your PAM database. This is quite a
simple process…
Copyright Fairport Technologies
Page 54
Firstly… you will need to draw all the arable areas of the production areas of each
farm. The arable areas within a paddock can be one or more polygons. See the
arable areas layer in the demonstration farm.
Now… Save the view. Perhaps call it “Farm XYZ Data Entry View”.
To Select an Area at Data Entry Time Using the Maps
1.
2.
3.
4.
Select the Maps Tab on the Areas Selection page of the “Add” wizard
Select the appropriate view from the pick list of views
Click on the required areas… they will change colour to indicate they are
selected. (To de-select them, simply click on them again).
Click on the “Next” button and proceed with your data entry as normal.
What if you need to draw one or more sub areas
If you are treating less than the total area of a production unit… choose the “Draw
Sub Areas” button and draw the actual area treated. You will most likely need to
display the aerial photo and to zoom in on the relevant area. Use the Layer manager
and zooming and panning options as required.
Drawing sub areas
1. You are advised to zoom well into the paddock in which you are drawing sub areas.
2. Draw the sub-areas as you would draw a paddock boundary
A data record can link to more than one sub area. For example you might spray
several small areas of a crop but they are recorded as a single record in PAM.
That‟s no problem… simply draw all areas treated.
Odd shaped sub areas ... examples
Where you have one area within another, you must draw both areas.
To achieve two closed polygons, you need to draw two shapes like in Figure 1 and
2 to finish up with the effect shown in Figure 3.
Copyright Fairport Technologies
Page 55
Start and finish
Start and finish
Figure 1
Figure 2
Figure 3
Please note : There is right
and a wrong way to draw
this type of sub area.
Figure 4
Copyright Fairport Technologies
Page 56
Using your Maps for Moving Stock
Setting up
Under Configuration / Livestock Categories and Mobs you can assign a symbol
and colour to each of your mobs.
The quickest way to do this is to double click on the mob code in the outline.
Double Click on the Mob Code to display
the “Change a Mob”
form…
Now click the
“Symbol/Colour”
button to set up the
appropriate map
symbol for the mob.
When you have
assigned all your mobs
their symbol, you are ready to use the mob movement system using your map.
Click the
“Mob Move” button on the main map screen…
Choose
the date for the move(s) you are about to perform. If
you are moving stock on more than one day you will get a chance to change dates
later as well.
You will now see the stocked paddocks displaying the mob symbols and mob
codes. If you have any mobs in the “Yards”: they are displayed in their own list.
You can move this “Livestock in Yards” list if it gets in your way.
The farm filter is over ruled by the Map View system… That is, you choose the
map view from the Views list, the mobs in the paddocks for that view are
shown… including ANY mobs that are in the Yards… The Yards are not tied to
any farm in particular… they are generic system wide yards.
Copyright Fairport Technologies
Page 57
You can zoom in and out if you need to. To see more information for a mob, hold
down your left mouse button on its symbol and look across the top of the map
screen.
If you want to use the map for moving stock… drag and drop the mob code &
icon.
To move a mob from the yards to a paddock, hold down your mouse on the mob
in the yards, drag your mouse out across the map and drop it!… Across the top
of the map view window you‟ll see the instructions displayed in bold type…
keep an eye on that message as you click on (and move) mobs
Eg. F-98-RED 8A Red Cows (24) : “Release button to move into Top
Road…”
Copyright Fairport Technologies
Page 58
PAM Mapping Reports List
The following is a list of reports that you can display on a map.
Cropped Areas
Production Unit Gross Margins
Crop Yields
Cropped Area Gross Margins
Fertiliser Applications
Nutrient Applications
Nutrient Audits
Chemical Applications
Herbicide Resistance History
Machinery Workings
Regions filled by pre-set variety colour
and fill pattern
Regions coloured by Income/Ha
Regions coloured by Yields/Ha
Regions coloured by Income/Ha
Regions coloured by cumulative
Rate/Ha
Regions coloured by cumulative
Rate/Ha
Regions coloured by balance Kg/Ha
Regions coloured by cumulative
Rate/Ha
Regions coloured by cumulative “Hits”
Regions coloured by cumulative
Operations
Manual Tasks
Sundry Consumables
Irrigation Applications
Average Soil Test Results
Average Leaf Test Results
Current Stocking Rates
Stocking Rates As At Any Date
Regions coloured by cumulative
Operations
Regions coloured by cumulative
quantities consumed
Regions coloured by cumulative
applications (in mm.)
Regions coloured by average test item
results
Regions coloured by average test item
results
Regions coloured by average test item
results
Regions coloured by average test item
results
How to Make Map Reports…
Generating your map reports is very similar to generating the standard reports in
PAM.
It is a good idea to set up an appropriate view in the main mapping system. We
recommend you use a basic view for each farm with just the paddock boundaries
showing. Perhaps name them “Farm XYZ Report View”.
Copyright Fairport Technologies
Page 59
When you are ready to generate a map report, the steps are:
Select the Map Reports option from the Reports menu.
Select the report type from the pick list of reports
Select the Farm or Farms (you can have views that show more than one farm).
If the report is one the types where an item (eg. A chemical, fertiliser etc)
needs to selected… Select the item
Now choose the Season or date(s) as appropriate.
Now click “Generate Map”
To change the map view for the report, click the button…
You may need to move the legend to
suit your case. Use the Legend
Position list to choose your position.
You may prefer a different legend
colour scheme to the default… Simply
choose your preference.
To print the result… Choose “to Print Layout…”. You will find yourself in the
print prepare screen. For the features, options and facilities in this screen see
Chapter 3.
The colours and patterns for crop types used in the “Cropped areas” map report
are set up under Configuration / Crop Types and Associated Lists and Settings.
This should be done in advance.
Importing maps from Interfarm or FarmStar
To start this process, firstly ensure you have a “View” selected …
I strongly recommend you have the demonstration view “Kambah” selected on
the Views list when you perform this task to ensure the right layers (“Standard
Farm Layers”) are on & off.
Use the Tools/Import option… Interfarm/Farmstar Maps
A list of Interfarm or FarmStar farm names will be shown…
Copyright Fairport Technologies
Page 60
Select a farm to import (eg. My Farm). From the list… you will now see this
message…
This is saying that the
layers of your selected
farm will be added to
the list of Standard
Farm Layers already
set up for you.
If you encounter any error messages as your old data is being imported, click OK
to continue. An occasional record that can not be dealt with in your old data may
be found… this should not cause any significant problems.
As soon as your imported farm is displayed you should set the zoom level to your
liking (using right mouse zooming or the zoom buttons and pan/drag facility) and
save the “View”.
To save a view use…
Tools / Views / Save As… The “hot keys” for this option are <Shift+F10>
Name it… (eg. My Farm – All Layers)
Hint: It’s a good idea to create other views of each farm. Check out the demo
farm… see the “Data Entry” view and the “Reports” view.
Your paddock names will not be imported (sorry!). Add these by using the
Drawing Tools … Create New Object / Text.
Hint : You could add your paddock names to the “Paddock Names” layer.
Copyright Fairport Technologies
Page 61
Chapter 5
Importing and Exporting Map Data
Contents
Types of Map Data you can import
Special instructions for creating MapInfo “MIF” files
for importing into Fairport’s mapping programs
Steps for setting up a Farm Map with a GPS logger
or with SkyMapper
Exporting to another gpMapper or PAM program
Exporting to other Mapping Software
Writing to a log file
Types of Map Data you can import
At the time of writing, the Fairport mapping programs support the importing of
AutoCAD “DXF”, ArcView “SHP”, MapInfo “MIF” files, SkyMapper,
gpMapper “GPX”, SoilTRAX “SXE”, Interfarm (Version 2.7), FarmStar (Version
2.7) and Garmin GPS files.
This list of supported file types will grow, however the method of bringing the
data into the program will remain the same.
Fairport (and some Fairport agents) provide a service to convert Microstation
“DGN” files and several other data exchange formats into a format that can be
imported. Please contact us if you require this service.
Alternatively, check to see if your mapping software can output in MapInfo “MIF”
format.
Special instructions for creating MapInfo “MIF” files for importing into
Fairport’s mapping programs
If your map that you want to export to Fairport‟s mapping program is not in a
Longitude/Latitude (WGS 84) projection (or if you are not sure) then do this…
Let‟s start assuming you have on your MapInfo screen the map you want to
export.
Copyright Fairport Technologies
61
61
62
62
63
61
Page 62
Choose File / Save Copy of Table As…
On the save dialog, enter a new name then click on the “Projection…” button.
Now on the next dialog, choose the Category “Longitude/Latitude” and the
Category member “Longitude/Latitude (WGS84)”
Having done that… make sure the newly created map (TAB file) is the one on
your screen.
Now choose Table / Export
Pick the table to export (if you get a pick list dialog)
Supply a name for the “MIF” file.
Click “Export”.
If anything goes wrong trying to import this new file check using WordPad or
Notepad the text “CoordSys Earth Projection 1” exists.
This text should exist. If it doesn‟t then you shoul;d carefully follow the steps
above again.
Steps for setting up a Farm Map with a GPS logger or with SkyMapper
Load the log file you have created on the logger via the File / Import / SkyMapper
File (or whichever) menu option...
Nominate the layer name you are loading the data into. The Layer Manager will be
displayed for you to either create a new layer or select an existing one… then click
“OK”.
The data will then be imported and displayed on the screen.
You can now save this new data as a view in the normal way.
This can be the starting point for the creation of a fully featured farm layout.
To associate the drawn paddocks with their PAM data (if you are intending to do
that), choose “Data Links/ Assign Paddocks”. You click on each paddock map
polygon… a list of your paddocks will appear… choose from your list of
paddocks to link the polygon to its PAM data.
Exporting to another gpMapper or PAM program
If you want export your mapping information to another PAM or gpMapper user,
choose the Export/gpMapper option.
You can choose to export all map objects or just the visible objects or only the
wholly displayed visible objects. This gives you a wide and powerful range of
options.
Copyright Fairport Technologies
Page 63
Exporting to other Mapping Software
Writing to a log file
You can send special layers of type “Points” to SkyMapper. Having created a layer
of points, select File / Export / SkyMapper file, select the layer(s) required
Now provide a file name... it MUST have an extension “TXT”
To export to MapInfo, choose that option and proceed in the same way.
Copyright Fairport Technologies
Page 64
Chapter 7
Live Mapping with gpMapper or
FarmStar
Contents
Satellite Information
GPS Offset
GPS Tracking Tool Bar
Hot Keys
Draw Options
Automatic Settings
Drawing Waypoints
Interface to Garmin GPS Unit
Using the Garmin GPS Interface
Creating Polylines and Polygons
66
66
67
68
68
69
70
70
70
71
Copyright Fairport Technologies
Page 65
Setting up the GPS Interface
Before you start mapping with a GPS you need to set up the parameters required
to communicate with your GPS unit.
To enter the settings of your GPS unit:
• Click on the “GPS” menu item.
• Then select “GPS Setup…”
• Enter the relevant information into the Serial Port, Baud Rate, Parity, Data Bits
and Stop Bits fields.
• The GPS Position Data source will Auto Detect.
• Click on “OK” when the connection is verified.
Note that on this form you can set the upload / download speed for interfacing
with a Garmin GPS for exchanging waypoints.
Satellite Information
It is possible to view the information sent via satellite by selecting the Satellite
Information option from the GPS Tracking menu. The GPS Satellite Data screen
shows the relative positions of satellites the GPS receiver can currently “see”, and
the strengths of the signals from them.
If the GPS Satellite Data screen does not appear when you select this
option from the GPS Tracking menu, the program is not receiving any
satellite information. This could be due to one of the following reasons:
• The GPS unit is not correctly installed.
• Your GPS unit is not sending any information.
• Your GPS unit is not receiving any signal.
GPS Offset
When a GPS unit records a geolocated coordinate, the information
recorded relates to the position of the antenna of the GPS unit. If the
antenna is physically connected to the GPS unit the difference in
position of the antenna and the unit will be minimal. However, if the GPS
unit uses an external antenna there may be several metres difference in
the position of the unit and the position of the antenna.
Copyright Fairport Technologies
Page 66
Also, there are some situations in which it is not possible to have the GPS unit or
its antenna and the exact location the point is to be recorded. Eg. When using a
GPS mounted in a vehicle to map fence lines.
The GPS Offset function allows the direction and distance of an offset from the
GPS unit to be setup. In this way, gpMapper can be used to accurately map
paddock boundaries to within the accuracy limitations of the GPS unit being used.
To set the GPS Offset:
• Click on the
button located on the GPS Tracking Tool Bar.
• Enter the distance in metres of the offset.
• Enter the direction from the location the GPS reports, to the offset.
• Click on “OK” to save the settings.
GPS Tracking Tool Bar
The GPS Tracking Tool Bar has several new buttons used to control
various aspects of Live mapping.
•
is used to close the gpMapper Live mode. Alternatively you can close the
GPS Tracker by selecting Stop Tracking from the GPS Tracking Menu.
•
is used to center your screen to the current GPS location.
•
is used to zoom to the object being drawn.
•
is used to zoom to the path which is currently being followed.
•
is used to zoom in on the map.
•
is used to zoom out from the map.
•
this button displays the Drawing Options menu which has
options for drawing lines and shapes from incoming data. Refer to the link below
for more details.
•
this button is used to set up a GPS Offset. Refer to Related Topics for
more details.
•
this button is used to Hide or Show the path you are following while in
GPS Tracking mode. This path line is NOT saved when the map is saved.
Copyright Fairport Technologies
Page 67
•
is used to add a Waypoint at the current location.
•
is used to draw a line while in tracking mode.
•
is used to create a polygon while in tracking mode.
•
while this button is depressed no lines or polygons will be drawn while
you are in the Live mode.
•
this button is used to Start and Finish drawing when creating a
line or polygon.
•
this button is used to add a point which is being drawn
manually. Refer to Draw Options for more details.
•
is used to Hide and Display the Navigation Panel. Refer to link below for
more details.
Hot Keys
While Live mapping, it may be more convenient to press keys on your keyboard
than to click buttons with your mouse or pointing device.
The “Hot Keys” are as follows:
A – Add a Point
L – Start or Stop drawing a Line
N – “None” …this will End drawing a Line or Polygon.
P – Start or Stop drawing a Polygon
W – Add a Waypoint
Y – Add a New Layer (a new automatically named layer is created “on the fly”)
Draw Options
The Draw Options menu is used to setup drawing and screen settings when in
GPS Tracking mode.
• The first option on the Draw Options menu is Add Point Mode. This menu item
gives you the option to Add Points Automatically or Manually. When the Manual
option is ticked you can enter points manually at your current GPS location. When
the Automatic option is ticked the GPS points will be entered automatically. The
Copyright Fairport Technologies
Page 68
intervals at which the coordinates are entered at can be set using the Automatic
Settings option.
• The Shape Style option allows you to alter the style of the object you are
drawing. For more information refer to the link below.
• If the Show Path option is checked a line will be displayed showing the path
followed while GPS Tracking is active. This path line is NOT saved when the
map is saved. To turn the path off click on the menu option to untick it. You can also click on
to Show or Hide the path.
• If the Show Current Position option is checked, your current GPS location will
be shown on the screen. To turn this option off click on the menu item to uncheck
it.
• The next menu option is Show Label for Current Position. This option will be
on if the option is checked and off if the option is unchecked.
• The Limit Path to 500 Points menu option allows you to Limit the path
displayed while you are tracking (not the shape you are drawing) to 500 points.
Once point number 500 has been displayed the first point will disappear. Thus the
path displayed is the most recent course you have taken. Alternatively you can
uncheck this option and the path displayed will not be limited by a number of
points. The path you take will continue to be displayed until you turn off the Path
or Stop Tracking.
• The final option of the Draw Options menu is Change Label when adding a
Waypoint. This gives you the option to change the name of the Waypoint each
time you add a new point. If the menu item is checked the Name Waypoint screen
will appear.
Copyright Fairport Technologies
Page 69
Automatic Settings
When the Automatic Settings option is selected the GPS Automatic Shape
Settings screen is displayed.
You have three settings options:
• You can choose whether you want the points to be added in regular intervals of
seconds or meters.
• You can choose how often you want points to be added. For example every
50m or every 20 seconds.
• Finally you can set points to be added when the course you are travelling
changes by a specified number of degrees. If the check box is not ticked a point
will NOT be added when your course changes by the specified number of degrees.
• Click on
to save your settings.
Drawing Waypoints
A Waypoint is a point on a map with a GPS coordinate. A waypoint can be used to
build up routes for navigation purposes.
There are two ways you can create a waypoint in gpMapper Live.
• The first is to click on the
button on the GPS Tracking Tool Bar. This
simply creates a GPS Waypoint at the currently reported position of the GPS unit.
• The second way to create a Waypoint is to convert all visible points to
Waypoints. To do this select Convert Points to Waypoints from the GPS. By
clicking on this option all points currently visible in the map display will be
converted to waypoints for use with the GPS module.
Please note: for a point to be converted it must actually be visible on the display
screen. Points that are not physically visible are not converted even if the layer
they are on is visible.
Interface to Garmin GPS Unit
GPS receiver units manufactured by Garmin implement the NMEA interface
standard. This is ideal for the GPS tracking function provided by gpMapper,
which utilizes the NMEA interface to retrieve data from the GPS unit.
When the Garmin GPS Interface option is selected from the GPS Tracking menu,
a screen is displayed listing the units supported by the interface.
Copyright Fairport Technologies
Page 70
Using the Garmin GPS Interface
In order to work with the Garmin GPS interface you need to specify your
hardware settings. To do this:
• Select Exchange waypoints with Garmin GPS from the GPS.
The Garmin GPS Interface screen provides you with all the functions you need to
transfer data to the Garmin unit from gpMapper and vice versa. These functions
are explained below.
The “Get from GPS” button allows you to transfer waypoints from the GPS
receiver into gpMapper. Waypoints are simply added to the list of available
waypoints on the navigation information pane. To Download points:
• Click on the “Get from GPS” button
The “Send to GPS” button enables you to transfer waypoints from gpMapper to
the GPS unit. Waypoints are sent using the names assigned to them in gpMapper.
NB: Most Garmin units will simply overwrite any existing waypoints with the
same name as the one which is uploaded. Therefore unless you are sure you want
to overwrite existing waypoints, you should ensure that there are no points in
gpMapper with the same name as those already in the GPS unit.
The “Advanced” option on this form enables you to refine the waypoint format
used. If unsure leave it as “Auto”. The program can create a log file of the upload
and download process. Use this if you want to see a log of the transfers or if
instructed by a Fairport support person in the event of a malfunction.
Creating Polylines and Polygons
gpMapper offers you two “Add Point Modes” in which shapes can be drawn.
Polylines and Polygons can be drawn manually where the operator has to add
points to the shape by clicking on the add point button. Alternatively shapes can
be drawn automatically where points are added at regular intervals. To set up the
automatic option, refer to Automatic Settings
To select either the manual or automatic Add Point Mode:
• Click on Draw Options
• Click on Add Point Mode
• Select either manual or automatic. The ticked option is the selected mode.
To draw a Polyline or Polygon:
• Click on the
/
button.
• If you are adding points manually click on
at each location you
want to add a point.
Copyright Fairport Technologies
Page 71
• If you are adding points automatically, simply follow the path along which you
would like the shape to be plotted.
• Once you have finished plotting your shape click on
.
• To start drawing another shape click on
.
Copyright Fairport Technologies
Page 72
Index
Accuracy of aerial photography30, 32
Rectangles
23, 24
Adding Additional Map Sections
Symbols
23, 24
Text
23, 24
(Print Areas) to Your Page40, 45
adjoining map objects
25, 27
Drawing ... general tips
Aerial photography
29, 31
Drawing Overview and Tips 21
All objects on a layer
Delete
Drawing sub areas
28, 30
AMG format
31, 35
16, 14
46, 55
Drawing Toolbar
23
Drawing tools
16, 14
ARROW keys
10, 7
Drawing Waypoints
59, 70
ASCII text format
11, 9
Eastings
31, 35
Begin drawing
Circles
21
16, 22, 15, 22
Drawing
23, 24
Editing the shape of an image33, 37
email address
11, 8
Error trapping system
11, 8
collection of layers
18, 17
Exporting to other Mapping
common boundary
25, 27
create a view
17, 16
Fairport Club membership 10, 7
CURSOR keys
10, 7
Finishing drawing an object 24
Data file compatibility
11, 9
Geo-locating your image 31, 35
Software
54, 63
delete a map section
40, 45
Getting started
13, 11
delete a scale bar
40, 44
GPS Interface
56, 66
Delete in the Layer Manager28, 30
GPS logger
54, 62
Deleting a Scale Bar
GPS Offset
56, 66
desktop area of your computer12, 10
GPS Tracking
57, 67
Displaying Multiple Maps on
gpsFarmLog
53, 61
40, 44
Hard disk directory
12, 10
27, 28
Hardware
11, 8
Draw Print Rectangle(s)… 36, 42
Printers
11, 9
Draw your print areas
Screens
11, 9
your Printout
Drag Handles
41, 47
37, 42
Drawing
How to Make Map Reports 50, 58
Circles
23, 24
image file size
Points
23, 24
Importing and Exporting Map
Polygons
23, 24
Polylines
23, 24
Data
29, 32
53, 61
Individual scale bars
40, 44
Copyright Fairport Technologies
Page 73
Installation
12, 10
Installing an image
30, 33
Interface to Garmin GPS
60, 70
Labels
17, 22, 15, 23
Polygons
16, 22, 60, 15, 22, 71
Drawing
23, 24
Polylines
60, 71
Drawing
23, 24
Layer
17, 15
Layer Group
18, 17
Delete a map section
Layer management
27, 29
Displaying Multiple Maps on
Layer Manager21, 24, 27, 21, 25, 29
Layer order
28, 30
Print Prepare
your Printout
40, 45
40, 44
Individual scale bars
40, 44
New Layout
41, 46
Layout via Current View 37, 42
North Arrow
38, 43
Layout via Print Areas
Open Layout
41, 46
Save Layout
41, 46
Live Mapping with gpMapper55, 65
Save Layout As…
41, 46
Lock a layer
17, 16
Saving and Using Saved Layouts40, 46
Longitude and Latitude
31, 35
Scale Bar
Map
18, 17
Setting layers on or off in
Layer Quick Selector
Lines
21
37, 43
16, 22, 15, 22
map objects
17, 15, 16
Map Reports
38, 43
different map sections 40, 45
Setting the position and size of
How to…
MapInfo
50, 58
map sections
40, 44
53, 61
Zoom to title block
38, 43
Menu option
Print Rego Form
Read Data Logger File
54, 62
9, 6
Printer
11, 9
Microstation
53, 61
Printing your Maps
New Layout
41, 46
Program operating speed
36, 41
11, 9
non-user mapping objects 37, 42
Quick Layer Selector22, 24, 22, 25
north arrow
38, 44
raster
Northings
31, 35
Rectangles
object types
18
17, 15
16, 22, 15, 22
Drawing
23, 24
object’s style
19, 18
Resolution
29, 32
Odd shaped sub areas
46, 55
right mouse zooming
32, 35
Offset
56, 66
Satellite
56, 66
10, 8
satellite images
17, 15
41, 46
Satellite images
30, 33
Save Layout As…
41, 46
on-line help
Open Layout
Output files
Panning
Photos and images
points
11, 9
20
29, 31
16, 22, 15, 23
Points
Drawing
23, 24
Saving and Using Saved
Layouts
40, 46
scale bar
38, 44
Scales stick to Maps
41, 46
Scanned aerial photos
17, 15
Copyright Fairport Technologies
Page 74
Scanning resolution (Images)30, 32
Screen type
11, 9
Select button
20
Select Mode
27, 28
Selecting an object for editing
Drawing
23, 24
System layer group
37, 42
Text
Adding
23, 24
The Layer Manager
27, 29
or deleting
26, 28
The Print Prepare Screen 38, 43
Selector button
27, 28
to run the program
12, 10
unlock a layer
17, 16
serial number
9, 6
setting and editing of object
styles
upgrades or revisions to the
19, 18
Setting layers on or off in
different map sections 40, 45
Setting the position and size of
map sections
40, 44
Setting the Scale of Map
software
9, 6
Vector
17, 16
View
17, 16
What is snapping?
25, 27
while you’re drawing
Zooming, Panning
26, 27
41, 46
Windows Bitmap file
30, 32
SkyMapper
53, 61
Writing to the logger
54, 63
Snap off
25, 27
Zoom to the title block
38, 44
Snapping
25, 27
Zooming IN
19, 18
Stack Order
28, 30
Zooming in and out while
Sections
Stop drawing
Polygons, Lines etc
Style button
support strategy
drawing
24
24, 25
10, 7
symbols
17, 22, 15, 23
Symbols
17, 16
26, 27
Zooming OUT
19
Zooming to Full View
19
Zooming to Selected Object 20
Error! Cannot open file
referenced on page 62
If you read nothing else, read Chapter 2 !
All the best from the Fairport Crew !
Copyright Fairport Technologies