1
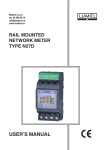
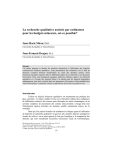
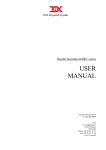
Materm d.o.o.
tel: 02 608 90 10
[email protected]
www.materm.si
ANALYSER OF 3-PHASE POWER
NETWORK PARAMETERS
ND1 TYPE
User’s Manual
LZAE Lumel S. A.
Sulechowska 1
65-022 Zielona Góra
Poland (EU)
TABLE OF CONTENTS
1.
INTRODUCTION
6
1.1.
APPLICATION
6
1.2.
ANALYZER FEATURES
6
1.3.
FIRMWARE UPDATE
7
2.
GENERAL INFORMATION
8
2.1.
WARNING AND INFORMATION SIGNS
8
2.2.
OPERATING SAFETY
8
2.2.1.
REMARKS CONCERNING THE ANALYZER INSTALLATION
2.2.2.
PRECAUTIONS IN THE ESD PROTECTION RANGE
3.
PREPARATION OF THE ND1 ANALYZER TO WORK
8
10
11
3.1.
UNPACKING
11
3.2.
INSTALLATION IN THE PANEL
12
3.3.
ANALYZER OPERATING CONDITIONS
12
4.
ANALYZER CONSTRUCTION
13
4.1.
LCD SCREEN WITH TOUCH PANEL
13
4.2.
COMPACTFLASH MEMORY CARD, USB INTERFACE, LED DIODE
15
4.3.
TERMINAL PLATE
16
4.3.1.
MOUNTING OF THE POWER SUPPLY FILTER
17
4.3.2.
ALARM CONNECTION, BINARY INPUTS AND ANALOG OUTPUTS
18
4.3.3.
CONNECTION OF COMMUNICATION INTERFACES RS485(1) I RS485(2) INTERFACES
19
4.3.4.
CONNECTION OF MEASURING SIGNALS
20
5.
GRAPHIC SIGNS ON THE ANALYZER SCREEN
25
5.1.1.
STATUS BAR
25
5.1.2.
SERVICE MENU
25
2
5.1.3.
INFORMATION MESSAGES
26
5.1.4.
DIALOGS
26
5.2.
SIGNS AND COLORS OF MEASURING PARAMETERS
27
5.2.1.
GRAPHIC SIGNS
27
5.2.2.
COLORS OF MEASURING VALUES
28
6.
ANALYZER START
29
6.1.
CONTEXT MENU, BUTTON FUNCTIONS
29
6.2.
ENTRY TO PARAMETER CONFIGURATION, ND1 CONTROL PANEL WINDOW
31
7.
CONFIGURATION OF ND1
7.1.
33
GENERAL SETTINGS
34
7.1.1.
PARAMETER PROGRAMMING: BASIC
34
7.1.2.
PARAMETER PROGRAMMING: LCD SCREEN
35
7.1.3.
PARAMETER PROGRAMMING: COMPACTFLASH FORMAT
35
7.1.4.
PARAMETER PROGRAMMING: OTHER
36
7.2.
INPUTS
36
7.2.1.
PARAMETER: GENERAL
36
7.2.2.
PARAMETER: AVERAGE
37
7.2.3.
PARAMETER PROGRAMMING: TARIFFS
38
7.2.4.
PARAMETER PROGRAMMING: LOGS
38
7.3.
ALARMS
39
7.3.1.
PARAMETER PROGRAMMING: GENERAL
39
7.3.2.
PARAMETER PROGRAMMING: CONTROL
43
7.4.
ANALOG OUTPUTS
45
7.4.1.
SELECTION OF THE ANALOG OUTPUT
45
7.4.2.
PARAMETER PROGRAMMING: GENERAL
45
7.4.3.
PARAMETER PROGRAMMING: RANGE
46
7.5.
POWER QUALITY
47
7.5.1.
PARAMETER PROGRAMMING: GENERAL
47
7.5.2.
PARAMETER PROGRAMMING: DIPS
48
7.6.
VISUALIZATION
50
3
7.6.1.
PARAMETER: GENERAL
50
7.6.2.
PARAMETER: SCREENS
51
7.6.3.
PARAMETER PROGRAMMING: RANGES
58
7.6.4.
PARAMETER PROGRAMMING: LOGS
58
7.6.5.
PARAMETER PROGRAMMING: OTHER (AUTO-VIEWS)
59
7.7.
ARCHIVIZATION
7.7.1.
PROGRAMMING OF GROUP PARAMETERS
60
61
7.8.
ETHERNET
64
7.9.
MODBUS
65
7.9.1.
CONFIGURATION OF MODBUS MASTER
65
7.9.2.
CONFIGURATION OF CI1..24 INTERFACE INPUTS (GENERAL AND REGISTER)
66
7.9.3.
CONFIGURATION OF MODUS SLAVE
67
7.10.
SECURITY
67
7.11.
SYSTEM INFORMATION
69
7.12.
FILE BROWSER
70
7.13.
EVENTS LOGS
70
7.13.1.
BROWSING AND HANDLING OF EVENT LOGS
72
7.14.
EDITION OF USER’S MESSAGES
74
7.15.
EXIT FROM THE ANALYZER CONFIGURATION
76
8.
SELECTED ELEMENTS FROM THE CURRENT ANALYZER OPERATION
8.1.
77
COMPACTFLASH MEMORY CARD
77
8.1.1.
INFORMATION ABOUT CF CARD
77
8.1.2.
FORMATTING THE CF CARD
77
8.1.3.
DATA STORAGE ON THE CF CARD
78
8.1.4.
VISUALIZATION ON THE CF CARD STATE ON SCREENS
80
8.1.5.
BROWSING AND ERASING OF FILES FROM THE CF CARD
81
8.1.6.
REMOVING CF CARD, EXCHANGE OF CF CARDS, WRITE OF ARCHIVE DATA
82
8.2.
TOUCH SCREEN CALIBRATION
83
8.3.
UPDATING THE ANALYZER PROGRAM
84
8.3.1.
FIRMWARE UPDATE ON THE DEVICE
84
8.3.2.
FIRMWARE UPDATE THRU THE DEVICE WEB PAGE
85
4
8.4.
9.
MAINTAINING DATA STORED ON THE CF CARD, VISUALIZATION
87
PROGRAMS ON THE PC
88
KD CONNECT PROGRAM
88
9.1.
9.1.1.
INSTALLATION OF THE USB DRIVER
88
9.2.
ND1 SETUP APPLICATION
89
9.3.
KD CHECK APPLICATION
89
9.4.
ND ARCHIVE
89
10.
TECHNICAL DATA
91
11.
ORDER CODES
96
MAINTENANCE AND GUARANTEE
97
5
1. Introduction
1.1.
Application
The ND1 Power Quality Analyzer is destined for the measurement and analysis of
3-phase, 3 or 4-wire power network parameters, in balanced or unbalanced
systems.
1.2.
Analyzer Features
Following features characterize the ND1 Power Quality Analyzer:
Measurement and recording of electrical energy quality parameters in
accordance with the EN 50160 standard and more than 300 other
parameters of 3-phase power networks
LCD TFT 5.7” color screen, 320 x 240 pixels, with a touch panel for the
analyzer service.
Intuitive operating by means of the touch screen and graphic user’s friendly
interface based on the MS Windows.
Exchangeable CompactFlash external memory with capacity up to 4 GB.
Communication interfaces: Ethernet 10 Base-T, Modbus TCP/IP Slave,
USB 1.1 Device, RS-485 Modbus Master, RS-485 Modbus Slave.
Analog outputs, alarms, binary inputs.
Storage of data in the internal 6 MB buffer with data support (for before and
after damage states).
Alarm, Audit, Energy, Power Quality, Dips and Swells and Statistics logs.
Dedicated visualization in form of displays: digital, analog, bargraphs,
harmonics, vector diagram, statistics, binary inputs.
Context help in the user’s configuration menu and in the measuring mode.
Menu languages: English and Polish.
Programmable events controlled by binary inputs.
Programmable alarms.
Selection of the time zone, automatic change of summer/winter time,
synchronization with a time server (NTP).
IP65 protection grade from the user’s side.
6
Diversity of applications:
Monitoring of energy quality (data acquisition).
Load measurement, network optimization.
Harmonic analysis up to the 51 st.
Decays, dips, asymmetry.
Flickermeter.
Inspection of compensation effectiveness.
1.3.
Firmware Update
The manufacturer reserves the right to a continuous improvement and makes
changes in design and specifications in the product without warning. This
especially concerns the internal device software (so called device firmware). The
current software version and other files destined for the analyzer are available at
our web page:
http://www.lumel.com.pl
7
2. General Information
2.1.
Warning and Information Signs
One or more of presented symbols can be used in the user’s manual:
Caution: pay special attention to the
description in the analyzer user’s manual.
Terminal of the protection lead
Earth terminal
Protection of sensitive electrostatic systems
(ESD)
2.2.
Operating Safety
In the safety operating scope, the ND1 Power Analyzer meets requirements
related to safety of electrical measuring instruments for automation, acc. to EN
61010-1 standard and requirements concerning the immunity against noises
occurring in industrial environments acc. to EN 61000-6-2 and EN 61000-6-4
standards.
The improper connection of the supply, communication interfaces and measuring
signals, and the use of equipment inconsistent with the description included in the
present user’s manual and standards as above, can cause serious damage of the
analyzer.
2.2.1. Remarks Concerning the Analyzer Installation
Various sources of noise occurring in practice interact with the ND1 Power
Analyzer in a continuous or pulse way from the supply network side (as the result
of the action of other devices) and also overlap on the measured signal or auxiliary
circuits of the analyzer.
In particular, strong pulse noises are dangerous for the device operation since
they can cause sporadic erroneous measurement results or accidental operations
8
of alarms. The level of these noises should be reduced to a value lower than the
immunity threshold of the analyzer, first of all through a suitable installation of the
analyzer in the object.
In this scope, it is recommended to observe following recommendations:
Do not supply the analyzer from networks near devices generating high
pulse noises in the supply network and do not use common grounding
circuits with them.
Signaling wires must be shielded.
Lead connections of binary input circuits, individually in shields as above,
by means of twisted wires.
Connections of communication interface circuits, lead individually in shields
as above and by means of twisted wires.
All shields should be earthed unilaterally near the analyzer.
A common earth conductor with other devices must be avoided.
Apply the general principle that wires (group of wires) leading different
signals should be led in the longest possible distance between them and
crossings of such groups of wires should be made at a 90° angle.
When connecting the supply, please remember that a switch or a circuitbreaker should be installed in the room. This switch should be located near
the analyzer, easy accessible by the operator and suitably marked as an
element switching the analyzer off.
It is not allowed to remove the analyzer casing.
All operations concerning transport, installation, and commissioning as well
as maintenance, must be carried out by qualified, skilled personnel, and
national regulations for the prevention of accidents must be observed.
Protections ensuring the device safety can be less effective in case of
exploitation inconsistent with manufacturer’s indications and principles of a
good engineering practice.
9
2.2.2. Precautions in the ESD Protection Range
Semiconductor elements or packages used in the analyzer design and marked
with the sign as above, can be damaged in result of electrostatic discharges
(ESD).
In order to prevent this, you must observe following recommendations during
service works:
Disassemble instruments only in the area protected against electrostatic
discharges.
Use conductive materials to dissipate electrostatic charges in the working
area.
Use only antielectrostatic packings to store electronic elements and
packages.
Do not touch elements and packages with hands.
Do not keep materials susceptible to generate electrostatic charges in the
working area.
Repairs and modifications in the device
equipment should be carried out by the
manufacturer.
10
3. Preparation of the ND1 Analyzer to Work
The analyzer with accessories is delivered in packing fulfilling requirements of
environment protection regulations.
The analyzer in the shipping packing can be transported and stored in the
temperature -20 ....+65ºC (-4 ...149ºF).
3.1.
Unpacking
A. Take the ND1 analyzer out from the shipping packing.
The data plate with the version code, factory number and supply parameters are
placed on the analyzer casing. Before unpacking, check the conformity of the
device version with the order.
B. Take ND1 analyzer accessories out from the transport packing.
1
2
3
4
9
6
8
7
5
1.
User’s manual (quick start)
1 pc
2.
CF memory card
1 pc
3.
Mounting brackets
4 pcs
4.
Key
2 pcs
5.
USB cable 1.8m (shielded)
1 pc
6.
Seal (ND1 casing– panel)
1 pc
11
7.
Set of plugs
1 set
8.
CD with software and manuals
1 pc
9.
Power supply filter
1 pc
Guarantee card
1 pc
Note: Before unpacking the memory card carry away electrostatic charges from
the body.
3.2.
Installation in the Panel
Fig. 3.1. Analyzer installation in the panel
Put the seal from standard accessories on the casing (see section 3.1). After
mounting the analyzer into the panel, the seal protects the part behind the panel
against the influence of risks appearing from the frontal part of the panel, resulting
from the IP65 protection grade. The analyzer is fixed to the panel by means of four
screwed mounting brackets from the standard accessory set (see section 3.1.).
Basic fixing and panel cut-out dimensions are presented on the above figure.
3.3.
Analyzer Operating Conditions
The analyzer can work at ambient temperature: 0...+50ºC (32 ...122ºF) and
max.75% of relative air humidity without condensation (or at 0...+65ºC and max.
40% RH without condensation).
12
4. Analyzer Construction
Casing
LED diode
LCD screen
Door with lock (access to CF card
and USB socket)
Mounting
brackets to fix
the recorder in
the panel
Fig. 4.1. Analyzer construction
4.1.
LCD Screen with Touch Panel
For the visualization of measuring data and the configuration of analyzer
parameters, an LCD TFT 5.7” graphical screen integrated with a touch panel is
applied (Fig. 4.2).
13
External
layer
Substrate
(glass)
Fig. 4.2. Touch screen
All elements of the user’s interface (windows, icons, buttons) have dimensions
adapted to be easily handled by fingers – They do not require special tools.
After mounting the analyzer into the panel, remove the foil protecting the external
flexible layer of the touch panel if exist.
Considering the sensibility of the touch panel to dirt and external damages of its
surface and the substrate, observe the following recommendations:
protect against impacts, they can damage the external surface or the glass
substrate of the touch panel,
protect against fluids, grease and aggressive chemical agents,
touch the screen with fingers only, do not use hard and sharp objects which
can damage the flexible surface of the touch panel,
clean softly with a cotton cloth impregnated with a detergent destined to
clean LCD monitors (not containing alcohol, petrol or ammonia ) or by using
water with soap,
observe the given temperature range of the analyzer operation.
Since there is a possibility of an image persistence effect on an LCD screen (after
a prolonged display of a constant figure), as default the screensaver (the blank
screen) is set for 15-minute timeout (after continuous work without touching the
screen). The screensaver is gone when the screen is touched any place. The
timeout can be changed or this function can be switched off completely (see
section 7.1.2.).
14
4.2.
CompactFlash Memory Card, USB Interface, LED Diode
A CompactFlash card with capacity up to 4 GB is dedicated to a measuring data
support. It is recommended to apply CF cards produced by SanDisk® company.
Current measuring data, archive data and analyzer configuration files are stored
on the CF card
LED diode
USB socket
CF card
USB cable
CF ejector
Fig. 4.3. Frontal view of the analyzer after opening the door
You can download data from the CF card to a PC through the USB interface. You
can also save or delete selected files on the card. To connect the computer to the
analyzer through the USB socket, use the shielded USB AM-BM cable of 1.8 m
long (delivered in standard accessories) or another similar of maximum 3 m long.
To gain access to the ND1 analyzer data thru USB interface on a PC with
MS Windows operating system it is necessary to install drivers and the
KD Connect program from the accompanied CD. It is delivered with the analyzer
accessories (for the description and program installation, see section 9.1).
15
The LED diode placed on the left side of the door signals the analyzer operating
state:
Green color of the diode the analyzer is set working, normal
operating state
Red color of the diode
4.3.
signals the storage of data on the
CompactFlash memory card. In
this operating state, you must not
take out the card from the seat
risk to lose measuring data!
Terminal Plate
Measuring package
ND1
Binary inputs (BI1..12),
Alarm outputs (AL1..6),
Analog outputs (AO1..4)
ND1 supply
Object
supplies
RS485 and
Ethernet interfaces
16
Symbol of terminal
group
1
Terminal description
Connection sockets of the measuring package
(L1, L2, L3, N)
Measured quantity:
– current:
1 A or 5 A,
– voltage:
57.7 V a.c. / 100 V a.c. or
230 V a.c. / 400 V a.c. or
400 V a.c. / 690 V a.c.
Connection sockets:
2 and 3
Alarms (AL 1..6) - 6 relays NO
Binary inputs (BI 1..12) – 12 inputs
Analog outputs (AO 1..4) – 4 outputs
L, N, PE
24 V d.c. / 30 mA
RS485(1), RS485(2),
Ethernet
Connection sockets of the supply voltage:
85..230..253 V a.c./d.c.
Auxiliary supplies destined to supply external systems
Communication interfaces: RS485 Modbus Master,
RS485 Modbus Slave, Ethernet 10-Base-T
Earthling functional terminals to connect screens
4.3.1. Mounting of the Power Supply Filter
During the device installation, apply the delivered power supply filter when
connecting the supplying wire to the analyser.
To mount the power supply filter one must reeve all the three supplying wires
(L,N,PE) through the filter core, creating a full loop around it (Fig.4.4).
17
Fig. 4.4. Connection of the power supply filter.
4.3.2. Alarm Connection, Binary Inputs and Analog Outputs
Connection to terminals of the alarm system (electromechanical relays)
AL1..6
Alarms are normally open contacts (NO). Parameters of
the alarm system are given in the chapter “Technical
Data".
Connection of the control signal to terminals of the binary input system
BI1..12
Binary inputs BI1..12 are controlled by the signal:
0 V d.c.
– inactive binary input or
+5...24 V d.c.
18
– active binary input
Connection to the analog output system AO1..4
Parameters of analog output signals AO1..4 are given in
the chapter “Technical Data".
4.3.3. Connection of communication interfaces RS485(1) i RS485(2)
interfaces
Parameters of interfaces RS485(1) Master and RS485(2)
Slave are given in the chapter “Technical Data”
Interface Ethernet 10-Base-T
Description of Ethernet socket diodes:
Yellow diode: lights when the analyzer is
connected to the Ethernet network and does not
light otherwise.
Green diode: Tx/Rx, lights irregularly when the
analyzer uploads and collects data from the
network and lights.
Lead functions of the RJ45 socket are in compliance with the EIA/TIA 568A/B
(AT&T258) standard. To connect the analyzer with the hub (concentrator) or the
switch, you have to use a cable with leads 1:1, according to the description as in
the above figure. To the direct ND1 connection with the PC, use a crossed cable:
19
ND1
PC
Tx +
1
3
Rx +
Tx -
2
6
Rx -
Rx +
3
1
Tx +
Rx -
6
2
Tx -
Note: The cable length cannot exceed 100 meters.
4.3.4. Connection of Measuring Signals
Note:
1. To connect measuring signals use the plug-in strip from
ND1 accessories
2. Signal connections are presented on figures in the view
from the ND1 terminal plate side
Fig. 4.5. Four-wire network. Indirect measurement with the use of 4 current transformers and 2 or
3 voltage transformers.
20
Fig. 4.6. Three-phase network. Indirect measurement with the use of 2 current transformers and 2
or 3 voltage transformers.
Fig. 4.7. Four-wire network. Indirect measurement with the use of 3 current transformers and 2 or
3 voltage transformers.
21
Fig. 4.8. Three-wire, three-phase network. Indirect measurement.
Fig. 4.9. Three-wire, three-phase network. Indirect measurement.
22
Fig. 4.10. Four-wire network. Direct measurement.
Fig. 4.11. Four-wire network. Semi-indirect measurement.
23
Fig. 4.12. Four-wire network. Indirect measurement with the use of 4 current transformers.
24
5. Graphic Signs on the Analyzer Screen
5.1.1. Status Bar
Change of data presentation form
Automatic switching of
screens
The CF card status
Parameter selection for visualization
Parameter name
Alarms
Date
Time
Lack of CF card
CF card partially filled
Exceeded level storage over 90%
of the card capacity
5.1.2. Service menu
Selection approval (OK), enter of
changes
Cancellation, no changes are
introduced
Push-buttons for global navigation
Push-buttons for navigation on
accessible options
25
Push-buttons for global copying of
settings between menu windows
Introduction of a number or string
Option selection from the list or the
dialogue
Context help
5.1.3. Information Messages
Warning
Symbol of error occurrence
Question
Information icon
5.1.4. Dialogs
Single and multiple selection.
26
Input numbers (float and integer numbers).
String inputs (small and capital letters, numbers and special characters; password
– replaced by dots)
5.2.
Signs and Colors of Measuring Parameters
5.2.1. Graphic Signs
Graphic signs used during the visualization process are presented below. (Note:
some symbols occur only on selected screens).
Range exceeding of the measured value over the upper limit
and the alarm state in the channel (what the red color
informs about).
Range exceeding of the measured value under the lower
limit.
--ComEr
Lack of value.
Communication error (can occur with data values from
communication interfaces).
27
Alarm occurrence in a channel. This sign may be
accompanied by one of the alarm type symbol.
Signs of alarm types. Suitably: min, max, range off, range on
alarm types.
Incomplete measurement for the given time window or
averaging range.
State of binary inputs, suitably: input in the high state and
input in the low state.
5.2.2. Colors of Measuring Values
The following colors of measuring data are introduced for informative purposes:
Black color
123.5
Grey color
123.5
Measurement in standard.
Incomplete measurement for the given time window
or averaging period.
Red color
123.5
Orange color
123.5
28
Alarm occurrence on the displayed value.
Measurement carried out after exceeding 20% of the
rated value.
6. Analyzer Start
After the supply connection, the starting screen with the manufacturer logo
appears. The logo is displayed during the time necessary to initialize analyzer
processes.
Next, the screen of data visualization appears, in form of the last analyzer state
before the supply turned off.
After touching the screen any place, the Context Menu appears.
6.1.
Context Menu, Button Functions
After pressing the screen during the visualization of measuring data, the Context
Menu with the standard set of ND1 service options is displayed:
Closing the
Context Menu
29
Standard set of functions destined for the current operating of the ND1 analyzer:
Selection of the screen kind for the presentation of
analyzer measuring data.
Switching of successive screens available for the
selected type of data presentation.
Selection of the log view for statistics, audits or
alarms.
Selection of service options available for the
currently open screen.
Entry to the edition and configuration of analyzer
parameters.
You can add to the Context Menu as above, 5 additional icons from 7
programmable options available in: ND1 Control Panel – General settings –
Others – Context menu:
Screen-shot button. Captured images are stored in
the *.bmp format on the CF card.
System information dialog.
A large close button for context menu.
CF files browser.
User’s custom messages.
30
Alarms confirmation.
Help system. It contains explanation of used
symbols and other information.
6.2.
Entry to Parameter Configuration, ND1 Control Panel
Window
In order to transit into ND1 parameter configuration, please select in the Context
Menu the icon of ND1 analyzer configuration menu:
Transition to the analyzer
configuration menu
The log in window appears. At the first start,
there is only the Administrator user. The
logging follows without the password, simply
accepting the window. The Administrator, after
going into the ND1 Control Panel can edit
other users’ names and access passwords to
the analyzer.
Next, select the kind of the analyzer parameter
configuration in the Configuration window:
31
Default configuration
They are manufacturer’s settings or given requirements
concerning individual settings of the given user.
Edit current
configuration
At the first start it is a default configuration, at next
starts, the configuration changed by the user in the
ND1 control panel.
Open configuration
from file
The selection of the configuration file from stored files
in the CompactFlash memory card.
The ND1 Control Panel appears. It is the initial
point for carrying out the full configuration of the
ND1 analyzer.
32
7. Configuration of ND1
The ND1 Control Panel is the window in which all configuration parameters are
grouped in different categories:
– analyzer general settings, section 7.1
– input configuration, section 7.2
– alarm configuration, section 7.3
– analog output configuration, section 7.4
– setting of energy quality parameters, section 7.5
– setting of visualization parameters, section 7.6
– setting of archiving parameters, section 7.7
– setting of Ethernet interface parameters, section 7.8
– setting of Modbus interface parameters (Master / Slave), section 7.9
– setting of access principles for analyzer configuration changes, section 7.10
– system information of the analyzer, section Błąd! Nie moŜna odnaleźć
źródła odwołania.
– files browser on a CF card, section 7.12
– event log, section 7.13
Note: During the analyzer configuration, the measurement and data storage last
acc. to hitherto existing settings. When we introduce new settings, after accepting
changes, a break in data storage, initialization of changes, and the beginning of
write with new data follows.
33
7.1.
General Settings
After pressing the icon
the
configuration
window
of
basic
parameters opens. They are symbol and analyzer description, selection of the
menu language, setting of the date and time, capacity of event logs, service of the
CF card, service of the LCD screen, setting of user messages and selection of the
context menu option.
7.1.1. Parameter Programming: Basic
1
2
3
4
5
Item
Function
1
Edition of the device symbol
2
Edition of the device description
3
Selection of the menu language
4
Settings:
– date and time / synchronization of the
time with the server
– time zones
– automatic change of time: S/W
– address of the time server (NTP)
5
34
Setting acceptance
7.1.2. Parameter Programming: LCD Screen
1
2
3
4
Item
Function
1
Selection of the time to blank the LCD screen:
switching off / 5 min…12 hours.
2
Setting of the screen brightness
3
Calibration of the touch screen (see section 8.2)
4
Setting acceptance
7.1.3. Parameter programming: CompactFlash format
1
2
3
Item
Function
1
CompactFlash Quick format (see
section 8.1.2)
2
CompactFlash Full format (see section
8.1.2)
3
Setting acceptance
35
7.1.4. Parameter programming: Other
1
2
3
7.2.
Item
Function
1
Edition 1…10 operator’s messages (see section 7.14)
2
Selection of additional options for the Context Menu (see
section 6.1)
3
Setting acceptance
Inputs
After pressing the icon
the configuration window of the analyzer
measuring input parameters becomes open (setting of the network base
frequency, connection kind, current and voltage ratios, averaging periods, tariffs,
quality of RMS voltage and frequency).
7.2.1. Parameter: General
1
2
3
4
5
6
36
Item
Function
1
Input Power Card nominal values
2
Base frequency selection (50/60 Hz)
3
Selection of connection type:
– 3-wire input
– 4-wire input (3 + neutral wire)
4
Edition of voltage ratio values
5
Edition of current ratio values
6
Setting acceptance
Note: For a correct measurement of the zero current, you must prepare suitable
terminal connections.
7.2.2. Parameter: Average
1
2
3
Item
Function
1
Setting of the averaging period for the mean walking
3-phase active power and tgφ expressed in seconds
2
Setting of the averaging period for all values (excepting
harmonics and THD)
3
Setting acceptance
37
7.2.3. Parameter programming: Tariffs
1
2
3
Item
Function
1
Selection of the activation method:
– Time trigger
– Binary input
2
Tariff settings 1..4:
– Enabled / Disabled
– Setting of the selected tariff trigger time
3
Setting acceptance
In case of tariff activation by binary inputs, a physical binary input from 1 to 4
corresponds to relevant tariff number. Please remember that only one tariff can be
activated in the given time at the high state of the binary input. Otherwise, all tariffs
will be turned off.
In case of the time trigger activation, the start time is the initial point of the twentyfour hours’ clock time.
7.2.4. Parameter programming: Logs
1
2
3
38
7.3.
Item
Function
1
On/Off energy log (active / reactive)
2
Setting of the energy log updating frequency
3
Setting acceptance
Alarms
After pressing the icon
selection windows (1…12 alarms)
programming their parameters in General and Control tabs become open:
and
1
6
2
7
3
8
4
5
9
Switching/selection Settings copying to another
of alarm (1…12)
alarm, here: 2..12
Note: only alarms from 1 to 6 have representation on physical outputs. Remaining
alarms from 7 to 12 have a logic character.
7.3.1. Parameter Programming: General
1. Selection of the alarm number from available 1…12
2. Setting of the alarm source: Disabled or selection of one of the parameters.
39
3. Selection of alarm type: Min, Max, Range On, Range Off
Min, Max - the alarm is enabled when a signal value is below/above the alarm
value (Lower limit, Upper limit).
Range On, Range Off – the alarm is enabled when the signal value is between or
beyond set alarming values (Lower limit, Upper limit).
4. Edition of Alarm value (lower and upper limit)
5. Selection of the Hysteresis type and edition of its parameters
40
Edition of parameters for the chosen alarm hysteresis type:
Parameters of the selected
hysteresis type
Hysteresis
Type
Percentage
Value
Percentage
Off
Value Off
Percent
Edition of the
value In
percentage
of the range
n/a
Edition in
percentage
of the range
n/a
Hyst.
value
n/a
Edition of the
value in the
range unit
(positive value)
n/a
Edition of the
value in the
range unit
(positive value)
Time
Hysteresis value in the time unit
After programming the valuable or percentage alarm hysteresis and higher in time
than zero, the alarm operation follows when both conditions are fulfilled
simultaneously.
Fig. 7.1. Functional diagram of the Value Off alarm type
41
Fig. 7.2. Functional diagram of the Value On alarm type
Fig. 7.3. Functional diagram of the MAX alarm type taking in consideration the hysteresis of Value
and Time type
42
7.3.2. Parameter Programming: Control
1
6
7
8
9
Switching/selection
of the alarm (1…12)
Setting copying to another
alarm, here: 2.. 12
Description of the reference marks:
6. Selection of alarm Confirmation type:
None
Option disabled
Latch
The alarm state is supported in the analyzer as long as it will
not be confirmed by the operator
Accept
Switching the alarm state off in the analyzer by the operator
During the analyzer operation, you can select in the context menu the option of
alarm confirmation acc. to programmed settings.
43
Alarm state
Transition to browse the
alarm log
Entry in the alarm confirmation menu (protected
by the user’s password)
7. Selection of the alarm locking source:
None
Option disabled
BI1…BI12
Selection of binary input which the logic state 1 (ON) will lock the
current state of the selected alarm
8. Setting of message storage in the alarm log:
Enabled
information about the occurrence of alarm states will be saved in
the log
Disabled
messages about alarm states will not occur
9. Acceptation of alarm settings
44
7.4.
Analog Outputs
After pressing the icon
the window for the selection and configuration
of 1…4 analog outputs become open.
7.4.1. Selection of the Analog Output
7.4.2. Parameter Programming: General
1
2
3
4
Switching analog outputs
Selection of the analog output <no.>
(here: Analog output 1)
45
Item
Function
1
Analog output selection from available :1..4
2
Edition of the analog output name
3
Edition of the output description
4
Signal source selection for the selected analog output
7
Settings acceptance
7.4.3. Parameter Programming: Range
1
5
6
7
Selection of the analog output
<no.> (here: Analog output 1)
Switching analog outputs
Item
Function
5
Edition of the input range (in %):
Setting of the lower and upper range values (Lower/Upper limit)
6
Edition of the output range (in %):
Setting of the lower and upper range values (Lower/Upper limit)
7
46
Settings acceptance
7.5.
Power quality
After pressing the icon
the selection and configuration window of
power quality parameters (General and Dips) opens. Power quality parameters
are defined acc to the EN 50160 standard.
1
2
3
7
7.5.1. Parameter Programming: General
Item
Function
1
10 min. U RMS limits - Configuration of RMS voltage quality parameters for
10 minutes’ period (default settings acc.to EN 50160):
–
Min deviation (100%): setting of admissible U RMS deviation
percentage downwards for a 100% probability
–
Max deviation (100%): setting of admissible deviation percentage
upwards for a 100% probability
–
Time deviation (X%): time percentage in which U RMS has to be in
definite limits
–
Min deviation (X%): admissible U RMS deviation percentage
47
downwards for the selected probability
2
3
–
Max deviation (X%): admissible U RMS deviation percentage
upwards for the selected probability
–
Default settings: manufacturer’s settings for the given parameter
group
10 sec. frequency limits: configuration of frequency quality parameters for
10 seconds’ periods (default settings acc. to EN 50160):
–
Min deviation (100%): setting of the admissible frequency deviation
percentage downwards, for a 100% probability
–
Max deviation (100%): setting of the admissible frequency deviation
percentage upwards, for a 100% probability
–
Time deviation (X%): setting of the time percentage in which, the
frequency has to be situated in definite limits
–
Min deviation (X%): setting of the admissible frequency deviation
percentage downwards, for the selected probability
–
Max deviation (X%): setting of the admissible frequency deviation
percentage upwards, for the selected probability
–
Default setting: manufacturer’s settings for the given parameter
group
Time limits (selection of the counting time):
Weekly (input time) - counted from the selected day of the week with the
definite time of daily reset
Weekly (Power on time) - counted since the analyzer switching on
7
Setting acceptance
7.5.2. Parameter Programming: Dips
4
5
6
7
48
Item
Function
4
Setting of the voltage dip threshold value and hysteresis in
percentage of the nominal U RMS value
5
Setting of the voltage flare threshold value and hysteresis
in percentage of the nominal U RMS value
6
Setting of the voltage decay threshold value and
hysteresis in percentage of the nominal U MRS value
7
Setting acceptance
Power quality parameter definitions:
Voltage interruption – state, in which the voltage is lower than 1% of the
declared voltage.
Voltage dip – sudden decrease of the voltage to the value included in the interval
from 90% to 1% of the declared value, after which an increase of voltage follows
up to the previous value. Conventionally, the voltage dip duration is situated from
10 ms to 1 minute.
49
Voltage swell – the temporary increase of the voltage RMS value in a grade
exceeding the normally accepted tolerance interval (in reference to the rated or
declared voltage).
7.6.
Visualization
After pressing the icon
the window of selection and visualization
parameter configuration of measurement result becomes open.
7.6.1. Parameter: General
1
2
3
4
50
Item
Function
1
Selection of colors for phase charts:
–
2
L1, L2, L3, N
Selection of colors for line-to-line charts:
–
Color L1-2, L 2-3, L 3-1
3
Color selection for all remaining quantities
4
Setting acceptance
7.6.2. Parameter: Screens
a
Switching between
available screens
b
Parameter set selection
Eneable/Disable the
selected screen
Measuring data can be presented on following screen types:
– Large Digital view
– Harmonics
– Statistics for 3 phases
– Analog indicators
– Bar indicators
– Vector diagram
– Binary inputs
– Energy view
51
– Power Quality view
– Modubs Master state
– Flicker
For each of these screen types, the dedicated group of parameters for them is
available. You can select from this group one for the presentation.
Large digital view
Selection of screen
type
Selection of
data group for
presentation
Alarm state
Harmonics
There are 6 data groups for presentation: Harm U, Harm I, Harm table U, Harm
table I, Harm table U, Harm table I, Harm table Umax, Harm table Imax.
Line switching:
L1/L2/L3 /L1+L2+L3
Selection of even/odd harmonics
Scrolling of harmonic charts
Selection of the visible number of harmonics 13/25/51
52
Statistics for 3 phases
There are 2 data groups for presentation:
Statistics U
Statistics I
Analog indicators
This view is a set of four displays modeled on analog meters. Alarm symbol – if
occurs – is appeared under the form of a bell above the unit area.
Selection of data
group for presentation
Selection of screen
type
53
Bar indicators
The bar view is a set of 4 bargraphs with
fields including the actual digital value.
Indexes at the bargraph left side indicate
reached minimum and maximum. The
column accepts the red color in case of an
alarm occurrence.
Vector diagram
Three data groups are available for
presentation: Phrasal diagram U, I
and L-L.
If values of phase parameters, in
relation to which the chart is
calibrated are indeterminated or take
zero, the calibration is carried out in
relation to the rated parameter value.
Selection of a phase by
which vectors will be
scaled to
Binary inputs state
Indexes show the current state:
Enabled. – the index lights,
Disabled – the index is blanked.
54
Selection of a star axis
Energy view
Energy data (Active, Reactive, Summary, Tariff) are presented on 3 screen types.
Active energy
When the given tariff is set as active
(ND1Control Panel - Inputs - Tariffs),
the energy value accounted in it, will
be
displayed
on
a
darker
background
Reactive energy
Selection of an energy
screen
Energy summary
Power Quality view
Energy quality parameters are presented on two screens: PQ Main and PQ
Summary.
Modbus Master state
This table view depicts Modbus Master inputs state (only those which are
enabled).
55
Oscilloscope view
Oscilloscope view presents unfiltered input signal waveform close to real-time. It
allows displaying single phases or all of them.
Signal change
Y-shift
Single wave
Pause
Waveform of a signal should be treated as a review only and it may
be used to estimate a shape and signal mutual relations.
Flicker
Flicker measurement takes place on the
selected phase. Flicker indicators are
determined according to IEC 61000-4-15
for 230V 50Hz lamp model and means:
Pst(1min)
short term severity (measured over
1 min)
Pst
short term severity (measured over
10 min)
Plt
long term severity (measured over
2 hours)
Selection of a phase, on
which measurement is
performed
Enable / disable
measurement
Enabling the measurement stops the calculation of harmonics.
Due to the large load of the system when calculating the flicker, it is not
recommended to leave this feature turned on for a long time.
56
7.6.3. Visualization – working with data views
After programming settings and opening a new configuration in ND1, measuring
data are presented in set as above graphical form by the user:
Selection of screen
Selection of
parameter group
The selection of the screen type and
parameters from the programmed data
set for it, can be made from the Context
Menu and from the information bar on
the currently displayed screen.
Example of screen selection:
1) Selection of the parameter group to display on the screen
2) Selection of the screen set
57
7.6.4. Parameter Programming: Ranges
1
2
3
4
5
6
Item
Function
1
Edition of the sub-range U
2
Edition of the sub-range (L-N)
3
Edition of the sub-range I
4
Edition of the sub-range P
5
Edition of remaining parameters:
–
Percentage deviation from rated values for
remaining subranges.
–
list of exceptions shown in a full scale.
Demonstration of all subranges in a full scale (then,
all subrange settings are ignored).
5
Settings acceptance
7.6.5. Parameter Programming: Logs
58
The following logs are available:
- Audit log
- Alarm log
- Energy log
- Power Quality log
- Dips and swallows log
Note: These settings concern only the number of data selected for the
visualization (max. 50) and they do not influence storage settings.
7.6.6. Parameter Programming: Other (auto-views)
- Auto-views delay: setting of screen switching time in automatic mode
The automatic mode of screen switching can be enabled from the Context Menu
during data measurements and visualization.
59
The change of the automatic mode screen switching follows after the selection and
acceptation the disable option in the context Menu.
7.7.
Archivization
After pressing the icon
in the ND1 control Panel the selection and
configuration window of archiving parameters for 1..4 measuring groups become
open.
Group selection
Setting acceptation
Copying settings into other groups
Maximum archiving interval is 720 minutes, however minimum is 100 ms.
60
7.7.1. Programming of Group Parameters
In the general tab, for each of edited measuring group, one can enable or disable
the given group, edit the group name, select maximally up to 18 measuring
quantities and set the storage period of measuring data.
In the Events tab, you can select binary inputs which the state has an influence on
the activation or disabling of the given event.
61
Arch. disabled by
When the selected binary input is in the logic state 1, the
archiving is disabled
Save data on CF
When a change of the logic state follows from 0 on 1, on
the selected binary input, the saving of newest data on
the CF card will be forced.
Create new file
When a change of the logic state follows from 0 on 1, on
the selected binary input, a new file with data is created.
In the Common tab, you can select events that are common for all enabled
groups.
Archiving of measuring data
switching off
The archiving is switched off when the selected
binary input is in the logic state 1.
Data storage in a CF card
Data are stored in CF card at the moment of the
logic state change selected from 0 into 1. The
newest data are stored on the CF card.
Edition of a new file with
measuring data
The activation follows at the moment of the
selected source logic state change from 0 into 1.
Selection of file format
CSV, CSV with digital signature, Binary with
Digital signature
Archiving of the audit log
When it is switched off, the log is internally
buffered.
62
Data from particular groups are stored on the CF memory card in files of capacity
up to 8 MB, in *.csv text format – without or with the digital signature and in binary
format with digital signature. The *.csv (tab separated values) text file is open e.g.
by the MS Excel program or OpenCalc (from OpenOffice package). On the other
hand, binary format can be open only in ND Archive PC application. There is a
possibility to convert binary format to CSV in ND Archive.
Data saved in binary format are read by ND Archive
application only!
The Digital signature is (encrypted) information enabling to check the credibility
of stored data in the text format. After choosing „CSV with digital signature” of the
file format storage, a 128-bit “digital signature” is stored in the file. Each, even
accidental change of data will be indicated during the checking of files by the
KD Check program.
Since the CSV text file includes a digital signature, every defined number of
measurement series, the file area (line range from .. to) which includes errors, will
be indicated. Other data, for which the program does not identify data
inconsistencies with the signature, are credible and can be used.
In case of using binary format the digital signature is verified automatically when
data are opened. When working with data, ND Archive indicates records with
wrong signatures.
Setting the minimal archive period for 100 ms causes the internal
measuring buffer to store data from about 15 minutes only
(regardless a number of archived parameters). Therefore, for 4
archived groups and aforementioned storage period the internal flash
memory may fail after 2 years and 9 months. This situation may
happen due to exceeding maximum save/erase cycles. Hence, we
recommend using minimal archive period only for measurement
carried out for short time. However, the write endurance of internal
flash buffer rates to 28 years when the storage period is set for 1
second and it allows saving about 2.5 hour of data.
63
7.8.
Ethernet
After pressing the icon,
the
interface parameters becomes open.
configuration
window
of
Ethernet
Select the Access type to the WWW and FTP Servers in the Ethernet
configuration window, edit Device IP, Subnet mask address and Default gateway
and enable or disable the DHCP communication protocol (Dynamic Host
Configuration Protocol).
Access options to the WWW Server:
Anonymous access
It does not require a user’s name and a password;
anybody can be logged in to the analyzer WWW
Server. This kind of access is not recommended for
security considerations.
User’s access (basic
authorization)
Basic authorization type, it is required to give the
user’s name and the password before the logging in.
This kind of authorization is available on the majority
of platforms. It is recommended for compatibility
issues.
User’s access with NTLM
auth.
It is the authorization protocol used in networks built
on the base of the Microsoft® Windows NT® system
(or newer). Recommended for users of these
systems.
64
Access options to the FTP Server:
Anonymous access
It does not require a user’s name and a password;
anybody can be logged in to the analyzer FTP
Server. This kind of access is not recommended for
security considerations.
User’s access
Authorization type requiring giving the user’s name
and the password before the logging in.
Recommended for security reasons.
7.9.
Modbus
After pressing the icon
the configuration window of Modbus Master
and Slave interface parameters and Modbus Master CI1..24 input parameters are
opening.
7.9.1. Configuration of Modbus Master
Item
Function
1
Selection of transmission mode:
ASCII: 8N1,7N2, 7E1, 7O1 i RTU: 8N2, 8E1, 8O1, 8N1
2
Selection of baud rate:
300,600,1200,2400,4800,9600,14400,28800,38400,
56000,57600,115200,128000,230400,256000
3
Edition of the timeout
13
Setting acceptance
65
9
4
5
1
6
2
7
3
8
13
Cancel button
10
11
12
Switching of
CI1…CI24 inputs
7.9.2. Configuration of CI1..24 interface inputs (General and Register)
Item
Inputs configuration: General
4
Selection: input<no.> Enabled or Disabled
5
ID edition of the Modbus device
6
Edition of the min-max range. Lower and upper limits
7
Edition of the Modus device description
8
Copying settings into another input
9
Acceptation of input settings/ interface input
Item
Inputs configuration: Registers
10
Address edition
11
Selection of the register type:
char, int, long, float, float (bytes order:1234, 2143,
4321 or 3412)
66
12
Selection: Function 3 / Function 4
13
Setting acceptance
7.9.3. Configuration of Modus Slave
1
2
3
4
5
6
Item
Function
1
Selection of transmission mode:
ASCII: 8N1,7N2, 7E1, 7O1 i RTU: 8N2, 8E1, 8O1, 8N1
2
Selection of baud rate:
300,600,1200,2400,4800,9600,14400,28800,38400,
56000,57600,115200,128000,230400,256000
3
ID edition (user’s identifier)
4
Timeout edition
5
TCP/IP settings:
Disabled / Enabled
Port: 502
6
Setting acceptance
7.10. Security
After pressing the icon
the security dialog opens. You can
configure 1…8 analyzer user’s and set their access rights to the analyzer. The
User 1 (Admin) has permanent administrator and Control Panel access rights.
Only administrator can edit remaining users access rights and change all their
concerned settings. The user, who doesn’t have these rights, can change only the
name and password in the edition window.
67
When creating a user’s password, it is recommended to take
advantage only of Latin alphabet and Roman numerals, without
using regional characters (after changing the analyzer menu
language, the possibility to enter individual password
characters must be preserved).
Only the Administrator and Logged Users (with required access rights) have
granted access, after providing the password, to the option of analyzer
configuration in ND1 Control Panel.
1
2
3
4
5
Selection of the user (1..8)
68
Item
Function
1
Enabling/Disabling of the selected user from 1..8
2
Edition of the user’s name
3
Edition of the user’s password
4
Setting the access rights for a current user
5
Setting acceptance
The following access rights are available for users:
Right
Description
Administrator’s right
Can edit other users’ rights
Control Panel access
View, edit and save configuration of the device
Network access
A user has a network access (authorization in HTTP and
FTP services)
Context Menu options
User has an access to options in Context Menu which
requires authorization (e.g. Operator’s messages).
7.11. System information
After pressing the icon
the window with information about the
analyzer system, memory state, hardware installed in the analyzer, storage state
of the CF memory card and internal buffer become open.
There is also the service tab of the analyzer program updating and the service
maintenance. The service maintenance is only available for authorized users.
The procedure of the analyzer program updating is described in the section 8.3.
69
7.12. File Browser
After pressing the icon
when the CF card is inserted in the
analyzer, the file browser window becomes open. When there is no card, an
appropriate message appears.
Delete of the marked file
Exit from the file browser
7.13. Events Logs
Following kinds of logs are available in ND1:
– Audit log
– Alarm log
– Energy log
– Power Quality log
– Dips and Swells log
Information concerning elements of the current analyzer service, kind of event,
time and date of their appearance, are saved in Audit Log.
70
User’s messages, information about the alarm kind, sources of alarm signals, time
and data of their occurrence are saved in Alarm Log.
The watt-hour meter state is saved periodically in Energy Log. If the save of
active and/or reactive energy has been programmed in the ND1 Control Panel Inputs - Logs menu then, these parameters will be displayed in the Energy Log.
Information about voltage and frequency quality parameters (defined in the EN
50160 standard) are saved in the Power Quality Log.
Information about Wells and dips (defined in the EN 50160 standard) are saved in
the Dips & Swells Log. Phase on which a decay or voltage dip occurred is
marked by the (▪) point symbol.
Log parameters are programmed in the ND1 Control Panel menu:
Inputs – Logs tab:
– Active energy log: Enabled / Disabled
– Reactive energy log: Enabled / Disabled
– Energy log update
71
Alarms - Alarm[n] – Control tab:
– Alarm log: Enabled / Disabled
Visualization – Logs tab:
– Audit log size
– Alarm log size
– Energy log size
– Power Quality log size
– Dips log size
Archivization – Common tab:
– Audit log: Enabled / Disabled
7.13.1.
Browsing and Handling of Event Logs
After pressing the screen during the visualization of
measuring data, the Context Menu is displayed.
The pressure of
successive logs.
the icon generates the display and switching the view of
The suitable log can be also selected in the selection option window displayed
after pressing the
icon on one of the log screen information bar.
72
The pressing of the icon in the Context menu
during the browse of any
log, generates the display of the screen from the service menu: Reset this log /
Reset All logs / Statistics … / Confirm alarms.
The execution of each option follows after the previous confirmation of the user’s
password. (if exists).
••••••
73
The selection of the Reset this log or Reset All logs option, cancels the currently
displayed log. User’s authorization is required to perform these operations.
Similarly, “Statistics...” category may be chosen from the Context Menu. The
following option is available Reset all statistics, which reset all min and max of all
measuring values.
(...)
7.14. Edition of User’s Messages
You can program in the analyzer configuration menu for the given measuring
process up to 10 messages. The change of message content is only possible from
the level of the analyzer configuration menu. However, a user has still the
possibility to create its own message while inserting a new one from the Context
Menu.
74
As the need arises, defined messages as above can be saved by the operator in
the alarm log during the analyzer operation.
75
7.15. Exit from the Analyzer Configuration
After finishing the analyzer configuration you must close ND1 Control Panel.
After pressing the configuration exit
push-button, the selection window of the
configuration
file
storage
option
becomes open:
– after selecting the Save and set
configuration push-button
– when simultaneously the Export
to file option is checked, the
configuration file will be saved in
the analyzer memory and in the
CF card, in the file named on the
window. The name can be
changed to another, after the entry to its edition. You can select any
configuration file from stored in the CF card and under its name store a new
configuration file.
– after pressing the Leave without changes button, changes carried out in
the control panel menu are not stored, the analyzer programming state
remains without changes.
Notes:
1. One can set parameter configuration in the analyzer for various processes and
store for them own configuration files (with own names). Applying them, you
can quickly adapt the analyzer for current user’s needs.
2. Configuration files for the given ND1 analyzer can be also prepared in the PC
computer by the ND1 Setup program (see section 9.2), taking advantage of
another configuration file from the same analyzer.
76
8. Selected Elements from the Current Analyzer
Operation
8.1.
CompactFlash Memory Card
For data storage in the ND1 analyzer, you can use CompactFlash memory cards
of capacity up to 4 GB. It is recommended to use CompactFlash cards from the
SanDisk® company.
8.1.1. Information about CF Card
After selecting the icon
in the ND1 Control Panel window, the
information about CF appears. If a CF card is not present an appropriate message
is given in the Storage tab. When the card is inserted in the analyzer, the following
parameters are showed: data about its used and free space, and the total capacity
of the card.
8.1.2. Formatting the CF card
After selecting the icon
in the ND1 Control Panel, you can select
options of formatting functions in the CompactFlash tab: Quick Format or
CompactFlash Full Format. After the selection confirmation, the procedure of
memory card formatting begins.
77
CompactFlash Quick
Format
erases all files from the card but it does not scan the
card in the aim to find damaged sectors. The option of
quick formatting should be selected when the card was
already formatted and we are sure it is not damaged.
CompactFlash Full
Format
erases all files from the card and prepares the card to
store information on it. The following operations are
performed: checking the current card state, division of
physical and logic card area into sectors, appropriate
names are given to them and a system of files is
created.
During the formatting of the CF card, the LED diode on the analyzer frontal plate
changes the green color into red.
8.1.3. Data storage on the CF Card
During the analyzer operation, when measuring data are stored in its memory, the
LED diode on the frontal plate lights in green. When data from the analyzer
memory are saved on the CF card, the LED diode on the frontal plate changes its
color into red.
Caution!
During data saving on the CF card, one must not pull it out
from the analyzer. The removal of the card can cause an
irreversible loss of all data stored in the memory card. One can
remove the card only after finishing the data storage on it
(green color of the LED diode).
78
When making changes in the analyzer configuration, all data from the buffer
(stored in it at the original configuration) are saved to the hereto open files with
data, and new data obtained already after introducing changes in the
configuration, are stored in new files.
LED diode
After exceeding 90% of the CF card capacity storage level (when the icon of the
CF card on the ND1 screen has the red color) it is recommended to transfer data
from the memory card to the PC computer as fast as possible, format the card or
replace it for another empty one.
Caution!
After exceeding the nominal capacity of the CF card, measuring
data will be stored in the ND1 buffer. During the data storage
into the buffer, one must replace the CF card by another,
formatted card. If the card is not replaced on time after filling the
buffer, new data will be lost.
Note:
Using the KD Connect program, you can copy data to the PC, from the inserted
CF card in the analyzer and perform its full erasing.
79
Data are not saved on-the-fly on the CF card because of possible quick card
damage. The period of data storage from the given measuring group in the CF
card is a multiple of the programmed storage period for this group and can last
even several months.
For this reason, when in the meantime it is necessary to access the CF card data
with all current measuring data, before its removal from the analyzer, select the
option Save archive data to CF card. This operation copies all current data from
the internal buffer into the CF card.
After selecting the option Remove CF card the copying of current data on the CF
card follows and information about the possibility of a secure CF card removal and
the insertion of a new one is displayed.
8.1.4. Visualization on the CF Card State on Screens
–
Lack of CF card in ND1
–
The CF car is inserted in ND1, The data save lasts.
– The CF card is filled (over 90% capacity)
80
8.1.5. Browsing and Erasing of files from the CF Card
After selecting the icon
in the ND1 Panel Control, file names saved in
the CF card are displayed in the file browser. After selecting the given file and
confirming its selection, it may be deleted from the CF card.
File
selection
Delete of selected
file
Exit from the menu
return to the ND1
control panel
If the card is not inserted into the analyzer or it is not formatted, a message
informing about its lack is displayed.
81
8.1.6. Removing CF Card, Exchange of CF Cards, Write of Archive Data
If you want to remove the CF card from the analyzer (without the accidental
possibility of loosing measuring data), you must open the context Menu window
(by touching the screen with a finger), press the option selection
icon
and in the open select option window, mark Remove CF card.
After selecting this option, data on the card will be completed with new data. Still
the recording is performed in the internal buffer, while the save on the CF card is
locked till the time of the displayed message acceptation.
Before the message acceptation, you can replace the CF card by a new one.
Caution!
The removal of the CF card, without the execution of the
previously described procedure above, can cause the loss of
measuring data!
The option Save archive data to CF card, forces the copying of the newest data
from the analyzer internal memory (data Buffer) to the CF card. After the copying
of archived data to the CF card, the recording into the buffer is continued in
accordance with current settings.
82
Note: Considering the CompactFlash card life guaranteed by producers, a too
often use of the saving data recording on the card is not recommended.
8.2.
Touch Screen Calibration
After selecting the icon in
ND1 Control Panel window, the Touch
Screen calibration procedure is available on the LCD Screen tab of the General
settings window. The calibration of the touch screen must be carried out in case of
incorrect reaction on pressing the icons/buttons in windows displayed on the LCD
screen.
After pressing this option and confirming the selection and reading the short guide,
the calibration window appears. Calibration procedure is based on successive
pressing five calibration markers (crosses). In order to save introduced changes
please touch the screen (any place) in a 30 seconds’ period from the last touched
marker.
….
If the screen will not be pressed during the 30 seconds’ period, changes in
calibration will not be introduced.
83
8.3.
Updating the Analyzer Program
Taking into consideration users’ opinions about the ND1 analyzer, and as
development works will be conducted in the company, the ND1 analyzer will be
updated. New firmware and software versions, in the form of updated files will be
available for interested users on the page:
http://www.lumel.com.pl/
8.3.1. Firmware update on the device
After copying a new update file to the ND1 directory on the CF card (e.g. using
KD Connect application), you can update the analyzer firmware. In order to do
that, you must carry out the following operations:
Select System information icon in the ND1 Control Panel and then chose the
Update tab.
Select an update file in the file browser
Accept the selection and press the Update button.
84
After confirm the choice, the update starts and after it finishes, a message box with
a result is displayed:
After finishing the firmware update, the automatic conversion of the analyzer
configuration follows (automatic configuration storage in the file before
execution of the program update and its automatic readout after the
updating execution. So please DO NOT take the CF Card off the analyzer).
Caution!
During the system updating, one must not switch the analyzer off
and one must not take the CompactFlash card out.
Firmware update requires a user’s authorization always (Control
Panel, web page). It is not available from Context Menu if System
Information icon is present.
8.3.2. Firmware update thru the device web page
System update is also available from the device web page. Only users with
administrator rights are granted access to the web update process. It is
recommended to set a non empty password for these accounts.
85
After selecting an update file and pressing the Start Firmware Upgrade button
the following operations follows:
a) update file is sent to a device CF card,
b) system file verification,
c) system update,
d) remote device reset.
After sending an update file on the CF card the update progress appears. If
system update finishes and device resets with success the main page will be
displayed.
86
8.4.
Maintaining Data Stored on the CF Card, Visualization
Measuring data, separately from each group of logic channel, are stored in text
format files *.csv with or without the digital signature and in binary format with
digital signature. The KD Check program is designed to check the digital signature
of a text data file. The binary format is serviced by ND Archive. The limitation of
the CSV file capacity is up to 8 MB. The format enables a direct browsing and
visualization of data stored in the text format *.csv, e.g., in the MS Excel program.
Data from the memory card can be copied to a PC computer using the memory
card reader servicing cards of CompactFlash type or taking advantage from
features of the KD Connect program added to each delivered analyzer.
The KD Connect program is destined for the communication between the PC
computer and the ND1 analyzer by means of the USB interface. It enables to carry
out following operations:
– copying files from the CompactFlash card, directly from the analyzer on the
PC computer ( e.g. data files, screen dumps),
– uploading files from the PC computer on the CompactFlash card in the
analyzer (e.g. file with an ND1 firmware),
– deleting of stored files in the analyzer CompactFlash card,
– collection of current system information of the ND1 analyzer (among others:
system version, current configuration, level of CompactFlash card filling).
The ND1 Setup program enables to prepare in the PC a configuration file for the
ND1 analyzer. The appearance and operating the ND1 Setup program are the
same as to the analyzer menu described in the user’s manual. But please take
notice of some differences:
– to handle the ND1 Setup program, the mouse and computer keyboard are
used
– dialogues of file selection allow to browse the contents of computer disks
– the language of the ND1 Setup program is compatible with the language of
the last edited configuration
– the appearance of dialogue windows highly depends on the system user
interface customization (as e.g.: the size of system fonts).
The result of work with the ND1 Setup program is the configuration file for an
analyzer of a defined hardware configuration.
87
9. Programs on the PC
9.1.
KD Connect Program
The KD Connect application is destined for the communication between the PC
computer and the ND1 analyzer using the USB interface.
The KD Connect program enables to carry out following operations:
– copying of files from the CompactFlash card, directly from the analyzer into the
PC computer (e.g. data files, screen dumps ),
– uploading of files from the PC computer into the CompactFlash card in the
analyzer (e.g. file with the updated ND1 program),
– deleting of stored files in the analyzer CompactFlash card,
– reading the current system information of the ND1 analyzer (among others,
system version, current configuration, level of the CompactFlash filling).
9.1.1. Installation of the USB Driver
To make connection between the ND1 and a PC you have to install the driver in
under the MS Windows operating system.
After connecting the Analyzer to the USB port of your PC, the operating system
will ask you for necessary drivers (“Found New Hardware Wizard” appears).
Insert the CD disk delivered with the ND1 analyzer into the CD-ROM drive.
Select the option “Install the software automatically (recommended)” and click
“Next”.
Select the found driver from the list and press “Next” to install the driver by the
wizard. Windows will locate the drivers and proceed with the installation. When the
wizard informs about the lack of driver compatibility tests with MS Windows,
answer “Continue Anyway”. Next, click the push “Finish”.
After the correct driver installation (a restart of the system is not required) you can
start to install programs delivered with the ND1 analyzer.
Select the folder with the KD Connect program on the CD disk and start the
KD Connect_install.exe program. The installation wizard starts. Proceed in
compliance with instructions displayed on the screen.
Software Requirements:
– operating system: MS Windows 2000 or better,
88
– USB drivers for ND1,
– 3 MB of free space on a hard disk
– other requirements same as operating system’s ones.
Software Instalation
The program installation is typical for applications destined for the MS Windows
environment. The program installation is available in the annexed CD disk, in the
“KD Connect“ directory.
9.2.
ND1 Setup Application
ND Setup is a program allowing preparation a configuration file in the PC for the
ND1 analyzer. After recopying the configuration file on the CF memory card, it can
be used for reprogramming settings in the given ND1 analyzer.
Installation
The program installation is typical for applications destined for the MS Windows
environment. The installation program is located on the annexed CD disk to the
analyzer, in the “ND Setup” folder. To begin the program installation, start the
installation program ND Setup_install.exe. Next, proceed according to messages
appearing on the screen.
9.3.
KD Check Application
The KD Check program is destined for digital signature verification of measuring
data saved in the CSV format. The program installation is typical for application
destined for the MS Windows environment. The installation program is situated on
the CD added to the delivered analyzer. To begin the program installation, start
the KD Check_install.exe installation program. The installation wizard starts.
During the verification of files, proceed acc. to the instructions displayed on the
screen.
9.4.
ND Archive
ND Archive is destined for open and analyze data stored in binary format with
digital signature. The user’s manual is given in another document together with the
installation program files.
89
9.5.
FTP Download
The FTP Download is an application to automate a download process of data files
from a device to PC. It can be easily used in batch files (*.bat) to periodically copy
files to a local directory. The advantage of this program is that it copies only
newest data from the source directory, i.e. files that changed or were newly
created. The syntax is following:
FTPDownload
IPAddress
SourcePath DestinationPath
Port
UserName
Password
The examplary batch file could be as follows:
ECHO Download data from ND1, IP: 10.0.0.4 Port: 21
FTPDownload 10.0.0.4 21 Admin pass123 /CF/ND1 “C:\Data from ND1”
In order to automate data download process from the device it is
recommended to schedule a new task in Windows XP Task
Scheduler.
90
10. Technical Data
Measuring ranges and admissible basic conversion errors
Measuring quantity
Basic error
Remarks
57.73 / 100.0 V (Ku = 1)
230.0 / 400.0 V (Ku = 1)
400.0 / 690.0 V (Ku = 1)
400.0 kV (Ku ≠ 1)
± 0.2 %
Ku = 1…4000
1.000 A (Ki = 1)
5.000 A (Ki = 1)
100.0 kA (Ki ≠ 1)
± 0.2 %
Ki = 1…20000
Active Power P
Mean Active Power
Pav
0.0… (-) 6000.0 W
999.00 MW (Ku ≠ 1, Ki ≠ 1)
± 0.5 %
Apparent Power S
0.0…6000,0 VA
999.00 MVA (Ku ≠ 1, Ki ≠ 1)
± 0.5 %
Reactive Power Q
0,0…(-) 6000.0 var
999.00 Mvar (Ku ≠ 1, Ki ≠ 1)
± 0.5 %
Active Power
Factor PF
-1.000…0…1.000
± 0.5 %
PF = Power
Factor = P/S
Coefficient tgφ
-10.00…0…10.00
±1%
Ratio of active
power to reactive
power
-180°...180°
± 0,5 %
Evaluated from the
power triangle
45.00...66.00 Hz
± 0.1 %
Voltage U
Current I
φ angle between
I and U
Frequency f
THD U, THD I
Harmonics U, I (up
to 51)
Pst, Plt
Active energy
EnP
Reactive energy
EnQ
Range
0…200.0 %
0…100.0 %
±2%
Error in the range
10…120 % U,I
0..20
± 0.5 %
For changes in
range of
0,325..35 Hz
0…(-) 99 999 999.9 kWh
± 0.5 %
0… (-) 99 999 999.9 kvarh
± 0.5 %
where
Ku
Ki
THD U
THD I
voltage transformer ratio
current transformer ratio
total coefficient of voltage harmonic distortion
total coefficient of current harmonic distortion
91
Technical parameters of measuring input
no. of inputs
7, galvanically isolated
resolution of A/D converter
16 bit
sampling rate
6250 S/s on each channel simultaneously
measuring band
3 kHz (for U and I measurement)
harmonic measurement
up to 51’st
isolation
3.1 kV d.c.
measurement time
1s
Dips, swells and interruptions
U RMS A/C
0,0...200,0 %
accuracy ± 0,5 % from nominal value
event detection based upon 1 cycle RMS voltage
programmable thresholds in percent of nominal
voltage
Additional conversion errors (in % of the basic error)
from ambient temperature changes
< 100 % / 10 ºC
Analog outputs
current:
4, galvanically isolated
output signal
0...20 mA
basic output error
0.2 %
load resistance
≤ 500 Ω
isolation
500 V d.c.
reaction time
100 ms
Binary inputs
12, with a common ground
control signal
0 / 5…24 V d.c.
switching frequency
starting 2 Hz
isolation
500 V d.c.
92
Alarms
Normally open (NO)
electromagnetic relays
6, programmable
contact voltage / load current
≤ 250 V a.c. / 1.5 A
≤ 30 V d.c. / 1 A
reaction time
100 ms + hysteresis delay
Interfaces
2 × RS485 (Modbus Master & Slave)
Transmission rate: 300...256000 bauds
Transmission mode: ASCII/RTU
Reaction time: timeout
USB
V.1.1 Device, USBB-G socket
Ethernet
10 Base-T, RJ45 socket, Modbus Slave TCP/IP,
Web Server, FTP Server, NTP Client
General analyzer parameters
graphic color screen
LCD 5.7” TFT, 320 × 240 pixels
with touch panel
external data support
CompactFlash up to 4 GB
internal memory (buffer)
6 MB
power input
supply circuit
≤ 28 VA
voltage circuit
≤ 0.2 VA
current circuit
≤ 0.2 VA
casing protection level
from the frontal side
IP65 acc. to EN 60529
from the terminal side
IP20 acc. to EN 60529
Archivization
Number of parameters possible to be
archived (Event Logs not concerned)
72 (4 groups of 18 recorded and calculated parameters)
Archive period
from 100 ms up to 12 hours (separately for each group)
Events Logs
separate archivization of event logs: audit, energy,
power quality, voltage dips, swells and interruptions.
Over 50 various parameters.
93
Data recording area
internal Flash buffer, CompactFlash card
Storage formats
CSV, CSV with digital signature, Binary with digital
signature
Others
-
archive control of each group by binary inputs
(possible events: storage control, creation of new
files, internal data flush to CF),
-
giving a name for each data group,
-
access to stored data thru Web page and internal
buffer flush to CF,
-
full access (copy, delete) to stored data on CF thru
FTP server.
Reference and rated operating conditions
operating temperature
0...23...50 °C for < 75% relative humidity
0...23...65 °C for < 40% relative humidity
without condensation in both cases
storage temperature
-20...65 °C
supply
85...253 V d.c./a.c., 40…400 Hz
reaction against decays and supply
recoveries
preservation of data and the device state during the
decay, work continuation after the supply recovery
input signal
0...0.005...1.2 In, 0...0.05...1.2 Un for current and
voltage;
0...0.1...1.2 In, Un for coefficients PF, tgφ;
frequency 45...50...66 Hz sinusoidal (THD ≤ 8 %)
power factor
-1...0...1 C, L
admissible peak factor of
measuring current
2
measuring voltage
2
base frequency (of the 1’st harmonic)
from 47 to 52 Hz or 57 to 62 Hz for THD U, THD I, and
harmonics
short duration overload (1 s)
voltage input
2 Un (max.1000 V)
current input
10 In
94
Mounting requirements
dimensions of the frontal part
144 × 144 mm
length of the frontal part
155 mm
dimensions of the mounting hole
138
moment value to tight up
clamps fixing the analyzer
0.2 Nm
Service safety
acc. to EN 61010-1, basic isolation
installation category
III
pollution level
2
+1
+1
x 138
mm
Working voltage related to earth
RS485, USB interfaces
50 V
measuring system
500 V
cat. III for 57.7 V / 100 V and 230 V / 400 V options,
cat. II for 400 V / 690 V option
electromagnetic relays, supply
300 V
altitude ASL
< 2000 m
Electromagnetic compatibility
noise emission
acc. to EN 61000-6-4
noise immunity
acc. to EN 61000-6-2
Auxiliary supply
2 × 24 V d.c. / 30 mA ±5%
Other
Weight
< 2 kg
95
11. Order Codes
Power Quality Analyzer
ND1 –
X
X
XX
X
X
Current input:
1 A .................................................................................1
5 A .................................................................................2
Voltage input:
57,7 V / 100 V............................................................................ 1
230 V / 400 V............................................................................. 2
400 V / 690 V............................................................................. 3
Version:
standard................................................................................................... 00
in a portable case without Ethernet interface .......................................... P0
in a portable case with Ethernet interface ............................................... PE
Language:
Polish...................................................................................................................... P
English.................................................................................................................... E
Acceptance tests:
without extra quality requirements .......................................................................................0
with an extra quality inspection certificate............................................................................1
(*)
acc. to customer’s request .................................................................................................X
(*)
after agreeing with the Manufacturer
Note:
The ND1 analyzer is equipped with 6 alarms (electromechanical relays),
4 analog outputs and 12 binary inputs.
EXAMPLE OF ORDER
The code ND1-2-1-00-E-0 means:
ND1
Analyzer of three-phase power network parameters of ND1 type
2
current input: 5 A
1
voltage input: 57.7 V/100 V
00
version: standard
E
English version
0
without extra quality requirements
96
Maintenance and Guarantee
The ND1 Power Analyzer does not require any periodical maintenance. In case of
some incorrect unit operations:
From the Shipping Date, During the Period Given in the Annexed Guarantee
Card
One should take the instrument down from the installation and return it to the
Manufacturer’s Quality Control Dept. If the instrument has been used in
compliance with the instructions, the Manufacturer guarantees to repair it free of
charge.
After the Guarantee Period
One should turn over the instrument to repair in a certified service workshop. The
disassembling of the housing causes the cancellation of the granted guarantee.
The Manufacturer’s policy is one of continuous
improvement and we reserve the right to make changes
in design and specifications of any products as
engineering advances or necessity requires and revise
the above specification without notice.
97
CONTROL - MEASUREMENT - RECORDING
SALES PROGRAM
DIGITAL and BARGRAPH PANEL METERS
MEASURING TRANSDUCERS
ANALOG PANEL METERS (DIN INSTRUMENTS)
DIGITAL CLAMP-ON METERS
INDUSTRIAL PROCESS and POWER CONTROLLERS
CHART and PAPERLESS RECORDERS
1-PHASE and 3-PHASE WATT-HOUR METERS
LARGE SIZE DISPLAY PANELS
ELEMENTS OF INTEGRATION SYSTEMS
ACCESSORIES for MEASURING INSTRUMENTS (SHUNTS)
CUSTOM-MADE PRODUCTS ACCORDING CUSTOMER’S REQUIREMENTS
WE ALSO OFFER OUR SERVICES IN THE PRODUCTION OF:
ALUMINIUM ALLOY PRESSURE CASTINGS
PRECISION ENGINEERING and THERMOPLASTICS PARTS
SUBCONTRACTING of ELECTRONIC DEVICES (SMT)
PRESSURE CASTINGS and OTHER TOOLS
QUALITY PROCEDURES
According to ISO 9001 and ISO 14001 International Requirements.
All our instruments have CE mark .
For more information, please write to or phone our Export Department
Lubuskie Zakłady Aparatów Elektrycznych LUMEL S.A.
ul. Sulechowska 1, 65-022 Zielona Góra, Poland (EU)
Materm d.o.o.
tel: 02 608 90 10
[email protected]
www.materm.si
© 2009 LZAE Lumel S.A., All right reserved.
ND1-09D/1 (22.06.11)