1
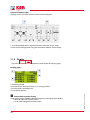
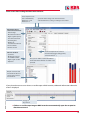
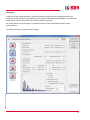
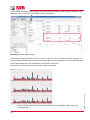
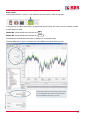
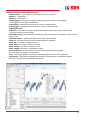
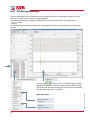
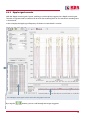
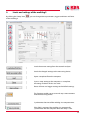
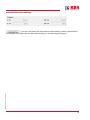
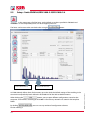
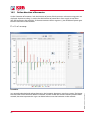
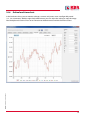
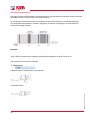
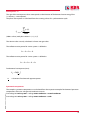
Place marker: If the button “Marker” is active, it is possible to place two markers within the graphic. In the plot, you can place two markers using the left mouse button. The closest curve is selected and the marker adopts its color. Marker No. 1 with the left mouse button and Marker No. 2 with the left mouse button and Ctrl The difference between the two markers is defined as an absolute value. EDEBDA00140-2115-1_EN_multilog 2 The time difference is always calculated, the value difference only for identical units. The exact time values for the extreme values (10 ms) are also displayed in the marker in milliseconds for long measurement intervals (e.g. 10 min). 51