1
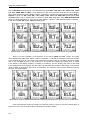
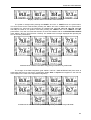
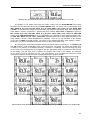
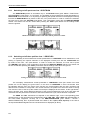
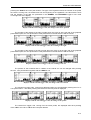
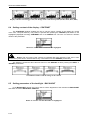
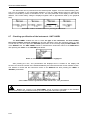
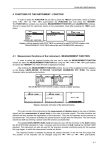
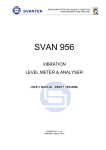
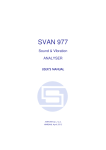
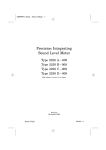
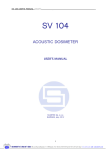
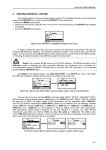
SVAN 953 USER MANUAL
6
DATA AVAILABLE ON THE DISPLAY - DISPLAY
In order to open the DISPLAY list the user has to:
• press the <MENU> push-button,
• select from the main list, using the <>, <> (or <>, <>) push-buttons, the DISPLAY text (highlight
it inversely),
• press finally the <ENTER> push-button.
Pressing the <SHIFT> and <> (or <SHIFT> and <>) results in a movement to the first position
of the opened list and pressing the <SHIFT> and <> (or <SHIFT> and <>) results in a movement
to the last position of the opened list.
Main list with DISPLAY text highlighted (displayed inversely)
The DISPLAY list is used for setting the various parameters, which are mainly dedicated
for the control of the display. The following items are present on this list:
DISPLAY MODES
enables one to select the mode of the measurement results presentation;
DISPLAY SETUP
LOGGER VIEW
enables one to change the scale in the graphical modes of result’s presentation and
the parameters of the logger’s result presentation;
enables one to select and present the results stored in the logger’s files;
CONTRAST
enables one to set the contrast of the instrument’s display;
BACKLIGHT
enables one to set the brightness of the instrument’s backlight and switch on/off
the backlight timeout;
it informs the user about the source of powering of the instrument and current
power supply voltage;
informs the user about the serial number of the instrument, the version
of the internal software and the standards to which conform the measurement
results.
BATTERY
UNIT LABEL
In each available position any change is performed by means of the <>, <> push-buttons.
In order to confirm the selection the <ENTER> push-button has to be pressed. After this confirmation,
the opened window or list is closed. In order to ignore any changes made in the opened window or list
the user has to press the <ESC> push-button.
DISPLAY windows
6.1
Selection of the modes of results presentation - DISPLAY MODES
The DISPLAY MODES sub-list enables one the selection of the currently available modes
of displaying the results of measurement. The selection is made by placing or replacing the special
character in the displayed inversely position of the DISPLAY MODES sub-list by means of the <>, <>
push-buttons. In order to confirm the selection the user has to press the <ENTER> push-button.
One profile mode is always available in the instrument and cannot be switched off. In the LEVEL METER
6-1
SVAN 953 USER MANUAL
_
and 1/1 OCTAVE mode the name of the measurement result (SPL, LEQ, SEL, Lden, LEPd, Ltm3, Ltm5,
Lxx, OVL, PEAK, MAX and MIN – cf. the definitions in App. D) is presented in the first line of the display.
Next, either the detector (path: MENU / INPUT / PROFILE x / DETECTOR) time constant (Fast, Slow or
Impulse) is given for SPL, LEQ, SEL, Lden, LEPd, Ltm3, Ltm5, Lxx, MAX, MIN results (when RMS
INTEGRATION is set to exponential) or indicator of linear RMS integration (Lin.) RMS INTEGRATION
(when the RMS integration is set to linear (path: MENU / SETUP / RMS INTEGRATION: LINEAR)) in the case of LEQ, SEL, Lden, LEPd and Lxx results.
Measurement results in LEVEL METER made with linear integration, presented in one profile mode
There is not any indication of the detector in the case of PEAK and OVL results. The name
of the implemented filter (path: MENU / INPUT / PROFILE x / FILTER) is presented as the last element
of the first line (A, C or Z). The result of the measurement together with its unit (dB for almost all results
and % only for OVL) is given in the second line. The profile, the results are coming from, is visible
in the bottom of the display (Profile(1), Profile(2) or Profile(3)). The line showing the value of the result
in the analogue-like form together with the scale is presented at the left side of the display. The real time
clock is visible in the bottom right corner of the display. The selection of the result is made by pressing
the <>, <> push-buttons.
Measurement results in LEVEL METER made with exponential integration, presented in one profile mode
If the measurement results are saved in the internal memory in a file or the AUTO SAVE option is
switched on, the name of the file is presented under the profile’s number.
6-2
SVAN 953 USER MANUAL
Displays with the names of saved files in the bottom line
The profile is changed after pressing the <SHIFT> and <> or <SHIFT> and <> push-buttons.
The same result can be achieved after pressing the <ALT> and <> or <ALT> and <> push-buttons.
The statistics (i.e. these set in the instrument as a default: L01, L10, L20, L30, L40, L50, L60, L70, L80
and L90) are visible in one profile’s mode after pressing the <SHIFT> and <> or <SHIFT> and <4
4>
push-buttons. The user can make the selection of these ten statistics Lxx in the STATISTICAL LEVELS
(path: MENU / SETUP / STATISTICAL LEVELS). The statistics are not longer displayed after pressing the
<> or the <> push-buttons.
Statistical levels calculated with linear integration presented in one profile mode
The change of the RMS integration (path: MENU / SETUP / RMS INTEGRATION) from linear to
exponential influences a little bit the presentation (Fast, Slow or Impulse text appears in the first line
of the display in the case of the exponential integration).
Statistical levels calculated with exponential integration presented in one profile mode
6-3
SVAN 953 USER MANUAL
_
There is also possible to present differently the measurement data in one profile after pressing
the <ALT> and <> or <ALT> and <> push-buttons. In this case, the result is displayed
with the biggest possible fonts. The name of the result together with the units is given in the bottom line.
The current result from a selected profile is changed after pressing the <> or the <> push-buttons.
The profile the results are coming from is changed after pressing the <SHIFT> and <> or <SHIFT> and
<> but the profile’s number is not visible on the display. The same result can be achieved
after pressing the <ALT> and <> or <ALT> and <> push-buttons.
When the statistical level Lxx is presented, the another levels from the set of ten values are
available after pressing the <SHIFT> and <> or <SHIFT> and <> push-buttons. The presentation
mode is changed (to 3 PROFILES, STATISTICS and LOGGER or FILE INFO if all of them are currently
available) after pressing the <> or <> push-buttons.
Measurement results in LEVEL METER and unknown profile presented with the biggest available fonts
When the measurements are performed, what is indicated on the display by the loudspeaker icon,
the clock displayed in the right bottom shows the current second of the measurement. The value
presented there belongs to the range [1, INTEGRATION PERIOD]. The envelope icon visible above and
below indicates that the selected results from the profiles (path: MENU / INPUT / PROFILE x) are logged.
Displays during the measurement performed in LEVEL METER mode with the active LOGGER
The results can be saved using SAVE, SAVE NEXT or AUTO SAVE functions after the end
of the measurements caused by any reason (remote control, pressed <STOP> push-button or fulfilment of
the INTEGR. PERIOD / REP.CYCLE condition). It is not possible to save the results during the execution
of the measurements. In the case when the saving was done, the name of the file is presented
in the bottom line of one profile display and the clock starts to show the real time.
6-4
SVAN 953 USER MANUAL
Displays after the end of the measurements with the file’s name the data are saved-in
The display in one profile mode with the results coming from the DOSE METER looks nearly
the same as it was described above for the LEVEL METER mode. The name of the measurement result
(SPL, DOSE, D_8h, LAV, LEQ, SEL, SEL8, E, E_8h, LEPd, PSEL, Ltm3, Ltm5, Lxx, OVL PEAK, MAX
and MIN - cf. the definitions in App. D) is presented in the first line of the display. Next, either the detector
(path: MENU / INPUT / PROFILE x / DETECTOR) time constant (Fast, Slow or Impulse) is given for
SPL, DOSE, D_8h, LAV, LEQ, SEL, SEL8, E, E_8h, Lden, LEPd, PSEL, Ltm3, Ltm5, Lxx, MAX, MIN
results (when RMS INTEGRATION is set to exponential) or the indicator of linear RMS integration (Lin.)
for LEQ, SEL, SEL8, E, E_8h, Lden, LEPd, PSEL and Lxx results (when linear RMS integration is set
(path: MENU / SETUP / RMS INTEGRATION: LINEAR)). There is not any indication of the detector
in the case of PEAK and OVL results. The name of the implemented filter (path: MENU / INPUT /
PROFILE x / FILTER) is presented as the last element of the first line (A, C or Z).
The result of the measurement together with its unit (dB for almost all results, % - for DOSE, D_8h
2
and OVL and Pa h for E and E_8h) is given in the second line. The profile, the results are coming from,
is visible in the bottom of the display (Profile(1), Profile(2) or Profile(3)). The line showing the value
of the result in the analogue-like form together with the appropriate scale is presented at the left side
of the display. The real time clock is visible in the bottom right corner of the display. The selection
of the result is made by pressing the <>, <> push-buttons. If the measurement results are saved
in the internal memory in a file, its name is presented under the profile’s number.
Measurement results in DOSE METER made with exponential integration, presented in one profile mode
6-5
SVAN 953 USER MANUAL
6.1.1
_
Switching on/off spectrum view - SPECTRUM
The SPECTRUM position is accessible only in 1/1 OCTAVE mode (path: MENU / FUNCTION /
MEASUREMENT FUNCTION / 1/1 OCTAVE). The possibility of the measurement results presentation in
SPECTRUM can be switched on or off placing or replacing the special character in the displayed inversely
line with the SPECTRUM text by means of the <>, <> push-buttons. In order to confirm the selection
the user has to press the <ENTER> push-button. This confirmation closes also the DISPLAY MODES
sub-list. The sub-list can be also closed after pressing the <ESC> push-button but the settings made
there are ignored.
DISPLAY MODES windows with SPECTRUM position accessible
Displays in SPECTRUM mode for 1/1 OCTAVE analysis
6.1.2
Switching on/off three profiles view - 3 PROFILES
The possibility of the measurement results presentation in 3 PROFILES can be switched on or off
placing or replacing the special character in the displayed inversely line with the 3 PROFILES text
by means of the <>, <> push-buttons. In order to confirm the selection, the user has to press
the <ENTER> push-button. This confirmation closes also the DISPLAY MODES sub-list. The sub-list can
be also closed after pressing the <ESC> push-button but the settings made there are ignored.
Setting on and off the accessibility of three profiles presentation mode
The exemplary measurement results presented in 3 PROFILES mode (the results from three
profiles are on the display) are given below. In the case of 3 PROFILES in three consecutive lines
the following data are seen: the name of the function, the result together with the units, the filters and
detector time constants in each profile. The current real time, the profile from which the result is coming
from and the name of the file (if the results are saved) are displayed at the bottom. At the right bottom,
there is another clock, which displays actual time of the recent measurement cycle in the case when the
measurements are performed or the time of the last measurement cycle, which has been completed.
The PEAK and OVL result does not depend on the detector type, so the corresponding place
remains empty. In the case when the measurement result (LEQ, SEL, Lden, LEPd and Lxx) depends on
the linear RMS integration currently set in the RMS INTEGRATION (path: MENU / SETUP /
RMS INTEGRATION), the L is placed instead of the letter F, S or I (Fast, Slow, Impulse). In the case of
the exponential RMS integration the kind of this detector is displayed (F, S or I).
6-6
SVAN 953 USER MANUAL
Measurement results in 3 PROFILES mode
The presented result in a selected profile is changed using the <>, <> push-buttons.
Results in 3 PROFILES mode with selection of the result in a profile
The change of the selected (displayed inversely) profile is done pressing the <SHIFT> and <> or
<SHIFT> and <> push-buttons. The same result can be achieved after pressing the <ALT> and <> or
<ALT> and <> push-buttons.
Results in 3 PROFILES mode with selection of the profile
Ten statistical levels set by the user (path: MENU / SETUP / STAT. LEVELS) or set
in the instrument as a default (L01, L10, L20, L30, L40, L50, L60, L70, L80 and L90) are visible
in this mode after pressing the <SHIFT> and <> or <SHIFT> and <> push-buttons.
Statistical levels calculated with linear integration presented in 3 PROFILES mode
During the measurements, which are indicated by the loudspeaker icon, the current time
from the range [1, INTEGRATION PERIOD] is displayed on the right bottom clock. The envelope icon
indicates that results selected in the profiles (path: MENU / INPUT / PROFILE x) are logged.
6-7
SVAN 953 USER MANUAL
_
Displays during the measurements performed in LEVEL METER mode with the active LOGGER
There is also possible to present differently the measurement data in 3 PROFILES after pressing
the <ALT> and <> or <ALT> and <> push-buttons. In this case, at the left side of the display three
analogue-like indicators are shown, each one for the selected result from a profile. The currently active
profile is marked by the cursor and inversely displayed name of the function. The filter selected in that
profile and the integration type (in the case of the linear one) or the detector type (in the case
of exponential) are written below the measurement results. During the measurements, the bottom right
clock displays the current time from the range [1, INTEGRATION PERIOD]. The current result from
a selected profile is changed after pressing the <> or the <> push-buttons. The profile the results
are coming from is changed after pressing the <SHIFT> and <> or <SHIFT> and <>. The same result
can be achieved after pressing the <ALT> and <> or <ALT> and <> push-buttons. When
the statistical level Lxx is presented, the another levels from the set of ten values are available
after pressing the <SHIFT> and <> or <SHIFT> and <> push-buttons.
The results can be saved using SAVE, SAVE NEXT or AUTO SAVE functions after the end
of the measurements caused by any reason. It is not possible to save the results during the execution
of the measurements. In the case when the saving was done, the name of the logger’s file is presented
in the bottom line of one profile display and the clock starts to show the real time. The presentation mode
is changed (to one profile, STATISTICS and LOGGER or FILE INFO if all of them are currently available)
after pressing the <> or <> push-buttons.
Displays during the measurements performed in LEVEL METER mode with the active LOGGER (the first
three) and after saving the results (the last one)
6.1.3
Setting on/off statistics view - STATISTICS
The possibility of the presentation of the statistical results can be switched on or off placing
or replacing the special character in the displayed inversely line with the STATISTICS text by means
of the <>, <> push-buttons. In order to confirm the selection the user has to press the <ENTER> pushbutton. This confirmation closes also the DISPLAY MODES sub-list. The sub-list can be also closed
after pressing the <ESC> push-button but the settings made there are ignored.
a)
b)
Setting on (a) and off (b) the accessibility of statistics presentation mode
The display with the statistical analysis results presents in the graphical form the values from L01
to L99. The Lxx level selected by the cursor is displayed in the bottom line together with its value and
units (dB). The P value indicating that the statistical results are updated every 100 ms is placed
at the end of the bottom line. The profile’s number the statistics are taken from, the RMS detector (Lin., or
Exp.: Fast, Slow or Imp.), the filter’s name (A, C or Z) and real time are displayed on the right side
6-8
SVAN 953 USER MANUAL
of the view in the presentation modes. The selection of the profile is made by pressing the <SHIFT> and
<> or the <SHIFT> and <> push-buttons. The same result can be achieved after pressing the <ALT>
and <> or <ALT> and <> push-buttons.
Results presented in the statistics presentation mode
The selection of the Lxx to be displayed is done by pressing the <>, <> push-buttons.
The statistical level L01 is immediately available after pressing the <SHIFT> and <> while the L99 - after
pressing the <SHIFT> and <> push-buttons.
Instrument’s default Lxx statistical levels presented in graphical form
The change of the mode is done by pressing the <ALT> and <> or the <ALT> and <> pushbuttons. The second mode differs slightly from the first one described above: the description on the left
side is shorter but on the right side the value of the statistical levels are shown.
Results presented in both statistic presentation modes
During the measurements, which are indicated by the loudspeaker icon, the current time
from the range [1, INTEGRATION PERIOD] is displayed on the right bottom clock in the first mode.
The envelope icon indicates that results selected in the profiles (path: MENU / INPUT / PROFILE x) are
logged.
Results presented in both statistic presentation modes during the measurements
6-9
SVAN 953 USER MANUAL
6.1.4
_
Setting on/off logger view - LOGGER
The possibility of the presentation of the measurement results, which are saved in the logger,
on the instrument’s display can be switched on or off placing or replacing the special character
in the displayed inversely line with the LOGGER text by means of the <>, <> push-buttons. In order
to confirm the selection the user has to press the <ENTER> push-button. This confirmation closes also
the DISPLAY MODES window. The window can be also closed after pressing the <ESC> push-button but
the settings made there are ignored.
Setting on and off the possibility of presentation the results saved in the logger
The results saved in the logger can be presented in three different modes, which differ slightly each
other. These modes are changed after pressing the <ALT> and <> or the <ALT> and <> push-buttons
or they can be set in the VIEW (path: MENU / DISPLAY / DISPLAY SETUP / LOGGER VIEW / VIEW).
Different presentation modes of the results stored in logger
6.1.5
Setting on/off the view of the file description - FILE INFO
The possibility of the additional file description presented on the instrument’s display can
be switched on or off placing or replacing the special character in the displayed inversely line
with the FILE INFO text by means of the <>, <> push-buttons. In order to confirm the selection
the user has to press the <ENTER> push-button. This confirmation closes also the DISPLAY MODES
sub-list. The sub-list can be also closed after pressing the <ESC> push-button but the settings made there
are ignored.
Setting on and off the logger’s file description presentation mode
In the FILE INFO window the following parameters are presented: the file name, its size, date and
time of the registration of the main results (cf. App. B) and time (ELAPSED TIME) during which the main
results saved in the logger were measured. The value presented there belongs to the range
[1, INTEGRATION PERIOD] and depends on the moment and the way the measurements were stopped.
Exemplary contents of FILE INFO window
6-10
SVAN 953 USER MANUAL
6.2
Setting parameters of graphical presentation modes - DISPLAY SETUP
The DISPLAY SETUP sub-list enables the user to change the scale in the available modes
of graphical presentation of the measurement results and set the parameters of the logger’s files
presentation. In order to enter this list one has to press the <ENTER> push-button on the inversely
displayed DISPLAY SETUP text of the DISPLAY list. The DISPLAY SETUP sub-list is closed and
the instrument returns to the DISPLAY list after pressing the <ESC> or the <ENTER> push-button.
DISPLAY window with DISPLAY SETUP selected
6.2.1
Setting the scale of presentation and display’s grid - DISPLAY SCALE
The DISPLAY SCALE sub-list enables the user to change the scale in the available modes
of graphical presentation of the measurement results and switch on/off the grid. In order to enter a list one
has to press the <ENTER> push-button on the inversely displayed DISPLAY SCALE text
of the DISPLAY SETUP sub-list. The DISPLAY SCALE sub-list is closed and the instrument returns
to the DISPLAY SETUP sub-list after pressing the <ESC> (the settings made there are not confirmed) or
the <ENTER> push-button (the settings are confirmed).
DISPLAY SETUP windows in LEVEL METER and 1/1 OCTAVE with DISPLAY SCALE text highlighted
6.2.1.1
Scaling the vertical axis of graphical mode presentation - DYNAMIC
The DYNAMIC enables the user to select the proper scaling of the graphical mode presentation.
In the case of the vertical axis one can obtain the double, four times and eight times expansion
(as the default the vertical axis corresponds to 80 dB, after expansion it corresponds to 40 dB, 20 dB and
10 dB – respectively) using the <>, <> push-buttons and pressing the <ENTER> for the confirmation.
DISPLAY SCALE windows with the possible values of DYNAMIC parameter
DISPLAY SCALE windows with the selection of DYNAMIC parameter in 1/1OCTAVE mode
6-11
SVAN 953 USER MANUAL
_
Displays with the results stored in logger presented with different DYNAMIC parameter
6.2.1.2
Scaling the horizontal axis of graphical presentation - X–ZOOM
The X–ZOOM position aapears on the display in 1/1 OCTAVE mode and it enables the user to
change the horizontal axis in the SPECTRUM presentation mode by means of the <>, <> pushbuttons.
In order to confirm the selection the user has to press the <ENTER> push-button, which closes also
the DISPLAY SCALE sub-list. The sub-list can be also closed after pressing the <ESC> push-button but
the settings made there are ignored. In 1/1 OCTAVE analysis the following values are available: 3x, 4x,
5x and 6x.
1/1 OCTAVE analysis results presented with different value of X–ZOOM selected in DISPLAY SCALE
In the figure below, the results of 1/1 OCTAVE analysis are presented with the different values of
X–ZOOM parameter.
1/1 OCTAVE analysis with 3x, 4x, 5x and 6x X–ZOOM
6.2.1.3
Switching on/off the grid in graphical presentation - GRID
The GRID enables the user to switch on or off the grid in any graphical presentation placing or
replacing the special character in the displayed inversely line with the GRID text by means of the <>,
<> push-buttons. In order to confirm the selection the user has to press the <ENTER> push-button.
This confirmation closes also the DISPLAY SCALE sub-list. The sub-list can be also closed
after pressing the <ESC> push-button but the settings made there are ignored.
DISPLAY SCALE windows with the grid switched on and off
6-12
SVAN 953 USER MANUAL
a)
b)
Displays with the grid switched on (a) and off (b)
6.2.2
Setting the parameters of logger files presentation - SPECTRUM VIEW
The SPECTRUM VIEW position appears on the DISPLAY SETUP list in the case of 1/1 OCTAVE
analysis mode and enables the user to change the shape of the graphical presentation (VIEW) and TYPE
parameter as well as to activate the presentation on the display the MAX and MIN spectrum.
In the VIEW position the EXTENDED, FULL and NORMAL options are available (the selection is
made by means of the <>, <> push-buttons).
In the TYPE position the AVERAGED, INSTANTANEOUS, MAX and MIN texts are available
(the selection is made by means of the <>, <> push-buttons).
In order to enter a window one has to press the <ENTER> push-button on the inversely displayed
LOGGER VIEW text of the DISPLAY SETUP sub-list. The LOGGER VIEW window is closed and
the instrument returns to the DISPLAY SETUP sub-list after pressing the <ESC> (the settings made there
are not confirmed) or the <ENTER> push-button (the settings are confirmed).
DISPLAY SETUP window with SPECTRUM VIEW text highlighted
6.2.2.1
Selection of graphical presentation type - VIEW
In the VIEW position the EXTENDED, FULL and NORMAL options are available. The selection
is made by pressing the <>, <> push-buttons. These texts correspond to the slightly different data
presented on the display in the graphical presentation modes.
SPECTRUM VIEW windows with VIEW selection
6.2.2.2
Selection of spectrum type for the presentation - TYPE
In the TYPE position the AVERAGED, INSTANTANEOUS, MAX and MIN options are available.
The selection is made by pressing the <>, <> push-buttons.
6-13
SVAN 953 USER MANUAL
_
Each text corresponds to the different spectrum type to be presented on the display in the graphical
presentation modes.
SPECTRUM VIEW windows with TYPE selection
6.2.2.3
Selection of MAX spectrum for the presentation - MAX
In the MAX position the corresponding spectrum can be selected (by means of the <>, <> pushbuttons) to be presented on the display in the graphical presentation modes.
SPECTRUM VIEW windows with MAX spectrum selection
6.2.2.4
Selection of MIN spectrum for the presentation - MIN
In the MIN position the corresponding spectrum can be selected (by means of the <>, <> pushbuttons) to be presented on the display in the graphical presentation modes.
SPECTRUM VIEW windows with MIN spectrum selection
6.2.3
Setting the parameters of logger files presentation - LOGGER VIEW
The LOGGER VIEW enables the user to change the shape of the graphical presentation and
a TIME parameter. In order to enter a window one has to press the <ENTER> push-button
on the inversely displayed LOGGER VIEW text of the DISPLAY SETUP sub-list.
The LOGGER VIEW window is closed and the instrument returns to the DISPLAY SETUP sub-list
after pressing the <ESC> (the settings made there are not confirmed) or the <ENTER> push-button
(the settings are confirmed).
DISPLAY SETUP windows in LEVEL METER and 1/1 OCTAVE with LOGGER VIEW text highlighted
6-14
SVAN 953 USER MANUAL
6.2.3.1
Selecting the shape of graphical presentation - VIEW
LOGGER VIEW windows with available values of VIEW parameter
The VIEW enables the user to select the shape of the graphical mode presentation. Three different
views are available which are called as NORMAL, FULL and EXTENDED. The selection is made
by means of <>, <> push-buttons and pressing the <ENTER> for the confirmation. The user can
achieve the same effect after pressing the <ALT> and <> or the <ALT> and <> push-buttons.
a)
b)
c)
Presentation of displays with different VIEW parameter: NORMAL (a), FULL (b) and EXTENDED (c)
6.2.3.2
Setting the time to be presented - TIME
Displays with the possible values of TIME parameter
The TIME enables the user to select the time to be presented with the logger’s file results.
The REAL TIME selection means that on the display the real time is visible, while AVAILABLE TIME
means that time after which the logger’s memory will be filled up by the current measurement result
is given there. The selection is made using the <>, <> push-buttons and pressing the <ENTER>
for the confirmation.
Displays with the possible values of TIME parameter
6.3
Selection of logger’s file to display presentation - LOGGER VIEW
The LOGGER enables the user to examine the contents of the logger files. In order to open
the window, the user has to press the <ENTER> push-button when the LOGGER VIEW text
is displayed inversely.
6-15
SVAN 953 USER MANUAL
_
DISPLAY window with LOGGER VIEW text highlighted
In the first line, the available still logger’s memory is displayed followed by:
• The selected number of the logger’s file and the number of all saved files (FILE NO.:).
• The name of the logger’s file (LOG.FILE:).
• The number of the records in the file, which name is displayed in the previous line (RECORDS:).
• The results saved (if any are present) in the logger from the first profile (P(1):).
• The results saved (if any are present) in the logger from the second profile (P(2):).
• The results saved (if any are present) in the logger from the third profile (P(3):).
• The size of the remaining free memory for logger files (FREE:).
• The size of the available memory for logger file (AVAILABLE:).
The change of the number of the logger’s file is done by pressing the <>, <> push-buttons.
LOGGER VIEW windows with the selection of the file to be seen
The size of the free memory for logger files is equal to the size of the available memory for logger
file in the case when the logger files were not deleted from the memory. If it has happened, the FREE
memory is always smaller than AVAILABLE. In order to increase the free memory space and achieve
the available, the user has to perform the defragmentation (path: MENU / FILE / DEFRAGMENTATION /
LOGGER DEFRAGMENT.).
LOGGER VIEW sub-list with the scrolling of the file to be seen
The display of the instrument after entering the LOGGER VIEW looks as on the figure below
in the case when the logger’s file does not exist (there was not any measurement or the measurements
were performed but with the settings LOGGER: Off (path: MENU / INPUT / MEASUREMENT SETUP).
LOGGER VIEW window in the case when the files do not exist
The contents of the selected logger’s file is displayed after pressing the <ENTER> push-button.
The cursor position is changed after pressing the <>, <> push-buttons. The left end of the graphical
presentation is reached immediately after pressing the <SHIFT> and <> while the right end - after
6-16
SVAN 953 USER MANUAL
pressing the <SHIFT> and <> push-buttons. The type of the registered result, the number of the profile
the result is coming from, the related time from the beginning of the registration, the value with the units
and the indicator of the filter are presented in the NORMAL and EXTENDED logger’s view mode
on the right side of the display.
Displays with the selected logger’s file; the change of the cursor position
The scrolling of the display to the right is made when the cursor is at the left end of the graphical
presentation space, the <> push-button is still pressed and in the file there are still the results.
Displays with the selected logger’s file; the scrolling to the right
The scrolling of the display to the left is made when the cursor is at the right end of the graphical
presentation space, the <> push-button is still pressed and in the file there are still the results.
Displays with the selected logger’s file; the scrolling to the left
The position of the horizontal axis in relation to the vertical one can be changed after pressing
the <>, <> push-buttons together with the <SHIFT> one.
Displays with the selected logger’s file; the change of the axis relation
The results from logger’s file, coming from different profiles, are changed after pressing the <> or
<> push-buttons – after each pressing the result from the next profile is displayed.
<>
<>
Displays with the selected logger’s file; the change of the profile
The results from logger’s file, coming from the same profile, are displayed after each pressing
of the <ALT> and <> or <ALT> and <> push-buttons.
6-17
SVAN 953 USER MANUAL
_
Displays with the selected logger’s file; the change of the result from a profile (PEAK, MAX, MIN, RMS)
6.4
Setting contrast of the display - CONTRAST
The CONTRAST window enables the user to set the proper contrast of the display (by means
of the <>, <> push-buttons). The position is opened after pressing the <ENTER> push-button on the
highlighted (displayed inversely) CONTRAST text of the DISPLAY list. The user can select 21 different
values of this parameter.
DISPLAY window with CONTRAST text highlighted
Notice: The new value of the contrast is confirmed after each pressing of the <> or <>
push-buttons (new value is selected without any confirmation from the <ENTER> push-button).
The window is closed and the instrument returns to the DISPLAY list after pressing the <ESC> or
<ENTER> push-button.
CONTRAST windows with the change of the contrast
6.5
Setting parameters of the backlight - BACKLIGHT
In the BACKLIGHT window, the user is able to set the brightness of the instrument’s BACKLIGHT
and switch on/off the BACKLIGHT TIMEOUT.
DISPLAY window with BACKLIGHT text highlighted
6-18
SVAN 953 USER MANUAL
6.5.1
Setting brightness of instrument’s backlight- BACKLIGHT
It is possible to change the brightness of the backlight using the <>, <> push-buttons. The user
can select 21 different values of this parameter.
Notice: The new value of the backlight’s brightness is confirmed after each pressing
of the <> or <> push-buttons (new value is selected without any confirmation from the <ENTER> pushbutton).
The window is closed and the instrument returns to the DISPLAY list after pressing the <ESC> or
<ENTER> push-button.
BACKLIGHT windows with the setting of the backlight’s brightness
6.5.2
Automatic switch off of the backlight - BACKLIGHT TIMEOUT
Taking into account the saving of the internal source of the instrument’s power the backlight should
be used relatively rare. It is possible to set the backlight’s automatic switch off.
In the case when this option is set, after 30 seconds from pressing any push-button the backlight
is switched off. If it happened, the first pressing of any push-button would cause the switch on
of the backlight.
The confirmation of the selection is made by pressing the <ENTER> push-button. The return
without taking into account any change is made after pressing the <ESC> push-button.
a)
b)
BACKLIGHT windows with BACKLIGHT TIMEOUT active (a), and not active (b)
6.6
Checking the state of internal battery - BATTERY
The BATTERY enables the user to check the internal battery condition. In order to enter
the window one has to press the <ENTER> push-button on the inversely displayed BATTERY text
of the DISPLAY list. The BATTERY window is closed and the instrument returns to the DISPLAY list after
pressing the <ESC> or the <ENTER> push-button.
DISPLAY window with BATTERY text highlighted
6-19
SVAN 953 USER MANUAL
_
The instrument can be powered from the external power supplier, from the external battery pack,
from four AA standard or AA rechargeable batteries or from the USB interface when its USB Device
socket is connected by means of the cable to a PC. The view presented on the display in each case is
different. The current battery voltage is displayed together with its approximate state (in the graphical
form).
BATTERY windows for different sources powering the instrument
6.7
Checking specification of the instrument - UNIT LABEL
The UNIT LABEL enables the user to check the type of the instrument, its serial number,
the current software versions installed in it and the standards, which the instrument fulfils. In order
to enter the list, one has to press the <ENTER> push-button on the inversely displayed UNIT LABEL text
of the DISPLAY list. The UNIT LABEL sub-list is closed and the instrument returns to the DISPLAY list
after pressing the <ESC> or the <ENTER> push-button.
DISPLAY window with UNIT LABEL text highlighted
After pressing the <>, <> push-buttons the displayed text is scrolled on the display and
the user can check the number of the standard fulfilled by the instrument and the current software version.
The window is closed and the instrument returns to the DISPLAY list after pressing the <ESC> or
<ENTER> push-button.
UNIT LABEL windows opened and scrolled with the <>, <> push-buttons
Notice: The contents of the UNIT LABEL should be always transmitted to the Svantek’s
service in the case of any problems faced by the user during the instrument’s operation.
6-20