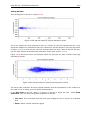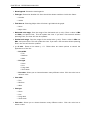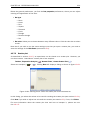
1
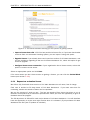
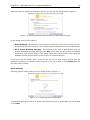
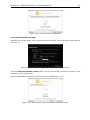
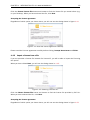
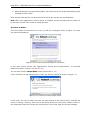
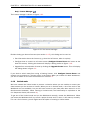
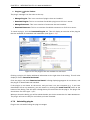
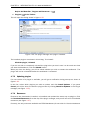
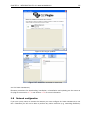
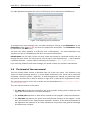
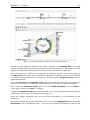
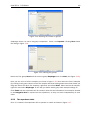
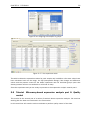
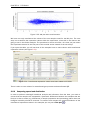
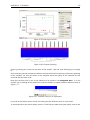
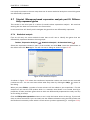
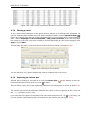
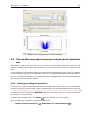
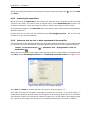
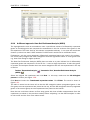
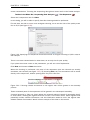
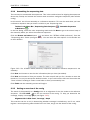
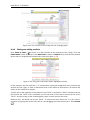
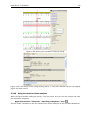
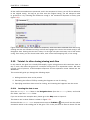
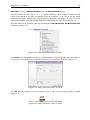
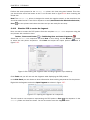
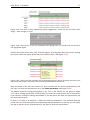
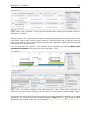
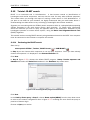
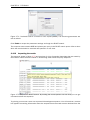
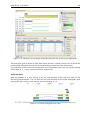
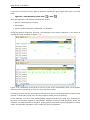
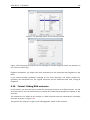
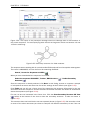
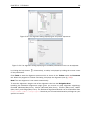
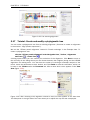
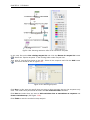
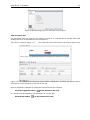
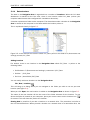
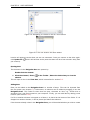
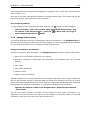
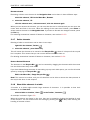
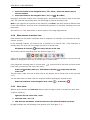
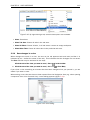
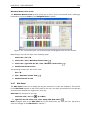
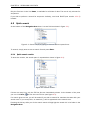
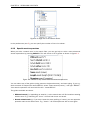
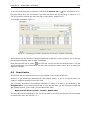
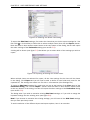
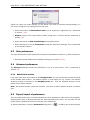
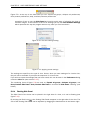
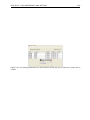
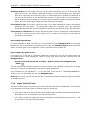
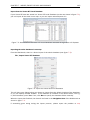
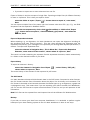
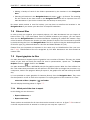
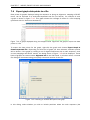
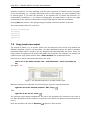
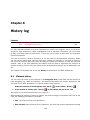
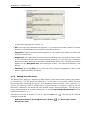
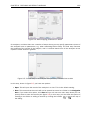
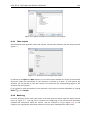
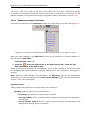
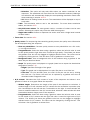
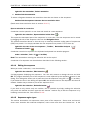
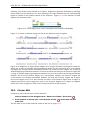
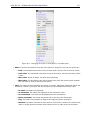
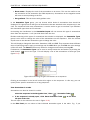
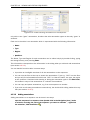
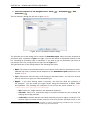
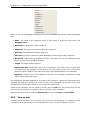
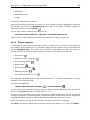
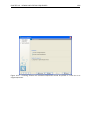
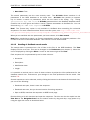
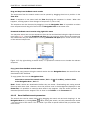
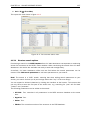
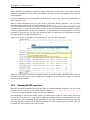
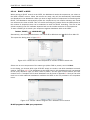
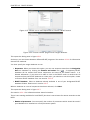
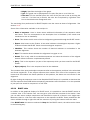
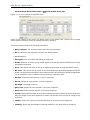
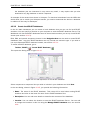
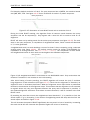
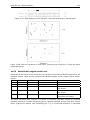
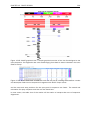
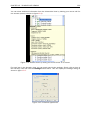
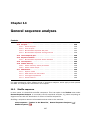
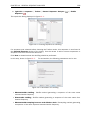
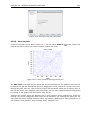
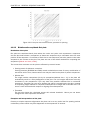
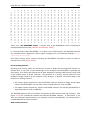
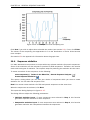
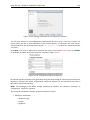
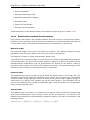
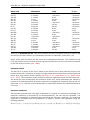
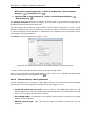
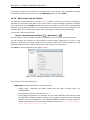
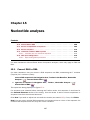
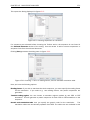
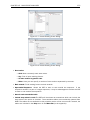
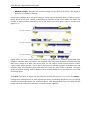
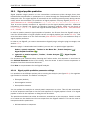
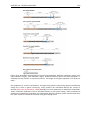
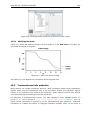
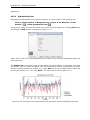
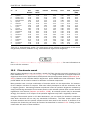
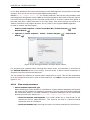
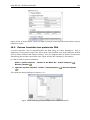
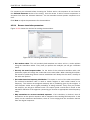
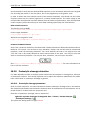
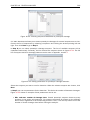
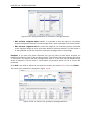
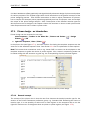
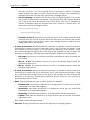
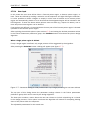
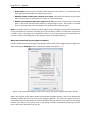
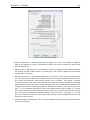
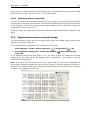
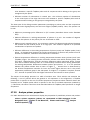
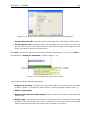
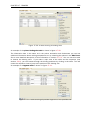
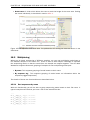
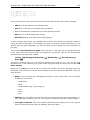
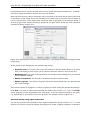
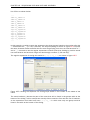
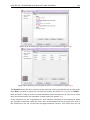
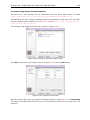
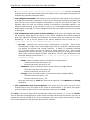
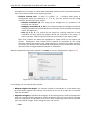
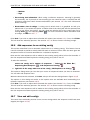
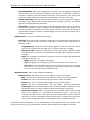
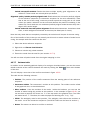
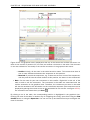
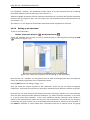
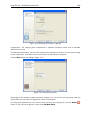
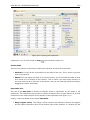
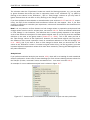
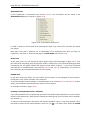
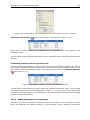
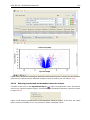
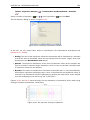
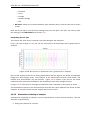
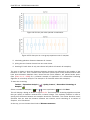
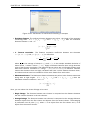
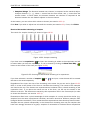
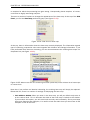
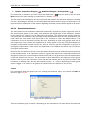
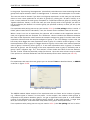
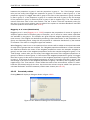
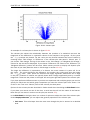
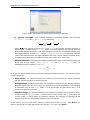
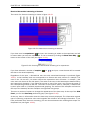
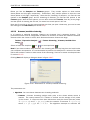
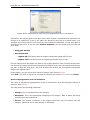
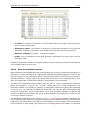
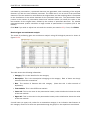
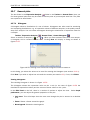
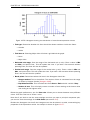
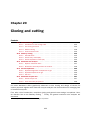
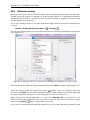
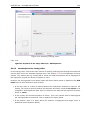
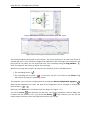
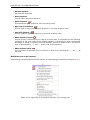
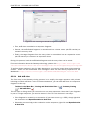
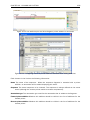
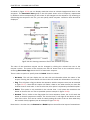
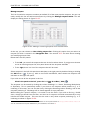
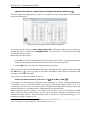
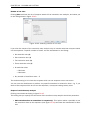
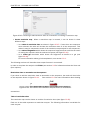
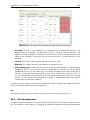
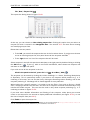
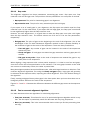
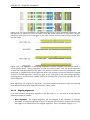
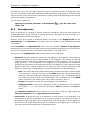
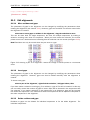
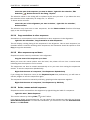
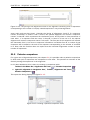
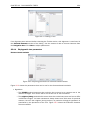
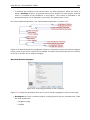
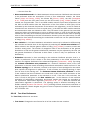
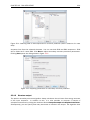
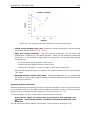
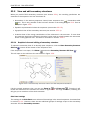
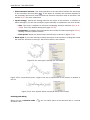
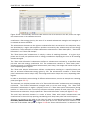
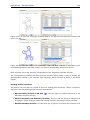
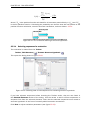
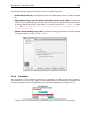
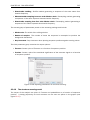
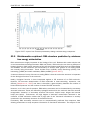
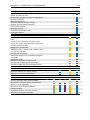
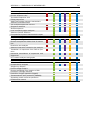
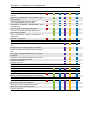
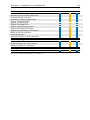
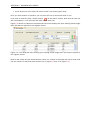
CHAPTER 2. TUTORIALS
56
now ready to proceed to the next step where we do some statistical analysis to see which genes
are differentially expressed.
2.7
Tutorial: Microarray-based expression analysis part III: Differentially expressed genes
This tutorial is the third part of a series of tutorials about expression analysis. We continue
working with the data set introduced in the first tutorial.
In this tutorial we will identify and investigate the genes that are differentially expressed.
2.7.1
Statistical analysis
First we will carry out some statistical tests that we will use to identify the genes that are
differentially expressed between the two groups:
Toolbox | Expression Analysis (
) | Statistical Analysis | On Gaussian Data (
)
Select the experiment created in part I of the tutorials and click Next. Leave the parameters at
the default and click Next again. You will now see a dialog as shown in figure 2.28.
Figure 2.28: Statistical analysis.
As shown in figure 2.28 select the transformed expression values and check the two corrected
p-values as well. You can read more about what they mean by clicking the Help ( ) button in
the dialog.
When you press Finish, a number of extra columns will be added to your experiment. For this
analysis we will use the FDR p-value which is a measure that allows us to control how big a
proportion of false positives (genes that we think are differentially expressed but really are not)
we are willing to accept.
Click the FDR p-value correction column to sort it with the lowest values at the top. If you scroll
down to values around 5E-4 you can clearly see the difference between using the FDR p-value and
the Bonferroni-corrected p-value which is much stricter (p-values approaching 1 - see figure 2.29).