1
USER’S MANUAL
MAY / 06
VERSION 8
FOUNDATION
P V I E WO P C M E
www.smar.com
Specifications and information are subject to change without notice.
Up-to-date address information is available on our website.
web: www.smar.com/contactus.asp
Table of Contents
TABLE OF CONTENTS
INTRODUCTION TO DATASPY ..................................................................................................................... 5
FEATURES OF OPC DATASPY ....................................................................................................................................5
ARCHITECTURE ............................................................................................................................................................5
STARTING OPC DATASPY ...........................................................................................................................................5
TOOLBAR .......................................................................................................................................................................6
MENUS ...........................................................................................................................................................................7
FILE MENU................................................................................................................................................................................... 7
EDIT MENU .................................................................................................................................................................................. 7
VIEW MENU ................................................................................................................................................................................. 7
GO MENU..................................................................................................................................................................................... 8
ACTION MENU............................................................................................................................................................................. 8
TOOLS MENU .............................................................................................................................................................................. 8
HELP MENU ................................................................................................................................................................................. 8
OPC LOCAL AND REMOTE BROWSING .....................................................................................................................9
OPC ENUM BROWSING.............................................................................................................................................................. 9
GENAGENT BROWSING............................................................................................................................................................. 9
REGISTRY BROWSING............................................................................................................................................................... 9
OPC DATA MONITORING ...........................................................................................................................................10
CALLBACK SUBSCRIPTION MECHANISM .............................................................................................................................. 10
CONNECTION TO MULTIPLE OPC SERVERS ........................................................................................................................ 10
OPC DIAGNOSTICS AND ANALYSIS ....................................................................................................................................... 10
OPTIONS.................................................................................................................................................................................... 13
USING OPC DATASPY TO VIEW OPC DATA ACCESS ........................................................................................................... 18
USING OPC DATASPY TO VIEW OPC ALARMS AND EVENTS.............................................................................................. 20
GENBROKER MONITOR ........................................................................................................................................................... 27
FAVORITES ..................................................................................................................................................................32
ADVANCED OPC DATASPY CAPABILITIES ..............................................................................................................32
LOADING AND SAVING............................................................................................................................................................. 33
DRAG-AND-DROP ..................................................................................................................................................................... 33
LOGGING DATA ........................................................................................................................................................................ 33
EMBEDDED PROPERTY PAGES.............................................................................................................................................. 33
LOCALIZATION.......................................................................................................................................................................... 33
ARRAY DATA TYPE................................................................................................................................................................... 33
SELECT LANGUAGE ................................................................................................................................................................. 34
III
OPC DataSpy – User’s Manual
IV
Introduction to DataSpy
INTRODUCTION TO DATASPY
With the introduction of the OPC Foundation Plug and Play communications standard called OPC
Data Access, and recently the OPC Alarm and Events Specifications, a universal diagnostics and
analysis utility was needed by industry. ProcessView fills this need with OPC DataSpy.
Features of OPC DataSpy
OPC DataSpy includes the following key standard features:
• Support for GenBroker Internet communications technology.
• Internet OPC over TCP/IP tag browsing.
• GenBroker Monitor.
• Simple-to-use OPC test client inspection and diagnostics utility.
• Determination of whether OPC server compliance.
• Available as a stand-alone OPC test client.
• OPC Data Access (DA) test client.
• OPC Alarm and Events (AE) test client.
• OPC Data Access troubleshooting tool.
• OPC Alarm and Events troubleshooting tool.
• OPC-compliance testing of third-party servers.
• Determination of OPC standards for OPC servers.
• OPC loading and OPC traffic analysis.
• New support for NT Logger and AlarmWorX Logger.
Architecture
The main concept behind the OPC DataSpy is to provide an easy-to-use OPC Test Client to test,
diagnose, and troubleshoot industrial applications using the OPC Foundations, OPC Data Access,
and Alarm and Events specifications.
The OPC DataSpy tree control capability consists of three main parts:
1. OPC Item Browsing
2. OPC Data and Alarm Monitors
3. GenBroker Monitor
The OPC item browser mode allows you to browse for OPC-compliant Data Access and OPC Alarm
and Event servers, as well as OPC Historical Data Access servers, and to provide basic information
allowing users to view, test, and troubleshoot any OPC third-party servers. The OPC and GenBroker
monitors provide real-time monitoring of OPC server data.
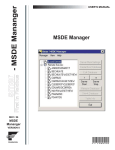
Starting OPC DataSpy
To start OPC DataSpy from the Windows Start menu, select Programs > Smar ProcessView >
DataSpy. The OPC DataSpy screen is displayed, as shown below.
The OPC DataSpy user interface consists of the following elements:
1. OPC Item browser
4. GenBroker Monitor
5. OPC Data and Alarm Monitors
6. Diagnostics and statistics and logging module (output window)
5
OPC DataSpy – User’s Manual
OPC DataSpy Screen
Toolbar
The toolbar, shown below, contains command buttons that enable you to modify the DataSpy
screen. For more information about the functions of these commands, refer to the Menus section.
New: Creates a new document.
Open: Opens an existing document.
Save: Saves the active document.
Monitor Item: Adds an OPC Item to the Monitor.
Back: Moves the cursor back to the previously selected item in the tree control.
Next: Moves the cursor to the next item in the tree control.
Up One Level: Moves up one level in the tree control.
Refresh: Refreshes the current selection.
Copy: Copies the current selection to the clipboard.
Paste: Pastes the current contents of the clipboard.
Large Icons: Displays items as large icons.
Small Icons: Displays items as small icons.
List: Displays items as a list.
Details: Displays items as a list with details.
Properties: Shows the properties of the selected item.
Output: Shows or hides the output window (bottom pane).
Always on Top: Positions the DataSpy window in the foreground of your display.
About: Displays information about the application.
6
Introduction to DataSpy
Menus
The OPC DataSpy menu bar contains the following menus:
•
File
•
Edit
•
View
•
Go
•
Action
•
Tools
•
Help
NOTE
You can also access many of the menu commands by right-clicking items in the tree control and
selecting command functions from the pop-up menus
File Menu
The File menu commands are listed in the table below.
File Menu Commands
COMMAND
New
Open
Save
Save As
Exit
SHORTCUT KEY
CTRL+N
CTRL+O
CTRL+S
FUNCTION
Creates a new .spy document.
Opens an existing .spy document.
Saves the active document.
Saves the active document under a new name.
Closes the application.
Edit Menu
The Edit menu commands are listed in the table below.
Edit Menu Commands
COMMAND
Copy
Paste
Clear Output
Select All
SHORTCUT KEY
CTRL+C
CTRL+V
CTRL+A
Invert Selection
FUNCTION
Copies the selected object to the clipboard.
Pastes the last object placed on the clipboard.
Erases the output window.
Selects all objects in a list.
Unselects all selected items and selects
unselected items in a list.
all
View Menu
The View menu commands are listed in the table below.
View Menu Commands
COMMAND
Toolbars
Status Bar
Large Icons
Small Icons
List
Details
Always on Top
Output
Properties
FUNCTION
Toggles the toolbar.
Toggles the status bar.
Displays items as large icons.
Displays items as small icons.
Displays items as a list.
Displays items as a list along with detailed information about the configuration
of each item.
Positions the DataSpy window in the foreground of your display.
Shows or hides the output window (bottom pane).
Shows the properties of the selected item.
7
OPC DataSpy – User’s Manual
Select
Language
Output Window
Font
Refresh
Options
Opens the Select Language dialog box (see below). Choose the language
you wish to use for your system (Unicode version only) and click OK. For
navigation purposes, use the buttons and check boxes in the List section.
Opens the Font dialog box, which allows you to change the font, font style,
and point size of the text in the output window.
Refreshes the current selection.
Opens the Options dialog box. For more information, see the
OptionsIDH_Options section.
Go Menu
The Go menu commands are listed in the table below.
Go Menu Commands
SHORTCUT
KEYS
COMMAND
Back
ALT+Left Arrow
Forward
ALT+Right Arrow
Up One Level
Backspace
FUNCTION
Moves the cursor back to the previously selected
item in the tree control.
Moves the cursor forward to the previously selected
item in the tree control.
Moves the cursor up one level in the tree control.
Action Menu
The commands on the Action menu vary according to which item is selected in the tree view. The
Action menu matches the right-click pop-up menu for each selected item. For example, if you rightclick Data Monitor in the tree view, the pop-up menu shows the commands Add OPC Item, Add
GenBroker Item, Remove All Items, Ping GenBroker, and Paste. These same commands will
also be available in the Action menu as long as Data Monitor is selected. If you select a different
item in the tree view, the Action menu commands will change accordingly.
The various Action menu commands are described in greater detail throughout this document.
Tools Menu
The Tools menu commands are listed in the table below.
Tools Menu Commands
COMMAND
FUNCTION
Pings the specified GenBroker node. You can see the results of the ping
in the Output window.
Displays a network Internet Control Message Protocol (ICMP) route to a
specified URL or IP address. You can see the results of the trace in the
Output window.
Launches the GenStatistics Viewer. (See the GenStatistics Viewer help
for more information.)
Ping
ICMP Traceroute
GenBroker Statistics
Help Menu
The Help menu commands are listed in the table below.
Help Menu Commands
COMMAND
Help Topics
About Application
8
SHORTCUT KEY
F1
FUNCTION
Launches the online help for the Configurator.
Launches the About Box, which contains information
about the product version number, copyright, and
available disk space. It also contains contact
information.
Introduction to DataSpy
OPC Local and Remote Browsing
The Browse Interface supports both the local computer and remote OPC servers through several
different OPC connection methods. The OPC DataSpy client has built-in capabilities to browse the
local registry of the computer as well as the WAN and LAN networks via DCOM. You can select
from a list of all the OPC servers available on the local PC or across the network using a simple tree
control.
OPC tag browsing of OPC servers can be performed using any of the following three methods:
•
OPC ENUM Browsing
•
GenAgent Browsing
•
Registry Browsing
OPC ENUM Browsing
OPC ENUM was introduced with the OPC 2.0 Data Access (DA) specification, so it may not browse
OPC DA 1.0 servers. It can be used for browsing OPC servers (except XML DA servers). The OPC
ENUM is provided by the OPC Foundation, and is the most generally used approach for browsing
OPC Data Access servers. Since the OPC ENUM was specified after the OPC DA 1.0 specification
was released, some OPC DA 1.0 servers may not be accessible with the OPC ENUM browsing
method.
GenAgent Browsing
GenAgent Browsing is an advanced tag browsing approach used for browsing servers located on
Internet and intranet-based systems. GenAgent is provided as a standard part of ProcessView
products, and is specifically used as part of the Internet-based WebHMI product. It is similar to OPC
ENUM browsing, except GenAgent can browse OPC DA 1.0 servers. This is the preferred method of
browsing OPC servers.
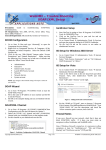
Registry Browsing
Registry-based tag browsing involves using the Windows Registry, and looking for registered OPC
servers performs OPC tag browsing of these OPC servers. Unlike the other two browsing methods,
this method involves scanning the remote PC's registry. This is why this method is used when the
other methods fail. You can select browsing methods using the Options dialog box, shown below,
which is opened by selecting Options from the View menu. For more information, refer to the
Browsing section.
OPC DataSpy Browsing Options
9
OPC DataSpy – User’s Manual
OPC Data Monitoring
OPC DataSpy enables the following types of data monitoring:
• Callback Subscription Mechanism
• Connection to Multiple OPC Servers
• OPC Diagnostics and Analysis
• Options
• Using OPC DataSpy to View OPC Data Access
• Using OPC DataSpy to View OPC Alarms and Events
• GenBroker Monitor
Callback Subscription Mechanism
OPC DataSpy uses callbacks from the OPC server for getting data. The callback mechanism
(IAdviseSink or connection points) depends on the DA server. You can select one of them if both are
available. By default, the subscription is established when a new OPC group is created. The
connection point mechanism is used to get the alarm updates. OPC DataSpy uses a synchronous
write operation to write values to OPC servers.
OPC Data Access 1.0
OPC DataSpy provides the capability to get data using IAdviseSink.
OPC Data Access 2.0
OPC DataSpy provides the capability to get data using connection points.
OPC Alarm and Events 1.0
OPC DataSpy provides the capability to get alarms and events and acknowledge them from any
OPC 1.0 Alarm and Events server.
Connection to Multiple OPC Servers
It is possible to connect to multiple OPC servers in the Connected tree.
Also, it is possible to create multiple OPC groups in an OPC DA server and multiple event
subscriptions in an OPC AE server.
Data coming from all servers are displayed together in the Monitor subtrees. Particular OPC
servers and OPC groups or event subscriptions are shown in the Connected subtree.
OPC Diagnostics and Analysis
The OPC DataSpy client performs many diagnoses and compliance testing of OPC servers:
• Versioning
• Server Properties
• Group/Item Properties
• OPC Call Logger
Versioning
OPC DataSpy detects whether servers were written according to OPC 1.0 or 2.0 specifications.
Server Properties
OPC DataSpy provides information about connected OPC DA and AE servers. To view the
properties of a connected server, click on the server in the tree view and click the Properties button
on the toolbar, or select Properties from the View menu. This opens the Server Properties dialog
box, which contains the following tabs.
10
•
Interfaces
•
Server Status
Introduction to DataSpy
Interfaces
OPC DataSpy can display all supported and unsupported interfaces from the server. When you
select a connected server in the tree view and then click the Properties button on the toolbar, or
select Properties from the View menu, the Properties dialog box will open. The Interfaces tab of
the Properties dialog box contains information about all interfaces from the server, as shown in the
example below for an OPC DA server.
Server Properties Dialog Box: Interfaces Tab
Server Status
OPC DataSpy provides status information for all connected servers. When you select a connected
server in the tree view and then click the Properties button on the toolbar, or select Properties from
the View menu, the Properties dialog box will open. The Properties dialog box for servers contains
a Server Status tab, which displays all information regarding the status of the server: start time,
current time, last update time, number of groups, band width percentage, update rate, and current
state of the server. Clicking the Refresh button refreshes the last update time.
Server Properties Dialog Box: Server Status Tab
Group/Item Properties
OPC DataSpy not only provides information about the properties of connected servers, but it also
displays the current status of both groups and items that are connected to those servers.
Group Properties
To view the group properties for an OPC DA server, select the group in the tree view and then click
the Properties button on the toolbar, or select Properties from the View menu. This opens the
11
OPC DataSpy – User’s Manual
OPC DA Group Properties dialog box, shown below. The Group State tab shows information
about the group, including the group name, scan rate, and the deadband percentage.
Group Properties Dialog Box: Group State Tab
The Interfaces tab of the OPC DA Group Properties dialog box, shown below, contains
information about all interfaces from the server.
Group Properties Dialog Box: Interfaces Tab
Item Properties
When you select an OPC item in an OPC DA group, the item's properties are displayed in the righthand pane of the OPC DataSpy screen, as shown below.
Item Properties
12
Introduction to DataSpy
OPC Call Logger
OPC DataSpy is capable of logging calls made to OPC servers and their results. OPC DataSpy
traces and logs OPC calls. The output window (bottom pane) of the OPC DataSpy screen, shown
below, indicates whether those calls were successful in communicating to the OPC server. To show
or hide the output window, select Output from the View menu, or click the Output button on the
toolbar.
OPC Call Log in the Output Window
Options
You can specify several display settings for data monitoring using the Options dialog box, shown
below. To open the Options dialog box, select Options from the View menu.
Options Dialog Box
The Options dialog box contains the following tabs:
•
Environment
•
Tree
•
Browsing
•
DA Defaults
•
AE Defaults
•
Output
•
GenClient
13
OPC DataSpy – User’s Manual
Environment
•
•
•
•
The Environment tab of the Options dialog box affects the DataSpy user interface in general.
Refresh rates. You can set the refresh rates for the values of both data and alarm items. These
rates determine how often the list view in the right-hand pane of the display is refreshed.
Embedded property pages. If this option is checked, the Properties dialog box will be
embedded in the right-hand pane of the display when Properties is selected from the View menu.
Displaying the data type. Data values and OPC item properties are represented by variants.
They may be displayed with or without their data types (e.g. VT_R8). If Display Data Type at Values
is checked, the value type for each item will be displayed next to the value under the Value column.
If Display Data Type at Properties is checked, the data type for each OPC item will be displayed in
the right-hand pane under the Data column. If Display Number of Updates Timestamp is checked,
the number of updates for each OPC item will be displayed in the right-hand pane under the
Timestamp column.
Use CLSIDs. When an item is copied and pasted elsewhere (e.g. Notepad) and the Use CLSIDs
when pasting item names as text check box is checked, the server will be identified either by its
CLSID or ProgID.
Options Dialog Box: Environment Tab
Tree
The Tree tab in the Options dialog box allows you to select settings for the Connected tree in the
OPC DataSpy screen. All boxes are checked by default.
• Expanding. If the Expand... options are checked, the root, DA servers, DA groups, or
subscriptions in the tree will automatically expand when items are added to them.
• Establish update callback when a DA group is selected. If a group is created in an OPC
server and this option is checked, the update callback is established when the group is created.
Otherwise you have to establish the callback connection manually to get updates.
• Show the "Connected" tree. This option shows or hides the Connected tree in the left-hand
pane of the screen. For example, if you are not interested in how the groups are structured in the
OPC servers, you may want to hide the Connected tree.
• Show the "GenBroker" tree. This option shows or hides the GenBroker tree in the left-hand
pane of the screen.
14
Introduction to DataSpy
Options Dialog Box: Tree Tab
Browsing
The Browsing tab in the Options dialog box allows you to select methods for local and remote
browsing for OPC servers.
•
•
•
•
•
Connect to OPC servers on expand. When this option is checked, a connection to a server
will be made when you click the "+" sign in the tree view next to the server. Otherwise you have
to connect to the server manually by right-clicking the server.
Get item IDs/AE areas one by one. This option allows you to enumerate item IDs or areas
either one by one or all at once. This would be useful if for example, if you experienced
problems with servers when item IDs are gotten all at once.
Use OPC ENUM. This option specifies whether to use OPC ENUM to get a list of available
servers from a node.
Use Smar GenAgent when available. This option determines whether to use GenAgent to get
the list of available servers from a node .
Use Smar Universal Tag Browser. When this option is checked, you can use the Unified Data
Browser to browse for OPC items.
Options Dialog Box: Browsing Tab
15
OPC DataSpy – User’s Manual
DA Defaults
The DA Defaults tab of the Options dialog box allows you to specify the default settings for OPC
Data Access groups. When you right-click on an OPC DA server and select Add Group (default) to
create a default group, these settings will be displayed in the right-hand pane when that group is
selected.
You can set the Default Scan Rate (in milliseconds), the Default LCID, and the Default Deadband
percentage. The Requested Type is the default type when adding an item.
Options Dialog Box: DA Defaults Tab
AE Defaults
The AE Defaults tab of the Options dialog box allows you to specify the default settings for OPC
Alarm and Events subscriptions. When you subscribe to a connected alarm or event server in the
tree view, these settings will be displayed in the right-hand pane when that server's subscription is
selected.
You can specify the Default Buffer Time (in msec) and the Default Maximum Size for
subscriptions. The Display at Most field specifies the maximum number of alarms that may be
displayed. The Acknowledger ID and Acknowledger Comment fields specify the default
parameters for acknowledging alarms. If the Remove Conditions After Being Acknowledged
option is checked, a condition will be removed from the display after it is acknowledged.
16
Introduction to DataSpy
Options Dialog Box: AE Defaults Tab
Output
The Output tab of the Options dialog box allows you to configure settings for data in the output
window (bottom pane). You can choose to show DataSpy messages, OPC calls, and
"CreateInstance" calls. You can also choose to log the output data to a file. Clicking the ... button to
the right allows you to select a log file for output.
Options Dialog Box: Output Tab
GenClient
The GenClient tab of the Options dialog box allows you to select settings for the GenBroker
monitor. If Display Data Type at Values is checked, the value type for each OPC item in the
GenBroker monitor will be displayed next to the value under the Value column. You can choose to
show GenClient calls in the output window (bottom pane). In addition, you can specify the Default
Scan Rate (in milliseconds) for requesting points and the Default Ping Rate (in seconds) for
pinging a GenBroker node.
17
OPC DataSpy – User’s Manual
Options Dialog Box: GenClient Tab
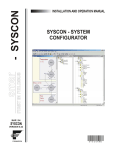
Using OPC DataSpy to View OPC Data Access
You can use OPC DataSpy to view data from OPC Data Access servers. The OPC Data Monitor
tracks the status of items in connected OPC servers under the My Computer and Network
Neighborhood subtrees of the OPC Items tree. When you select Data Monitor in the tree view, the
name, value, quality, timestamp, and state of the OPC items are displayed in the right-hand pane of
the OPC DataSpy screen, as shown below.
OPC Data Monitoring
There are several ways to get an OPC item on scan:
• Adding an OPC Item With Default Parameters
• Adding an OPC Item to a Nondefault Group
Adding an OPC Item With Default Parameters
To add an OPC item with default parameters, do any one of the following:
• Right-click the Data Monitor in the tree view and select Add OPC Item, as shown below. (You
can also select Add Item from the Action menu while the Data Monitor is selected.) This opens the
Unified Browser, which enables you to select an item to add to the OPC server.
18
Introduction to DataSpy
Adding an OPC Item From the Data Monitor
• Click the Monitor Item button on the toolbar and select the desired item from the Unified
Browser.
• Right-click the desired item in the OPC Items tree and select Monitor, as shown below. If you
wish to monitor all items for a particular server, right-click on the server name and select Monitor All
Items.
Adding an OPC Item From the OPC Items Tree
•
Drag the item from the OPC Items tree and drop it on the Data Monitor or Connected icons.
OPC DataSpy then creates an OPC Group in the corresponding server, if necessary, and adds the
item to it. Group parameters can be preset in the DA Defaults tab of the Options dialog box. You
can also add a group manually by right-clicking a server name in the Connected tree and selecting
Add Group (default).
19
OPC DataSpy – User’s Manual
Using OPC DataSpy to View OPC Alarms and Events
You can use OPC DataSpy to view OPC alarms and events from OPC AE servers, as shown below.
Viewing Alarms and Events
Viewing Alarms and Events
To get alarms and events from an OPC AE server, do the following:
1. Right-click the Connected tree and click Add Server, as shown below.
Adding a Server
2. This opens the Select an OPC Server dialog box, shown below. Select an OPC AE server, as
shown below. The selected server now appears under the Connected tree.
20
Introduction to DataSpy
Selecting an OPC Server
3. Create an event subscription in that server by right-clicking the server and selecting Create
Event Subscription, as shown below.
Creating an Event Subscription
4. You may create a subscription with default parameters, which can be preset in the AE Defaults
tab of the Options dialog box. Or you can specify parameters in the Create Subscription dialog
box, shown below. The new subscription appears under the OPC AE server under the
Connected tree.
Create Subscription Dialog Box
21
OPC DataSpy – User’s Manual
5. When you click on the newly created subscription, you will see alarms coming from the selected
subscription in the right pane of the OPC DataSpy screen under the Alarm Monitor, as shown
below. This displays the source, time, message, event type, category, and severity of each
alarm. To acknowledge an alarm, right-click the alarm and select Acknowledge. For more
information about subscriptions, please see the section about Subscriptions.
Alarm Subscription
Subscriptions
After you have created an alarm-and-event subscription, you may set filters on it by right-clicking the
subscription and selecting Set Filter, as shown below. Alternatively, you can unsubscribe from the
server by selecting Remove. In addition, you can refresh or clear the display.
NOTE
For more information about alarm filters and subscriptions, please see the AlarmWorX Help
documentation.
Setting Subscription Filters
Selecting Set Filter, as shown above, opens the Set Subscription Filter dialog box, which contains
the following tabs:
22
•
Type and Severity
•
Event Categories
•
Areas
•
Sources
Introduction to DataSpy
Type and Severity
The Type and Severity tab in the Set Subscription Filter dialog box, shown below, allows you to
choose which event types to display for the subscription: simple, condition, and tracking. It also
enables you to specify a range for the severity.
A value of "0" represents the low severity value, and "1000" represents the high severity value.
Please note that OPC Alarm and Event (AE) servers are required to scale severity values to the
OPC ranges (i.e. an AE server that contained two severity ranges would convert these to "0" and
"1000").
Set Subscription Filter Dialog Box: Type and Severity Tab
•
Simple: These messages state information but do not have alarm status, nor do they contain
information on what initiated the message. This includes the following information: Source,
Time, Type, EventCategory, Severity, Message, Cookie, and server-specific items.
Example: "FIC101, 12:0:0 1/1/99, Simple, Category1, 100, 'Shift Change', 1"
Simple messages would be similar to an event.
•
Tracking: These messages contain the additional information about the client that initiated the
event. This includes the following information: Source, Time, Type, EventCategory, Severity,
Message, Cookie, ActorID, and server-specific items.
Example: "FIC101, 12:0:1 1/1/99, Tracking, Category1, 300, 'Pump pressure Set to 10 psi', 1,
Station 12"
Tracking messages are similar to event messages in that the cause of the event is important. An
example would be an operator changing a setpoint value. This type of message does not include
acknowledge capability.
•
Note: Simple and tracking messages are removed from the alarm viewer via the acknowledge
mechanism.
•
Condition: These messages contain all of the above information but also include an
acknowledgement portion. This includes the following information: Source, Time, Type,
EventCategory, Severity, Message, Cookie, ConditionName, SubConditionName, ChangeMask,
NewState, ConditionQuality, AckRequired, ActiveTime, ActorID and server-specific items.
Example: "FIC101, 12:0:3 1/1/99, Condition, Category1, 700, 'Pump pressure to high', 1, Limit, HiHi,
1,Active Enabled, Good, TRUE, 12:0:2 1/1/99"
Condition messages would be considered a "typical" alarm message with acknowledge capability.
For further details on any of the included information, please refer to the OPC Alarm and Events
specification.
23
OPC DataSpy – User’s Manual
Event Categories
The Event Categories tab in the Set Subscription Filter dialog box, shown below, allows you
choose which event categories to display for the subscription. Click the desired categories in the
Available Categories list, and then click Add to add them to the Selected Categories list. Click
Remove to remove categories from the list of selected categories.
Set Subscription Filter Dialog Box: Event Categories Tab
Event Types and Categories
All events generated are of the OPC defined Event Type Condition. The AlarmWorX Server defines
the following Event Categories and uses the identical names for the Condition Names:
•
Deviation
•
Digital
•
Limit
•
Rate of Change
The Limit and Deviation conditions have the following Sub-conditions:
•
HiHi
•
Hi
•
Lo
•
LoLo
Note: The following categories are not used in the ProcessView Alarm Server:
•
OPC Server Error
•
System Configuration
•
System Message
Areas
The Areas tab in the Set Subscription Filter dialog box, shown below, allows you choose which
areas to display for the subscription.
24
Introduction to DataSpy
Set Subscription Filter Dialog Box: Areas Tab
To add an area, click the Add button. This opens the Select an Area dialog box, shown below.
Select an area from the list, and then click OK. The area (Plant Area B, in this case) now appears in
the Areas tab of the Set Subscription Filter dialog box, as shown above. Now the subscription will
display data for sources that are in the selected area. To remove an area, select the area and then
click Remove.
Select an Area Dialog Box
Sources
The Sources tab in the Set Subscription Filter dialog box, shown below, allows you choose
specific sources to display for the subscription.
25
OPC DataSpy – User’s Manual
Set Subscription Filter Dialog Box: Sources Tab
To add a source, click the Add button. This opens the Select a Source dialog box, shown below.
Select a source from the list, and then click OK. The sources you have selected ("Humidity" and
"Pump1" in this case) now appear in the Sources tab of the Set Subscription Filter dialog box, as
shown above. Now the subscription will display data for the selected sources. To remove a source,
select the source and then click Remove.
Select a Source Dialog Box
Subscription Properties
To view the properties of an AE subscription, select the subscription in the tree view and then select
Properties from the View menu, or click the Properties button on the toolbar. This opens the AE
Subscription Properties dialog box. The State tab, shown below, provides status information for
the subscription.
26
Introduction to DataSpy
AE Subscription Properties Dialog Box: State Tab
The Filter tab, shown below, contains information about the subscription filters that have been set in
the Set Subscription Filter dialog box.
AE Subscription Properties Dialog Box: Filter Tab
GenBroker Monitor
Just as you use the OPC Monitor to view data from OPC servers, you can also use the GenBroker
Monitor in the tree view of the OPC DataSpy screen to view data from OPC DA and AE servers.
The difference is that the GenBroker Monitor uses GenClient/GenBroker communication to monitor
data from connected OPC servers under the Internet subtree of the OPC Items tree. When you
select GenBroker Monitor in the tree view, the name, value, quality, and timestamp of the OPC
items are displayed in the right-hand pane of the OPC DataSpy screen, as shown below.
27
OPC DataSpy – User’s Manual
GenBroker Monitor
Pinging a GenBroker Node
To ping a GenBroker node:
1. Right-click the GenBroker Monitor and select Ping, as shown below.
Pinging a GenBroker Node
2. Type in a node name (URL or IP address) in the Node to Ping field, as shown below. To test the
connection, check the Check TCP/IP Connection First check box. Click OK.
Specifying the Node Name
3. See the ping and Trace Route messages in the Output window.
NOTE
You can also ping for a trace route by selecting Internet Control Message Protocol (ICMP) Trace
Route from the Tools menu. This displays a network route to a specified URL or IP address.
Click the Start button to begin the trace. You can see the results of the trace in the Output
window.
28
Introduction to DataSpy
Pinging a Trace Route
Alternatively, you can:
1. Browse for the node you wish to ping under the Internet tree.
2. Right-click the node and select Ping.
Pinging an OPC DA Server
To ping an OPC DA server, browse to the server under the Internet tree, right-click the server
name, and select Ping Server from the pop-up menu. The latest version of GenBroker must be
present on the server node.
Using the GenBroker Monitor to View OPC Data Access
To view OPC DA servers using the GenBroker Monitor, do the following:
1. Under the GenBroker Monitor, right-click Data and select Request Point, as shown below.
Requesting a Data Point
2. This opens the Request Point dialog box, shown below, which allows you to select an OPC
item to monitor. The default settings are specified in the GenClient tab of the Options dialog box.
To select an OPC item, click the ... button to the right of the Point Name field. This opens the
Unified Data Browser. Select an OPC Data Access tag from the Internet subtree in the Unified
Browser. The tag name appears in the Point Name field, as shown below.
29
OPC DataSpy – User’s Manual
Request Point Dialog Box
3. Click OK. The tag now appears under Data under the GenBroker monitor. To write a value to
the tag, right-click on the item and select Write, as shown below. This opens the Enter a Value
dialog box, shown below, which allows you to specify a value. Alternatively, you can release the tag
from the monitor.
Writing a Value to the Tag
Enter a Value Dialog Box
4. To get a specified property for a tag, right-click the tag and select Get Property. This opens the
Get Property dialog box, shown below. The properties are defined by the OPC 2.0 specifications.
Select a Property Name, and then click Get It! The value will be displayed in the Property Value
field. The property will also be displayed in the output window.
30
Introduction to DataSpy
Get Property Dialog Box
Using the GenBroker Monitor to View OPC Alarms and Events
To view OPC AE servers using the GenBroker Monitor, do the following:
1. In the GenBroker Monitor tree, right-click Alarms and select select Subscribe, as shown below.
Subscribing to an OPC AE Server
1. Select an OPC AE server, and then click OK. The subscription now appears under Alarms in the
GenBroker Monitor, as shown below. Click on the subscription in the tree to view alarms in the
right-hand pane.
Viewing an Alarm Subscription in GenBroker
31
OPC DataSpy – User’s Manual
Favorites
The Favorites item located under the Internet (with GenBroker) tree in the DataSpy tree control,
shown in the figure below, enables you specify frequently connected network nodes and servers.
Right-click the Favorites item and select Add Favorite from the pop-up menu, as shown in the
figure below.
Adding a Favorite Item
In the Add Favorite dialog box, choose an item type from the drop-down list, as shown in the figure
below:
•
Node: Specify a computer name.
•
Data Server: Specify a computer name or URL.
•
Alarm Server: Specify the name of the alarm and events server.
•
HDA Server: Specify the name of the historical data access server.
Selecting an Item Type To Add to Favorites
Advanced OPC DataSpy Capabilities
Advanced capabilities of OPC DataSpy include:
32
•
Loading and Saving
•
Drag-and-Drop
•
Logging Data
•
Embedded Property Pages
•
Localization
•
Array Data Type
•
Select Language
Introduction to DataSpy
Loading and Saving
OPC DataSpy is capable of loading and saving its configuration. When loading a DataSpy file, OPC
DataSpy automatically connects to OPC servers, and appropriate objects are created on the server
side. In addition, the callback subscription is set up. To load a DataSpy (.spy) file, select Open from
the File menu. The resulting dialog box allows you to browse for a file. To save a document as a
DataSpy file, select Save As from the File menu. Enter the file name in the resulting dialog box, and
then click OK.
Drag-and-Drop
As mentioned above, it is possible to monitor an OPC item by simply dragging the item from the
OPC Item tree to the Connected tree. One or more items can be dragged at the same time. You
can add items to a specific group by simply dropping the items on that group. When items are
dropped on the server, an existing group is used or a new one is created.
Logging Data
OPC DataSpy can display all OPC calls, CreateIinstance calls, and internal messages in the output
window (bottom pane). You can choose to hide or display the output window by selecting Output
from the View menu, or by clicking the Output button on the toolbar. The same information may be
logged into a file. Specify the log file in the Output tab of the Options dialog.
Embedded Property Pages
The properties of a selected OPC server, group, item, or subscription can be displayed as a part of
the right-hand pane, as shown below, or they can be shown in a separate dialog box. You can
choose they way you want the properties to be shown by using the Embedded Property Pages
option in the Environment tab of the Options dialog box.
Note: The embedded property pages are not available for Windows CE.
Embedded Properties Dialog Box
Localization
The OPC DataSpy is localized.
Array Data Type
OPC DataSpy supports array data types. When writing to an array item, use commas to separate
the array entries.
33
OPC DataSpy – User’s Manual
Select Language
The Select Language function on the View menu allows you to choose which language to use in
your display. Choosing Select Language from the View menu opens the Select Language dialog
box, shown in the figure below.
NOTE
A language resource .dll is required for language switching
Select Language Dialog Box
Define the parameters listed in the table below. Then click OK to return to the work area.
Select Language Parameters
PARAMETER
34
DESCRIPTION
List
Lists available languages. Depending on which
item you have selected, the view on the left will
change. If English is checked, the languages will
appear as their English name. If Localized is
checked, the languages will appear with the native
country in parentheses (for languages with several
dialects only). When Native is checked, the
languages are displayed the way they would be
written in that language.
Installed Locales Only
If this is checked, local languages appear in the
box.
Available Language Translations Only
Checking this box allows you to choose from
available language translations only.