1
Measure Menu
4.1.4
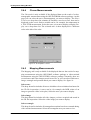
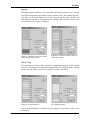
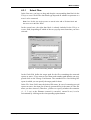
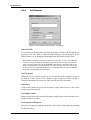
Z-Axis
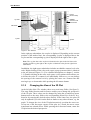
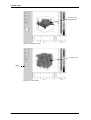
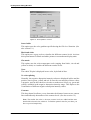
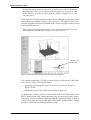
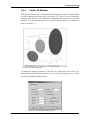
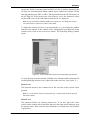
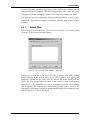
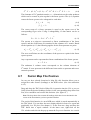
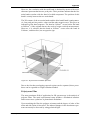
Define the z-axis range by entering appropriate values in the Z-Starting point
and Z-End point fields and select an appropriate time unit for the z-axis from the
drop-down list. A linear trace will be added to the result file. The intensity scale
of this trace will be defined by the start- and endpoint of the z-axis.
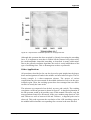
Figure 42: Assemble GC File Dialog Window - Z-Axis
4.1.5
Raster
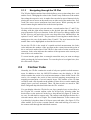
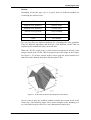
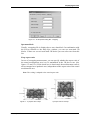
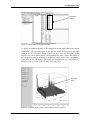
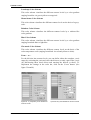
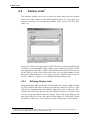
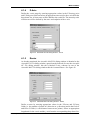
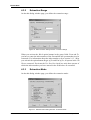
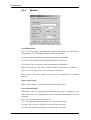
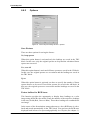
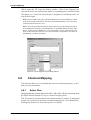
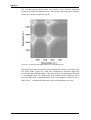
As already mentioned, the Assemble MAP File dialog window is identical to the
Assemble GC File dialog window, apart from the forth tab. In case the Assemble
GC File dialog window, this tab is labeled Z-Axis, whereas in case of the
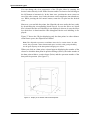
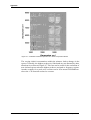
Assemble MAP File dialog window this tab is named Raster. See figure 43.
Figure 43: Assemble MAP File Dialog Window - Raster
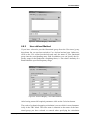
Define a raster by entering appropriate values in the X-Points and Y-Points
fields (i.e. the number of points in x-direction or y-direction) and in the Delta X
and Delta Y fields (i.e. the distance between two points). Select an appropriate
length unit for the x-axis and the y-axis from the corresponding drop-down list.
Bruker Optik GmbH
OPUS/3D
39