1
Appendix
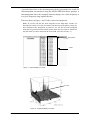
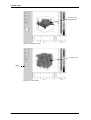
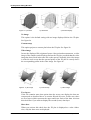
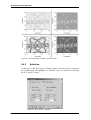
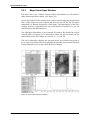
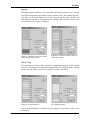
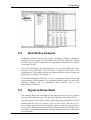
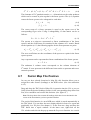
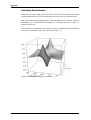
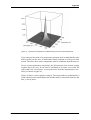
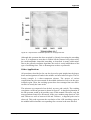
Figure 46: Asynchronous Correlation Spectrum of a Polystyrene Film
Although this spectrum has been acquired by linearly increasing the stretching
force, it is important to note that it exhibits all the features being observed by
the small-amplitude sinusoidal stretching as described in many publications.
Due to the general correlation algorithm, the result is vastly independent of the
type of stretching force. This is advantageous to these experiments.
Other Applications
All procedures described so far can also be used to gain insight into the dependence and assignment of bands in the middle- and near-infrared region. The following example is a three-component mixture. The spectra of various
compositions have been measured in the middle-infrared as well as in the nearinfrared region. Then, the resulting spectra have been arranged into two different files in exactly the same order.
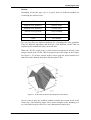
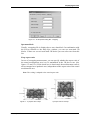
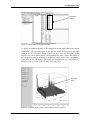
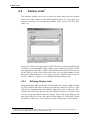
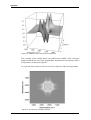
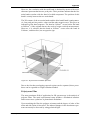
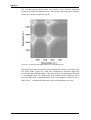
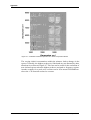
The mixtures are composed of an alcohol, an ester, and a nitrile. The resulting
correlation coefficient spectrum is shown in figure 47. A detailed explanation of
the 2D spectrum would go beyond the scope of this manual. Therefore, only the
most prominent features are discussed. In the wave number range between 3100
and 3500cm-1as well as between 6100 and 7000cm-1, a diagonal peak can be
observed. This peak represents the correlation of the -OH stretching region in
the middle-infrared and the corresponding first overtone in the near-infrared.
Bruker Optik GmbH
OPUS/3D
A-9