1
CHAPTER 14. RESTRICTION SITE ANALYSES
171
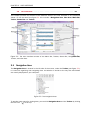
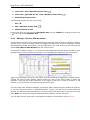
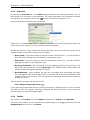
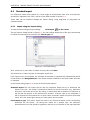
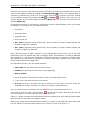
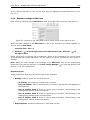
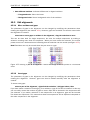
• Create restriction map. The restriction map is a table of restriction sites as shown in
figure 14.15. If more than one sequence were selected, the table will include the restriction
sites of all the sequences. This makes it easy to compare the result of the restriction map
analysis for two sequences (or more).
The following sections will describe these output formats in more detail.
In order to complete the analysis click Finish (see section 8.1 for information about the Save and
Open options).
14.2.4
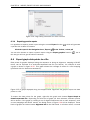
Restriction sites as annotation on the sequence
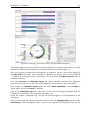
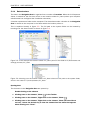
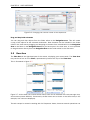
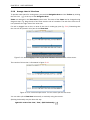
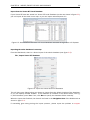
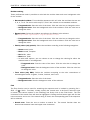
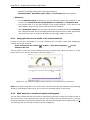
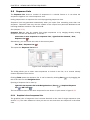
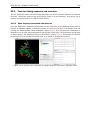
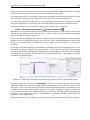
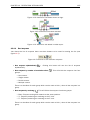
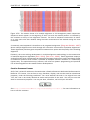
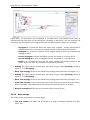
If you chose to add the restriction sites as annotation to the sequence, the result will be similar
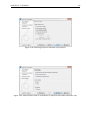
to the sequence shown in figure 14.14.
See section 9.3 for more information about viewing
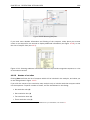
Figure 14.14: The result of the restriction analysis shown as annotations.
annotations.
14.2.5
Table of restriction sites
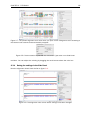
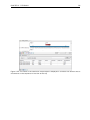
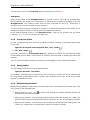
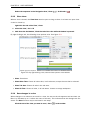
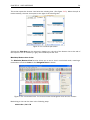
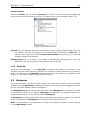
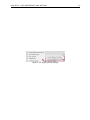
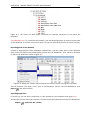
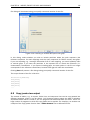
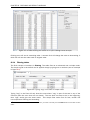
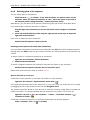
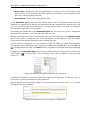
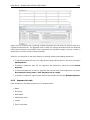
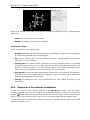
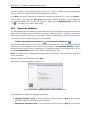
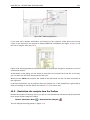
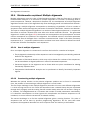
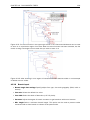
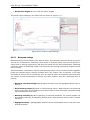
The restriction map can be shown as a table of restriction sites (see figure 14.15).
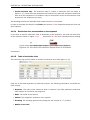
Figure 14.15: The result of the restriction analysis shown as annotations.
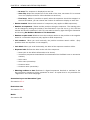
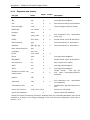
Each row in the table represents a restriction enzyme. The following information is available for
each enzyme:
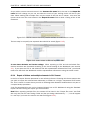
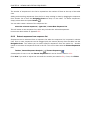
• Sequence. The name of the sequence which is relevant if you have performed restriction
map analysis on more than one sequence.
• Name. The name of the enzyme.
• Pattern. The recognition sequence of the enzyme.
• Overhang. The overhang produced by cutting with the enzyme (3', 5' or Blunt).
• Number of cut sites.