1
DRAFT
CodeWarrior™
Development Studio for
Microcontrollers V10.x
Targeting Manual
Revised: January 21, 2010
Freescale™ and the Freescale logo are trademarks of Freescale Semiconductor, Inc. CodeWarrior is a trademark or registered trademark of Freescale Semiconductor, Inc. in the United States and/or other countries. PROCESSOR EXPERT
and EMBEDDED BEANS are trademarks of Freescale Semiconductor, Inc. All other product or service names are the
property of their respective owners.
Copyright © 2010 Freescale Semiconductor, Inc. All rights reserved.
Information in this document is provided solely to enable system and software implementers to use Freescale Semiconductor products. There are no express or implied copyright licenses granted hereunder to design or fabricate any integrated circuits or integrated circuits based on the information in this document.
Freescale Semiconductor reserves the right to make changes without further notice to any products herein. Freescale
Semiconductor makes no warranty, representation or guarantee regarding the suitability of its products for any particular purpose, nor does Freescale Semiconductor assume any liability arising out of the application or use of any product
or circuit, and specifically disclaims any and all liability, including without limitation consequential or incidental damages. “Typical” parameters that may be provided in Freescale Semiconductor data sheets and/or specifications can and
do vary in different applications and actual performance may vary over time. All operating parameters, including “Typicals”, must be validated for each customer application by customer's technical experts. Freescale Semiconductor does
not convey any license under its patent rights nor the rights of others. Freescale Semiconductor products are not designed, intended, or authorized for use as components in systems intended for surgical implant into the body, or other
applications intended to support or sustain life, or for any other application in which the failure of the Freescale Semiconductor product could create a situation where personal injury or death may occur. Should Buyer purchase or use
Freescale Semiconductor products for any such unintended or unauthorized application, Buyer shall indemnify and hold
Freescale Semiconductor and its officers, employees, subsidiaries, affiliates, and distributors harmless against all
claims, costs, damages, and expenses, and reasonable attorney fees arising out of, directly or indirectly, any claim of
personal injury or death associated with such unintended or unauthorized use, even if such claim alleges that Freescale
Semiconductor was negligent regarding the design or manufacture of the part.
How to Contact Us
Corporate Headquarters
Freescale Semiconductor, Inc.
6501 William Cannon Drive West
Austin, Texas 78735
U.S.A.
World Wide Web
http://www.freescale.com/codewarrior
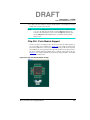
Technical Support
http://www.freescale.com/support
DRAFT
Table of Contents
1
Introduction
11
Release Notes . . . . . . . . . . . . . . . . . . . . . . . . . . . . . . . . . . . . . . . . . . . . . . . . . . . 11
About this Manual . . . . . . . . . . . . . . . . . . . . . . . . . . . . . . . . . . . . . . . . . . . . . . . 12
Related Documentation. . . . . . . . . . . . . . . . . . . . . . . . . . . . . . . . . . . . . . . . . . . . 13
Additional Information Sources . . . . . . . . . . . . . . . . . . . . . . . . . . . . . . . . . . 13
CodeWarrior Microcontrollers Development Tools . . . . . . . . . . . . . . . . . . . 17
CodeWarrior Development Process . . . . . . . . . . . . . . . . . . . . . . . . . . . . . . . 20
2
Working with Projects
23
New Bareboard Project Wizard . . . . . . . . . . . . . . . . . . . . . . . . . . . . . . . . . . . . . 23
Create an MCU Bareboard Project Page. . . . . . . . . . . . . . . . . . . . . . . . . . . . 24
Device and Connection Page. . . . . . . . . . . . . . . . . . . . . . . . . . . . . . . . . . . . . 25
Add Files Page . . . . . . . . . . . . . . . . . . . . . . . . . . . . . . . . . . . . . . . . . . . . . . . 26
Languages Page. . . . . . . . . . . . . . . . . . . . . . . . . . . . . . . . . . . . . . . . . . . . . . . 27
C/C++ Options Page . . . . . . . . . . . . . . . . . . . . . . . . . . . . . . . . . . . . . . . . . . . 28
ColdFire Build Options Page for ColdFire V1 . . . . . . . . . . . . . . . . . . . . . . . 31
ColdFire Build Options Page for ColdFire V2/3/4 . . . . . . . . . . . . . . . . . . . . 32
Connections Page . . . . . . . . . . . . . . . . . . . . . . . . . . . . . . . . . . . . . . . . . . . . . 34
Rapid Application Development Page . . . . . . . . . . . . . . . . . . . . . . . . . . . . . 37
New Linux/uClinux Application Project Wizard . . . . . . . . . . . . . . . . . . . . . . . . 38
Create a Linux/uClinux Application Project Page . . . . . . . . . . . . . . . . . . . . 39
Device used for Linux Application Debug Page. . . . . . . . . . . . . . . . . . . . . . 40
Project Language and Output Page . . . . . . . . . . . . . . . . . . . . . . . . . . . . . . . . 41
Connections Page . . . . . . . . . . . . . . . . . . . . . . . . . . . . . . . . . . . . . . . . . . . . . 43
Application Debug Options Page . . . . . . . . . . . . . . . . . . . . . . . . . . . . . . . . . 44
Creating Projects. . . . . . . . . . . . . . . . . . . . . . . . . . . . . . . . . . . . . . . . . . . . . . . . . 45
Creating Bareboard Projects . . . . . . . . . . . . . . . . . . . . . . . . . . . . . . . . . . . . . 45
Creating Linux/uClinux Application Project . . . . . . . . . . . . . . . . . . . . . . . . 79
Building Projects. . . . . . . . . . . . . . . . . . . . . . . . . . . . . . . . . . . . . . . . . . . . . . . . . 86
Manual-build Mode. . . . . . . . . . . . . . . . . . . . . . . . . . . . . . . . . . . . . . . . . . . . 86
Auto-build Mode . . . . . . . . . . . . . . . . . . . . . . . . . . . . . . . . . . . . . . . . . . . . . . 88
Debugging Projects . . . . . . . . . . . . . . . . . . . . . . . . . . . . . . . . . . . . . . . . . . . . . . . 88
Microcontrollers V10.x Targeting Manual
3
DRAFT
Table of Contents
Deleting Projects . . . . . . . . . . . . . . . . . . . . . . . . . . . . . . . . . . . . . . . . . . . . . . . . .91
Importing Classic CodeWarrior Projects. . . . . . . . . . . . . . . . . . . . . . . . . . . . . . .91
Tutorials — Importing Connection-Specific Projects . . . . . . . . . . . . . . . . . . . . .92
Tutorial A: Porting Classic HCS08 Project . . . . . . . . . . . . . . . . . . . . . . . . . .92
Tutorial B: Porting Classic RS08 Project . . . . . . . . . . . . . . . . . . . . . . . . . .105
Tutorial C: Porting Classic ColdFire V1 Project . . . . . . . . . . . . . . . . . . . . .118
Tutorial D: Porting Classic ColdFire V2/3/4 Project. . . . . . . . . . . . . . . . . .131
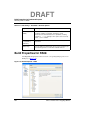
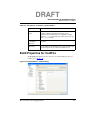
3
Build Properties for Bareboard Projects
145
Changing Build Properties . . . . . . . . . . . . . . . . . . . . . . . . . . . . . . . . . . . . . . . .146
Restoring Build Properties . . . . . . . . . . . . . . . . . . . . . . . . . . . . . . . . . . . . . . . .147
Build Properties for HCS08 . . . . . . . . . . . . . . . . . . . . . . . . . . . . . . . . . . . . . . .148
Messages . . . . . . . . . . . . . . . . . . . . . . . . . . . . . . . . . . . . . . . . . . . . . . . . . . .149
General. . . . . . . . . . . . . . . . . . . . . . . . . . . . . . . . . . . . . . . . . . . . . . . . . . . . .151
Disassembler . . . . . . . . . . . . . . . . . . . . . . . . . . . . . . . . . . . . . . . . . . . . . . . .152
Linker. . . . . . . . . . . . . . . . . . . . . . . . . . . . . . . . . . . . . . . . . . . . . . . . . . . . . .155
Burner . . . . . . . . . . . . . . . . . . . . . . . . . . . . . . . . . . . . . . . . . . . . . . . . . . . . .166
HCS08 Compiler . . . . . . . . . . . . . . . . . . . . . . . . . . . . . . . . . . . . . . . . . . . . .168
HCS08 Assembler . . . . . . . . . . . . . . . . . . . . . . . . . . . . . . . . . . . . . . . . . . . .194
Build Properties for RS08 . . . . . . . . . . . . . . . . . . . . . . . . . . . . . . . . . . . . . . . . .202
Messages . . . . . . . . . . . . . . . . . . . . . . . . . . . . . . . . . . . . . . . . . . . . . . . . . . .204
General. . . . . . . . . . . . . . . . . . . . . . . . . . . . . . . . . . . . . . . . . . . . . . . . . . . . .205
Disassembler . . . . . . . . . . . . . . . . . . . . . . . . . . . . . . . . . . . . . . . . . . . . . . . .206
Linker. . . . . . . . . . . . . . . . . . . . . . . . . . . . . . . . . . . . . . . . . . . . . . . . . . . . . .209
Burner . . . . . . . . . . . . . . . . . . . . . . . . . . . . . . . . . . . . . . . . . . . . . . . . . . . . .221
RS08 Compiler . . . . . . . . . . . . . . . . . . . . . . . . . . . . . . . . . . . . . . . . . . . . . .223
RS08 Assembler . . . . . . . . . . . . . . . . . . . . . . . . . . . . . . . . . . . . . . . . . . . . .249
Build Properties for ColdFire . . . . . . . . . . . . . . . . . . . . . . . . . . . . . . . . . . . . . .257
ColdFire CPU . . . . . . . . . . . . . . . . . . . . . . . . . . . . . . . . . . . . . . . . . . . . . . .258
Debugging . . . . . . . . . . . . . . . . . . . . . . . . . . . . . . . . . . . . . . . . . . . . . . . . . .259
Messages . . . . . . . . . . . . . . . . . . . . . . . . . . . . . . . . . . . . . . . . . . . . . . . . . . .260
Librarian . . . . . . . . . . . . . . . . . . . . . . . . . . . . . . . . . . . . . . . . . . . . . . . . . . .262
Burner . . . . . . . . . . . . . . . . . . . . . . . . . . . . . . . . . . . . . . . . . . . . . . . . . . . . .263
ColdFire Linker . . . . . . . . . . . . . . . . . . . . . . . . . . . . . . . . . . . . . . . . . . . . . .265
ColdFire Compiler . . . . . . . . . . . . . . . . . . . . . . . . . . . . . . . . . . . . . . . . . . . .271
4
Microcontrollers V10.x Targeting Manual
DRAFT
Table of Contents
ColdFire Assembler. . . . . . . . . . . . . . . . . . . . . . . . . . . . . . . . . . . . . . . . . . . 290
ColdFire Preprocessor . . . . . . . . . . . . . . . . . . . . . . . . . . . . . . . . . . . . . . . . . 296
ColdFire Disassembler . . . . . . . . . . . . . . . . . . . . . . . . . . . . . . . . . . . . . . . . 298
4
Working with Debugger
301
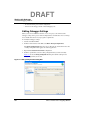
Standard Debugging Features . . . . . . . . . . . . . . . . . . . . . . . . . . . . . . . . . . . . . . 301
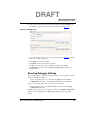
CodeWarrior Debugger Settings . . . . . . . . . . . . . . . . . . . . . . . . . . . . . . . . . 301
Debugging Code . . . . . . . . . . . . . . . . . . . . . . . . . . . . . . . . . . . . . . . . . . . . . 347
Ways to Initiate Debug Session. . . . . . . . . . . . . . . . . . . . . . . . . . . . . . . . . . 348
Attaching Processes. . . . . . . . . . . . . . . . . . . . . . . . . . . . . . . . . . . . . . . . . . . 350
Connecting Target . . . . . . . . . . . . . . . . . . . . . . . . . . . . . . . . . . . . . . . . . . . . 352
Debugging Bare Board Software . . . . . . . . . . . . . . . . . . . . . . . . . . . . . . . . . . . 352
Displaying Register Contents . . . . . . . . . . . . . . . . . . . . . . . . . . . . . . . . . . . 353
Using Register Details Window . . . . . . . . . . . . . . . . . . . . . . . . . . . . . . . . . 356
Viewing Cache . . . . . . . . . . . . . . . . . . . . . . . . . . . . . . . . . . . . . . . . . . . . . . 364
Setting Watchpoints. . . . . . . . . . . . . . . . . . . . . . . . . . . . . . . . . . . . . . . . . . . 365
Removing Watchpoints . . . . . . . . . . . . . . . . . . . . . . . . . . . . . . . . . . . . . . . . 368
Setting Breakpoints . . . . . . . . . . . . . . . . . . . . . . . . . . . . . . . . . . . . . . . . . . . 368
Removing Breakpoints . . . . . . . . . . . . . . . . . . . . . . . . . . . . . . . . . . . . . . . . 372
Setting Stack Crawl Depth . . . . . . . . . . . . . . . . . . . . . . . . . . . . . . . . . . . . . 374
Viewing Memory. . . . . . . . . . . . . . . . . . . . . . . . . . . . . . . . . . . . . . . . . . . . . 374
Hard Resetting. . . . . . . . . . . . . . . . . . . . . . . . . . . . . . . . . . . . . . . . . . . . . . . 378
Debugging Externally Built Executable Files. . . . . . . . . . . . . . . . . . . . . . . . . . 378
Import a MCU Executable File Page . . . . . . . . . . . . . . . . . . . . . . . . . . . . . 379
Select MCU executable file to be imported Page . . . . . . . . . . . . . . . . . . . . 380
Device and Connection Page. . . . . . . . . . . . . . . . . . . . . . . . . . . . . . . . . . . . 382
Connections Page . . . . . . . . . . . . . . . . . . . . . . . . . . . . . . . . . . . . . . . . . . . . 383
Debug an Externally Built Executable File. . . . . . . . . . . . . . . . . . . . . . . . . 383
5
Scripting
395
Tcl Support . . . . . . . . . . . . . . . . . . . . . . . . . . . . . . . . . . . . . . . . . . . . . . . . . . . . 397
Resolution of Conflicting Command Names . . . . . . . . . . . . . . . . . . . . . . . 397
Execution of Script Files . . . . . . . . . . . . . . . . . . . . . . . . . . . . . . . . . . . . . . . 397
Tcl Startup Script . . . . . . . . . . . . . . . . . . . . . . . . . . . . . . . . . . . . . . . . . . . . 398
Command-Line Debugging Tasks . . . . . . . . . . . . . . . . . . . . . . . . . . . . . . . . . . 399
Microcontrollers V10.x Targeting Manual
5
DRAFT
Table of Contents
Debugger Shell Command List . . . . . . . . . . . . . . . . . . . . . . . . . . . . . . . . . . . . .400
about . . . . . . . . . . . . . . . . . . . . . . . . . . . . . . . . . . . . . . . . . . . . . . . . . . . . . .400
alias . . . . . . . . . . . . . . . . . . . . . . . . . . . . . . . . . . . . . . . . . . . . . . . . . . . . . . .400
bp . . . . . . . . . . . . . . . . . . . . . . . . . . . . . . . . . . . . . . . . . . . . . . . . . . . . . . . . .401
cd . . . . . . . . . . . . . . . . . . . . . . . . . . . . . . . . . . . . . . . . . . . . . . . . . . . . . . . . .402
change . . . . . . . . . . . . . . . . . . . . . . . . . . . . . . . . . . . . . . . . . . . . . . . . . . . . .403
cls. . . . . . . . . . . . . . . . . . . . . . . . . . . . . . . . . . . . . . . . . . . . . . . . . . . . . . . . .405
config . . . . . . . . . . . . . . . . . . . . . . . . . . . . . . . . . . . . . . . . . . . . . . . . . . . . . .405
copy . . . . . . . . . . . . . . . . . . . . . . . . . . . . . . . . . . . . . . . . . . . . . . . . . . . . . . .408
debug . . . . . . . . . . . . . . . . . . . . . . . . . . . . . . . . . . . . . . . . . . . . . . . . . . . . . .408
dir. . . . . . . . . . . . . . . . . . . . . . . . . . . . . . . . . . . . . . . . . . . . . . . . . . . . . . . . .409
disassemble . . . . . . . . . . . . . . . . . . . . . . . . . . . . . . . . . . . . . . . . . . . . . . . . .409
display . . . . . . . . . . . . . . . . . . . . . . . . . . . . . . . . . . . . . . . . . . . . . . . . . . . . .411
evaluate . . . . . . . . . . . . . . . . . . . . . . . . . . . . . . . . . . . . . . . . . . . . . . . . . . . .413
finish . . . . . . . . . . . . . . . . . . . . . . . . . . . . . . . . . . . . . . . . . . . . . . . . . . . . . .414
fl::blankcheck . . . . . . . . . . . . . . . . . . . . . . . . . . . . . . . . . . . . . . . . . . . . . . .415
fl::checksum. . . . . . . . . . . . . . . . . . . . . . . . . . . . . . . . . . . . . . . . . . . . . . . . .415
fl::device . . . . . . . . . . . . . . . . . . . . . . . . . . . . . . . . . . . . . . . . . . . . . . . . . . .415
fl::disconnect . . . . . . . . . . . . . . . . . . . . . . . . . . . . . . . . . . . . . . . . . . . . . . . .415
fl::dumps . . . . . . . . . . . . . . . . . . . . . . . . . . . . . . . . . . . . . . . . . . . . . . . . . . .415
fl::erase . . . . . . . . . . . . . . . . . . . . . . . . . . . . . . . . . . . . . . . . . . . . . . . . . . . .416
fl::image. . . . . . . . . . . . . . . . . . . . . . . . . . . . . . . . . . . . . . . . . . . . . . . . . . . .416
fl::protect . . . . . . . . . . . . . . . . . . . . . . . . . . . . . . . . . . . . . . . . . . . . . . . . . . .416
l::target. . . . . . . . . . . . . . . . . . . . . . . . . . . . . . . . . . . . . . . . . . . . . . . . . . . . .417
fl::verify . . . . . . . . . . . . . . . . . . . . . . . . . . . . . . . . . . . . . . . . . . . . . . . . . . . .417
fl::write . . . . . . . . . . . . . . . . . . . . . . . . . . . . . . . . . . . . . . . . . . . . . . . . . . . .417
funcs. . . . . . . . . . . . . . . . . . . . . . . . . . . . . . . . . . . . . . . . . . . . . . . . . . . . . . .417
gdi . . . . . . . . . . . . . . . . . . . . . . . . . . . . . . . . . . . . . . . . . . . . . . . . . . . . . . . .418
getpid . . . . . . . . . . . . . . . . . . . . . . . . . . . . . . . . . . . . . . . . . . . . . . . . . . . . . .418
go . . . . . . . . . . . . . . . . . . . . . . . . . . . . . . . . . . . . . . . . . . . . . . . . . . . . . . . . .418
help . . . . . . . . . . . . . . . . . . . . . . . . . . . . . . . . . . . . . . . . . . . . . . . . . . . . . . .419
history . . . . . . . . . . . . . . . . . . . . . . . . . . . . . . . . . . . . . . . . . . . . . . . . . . . . .420
kill . . . . . . . . . . . . . . . . . . . . . . . . . . . . . . . . . . . . . . . . . . . . . . . . . . . . . . . .420
jtagclock. . . . . . . . . . . . . . . . . . . . . . . . . . . . . . . . . . . . . . . . . . . . . . . . . . . .421
kill . . . . . . . . . . . . . . . . . . . . . . . . . . . . . . . . . . . . . . . . . . . . . . . . . . . . . . . .421
6
Microcontrollers V10.x Targeting Manual
DRAFT
Table of Contents
launch . . . . . . . . . . . . . . . . . . . . . . . . . . . . . . . . . . . . . . . . . . . . . . . . . . . . . 421
linux::displaylinuxlist . . . . . . . . . . . . . . . . . . . . . . . . . . . . . . . . . . . . . . . . . 421
linux::loadsymbolics . . . . . . . . . . . . . . . . . . . . . . . . . . . . . . . . . . . . . . . . . . 421
linux::refreshmodules . . . . . . . . . . . . . . . . . . . . . . . . . . . . . . . . . . . . . . . . . 422
linux::selectmodule . . . . . . . . . . . . . . . . . . . . . . . . . . . . . . . . . . . . . . . . . . . 422
linux::unloadsymbolics . . . . . . . . . . . . . . . . . . . . . . . . . . . . . . . . . . . . . . . . 422
loadsym . . . . . . . . . . . . . . . . . . . . . . . . . . . . . . . . . . . . . . . . . . . . . . . . . . . . 422
log . . . . . . . . . . . . . . . . . . . . . . . . . . . . . . . . . . . . . . . . . . . . . . . . . . . . . . . . 423
mem . . . . . . . . . . . . . . . . . . . . . . . . . . . . . . . . . . . . . . . . . . . . . . . . . . . . . . 424
next . . . . . . . . . . . . . . . . . . . . . . . . . . . . . . . . . . . . . . . . . . . . . . . . . . . . . . . 424
next . . . . . . . . . . . . . . . . . . . . . . . . . . . . . . . . . . . . . . . . . . . . . . . . . . . . . . . 424
oneframe . . . . . . . . . . . . . . . . . . . . . . . . . . . . . . . . . . . . . . . . . . . . . . . . . . . 424
protocol . . . . . . . . . . . . . . . . . . . . . . . . . . . . . . . . . . . . . . . . . . . . . . . . . . . . 425
pwd . . . . . . . . . . . . . . . . . . . . . . . . . . . . . . . . . . . . . . . . . . . . . . . . . . . . . . . 425
quitIDE . . . . . . . . . . . . . . . . . . . . . . . . . . . . . . . . . . . . . . . . . . . . . . . . . . . . 425
radix. . . . . . . . . . . . . . . . . . . . . . . . . . . . . . . . . . . . . . . . . . . . . . . . . . . . . . . 425
refresh . . . . . . . . . . . . . . . . . . . . . . . . . . . . . . . . . . . . . . . . . . . . . . . . . . . . . 426
reg . . . . . . . . . . . . . . . . . . . . . . . . . . . . . . . . . . . . . . . . . . . . . . . . . . . . . . . . 427
reset . . . . . . . . . . . . . . . . . . . . . . . . . . . . . . . . . . . . . . . . . . . . . . . . . . . . . . . 427
restart. . . . . . . . . . . . . . . . . . . . . . . . . . . . . . . . . . . . . . . . . . . . . . . . . . . . . . 427
restore . . . . . . . . . . . . . . . . . . . . . . . . . . . . . . . . . . . . . . . . . . . . . . . . . . . . . 427
run . . . . . . . . . . . . . . . . . . . . . . . . . . . . . . . . . . . . . . . . . . . . . . . . . . . . . . . . 427
save . . . . . . . . . . . . . . . . . . . . . . . . . . . . . . . . . . . . . . . . . . . . . . . . . . . . . . . 428
setpc. . . . . . . . . . . . . . . . . . . . . . . . . . . . . . . . . . . . . . . . . . . . . . . . . . . . . . . 429
setpicloadaddr . . . . . . . . . . . . . . . . . . . . . . . . . . . . . . . . . . . . . . . . . . . . . . . 429
stack. . . . . . . . . . . . . . . . . . . . . . . . . . . . . . . . . . . . . . . . . . . . . . . . . . . . . . . 430
status . . . . . . . . . . . . . . . . . . . . . . . . . . . . . . . . . . . . . . . . . . . . . . . . . . . . . . 430
step . . . . . . . . . . . . . . . . . . . . . . . . . . . . . . . . . . . . . . . . . . . . . . . . . . . . . . . 430
stepi . . . . . . . . . . . . . . . . . . . . . . . . . . . . . . . . . . . . . . . . . . . . . . . . . . . . . . . 431
stop . . . . . . . . . . . . . . . . . . . . . . . . . . . . . . . . . . . . . . . . . . . . . . . . . . . . . . . 431
switchtarget . . . . . . . . . . . . . . . . . . . . . . . . . . . . . . . . . . . . . . . . . . . . . . . . . 432
system . . . . . . . . . . . . . . . . . . . . . . . . . . . . . . . . . . . . . . . . . . . . . . . . . . . . . 433
var . . . . . . . . . . . . . . . . . . . . . . . . . . . . . . . . . . . . . . . . . . . . . . . . . . . . . . . . 433
wait . . . . . . . . . . . . . . . . . . . . . . . . . . . . . . . . . . . . . . . . . . . . . . . . . . . . . . . 433
watchpoint . . . . . . . . . . . . . . . . . . . . . . . . . . . . . . . . . . . . . . . . . . . . . . . . . . 434
Microcontrollers V10.x Targeting Manual
7
DRAFT
Table of Contents
Microcontrollers-Specific HIWARE Commands . . . . . . . . . . . . . . . . . . . . . . .435
Command List . . . . . . . . . . . . . . . . . . . . . . . . . . . . . . . . . . . . . . . . . . . . . . .435
6
Connections — HCS08
449
Changing Connection in IDE . . . . . . . . . . . . . . . . . . . . . . . . . . . . . . . . . . . . . .449
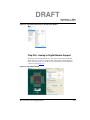
P&E Full Chip Simulation . . . . . . . . . . . . . . . . . . . . . . . . . . . . . . . . . . . . . . . .450
Chip View . . . . . . . . . . . . . . . . . . . . . . . . . . . . . . . . . . . . . . . . . . . . . . . . . .450
Module Options . . . . . . . . . . . . . . . . . . . . . . . . . . . . . . . . . . . . . . . . . . . . . .456
P&E HCS08 Multilink\Cyclone Pro . . . . . . . . . . . . . . . . . . . . . . . . . . . . . . . . .494
Chip View . . . . . . . . . . . . . . . . . . . . . . . . . . . . . . . . . . . . . . . . . . . . . . . . . .494
Connection Options . . . . . . . . . . . . . . . . . . . . . . . . . . . . . . . . . . . . . . . . . . .499
Softec. . . . . . . . . . . . . . . . . . . . . . . . . . . . . . . . . . . . . . . . . . . . . . . . . . . . . . . . .521
Open Source BDM . . . . . . . . . . . . . . . . . . . . . . . . . . . . . . . . . . . . . . . . . . . . . .521
7
Connections — RS08
523
Changing Connection in IDE . . . . . . . . . . . . . . . . . . . . . . . . . . . . . . . . . . . . . .523
P&E Full Chip Simulation . . . . . . . . . . . . . . . . . . . . . . . . . . . . . . . . . . . . . . . .524
Chip View . . . . . . . . . . . . . . . . . . . . . . . . . . . . . . . . . . . . . . . . . . . . . . . . . .524
Module Options . . . . . . . . . . . . . . . . . . . . . . . . . . . . . . . . . . . . . . . . . . . . . .530
P&E RS08 Multilink\Cyclone Pro . . . . . . . . . . . . . . . . . . . . . . . . . . . . . . . . . .558
Chip View . . . . . . . . . . . . . . . . . . . . . . . . . . . . . . . . . . . . . . . . . . . . . . . . . .558
Connection Options . . . . . . . . . . . . . . . . . . . . . . . . . . . . . . . . . . . . . . . . . . .563
Softec. . . . . . . . . . . . . . . . . . . . . . . . . . . . . . . . . . . . . . . . . . . . . . . . . . . . . . . . .583
Open Source BDM . . . . . . . . . . . . . . . . . . . . . . . . . . . . . . . . . . . . . . . . . . . . . .583
8
Connections — ColdFire V1
585
Changing Connection in IDE . . . . . . . . . . . . . . . . . . . . . . . . . . . . . . . . . . . . . .586
P&E USB BDM Multilink/Cyclone Pro . . . . . . . . . . . . . . . . . . . . . . . . . . . . . .586
Connection Assistant . . . . . . . . . . . . . . . . . . . . . . . . . . . . . . . . . . . . . . . . . .588
Active Mode Menu Options . . . . . . . . . . . . . . . . . . . . . . . . . . . . . . . . . . . .591
Advanced Programming/Debug Options. . . . . . . . . . . . . . . . . . . . . . . . . . .591
View Register Files Options . . . . . . . . . . . . . . . . . . . . . . . . . . . . . . . . . . . .595
P&E USB BDM Multilink\Cyclone Pro Connection-Specific Options . . .596
Abatron. . . . . . . . . . . . . . . . . . . . . . . . . . . . . . . . . . . . . . . . . . . . . . . . . . . . . . .604
TCP/IP . . . . . . . . . . . . . . . . . . . . . . . . . . . . . . . . . . . . . . . . . . . . . . . . . . . . .604
8
Microcontrollers V10.x Targeting Manual
DRAFT
Table of Contents
Serial . . . . . . . . . . . . . . . . . . . . . . . . . . . . . . . . . . . . . . . . . . . . . . . . . . . . . . 605
CCS . . . . . . . . . . . . . . . . . . . . . . . . . . . . . . . . . . . . . . . . . . . . . . . . . . . . . . . . . . 608
USB TAP. . . . . . . . . . . . . . . . . . . . . . . . . . . . . . . . . . . . . . . . . . . . . . . . . . . 608
Ethernet . . . . . . . . . . . . . . . . . . . . . . . . . . . . . . . . . . . . . . . . . . . . . . . . . . . . 609
9
Connections — ColdFire V2/3/4
611
Changing Connection in IDE . . . . . . . . . . . . . . . . . . . . . . . . . . . . . . . . . . . . . . 611
P&E ColdFire Multilink/Cyclone MAX. . . . . . . . . . . . . . . . . . . . . . . . . . . . . . 612
Connection Assistant. . . . . . . . . . . . . . . . . . . . . . . . . . . . . . . . . . . . . . . . . . 614
View Register Files Options . . . . . . . . . . . . . . . . . . . . . . . . . . . . . . . . . . . . 617
Abatron . . . . . . . . . . . . . . . . . . . . . . . . . . . . . . . . . . . . . . . . . . . . . . . . . . . . . . . 619
TCP/IP. . . . . . . . . . . . . . . . . . . . . . . . . . . . . . . . . . . . . . . . . . . . . . . . . . . . . 619
Serial . . . . . . . . . . . . . . . . . . . . . . . . . . . . . . . . . . . . . . . . . . . . . . . . . . . . . . 620
CCS . . . . . . . . . . . . . . . . . . . . . . . . . . . . . . . . . . . . . . . . . . . . . . . . . . . . . . . . . . 623
USB TAP. . . . . . . . . . . . . . . . . . . . . . . . . . . . . . . . . . . . . . . . . . . . . . . . . . . 623
Ethernet . . . . . . . . . . . . . . . . . . . . . . . . . . . . . . . . . . . . . . . . . . . . . . . . . . . . 624
10 Common Connection Features
627
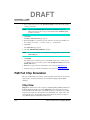
Working with Flash Programmer . . . . . . . . . . . . . . . . . . . . . . . . . . . . . . . . . . . 627
Use Pre-Defined Programming Task. . . . . . . . . . . . . . . . . . . . . . . . . . . . . . 628
Create Flash Programmer Task . . . . . . . . . . . . . . . . . . . . . . . . . . . . . . . . . . 630
Quick Access to Target Tasks . . . . . . . . . . . . . . . . . . . . . . . . . . . . . . . . . . . . . . 635
Target Task Toolbar . . . . . . . . . . . . . . . . . . . . . . . . . . . . . . . . . . . . . . . . . . . 636
Fast Access to Flash Programmer . . . . . . . . . . . . . . . . . . . . . . . . . . . . . . . . 636
Fast Access to Hardware Diagnostics . . . . . . . . . . . . . . . . . . . . . . . . . . . . . 637
Fast Access to Import/Export Memory . . . . . . . . . . . . . . . . . . . . . . . . . . . . 637
Flash Programmer Tutorials . . . . . . . . . . . . . . . . . . . . . . . . . . . . . . . . . . . . . . . 638
Tutorial A: Import and Execute HCS08 Flash Task . . . . . . . . . . . . . . . . . . 638
Tutorial B: Import and Execute ColdFire Flash Task . . . . . . . . . . . . . . . . . 640
Tutorial C: Create Erase Memory Task for HCS08 . . . . . . . . . . . . . . . . . . 642
Tutorial D: Create Erase Flash Memory Task for ColdFire . . . . . . . . . . . . 647
Tutorial E: Create Download Program Task for ColdFire . . . . . . . . . . . . . 653
Tutorial F: Create and Execute Diagnostics Action Task . . . . . . . . . . . . . . 657
Tutorial G: Dump Entire Flash . . . . . . . . . . . . . . . . . . . . . . . . . . . . . . . . . . 660
Tutorial H: Change Protection of Sector . . . . . . . . . . . . . . . . . . . . . . . . . . . 661
Microcontrollers V10.x Targeting Manual
9
DRAFT
Table of Contents
Tutorial I: Fast Access to Target Tasks Editors . . . . . . . . . . . . . . . . . . . . . .663
Tutorial J: Programming with Simple Flash . . . . . . . . . . . . . . . . . . . . . . . .665
Erasing Flash Device . . . . . . . . . . . . . . . . . . . . . . . . . . . . . . . . . . . . . . . . . .666
Programming a File . . . . . . . . . . . . . . . . . . . . . . . . . . . . . . . . . . . . . . . . . . .667
Tutorial K: Exporting Target Tasks . . . . . . . . . . . . . . . . . . . . . . . . . . . . . . .668
Working with Hardware Diagnostics Window . . . . . . . . . . . . . . . . . . . . . . . . .668
Manipulating Target Memory . . . . . . . . . . . . . . . . . . . . . . . . . . . . . . . . . . . . . .670
Creating Target Task to Import Memory . . . . . . . . . . . . . . . . . . . . . . . . . . .670
Creating Target Task to Export Memory . . . . . . . . . . . . . . . . . . . . . . . . . . .674
Fill Memory with Data Pattern . . . . . . . . . . . . . . . . . . . . . . . . . . . . . . . . . .678
Index
10
683
Microcontrollers V10.x Targeting Manual
DRAFT
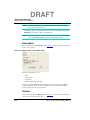
1
Introduction
This manual explains how to use the CodeWarrior™ Development Studio for
Microcontrollers V10.x product. This chapter presents an overview of this manual and
introduces you to the CodeWarrior development tools and development process.
The topics in this chapter are:
• Release Notes — Lists about new features, bug fixes, and incompatibilities
• About this Manual — Describes the contents of this manual
• Related Documentation — Describes supplementary CodeWarrior documentation,
third-party documentation, and references to helpful code examples and Web sites
• CodeWarrior Microcontrollers Development Tools — Describes the steps you take
to write and debug programs with the CodeWarrior IDE
• CodeWarrior Development Process — Describes the CodeWarrior development
process
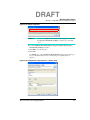
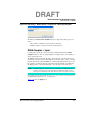
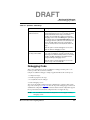
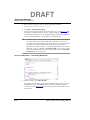
Release Notes
Before using the CodeWarrior IDE, read the developer notes. These notes contain
important information about last-minute changes, bug fixes, incompatible elements, or
other topics that may not be included in this manual.
NOTE
The release notes for specific components of the CodeWarrior IDE are located
in the Release_Notes folder in the CodeWarrior installation directory.
If you are new to the CodeWarrior IDE, read this chapter and the Getting Started chapter.
This chapter provides references to resources of interest to new users; the Getting Started
chapter helps you become familiar with the software features.
NOTE
Some of the text and screenshots in this document might not match with the
build you are working on, as this document was last updated for the B091211
build.
Microcontrollers V10.x Targeting Manual
11
DRAFT
Introduction
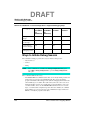
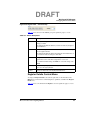
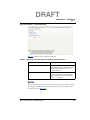
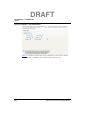
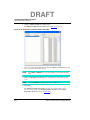
About this Manual
About this Manual
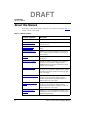
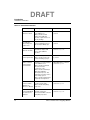
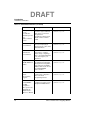
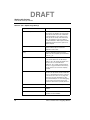
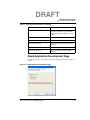
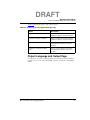
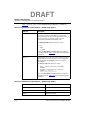
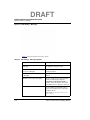
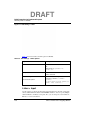
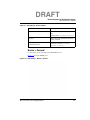
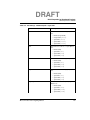
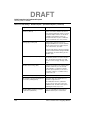
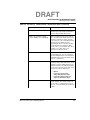
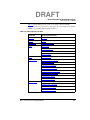
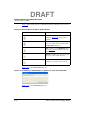
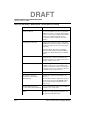
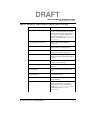
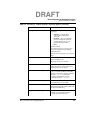
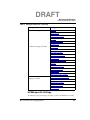
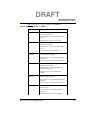
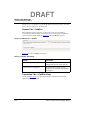
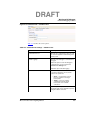
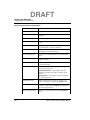
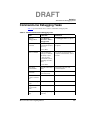
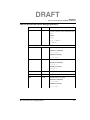
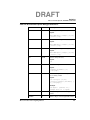
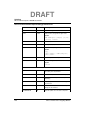
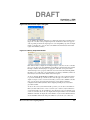
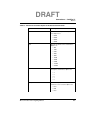
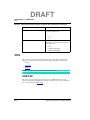
Each chapter of this manual describes a different area of software development. Table 1.1
lists the contents of this manual.
Table 1.1 Manual Contents
12
Chapter / Appendix
Description
Introduction
This chapter.
Working with Projects
Explains how to use the CodeWarrior tools to create and
work with projects.
Build Properties for
Bareboard Projects
Explains build properties for Microcontrollers bareboard
project.
Working with Debugger
Explains how to use the CodeWarrior™ development
tools to debug a program executing on the simulator or
microcontroller.
Scripting
Explains how to use CodeWarrior supports a commandline interface.
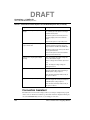
Connections — HCS08
Describes the features and settings of the connections
that interface the CodeWarrior debugger with the
HCS08-based bare board target, and allow it to debug
program code on the target.
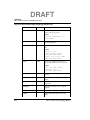
Connections — RS08
Describes the features and settings of the connections
that interface the CodeWarrior debugger with the RS08based bare board target, and allow it to debug program
code on the target.
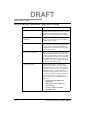
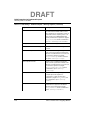
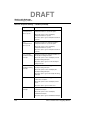
Connections — ColdFire V1
Describes the features and settings of the connections
that interface the CodeWarrior debugger with the
ColdFire V1-based bare board target, and allow it to
debug program code on the target.
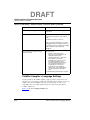
Connections — ColdFire
V2/3/4
Describes the features and settings of the connections
that interface the CodeWarrior debugger with the
ColdFire V2/3/4-based bare board target, and allow it to
debug program code on the target.
Common Connection
Features
Explains how to use the CodeWarrior hardware tools for
board bring-up, test, and analysis. Also, explains how to
manipulate target memory.
Microcontrollers V10.x Targeting Manual
DRAFT
Introduction
Related Documentation
Related Documentation
This topic provides information about documentation related to the CodeWarrior IDE and
Freescale Microcontrollers development.
• Additional Information Sources
• CodeWarrior Microcontrollers Development Tools
• CodeWarrior Development Process
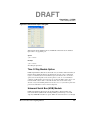
Additional Information Sources
• To view the online help for the CodeWarrior tools, first select Help > Help Contents
from the IDE’s menu bar. Next, select Microcontrollers V10.x Targeting Manual
from the Contents list.
• For late-breaking information about new features, bug fixes, known problems, and
incompatibilities, read the release notes in this folder:
CWInstallDir\<Microcontrollers_version>\
where CWInstallDir is the directory that CodeWarrior was installed into
Microcontrollers_version is the CodeWarrior version number
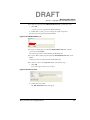
• For general information about the CodeWarrior IDE and debugger, see the Freescale
Eclipse Extension Guide in this folder:
CWInstallDir\<MCU_version>\Help\PDF
NOTE
The Freescale Eclipse Extension Guide is a general guide that is also part of
other CodeWarrior Eclipse-based products. Therefore, it describes the
following features that are not available in Microcontrollers v10.0 : Cache,
Memory ManagementUnit (MMU) Configurator, and Multicores. Also, it
shows figures that are not just specific to Microcontrollers v10.0, that is
sometimes the screenshots are of other CodeWarrior products, like StarCore
v10.0 or Power Architectures v10.0.
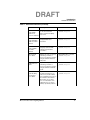
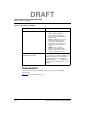
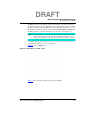
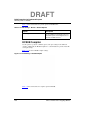
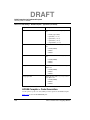
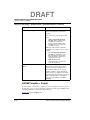
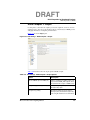
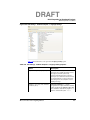
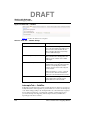
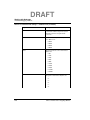
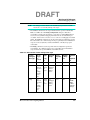
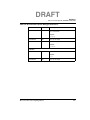
Table 1.2 lists additional CodeWarrior documentation.
Microcontrollers V10.x Targeting Manual
13
DRAFT
Introduction
Related Documentation
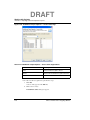
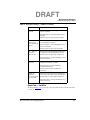
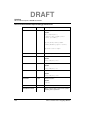
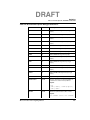
Table 1.2 Related Documentation
14
Document
Description
Location
Eclipse Quick
Reference Card
Introduces you to the interface
of CodeWarrior for
Microcontrollers V10.0
Eclipse-based IDE and
provides a quick reference to
the key bindings.
CWInstallDir\<Microcontrollers
_version>
CodeWarrior
Project Importer
Quick Start
Explains the steps to convert a
classic CodeWarrior project
into an Eclipse IDE project.
CWInstallDir\<Microcontrollers
_version>
Freescale Eclipse
Extensions Guide
Explains extensions to the
CodeWarrior Eclipse IDE
across all CodeWarrior
products.
CWInstallDir\<Microcontrollers
_version>\Help\PDF
Microcontrollers
V10.x Quick Start
Explains the steps to install
Microcontrollers V10.x, and
create and debug a project.
<CWInstallDir>\<Microcontrolle
rs_version>
Microcontrollers
V10.x Getting
Started Guide
Introduces you to the interface
of CodeWarrior™ for
Microcontrollers V10.0 and
describes the basic
components of the
Microcontrollers 10.0 Eclipse
IDE and CodeWarrior
development process. This
manual also describes how to
work with projects in
Microcontrollers 10.0 and lists
frequently asked questions.
CWInstallDir\<Microcontrollers
_version>\Help\PDF
Microcontrollers
V10.x ColdFire
Build Tools
Reference Manual
Describes the compiler used
for the Freescale 8-bit
Microcontroller Unit (MCU)
chip series
CWInstallDir\<Microcontrollers
_version>\Help\PDF
Microcontrollers
V10.x RS08 Build
Tools Reference
Manual
Describes the ANSI-C/C++
Compiler used for the
Freescale 8-bit Microcontroller
Unit (MCU) chip series
CWInstallDir\<Microcontrollers
_version>\Help\PDF
Microcontrollers V10.x Targeting Manual
DRAFT
Introduction
Related Documentation
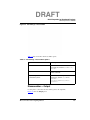
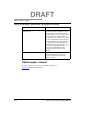
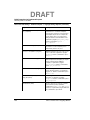
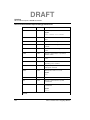
Table 1.2 Related Documentation (continued)
Document
Description
Location
Microcontrollers
V10.x HC08
Build Tools
Reference Manual
Describes the compiler used
for the Freescale 8-bit
Microcontroller Unit (MCU)
chip series
CWInstallDir\<Microcontrollers
_version>\Help\PDF
Microcontrollers
V10.x HC(S)08/
RS08 Assembler
Manual
Explains how to use the
HC(S)08/RS08 Macro
Assembler
CWInstallDir\<Microcontrollers
_version>\Help\PDF
Microcontrollers
V10.x ColdFire
Assembler
Manual
Explains the assemblylanguage syntax and IDE
settings for the ColdFire
assemblers
CWInstallDir\<Microcontrollers
_version>\Help\PDF
Ethernet TAP
Users Guide
Explains the steps to develop
and debug a number of
processors and microcontroller
using CodeWarrior Ethernet
TAP probe.
CWInstallDir\<Microcontrollers
_version>\Help\PDF
USB TAP Users
Guide
Explains the steps to develop
and debug a number of
processors and microcontroller
using CodeWarrior USB TAP
probe.
CWInstallDir\<Microcontrollers
_version>\Help\PDF
Microcontrollers
V10.x Profiling
and Analysis
Users Guide
Explains the CodeWarrior
Profiling and Analysis tools.
These tools provide visibility
into an application as it runs on
the simulator and hardware.
Developers can use these
tools to understand how an
application runs, as well as
identify operational problems.
CWInstallDir\<Microcontrollers
_version>\Help\PDF
Microcontrollers V10.x Targeting Manual
15
DRAFT
Introduction
Related Documentation
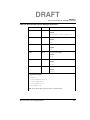
Table 1.2 Related Documentation (continued)
16
Document
Description
Location
Adding Device(s)
to the
CodeWarrior
Flash Programmer
for
Microcontrollers
V10.x
Explains how to use the Flash
Tool Kit to support additional
flash devices on the Flash
Programmer for
CodeWarrior™ Development
Studio for Microcontrollers
V10.0.
CWInstallDir\<Microcontrollers
_version>\Help\PDF
Processor Expert
Users Manual
Provides information about
Processor Expert plug-in,
which generates code from the
Embedded Beans.
CWInstallDir\<Microcontrollers
_version>\Help\PDF
Device
Initialization
Users Manual
Provides information about the
user interface, creating a
simple design, configuring a
device, generating initialization
code, and using it in your
application.
CWInstallDir\<Microcontrollers
_version>\Help\PDF
Open Source
BDM-JM60 Users
Guide
Describes an Open Source
programming and debugging
development tool designed to
work with Freescale HCS08,
RS08, Coldfire V1,V2, V3 and
V4, and DSC56800E
microcontrollers.
CWInstallDir\<Microcontrollers
_version>\Help\PDF
How to Write
Flash
Programming
Applets
Provides information on
creating Flash configuration
files for the Flash
Programming interface.
CWInstallDir\<Microcontrollers
_version>\Help\PDF
Microcontrollers
V10.0 MISRAC:2004
Compliance
Exceptions for the
HC(S)08 and
RS08 Libraries
Reference Manual
Describes the MISRA-C:2004
compliance exceptions for the
HC(S)08 and RS08 libraries.
CWInstallDir\<Microcontrollers
_version>\Help\PDF
Microcontrollers V10.x Targeting Manual
DRAFT
Introduction
Related Documentation
Table 1.2 Related Documentation (continued)
Document
Description
Location
EWL C Reference
Describes the contents of the
Embedded Warrior Library for
C.
This document is available
only in ColdFire Architecture.
CWInstallDir\<Microcontrollers
_version>\Help\PDF
EWL C++
Reference
Describes the contents of the
Embedded Warrior Library for
C++.
This document is available
only in ColdFire Architecture.
CWInstallDir\<Microcontrollers
_version>\Help\PDF
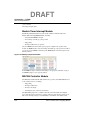
CodeWarrior Microcontrollers
Development Tools
Programming for Microcontroller processors is much like programming for any other
CodeWarrior platform target. If you have not used CodeWarrior tools before, start by
studying the Eclipse IDE, which is used to host the tools. Information on the Eclipse IDE
is available in the next topic.
If you are an experienced CodeWarrior user, note that the CodeWarrior Microcontrollers
V10.x environment uses the Eclipse IDE, whose user interface is substantially different
from the classic CodeWarrior IDE.
NOTE
For information on the interface differences, refer the Freescale Eclipse
Extensions Guide.
The following topics explain the CodeWarrior tools:
• Eclipse IDE
• Compiler
• Assembler
• Linker
• CodeWarrior Debugger
• CodeWarrior Profiling and Analysis
Microcontrollers V10.x Targeting Manual
17
DRAFT
Introduction
Related Documentation
Eclipse IDE
The Eclipse IDE (Integrated Development Environment) is an open-source development
environment that lets you develop and debug your software. It controls the project
manager, the source code editor, the class browser, the compilers and linkers, and the
debugger.
Those who are more familiar with command-line development tools may find the concept
of a CodeWarrior project new. The Eclipse Workspace organizes all files related to your
project. This lets you see your project at a glance and eases the organization and
navigation between source code files.
The Eclipse IDE has an extensible architecture that uses plug-in compilers and linkers to
target various operating systems and microprocessors. The IDE is hosted on Microsoft
Windows and other platforms. There are many development tools available for the IDE,
including C, C++, and Java compilers for desktop and embedded processors
For more information about the Eclipse IDE, read the Eclipse documentation at:
http://www.eclipse.org/documentation/.
Compiler
The Microcontrollers C Compiler:
• conforms to the American National Standards Institute (ANSI) C standards.
• conforms to version 1 of the Microcontrollers Application Binary Interface (ABI)
standards.
• supports a set of Digital Signal Processor (DSP) extensions.
• supports International Telecommunications Union (ITU)/European
Telecommunications Standards Institute (ETSI) primitives for saturating arithmetic.
Additional parameters are available for non-saturating arithmetic and doubleprecision arithmetic.
• allows standard C constructs for representing special addressing modes.
• supports a wide range of runtime libraries and runtime environments.
• optimizes for size, speed, or a combination of both, depending on options that you
select.
The compiler can link all application modules before optimizing. By examining the entire
linked application before optimizing, the compiler produces highly optimized code. The
compiler performs many optimizations, such as:
• software pipelining
• instruction paralleling and scheduling
• data and address register allocation
18
Microcontrollers V10.x Targeting Manual
DRAFT
Introduction
Related Documentation
• aggressive loop transformations, including automatic unrolling
NOTE
For more information, refer to the Microcontrollers Compiler User Guide.
Assembler
The assembler translates assembly-language source code to machine-language object files
or executable programs. You can provide the assembly-language source code, or the
compiler can generate it.
For each assembly-language module in a build target, the Microcontrollers assembler can
generate a file that lists the generated code side-by-side with the assembly-language
source code.
NOTE
For more information, refer to the Microcontrollers Assembler User Guide.
Linker
The Linker combines object files into a single executable file. You specify the link
mappings of your program in a Linker Command File (LCF).
NOTE
For more information, refer to the Microcontrollers Linker User Guide.
CodeWarrior Debugger
The CodeWarrior debugger lets you debug your software on both simulator and hardware
targets.
NOTE
The CodeWarrior debugger is also validated on the host machine running
Microsoft® Vista® Business Edition.
CodeWarrior Profiling and Analysis
CodeWarrior Profiling and Analysis tools provide visibility into an application as it runs
on the simulator and hardware. This visibility can help you understand how your
application runs, as well as identify operational problems. The tools also provide user
friendly data viewing features:
• Simultaneously step through trace data and the corresponding source and assembly
code of that trace data
Microcontrollers V10.x Targeting Manual
19
DRAFT
Introduction
Related Documentation
• Export source line information of the performance data generated by the simulator
into an Excel file
• Export the trace and function data generated by simulator and target hardware into an
Excel file
• Apply multi-level filters to isolate data
• Apply multi-level searches to find specific data
• Display results in an intuitive, user friendly manner in the trace, critical code, and
performance views
• Show or hide columns and also reorder the columns
• Copy and paste a cell or a line of the trace, alu-agu and performance data generated
by simulator and target hardware
• Control trace collection by using start and stop tracepoints to reduce the amount of
unwanted trace events in the trace buffer making the trace data easier to read
• View the value of the DPU counters in form of graphs (pie charts and bar charts)
while the application is in debug mode
• Display real time cycle count for simulated targets to allow quick monitoring of
evolution of application in time
NOTE
For more information, refer the Profiling and Analysis User Guide.
CodeWarrior Development Process
While working with the CodeWarrior IDE, you will proceed through the development
stages familiar to all programmers: writing code, compiling and linking, and debugging.
Refer to the Freescale Eclipse Extension Guide for:
• Complete information on tasks such as editing, compiling, and linking
• Basic information on debugging
The difference between the CodeWarrior environment and traditional command-line
environments is how the software, in this case the Eclipse IDE, helps you manage your
work more effectively.
If you are unfamiliar with an integrated environment in general, or with the Eclipse IDE in
particular, you may find the topics in this topic helpful. Each topic explains how one
component of the CodeWarrior tools relates to a traditional command-line environment.
• Project Files
• Editing Code
• Compiling
• Linking
20
Microcontrollers V10.x Targeting Manual
DRAFT
Introduction
Related Documentation
• Debugging
Project Files
A CodeWarrior project is analogous to a set of make files, because a project can have
multiple settings that are applied when building the project. For example, you can have
one project that has both a debug version and a release version of your program. You can
build one or the other, or both as you wish. The different settings used to launch your
program within a single project are called launch configurations.
The IDE uses the CodeWarrior Projects view to list all the files in a project. The files
listed in the CodeWarrior Projects view include source code files and libraries.
You can add or remove files easily. You can also assign files to one or more different
build configurations within the project, therefore files common to multiple build
configurations can be managed simply.
The IDE automatically manages all the interdependencies between files and tracks which
files have changed since the last build. This speeds the build process because the IDE only
compiles those files that have changed since the last build.
In addition, the IDE stores the settings for compiler and linker options for each build
configuration. You can modify these settings using the IDE, or with #pragma statements
in your code.
Editing Code
The Eclipse IDE has an integral text editor designed for programmers. It handles text files
in MS-DOS/Windows® and UNIX® formats.
To edit a source code file or any other editable file in a project, double-click the filename
in the CodeWarrior Projects view to open the file.
The navigational features of the Editor window lets you switch between related files,
locate a particular function, mark a location within a file, or go to a specific line of code.
Compiling
To compile a source code file, ensure that the file is a part of the current launch
configuration. If the file is in the configuration, select it in the project window and select
Project > Build Project from the IDE menu bar.
To automatically compile all the files in the current launch configuration after you modify
them, select Project > Build Automatically from the IDE menu bar.
Microcontrollers V10.x Targeting Manual
21
DRAFT
Introduction
Related Documentation
Linking
Select Project > Build Project from the IDE menu bar to link object code into a final
binary file. The Build Project command brings the active project up-to-date and then
links the resulting object code into a final output file.
You control the linker through the IDE. There is no need to specify a list of object files.
The Workspace tracks all the object files automatically.
You can modify the build configuration settings to select the name of the final output file.
Debugging
Select Run > Debug from the IDE menu bar to debug your project. This command
downloads the current project’s executable to the target board and starts a debug session.
NOTE
You must have previously entered debugger settings for the launch
configuration by choosing Run > Debug Configurations. The IDE uses the
settings in the launch configuration to generate debugging information and
initiate communications with the target board.
You can now use the debugger to step through the program's code, view and change the
value of variables, set breakpoints, and much more. See the Freescale Eclipse Extensions
Guide and the Working with Debugger chapter of this manual for instructions that explain
how to use the debugger.
22
Microcontrollers V10.x Targeting Manual
DRAFT
2
Working with Projects
This chapter explains how to use the CodeWarrior tools to create and work with projects.
NOTE
The scope of this chapter is limited to the use of the CodeWarrior IDE to write
and debug applications for the target platform.
The topics in this chapter are:
• New Bareboard Project Wizard
• New Linux/uClinux Application Project Wizard
• Creating Projects
• Building Projects
• Debugging Projects
• Deleting Projects
• Importing Classic CodeWarrior Projects
• Tutorials — Importing Connection-Specific Projects
New Bareboard Project Wizard
When you start the Microcontrollers New Bareboard Project wizard, it presents you with
a sequence of pages that prompt you for the features and settings to be used when making
your program. For example, the device and connection options lets you select the
derivative or board you would like to use.
Other options let you to specify other settings, such as whether the program executes on an
emulator or simulator rather than actual hardware, and the characteristics of the
connection that communicates with a hardware target.
This topic describes the various pages that the wizard displays as it assists you in creating
a bareboard project. The pages that the wizard presents can differ based upon the option of
project type or execution target.
The following topic, explain the pages of the New Bareboard Project wizard.
• Create an MCU Bareboard Project Page
• Device and Connection Page
• Add Files Page
Microcontrollers V10.x Targeting Manual
23
DRAFT
Working with Projects
New Bareboard Project Wizard
• Languages Page
• C/C++ Options Page
• ColdFire Build Options Page for ColdFire V1
• ColdFire Build Options Page for ColdFire V2/3/4
• Connections Page
• Rapid Application Development Page
NOTE
Based on the your selection, the pages of the New Bareboard Project wizard
may differ.
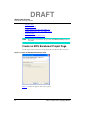
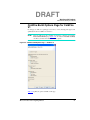
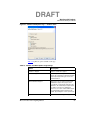
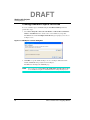
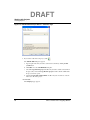
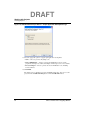
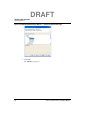
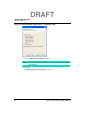
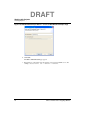
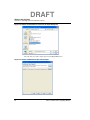
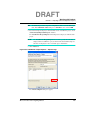
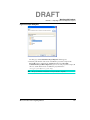
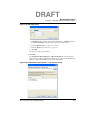
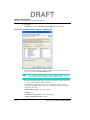
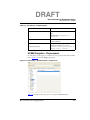
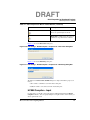
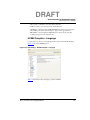
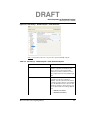
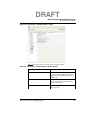
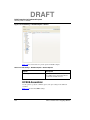
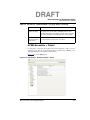
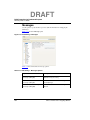
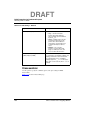
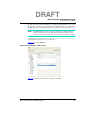
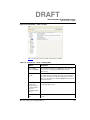
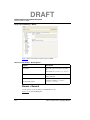
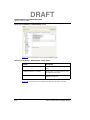
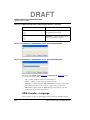
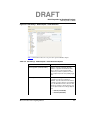
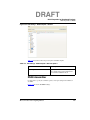
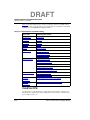
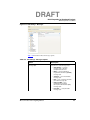
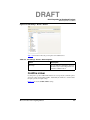
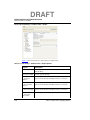
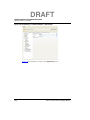
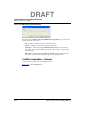
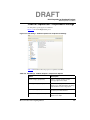
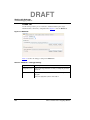
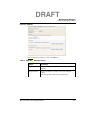
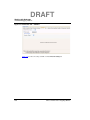
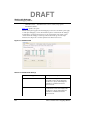
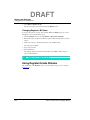
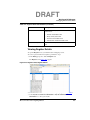
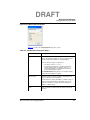
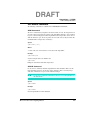
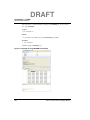
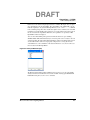
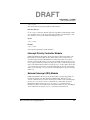
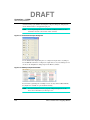
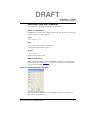
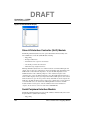
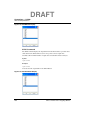
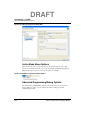
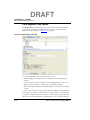
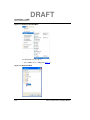
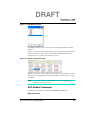
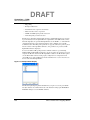
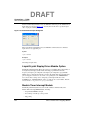
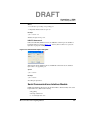
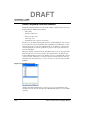
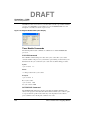
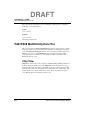
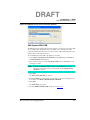
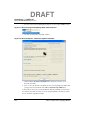
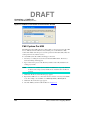
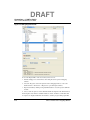
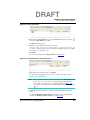
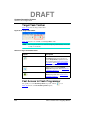
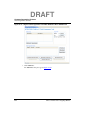
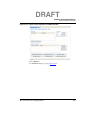
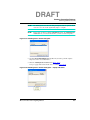
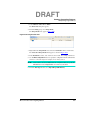
Create an MCU Bareboard Project Page
Use this page to name your project, and specify the directory where its files are located.
Figure 2.1 Create an MCU Bareboard Project Page
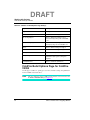
Table 2.1 describes the purpose of the various options.
24
Microcontrollers V10.x Targeting Manual
DRAFT
Working with Projects
New Bareboard Project Wizard
Table 2.1 Create an MCU Bareboard Project Page Settings
Option
Description
New Project Name
Enter the name for the new project in this
text box.
Use default location
Stores the files required to build the program
in the Workbench’s current workspace
directory. The project files are located in the
directory you specify. Use the Location
option to select the directory.
Location
Specifies the directory that contains the
project files. Click Browse to navigate to the
desired directory. This option is only
available when Use default location is
clear.
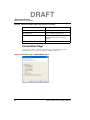
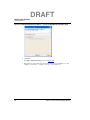
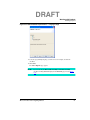
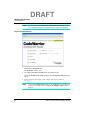
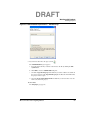
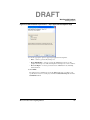
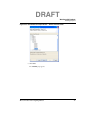
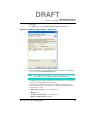
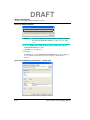
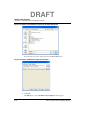
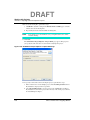
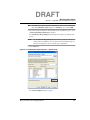
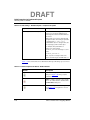
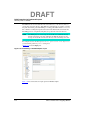
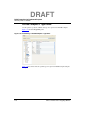
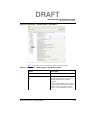
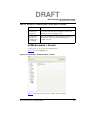
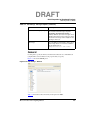
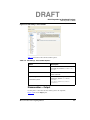
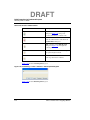
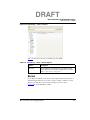
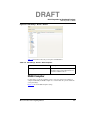
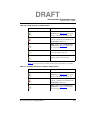
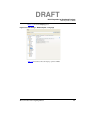
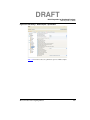
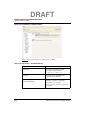
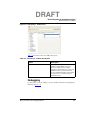
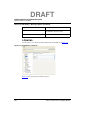
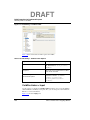
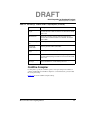
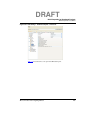
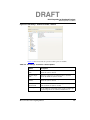
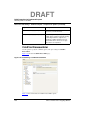
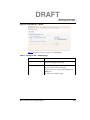
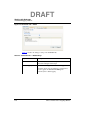
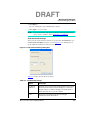
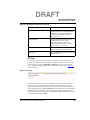
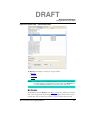
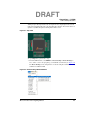
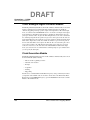
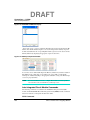
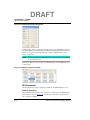
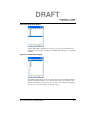
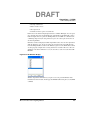
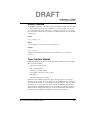
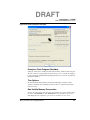
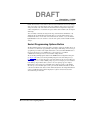
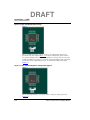
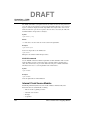
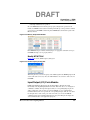
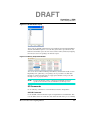
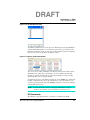
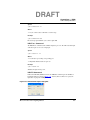
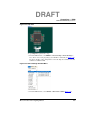
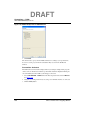
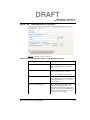
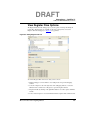
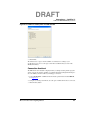
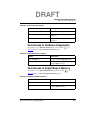
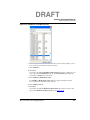
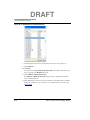
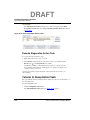
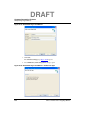
Device and Connection Page
Use this page to select the derivative or board you would like to use.
Figure 2.2 Device and Connection Page
Microcontrollers V10.x Targeting Manual
25
DRAFT
Working with Projects
New Bareboard Project Wizard
NOTE
The pages of wizard change depending on the selected derivative or board. If a
ColdFire derivative or board is selected then the wizard will display the
ColdFire Build Options page (Figure 2.6 and Figure 2.7 ).
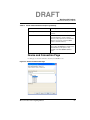
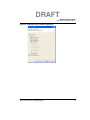
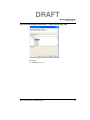
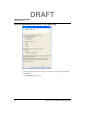
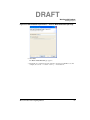
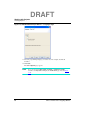
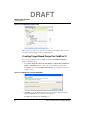
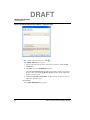
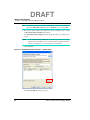
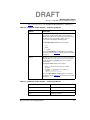
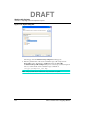
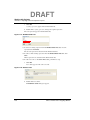
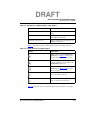
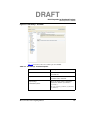
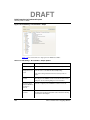
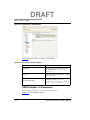
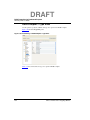
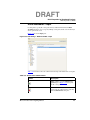
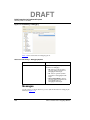
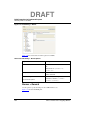
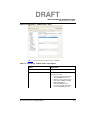
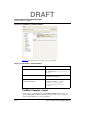
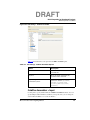
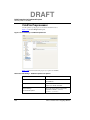
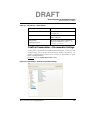
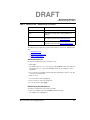
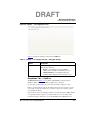
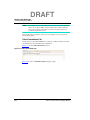
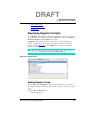
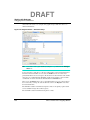
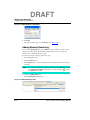
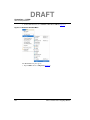
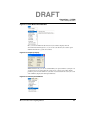
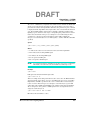
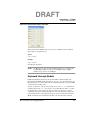
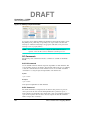
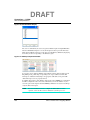
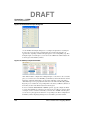
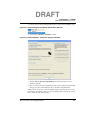
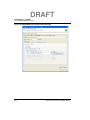
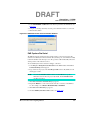
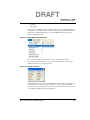
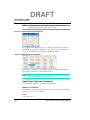
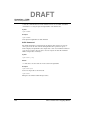
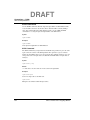
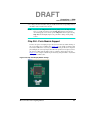
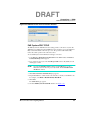
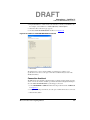
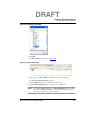
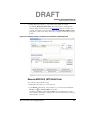
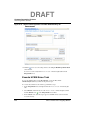
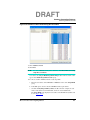
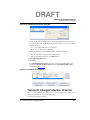
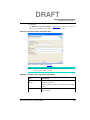
Add Files Page
Use this page to select files that you want to add to the project. Depending on the
selection, you can either copy or link the files in the new project.
Figure 2.3 Add Files Page
Table 2.2 describes the purpose of the various options.
Table 2.2 Add Files Page Settings
Option
Description
Add — Click to open the Add file path
dialog box and specify the location of the
file you want to add.
Delete — Click to delete the selected file
path. To confirm deletion, click Yes in the
Confirm Delete dialog box.
26
Microcontrollers V10.x Targeting Manual
DRAFT
Working with Projects
New Bareboard Project Wizard
Table 2.2 Add Files Page Settings (continued) (continued)
Option
Description
Edit — Click to open the Edit file path
dialog box and update the selected path.
Copy files into project
Check to add any existing files to your
project.
Clear if no files are to be added to your
project,
Create main.c/main.asm file
Check to enable the IDE to create template
files, including a Sources folder, in the
project directory, along with some sample
source-code files.
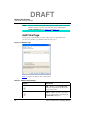
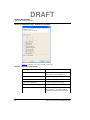
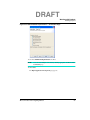
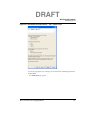
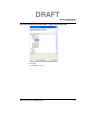
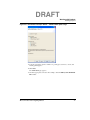
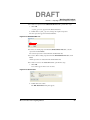
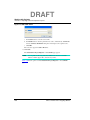
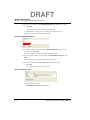
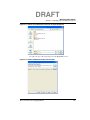
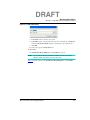
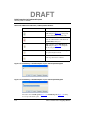
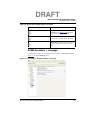
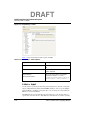
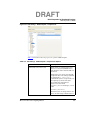
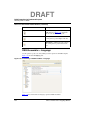
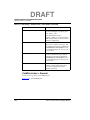
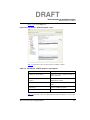
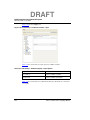
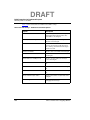
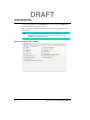
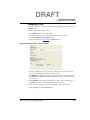
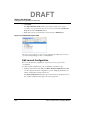
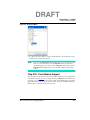
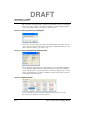
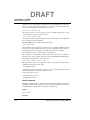
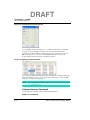
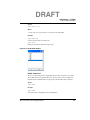
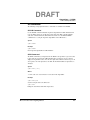
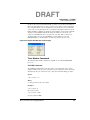
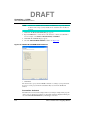
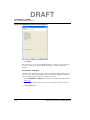
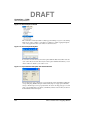
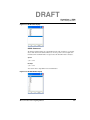
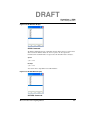
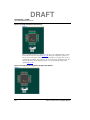
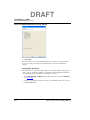
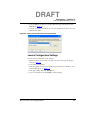
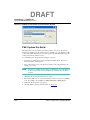
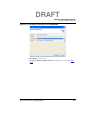
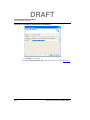
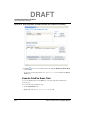
Languages Page
Use this page to select the programming language that you want to use when writing the
program’s source code. You can make multiple selections, creating the code in multiple
formats.
Figure 2.4 Languages Page
Microcontrollers V10.x Targeting Manual
27
DRAFT
Working with Projects
New Bareboard Project Wizard
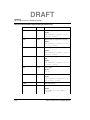
Table 2.3 explains the options available on this page.
Table 2.3 Languages Page Settings
Group / Option
Description
C
Checking the C checkbox sets up your
application with ANSI C-compliant startup
code, and initializes global variables.
C++
Checking the C++ checkbox sets up your
application with ANSI C++ startup code, and
performs global class object initialization.
Relocatable Assembly
Checking the Relocatable checkbox
enables you to split up the application into
multiple assembly source files. The source
files are linked together using the linker.
Absolute Assembly
Checking the Absolute Assembly checkbox
enables you to use only one single assembly
source file with absolute assembly. There is
no support for relocatable assembly or linker.
NOTE
The option you select also sets up default compiler/linker options for the
toolchain. For example, if you plan to use the C language in your source code
files, check the C checkbox. If you plan to write the program using C++, check
the C++ checkbox.
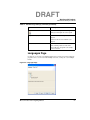
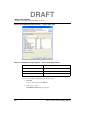
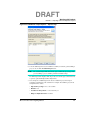
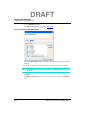
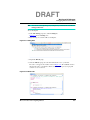
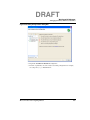
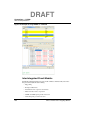
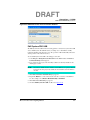
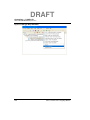
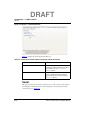
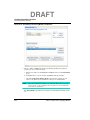
C/C++ Options Page
Use this page to select the level of startup code you want to produce, the memory model,
and the appropriate floating point format support.
28
Microcontrollers V10.x Targeting Manual
DRAFT
Working with Projects
New Bareboard Project Wizard
Figure 2.5 C/C++ Options Page
Table 2.4 explains the options available on this page.
Microcontrollers V10.x Targeting Manual
29
DRAFT
Working with Projects
New Bareboard Project Wizard
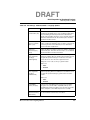
Table 2.4 C/C++ Options Page Settings
30
Option
Description
Minimal startup code
This option produces the best code density.
The startup code initializes the stack pointer
and calls the main function. No initialization
of global variables is done, giving you the
best speed/code density and a fast startup
time. The application code must address
variable initialization. ANSI requires variable
initialization and therefore this option is not
ANSI compliant.
ANSI startup code
This ANSI-compliant startup code initializes
global variables/objects and calls the
application main routine.
Tiny
Assumes that data pointers have 8-bit
addresses unless explicitly specified with the
keyword __far.
Small
Use the Small memory model if both the
code and the data fit into the 64-kilobyte
address space. By default all variables and
functions are accessed with 16-bit
addresses. The compiler supports banked
functions or paged variables in this memory
model, but all accesses must be explicitly
handled.
Banked
Banked memory model uses banked
function calls by default, but the default data
access is still 16-bit. Because the overhead
of the far function call is not very large, this
memory model suits all applications with
more than 64-kilobytes of code. Data paging
can be used, however all far objects and
pointers to them must be specially declared.
None
Select for the best code intensity.
Float is IEEE32, double is IEEE32
All float and double variables are 32-bit
IEEE32.
Float is IEEE32, double is IEEE64
Float variables are 32-bit IEEE32. Double
variables are 64-bit IEEE64.
Microcontrollers V10.x Targeting Manual
DRAFT
Working with Projects
New Bareboard Project Wizard
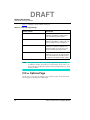
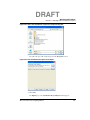
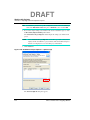
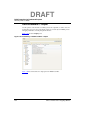
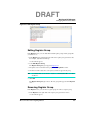
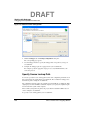
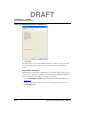
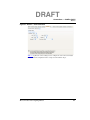
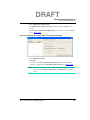
ColdFire Build Options Page for ColdFire
V1
Use this page to enable C++, porting processor macro, console, floating point support, and
optimization level for ColdFire V1 derivatives.
NOTE
This page will appear only a ColdFire V1 derivative or board is selected in the
Device and Connection page (Figure 2.2). To enable the Absolute Assembly
checkbox, you must uncheck the C and C++ options.
Figure 2.6 ColdFire Build Options Page — ColdFire V1
Table 2.5 explains the options available on this page.
Microcontrollers V10.x Targeting Manual
31
DRAFT
Working with Projects
New Bareboard Project Wizard
Table 2.5 ColdFire V1 Build Options Page Settings
Option
Description
Option
Description
Enable C++ Support
Check to enable C++ support
No Porting Support
Select to disable the porting processor
macro that helps porting code from HCS08
to V1
Enable Porting Support
Select to enable the porting processor macro
that helps porting code from HCS08 to V1
None
Select to disable floating point support
Float is IEEE64, double is IEEE64
Select to enable floating point support
No Optimizations
Select to disable optimization level
Easy Debug
Select to enable Level 1 code size
optimizations plus register coloring and
peephole
Full Optimizations
Select to enable full optimizations
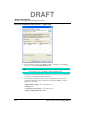
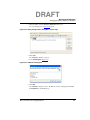
ColdFire Build Options Page for ColdFire
V2/3/4
Use this page to enable C++, porting processor macro, hardware startup, and optimization
level for ColdFire V2/3/4 derivatives.
NOTE
32
This page will appear only a ColdFire V2/3/4 derivative or board is selected in
the Device and Connection page (Figure 2.2).
Microcontrollers V10.x Targeting Manual
DRAFT
Working with Projects
New Bareboard Project Wizard
Figure 2.7 ColdFire Build Options Page — ColdFire V2/3/4
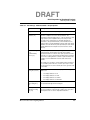
Table 2.6 explains the options available on this page.
Table 2.6 ColdFire 2/3/4 Build Options Page Settings
Option
Description
Enable C++ Support
Check to enable C++ support
Full Board Support
Select to provide full support for the selected
board. The created project provides standard
input output support through console and
terminal window.
Minimal Hardware Support
Select if you do not want to provide board
initialization support. The project can be
customized or used with the Instruction Set
Simulator. The standard input output support
is enables for the Console build target.
However, you need to enable UART support
for standard input output support through
UART, by providing the correct system clock.
None
Select to disable floating point support
Microcontrollers V10.x Targeting Manual
33
DRAFT
Working with Projects
New Bareboard Project Wizard
Table 2.6 ColdFire 2/3/4 Build Options Page Settings (continued)
Option
Description
Float is IEEE64, double is IEEE64
Select to enable floating point support
No Optimizations
Select to disable optimization level
Easy Debug
Select to enable Level 1 code size
optimizations plus register coloring and
peephole
Full Optimizations
Select to enable full optimizations
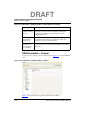
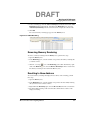
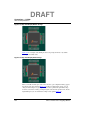
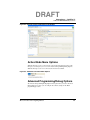
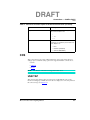
Connections Page
Use this page to select a connection to use for the project. Depending on the selected
derivative or board, the connections will appear enabled or grayed out.
Figure 2.8 Connections Page - HCS08/RS08 Derivative
34
Microcontrollers V10.x Targeting Manual
DRAFT
Working with Projects
New Bareboard Project Wizard
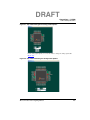
Figure 2.9 Connections Page - ColdFire V1 Derivative
Microcontrollers V10.x Targeting Manual
35
DRAFT
Working with Projects
New Bareboard Project Wizard
Figure 2.10 Connections Page - ColdFire V2-4 Derivative
Table 2.7 explains the connections available on this page.
Table 2.7 Connections Page Settings
36
Option
Description
SofTec
Connect to any of the USB-based SofTec
Microsystems tools (inDart-HC08, etc...)
P&E Cyclone PRO Serial
Connect to PE Cyclone Pro Serial
P&E Cyclone PRO USB
Connect to PE Cyclone Pro USB
P&E Cyclone PRO TCP-IP
Connect to PE Cyclone Pro TCP/IP
P&E USB BDM Multilink
Connect to PE USB BSM Multilink
Abatron BDI TCP-IP
Connect to Abatron BDI1000 or BDI 2000
through TCP/IP; is only available with the
CodeWarrior ColdFire Professional Edition
Microcontrollers V10.x Targeting Manual
DRAFT
Working with Projects
New Bareboard Project Wizard
Table 2.7 Connections Page Settings (continued)
Option
Description
Abatron BDI Serial
Connect to Abatron BDI1000 or BDI 2000
through host Serial Port; is only available
with the CodeWarrior ColdFire Professional
Edition
Freescale USB-TAP BDM
Connect to Freescale USB-TAP BDM
Freescale Ethernet-TAP BDM
Connect to Freescale Ethernet-TAP BDM
P&E Cyclone Max USB
Connect to PE Cyclone Max through host
USB port
P&E Cyclone Max TCP-IP
Connect to PE Cyclone Max through TCP/IP
P&E Cyclone Max Serial
Connect to PE Cyclone Max through host
serial port
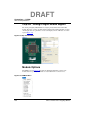
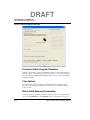
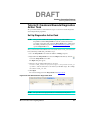
Rapid Application Development Page
Use this page to provide rapid application development (RAD) support when writing your
program.
Figure 2.11 Rapid Application Development Page
Microcontrollers V10.x Targeting Manual
37
DRAFT
Working with Projects
New Linux/uClinux Application Project Wizard
Select one of the available RAD options to set up special views in the IDE where you can
rapidly configure peripheral devices on the MCU, or pick from a library of field-tested
code modules that can implement various device services such as timer interrupts, or a
high speed serial interface.
NOTE
For more information on how to use the features of the Peripheral Initialization
or Processor Expert refer to the Processor Expert Users Manual and the Device
Initialization Users Manual.
Table 2.8 shows the various RAD options available and their purpose.
Table 2.8 RAD Page Settings
Option
Description
None
No RAD support provided. The wizard’s
default startxx.c file sets up the MCU’s
stack, its memory management unit (if any)
and the C/C++ language’s runtime.
Device Initialization
The wizard provides views in the C/C++
Perspective that let you set up the MCU’s
interrupts and its interrupt vector table.
Drivers for the MCU’s peripherals are also
available.
Processor Expert
The wizard provides views in the C/C++
Perspective that lets you set up the MCU’s
interrupts, vector table and device
initialization. It also provides you with a
choice of configurable support modules that
implement software services on various
MCU peripherals.
NOTE
If you select a RAD option other than None, the specialized views appear in
the C/C++ Perspective after the New MCU Project wizard exits.
New Linux/uClinux Application Project
Wizard
When you start the Microcontrollers New Linux/uClinux Application Project wizard, it
presents you with a sequence of pages that prompt you for the features and settings to be
38
Microcontrollers V10.x Targeting Manual
DRAFT
Working with Projects
New Linux/uClinux Application Project Wizard
used when making your program. For example, the device and connection options lets you
select the ColdFire derivative or board you would like to use.
Other options let you to specify other settings, such as whether the program executes on an
emulator or simulator rather than actual hardware, and the characteristics of the
connection that communicates with a hardware target.
This topic describes the various pages that the wizard displays as it assists you in creating
a bareboard project. The pages that the wizard presents can differ based upon the option of
project type or execution target.
The following topic, explain the pages of the New Linux/uClinux Application Project
wizard.
• Create a Linux/uClinux Application Project Page
• Device used for Linux Application Debug Page
• Project Language and Output Page
• Connections Page
• Application Debug Options Page
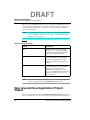
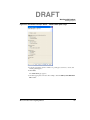
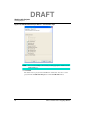
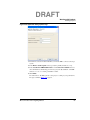
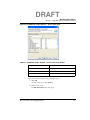
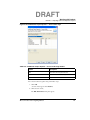
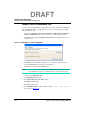
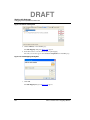
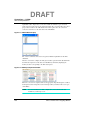
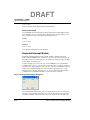
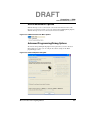
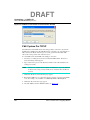
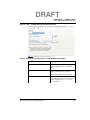
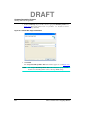
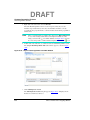
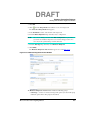
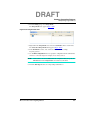
Create a Linux/uClinux Application Project
Page
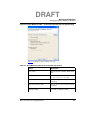
Use this page to name your project, and specify the directory where its files are located.
Figure 2.12 Create a Linux/uClinux Application Project Page
Microcontrollers V10.x Targeting Manual
39
DRAFT
Working with Projects
New Linux/uClinux Application Project Wizard
Table 2.9 describes the purpose of the various options.
Table 2.9 Create a Linux/uClinux Application Project Page Settings
Option
Description
New Project Name
Enter the name for the new project in this
text box.
Use default location
Stores the files required to build the program
in the Workbench’s current workspace
directory. The project files are located in the
directory you specify. Use the Location
option to select the directory.
Location
Specifies the directory that contains the
project files. Click Browse to navigate to the
desired directory. This option is only
available when Use default location is
clear.
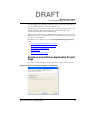
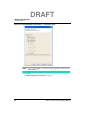
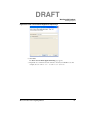
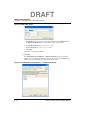
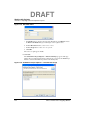
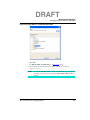
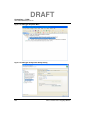
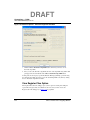
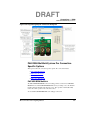
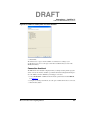
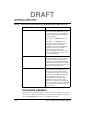
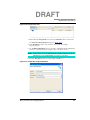
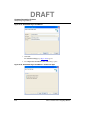
Device used for Linux Application Debug
Page
Use this page to select the derivative or board you would like to use.
Figure 2.13 Device used for Linux Application Debug Page
40
Microcontrollers V10.x Targeting Manual
DRAFT
Working with Projects
New Linux/uClinux Application Project Wizard
Table 2.10 describes the purpose of the various options.
Table 2.10 Device used for Linux Application Debug Page
Option
Description
ColdFire V2 > ColdFire V2 uClinux
Select to create ColdFire V2 Core uClinux
applications, libraries, and kernel modules.
ColdFire V3 > ColdFire V3 uClinux
Select to create ColdFire V3 Core uClinux
applications, libraries, and kernel modules.
ColdFire V4 > ColdFire V4 GNU Linux
Select to create ColdFire V2 Core GNU
Linux applications, libraries, and kernel
modules.
ColdFire V4e > ColdFire V4e GNU
Linux
Select to create ColdFire V4e Core GNU
Linux applications, libraries, and kernel
modules.
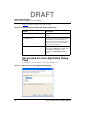
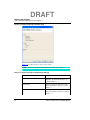
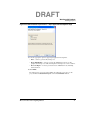
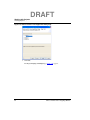
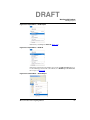
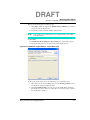
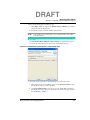
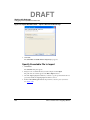
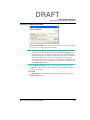
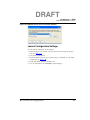
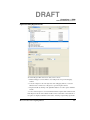
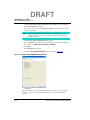
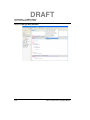
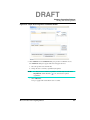
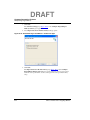
Project Language and Output Page
Use this page to select the programming language that you want to use when writing the
program’s source code. You can make multiple selections, creating the code in multiple
formats.
Microcontrollers V10.x Targeting Manual
41
DRAFT
Working with Projects
New Linux/uClinux Application Project Wizard
Figure 2.14 Project Language and Output Page
Table 2.11 describes the purpose of the various options.
NOTE
Based on your selection, the IDE may show or hide some options.
Table 2.11 Project Language and Output Page Settings
42
Option
Description
Application
Select if you want the output to be an
application. By default, the extension of a
loadable module is.elf.
Static Library
Select if you want the output to be a static
library. By default, the extension of a static
library is .a.
Shared Library
Select if you want the output to be a shared
library. By default, the extension of a shared
library is .so.
Microcontrollers V10.x Targeting Manual
DRAFT
Working with Projects
New Linux/uClinux Application Project Wizard
Table 2.11 Project Language and Output Page Settings (continued)
Option
Description
Kernel Loadable Module
Select if you want the output to be a kernel
loadable module. By default, the extension of
a loadable module is.o.
C
Select to add C language support.
C and C++
Select to add C and C++ language support.
Available for Application and Static options
only.
C++
Select to add C++ language support.
Available for Application and Static options
only.
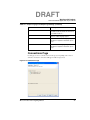
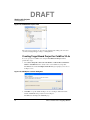
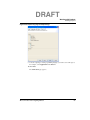
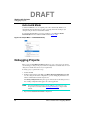
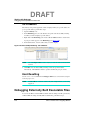
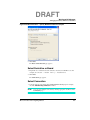
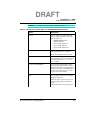
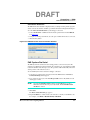
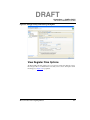
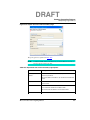
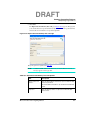
Connections Page
Use this page to select a connection to use for the project. Depending on the selected
derivative or board, the connections will appear enabled or grayed out.
Figure 2.15 Connections Page
Microcontrollers V10.x Targeting Manual
43
DRAFT
Working with Projects
New Linux/uClinux Application Project Wizard
Table 2.12 describes the purpose of the various options.
Table 2.12 Connections Page Settings
Option
Description
Linux CodeWarrior TRK TCP-IP
Available only if the Application option is
selected on the Project Language and
Output page.
Linux CodeWarrior TRK Serial
Available only if the Application option is
selected on the Project Language and
Output page.
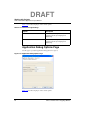
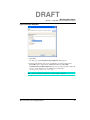
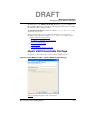
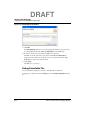
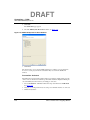
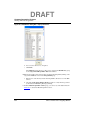
Application Debug Options Page
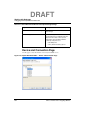
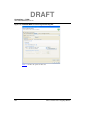
Use this page to specify the application debug options for a project.
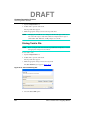
Figure 2.16 Application Debug Options Page
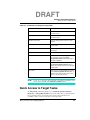
Table 2.13 describes the purpose of the various options.
44
Microcontrollers V10.x Targeting Manual
DRAFT
Working with Projects
Creating Projects
Table 2.13 Application debug options Settings
Option
Description
Kernel source tree path for module
projects
Click Browse to specify or enter the kernel
source tree path for module projects.
Ignore kernel source tree path
Select to ignore the kernel source tree path.
Remote download path
Specify the remote download path.
CodeWarrior TRK TCP-IP IP Address
Specify the CodeWarrior TRK TCP/IP
Address.
CodeWarrior TRK TCP/IP Port
Specify the CodeWarrior CodeWarrior TRK
TCP/IP port number.
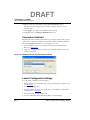
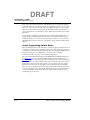
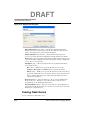
Creating Projects
The New Bareboard Project and New Linux/uClinux Application Project wizards help
you to quickly create new projects. The wizard generates a project with placeholder files
and default settings (build and launch configurations) specific targets. After the project
has been created, you can easily change any default setting to suit your needs.
The following topics explain the steps to create Bareboard and Linux/uClinux Application
projects for HCS08, RS08, Flexis, ColdFire V1, and ColdFire V2-4e derivatives.
• Creating Bareboard Projects
• Creating Linux/uClinux Application Project
Creating Bareboard Projects
The following topics explain the steps to create bareboard projects for HCS08, RS08, and
ColdFire architectures.
• Creating Simulator Projects for HCS08
• Creating Simulator Projects for RS08
• Creating Target Board Project for ColdFire V1
• Creating Target Board Project for ColdFire V2-4e
NOTE
The ColdFire V1, ColdFire V2, ColdFire V3 ColdFire V4, ColdFire V4e, and
ColdFire Evaluation Boards architectures do not support Full Chip Simulation.
Microcontrollers V10.x Targeting Manual
45
DRAFT
Working with Projects
Creating Projects
Creating Simulator Projects for HCS08
To create a simulator project for HCS08 using the New Bareboard Project wizard,
perform these steps.
1. Select Start > Programs > Freescale CodeWarrior > CW for Microcontrollers V
number > CodeWarrior, where number is the version number of your product.
The IDE launches and the WorkSpace Launcher dialog box prompts you to select a
workspace to use.
Figure 2.17 WorkSpace Launcher Dialog Box
2. Click OK to accept the default workspace. To use a workspace different from the
default, click Browse and specify the desired workspace.
The IDE starts and displays the Welcome page.
NOTE
46
You can also select the Use this as the default and do not ask again checkbox
to set default/selected path as a default location for storing all your projects.
Microcontrollers V10.x Targeting Manual
DRAFT
Working with Projects
Creating Projects
Figure 2.18 Welcome Page
3. Click the Go to Workbench link.
The Workbench window opens.
4. Select File > New > Bareboard Project, from the IDE menu bar.
The Create an MCU bareboard Project page of the New Bareboard Project wizard
appears (Figure 2.19).
5. Specify a name for the new project. For example, enter the project name as
Project_1.
NOTE
Clear the Use default location checkbox and click Browse to specify different
location for the new project. By default, the Use default location checkbox is
checked.
Microcontrollers V10.x Targeting Manual
47
DRAFT
Working with Projects
Creating Projects
Figure 2.19 New Bareboard Project Wizard — Create an MCU Bareboard Project Page
6. Click Next.
The Device and Connection page appears (Figure 2.20).
7. Expand the tree control and select the derivative or board you would like to use. For
example, select HCS08 > HCS08A Family > MC9S08AC128.
48
Microcontrollers V10.x Targeting Manual
DRAFT
Working with Projects
Creating Projects
Figure 2.20 New Bareboard Project Wizard — Device and Connection Page
8. Click Next.
The Add Files page appears.
Microcontrollers V10.x Targeting Manual
49
DRAFT
Working with Projects
Creating Projects
Figure 2.21 New Bareboard Project Wizard — Add Files Page
9. If you want to add a file to the project, click
.
The Add File Path dialog box appears.
a. Type the path of the file you want to add or browse the file by clicking the File
system button.
b. Click OK to close the Add File Path dialog box.
c. Check the Copy files into project checkbox if you want to add the selected file in
the project. If you clear the Copy files into project checkbox, the file is linked into
the project and not copied.
d. Clear the Create main.c/main.asm file checkbox if you do not want to create the
main source file in the project.
10. Click Next.
The Languages page appears.
50
Microcontrollers V10.x Targeting Manual
DRAFT
Working with Projects
Creating Projects
Figure 2.22 New Bareboard Project Wizard — Languages Page
11. Select the programming language you want to use. For example, check the C
checkbox.
12. Click Next.
The C/C++ Options page appears.
NOTE
If you check only the Relocatable Assembly or Absolute Assembly
checkbox, clicking Next will display the Connections page instead (Figure
2.24).
Microcontrollers V10.x Targeting Manual
51
DRAFT
Working with Projects
Creating Projects
Figure 2.23 New Bareboard Project Wizard — C/C++ Options Page
13. Select the appropriate level of startup code, memory model, and floating point format.
14. Click Next.
The Connections page appears.
52
Microcontrollers V10.x Targeting Manual
DRAFT
Working with Projects
Creating Projects
Figure 2.24 New Bareboard Project Wizard — Connections Page
15. Check the P&E Full Chip Simulation checkbox.
NOTE
You can select multiple connections by checking appropriate checkboxes in the
Connections page.
16. Click Next.
The Rapid Application Development page appears.
Microcontrollers V10.x Targeting Manual
53
DRAFT
Working with Projects
Creating Projects
Figure 2.25 New Bareboard Project Wizard — Rapid Application Development Page
17. Select the appropriate option to support rapid application development.
• None — Select to generate only startup code.
• Device Initialization — Select to generate the initialization code for on-chip
peripherals, interrupt vector table, and template for interrupt vector service routines.
• Processor Expert — Select to generate the device initialization code, including
low-level drivers.
18. Click Finish.
The wizard creates a simulator project for the HCS08 architecture. You can access the
project from the CodeWarrior Projects view in the Workbench window.
54
Microcontrollers V10.x Targeting Manual
DRAFT
Working with Projects
Creating Projects
Figure 2.26 CodeWarrior Projects View
The new project is ready for use. You can now customize it by adding your own source
code files, changing debugger settings, or adding libraries.
Creating Simulator Projects for RS08
To create a simulator project for RS08 using the New Bareboard Project wizard, perform
these steps.
1. Select Start > Programs > Freescale CodeWarrior > CW for Microcontrollers V
number > CodeWarrior, where number is the version number of your product.
The IDE launches and the WorkSpace Launcher dialog box prompts you to select a
workspace to use.
Figure 2.27 WorkSpace Launcher Dialog Box
2. Click OK to accept the default workspace. To use a workspace different from the
default, click Browse and specify the desired workspace.
The IDE starts and displays the Welcome page.
Microcontrollers V10.x Targeting Manual
55
DRAFT
Working with Projects
Creating Projects
NOTE
You can also select the Use this as the default and do not ask again checkbox
to set default/selected path as a default location for storing all your projects.
Figure 2.28 Welcome Page
3. Click the Go to Workbench link.
The Workbench window opens.
4. Select File > New > Bareboard Project, from the IDE menu bar.
The Create an MCU bareboard Project page of the New Bareboard Project wizard
appears.
5. Specify a name for the new project. For example, enter the project name as
Project_2.
NOTE
56
Clear the Use default location checkbox and click Browse to specify different
location for the new project. By default, the Use default location checkbox is
checked.
Microcontrollers V10.x Targeting Manual
DRAFT
Working with Projects
Creating Projects
Figure 2.29 New Bareboard Project Wizard — Create an MCU Bareboard Project Page
6. Click Next.
The Device and Connection page appears.
7. Expand the tree control and select the derivative or board you would like to use. For
example, select RS08 > RS08KA Family > MC9RS08KA1.
Microcontrollers V10.x Targeting Manual
57
DRAFT
Working with Projects
Creating Projects
Figure 2.30 New Bareboard Project Wizard — Device and Connection Page
8. Click Next.
The Add Files page appears.
58
Microcontrollers V10.x Targeting Manual
DRAFT
Working with Projects
Creating Projects
Figure 2.31 New Bareboard Project Wizard — Add Files Page
9. If you want to add a file to the project, click
.
The Add File Path dialog box appears.
a. Type the path of the file you want to add or browse the file by clicking the File
system button.
b. Click OK to close the Add File Path dialog box.
c. Check the Copy files into project checkbox if you want to add the selected file in
the project. If you clear the Copy files into project checkbox, the file is linked into
the project and not copied.
d. Clear the Create main.c/main.asm file checkbox if you do not want to create the
main source file in the project.
10. Click Next.
The Languages page appears.
Microcontrollers V10.x Targeting Manual
59
DRAFT
Working with Projects
Creating Projects
Figure 2.32 New Bareboard Project Wizard — Languages Page
11. Select the programming language you want to use. For example, check the C
checkbox.
12. Click Next.
The C/C++ Options page appears.
NOTE
60
If you check only the Relocatable Assembly or Absolute Assembly
checkbox, clicking Next will display the Connections page instead (Figure
2.34).
Microcontrollers V10.x Targeting Manual
DRAFT
Working with Projects
Creating Projects
Figure 2.33 New Bareboard Project Wizard — C/C++ Options Page
13. Select the appropriate level of startup code, memory model, and floating point format.
14. Click Next.
The Connections page appears.
Microcontrollers V10.x Targeting Manual
61
DRAFT
Working with Projects
Creating Projects
Figure 2.34 New Bareboard Project Wizard — Connections Page
15. Check the P&E Full Chip Simulation checkbox.
NOTE
You can select multiple connections by checking appropriate checkboxes in the
Connections page.
16. Click Next.
The Rapid Application Development page appears.
62
Microcontrollers V10.x Targeting Manual
DRAFT
Working with Projects
Creating Projects
Figure 2.35 New Bareboard Project Wizard — Rapid Application Development Page
17. Select the appropriate option to support rapid application development.
• None — Select to generate only startup code.
• Device Initialization — Select to generate the initialization code for on-chip
peripherals, interrupt vector table, and template for interrupt vector service routines.
• Processor Expert — Select to generate the device initialization code, including
low-level drivers.
18. Click Finish.
The wizard creates a simulator project for the RS08 architecture according to your
specifications. You can access the project from the CodeWarrior Projects view in the
Workbench window.
Microcontrollers V10.x Targeting Manual
63
DRAFT
Working with Projects
Creating Projects
Figure 2.36 CodeWarrior Projects View
The new project is ready for use. You can now customize it by adding your own source
code files, changing debugger settings, or adding libraries.
Creating Target Board Project for ColdFire V1
To create a target board project for ColdFire V1 using the New Bareboard Project
wizard, perform these steps.
1. Select Start > Programs > Freescale CodeWarrior > CW for Microcontrollers V
number > CodeWarrior, where number is the version number of your product.
The IDE launches and the WorkSpace Launcher dialog box prompts you to select a
workspace to use.
Figure 2.37 WorkSpace Launcher Dialog Box
2. Click OK to accept the default workspace. To use a workspace different from the
default, click Browse and specify the desired workspace.
The IDE starts and displays the Welcome page.
64
Microcontrollers V10.x Targeting Manual
DRAFT
Working with Projects
Creating Projects
NOTE
You can also select the Use this as the default and do not ask again checkbox
to set default/selected path as a default location for storing all your projects.
Figure 2.38 Welcome Page
3. Click the Go to Workbench link.
The Workbench window opens.
4. Select File > New > Bareboard Project, from the IDE menu bar.
The Create an MCU bareboard Project page of the New Bareboard Project wizard
appears.
5. Specify a name for the new project. For example, enter the project name as
TargetProject_1.
NOTE
Clear the Use default location checkbox and click Browse to specify different
location for the new project. By default, the Use default location checkbox is
checked.
Microcontrollers V10.x Targeting Manual
65
DRAFT
Working with Projects
Creating Projects
Figure 2.39 New Bareboard Project Wizard — Create an MCU Bareboard Project Page
6. Click Next.
The Device and Connection page appears.
7. Expand the tree control and select the derivative or board you would like to use. For
example, select ColdFire V1 > MCF51JM Family > MCF51JM128.
66
Microcontrollers V10.x Targeting Manual
DRAFT
Working with Projects
Creating Projects
Figure 2.40 New Bareboard Project Wizard — Device and Connection Page
8. Click Next.
The Add Files page appears.
Microcontrollers V10.x Targeting Manual
67
DRAFT
Working with Projects
Creating Projects
Figure 2.41 New Bareboard Project Wizard — Add Files Page
9. If you want to add a file to the project, click
.
The Add File Path dialog box appears.
a. Type the path of the file you want to add or browse the file by clicking the File
system button.
b. Click OK to close the Add File Path dialog box.
c. Check the Copy files into project checkbox if you want to add the selected file in
the project. If you clear the Copy files into project checkbox, the file is linked into
the project and not copied.
d. Clear the Create main.c/main.asm file checkbox if you do not want to create the
main source file in the project.
10. Click Next.
The ColdFire Build Options page appears.
68
Microcontrollers V10.x Targeting Manual
DRAFT
Working with Projects
Creating Projects
Figure 2.42 New Bareboard Project Wizard — ColdFire Build Options Page
11. Select the appropriate options to enable C++, porting processor macro, console, and
floating point supports.
12. Click Next.
The Connections page appears.
13. Check the appropriate connection. For example, check the P&E Cyclone PRO TCPIP checkbox.
Microcontrollers V10.x Targeting Manual
69
DRAFT
Working with Projects
Creating Projects
Figure 2.43 New Bareboard Project Wizard — Connections Page
NOTE
You can select multiple connections by checking appropriate checkboxes in the
Connections page.
14. Click Next.
The Rapid Application Development page appears.
70
Microcontrollers V10.x Targeting Manual
DRAFT
Working with Projects
Creating Projects
Figure 2.44 New Bareboard Project Wizard — Rapid Application Development Page
15. Select the appropriate option to support rapid application development.
• None — Select to generate only startup code.
• Device Initialization — Select to generate the initialization code for on-chip
peripherals, interrupt vector table, and template for interrupt vector service routines.
• Processor Expert — Select to generate the device initialization code, including
low-level drivers.
16. Click Finish.
The wizard creates a project for the ColdFire V1 architecture. You can access the
project from the CodeWarrior Projects view in the Workbench window.
Microcontrollers V10.x Targeting Manual
71
DRAFT
Working with Projects
Creating Projects
Figure 2.45 CodeWarrior Projects View
The new project is ready for use. You can now customize it by adding your own source
code files, changing debugger settings, or adding libraries.
Creating Target Board Project for ColdFire V2-4e
To create a project for ColdFire V2-4e using the New Bareboard Project wizard,
perform these steps.
1. Select Start > Programs > Freescale CodeWarrior > CW for Microcontrollers V
number > CodeWarrior, where number is the version number of your product.
The IDE launches and the WorkSpace Launcher dialog box prompts you to select a
workspace to use.
Figure 2.46 WorkSpace Launcher Dialog Box
2. Click OK to accept the default workspace. To use a workspace different from the
default, click Browse and specify the desired workspace.
The IDE starts and displays the Welcome page.
72
Microcontrollers V10.x Targeting Manual
DRAFT
Working with Projects
Creating Projects
NOTE
You can also select the Use this as the default and do not ask again checkbox
to set default/selected path as a default location for storing all your projects.
Figure 2.47 Welcome Page
3. Click the Go to Workbench link.
The Workbench window opens.
4. Select File > New > Bareboard Project, from the IDE menu bar.
The Create an MCU bareboard Project page of the New Bareboard Project wizard
appears.
5. Specify a name for the new project. For example, enter the project name as
TargetProject_2.
NOTE
Clear the Use default location checkbox and click Browse to specify different
location for the new project. By default, the Use default location checkbox is
checked.
Microcontrollers V10.x Targeting Manual
73
DRAFT
Working with Projects
Creating Projects
Figure 2.48 New Bareboard Project Wizard — Create an MCU Bareboard Project Page
6. Click Next.
The Device and Connection page appears.
7. Expand the tree control and select the derivative or board you would like to use. For
example, select ColdFire V4e > MCF547X > MCF5475.
74
Microcontrollers V10.x Targeting Manual
DRAFT
Working with Projects
Creating Projects
Figure 2.49 New Bareboard Project Wizard — Device and Connection
8. Click Next.
The Add Files page appears.
Microcontrollers V10.x Targeting Manual
75
DRAFT
Working with Projects
Creating Projects
Figure 2.50 New Bareboard Project Wizard — Add Files Page
9. If you want to add a file to the project, click
.
The Add File Path dialog box appears.
a. Type the path of the file you want to add or browse the file by clicking the File
system button.
b. Click OK to close the Add File Path dialog box.
c. Check the Copy files into project checkbox if you want to add the selected file in
the project. If you clear the Copy files into project checkbox, the file is linked into
the project and not copied.
d. Clear the Create main.c/main.asm file checkbox if you do not want to create the
main source file in the project.
10. Click Next.
The ColdFire Build Options page appears.
76
Microcontrollers V10.x Targeting Manual
DRAFT
Working with Projects
Creating Projects
Figure 2.51 New Bareboard Project Wizard — ColdFire Build Options Page
11. Select the appropriate options to enable C++, porting processor macro, console, and
floating point supports.
12. Click Next.
The Connections page appears.
13. Check the appropriate connection. For example, check the P&E Cyclone MAX TCPIP checkbox.
Microcontrollers V10.x Targeting Manual
77
DRAFT
Working with Projects
Creating Projects
Figure 2.52 New Bareboard Project Wizard — Connections Page
NOTE
You can select multiple connections by checking appropriate checkboxes in the
Connections page.
14. Click Finish.
The wizard creates a project for the ColdFire V4e architecture. You can access the
project from the CodeWarrior Projects view in the Workbench window.
78
Microcontrollers V10.x Targeting Manual
DRAFT
Working with Projects
Creating Projects
Figure 2.53 CodeWarrior Projects View
The new project is ready for use. You can now customize it by adding your own source
code files, changing debugger settings, or adding libraries.
Creating Linux/uClinux Application Project
To create a Linux/uClinux Application Project using the New Linux/uClinux
Application Project wizard, perform these steps.
1. Select Start > Programs > Freescale CodeWarrior > CW for Microcontrollers V
number > CodeWarrior, where number is the version number of your product.
The IDE launches and the WorkSpace Launcher dialog box prompts you to select a
workspace to use.
Figure 2.54 WorkSpace Launcher Dialog Box
2. Click OK to accept the default workspace. To use a workspace different from the
default, click Browse and specify the desired workspace.
The IDE starts and displays the Welcome page.
Microcontrollers V10.x Targeting Manual
79
DRAFT
Working with Projects
Creating Projects
NOTE
You can also select the Use this as the default and do not ask again checkbox
to set default/selected path as a default location for storing all your projects.
Figure 2.55 Welcome Page
3. Click the Go to Workbench link.
The Workbench window opens.
4. Select File > New > Linux/uClinux Application Project, from the IDE menu bar.
The Create a Linux/uClinux Application Project page of the New Linux/uClinux
Application Project wizard appears.
5. Specify a name for the new project. For example, enter the project name as
LinuxProject_1.
NOTE
80
Clear the Use default location checkbox and click Browse to specify different
location for the new project. By default, the Use default location checkbox is
checked.
Microcontrollers V10.x Targeting Manual
DRAFT
Working with Projects
Creating Projects
Figure 2.56 Create a Linux/uClinux Application Project Page
6. Click Next.
The Device used for Linux Application Debug page appears.
7. Expand the tree control and select the derivative or board you would like to use. For
example, select ColdFire V2 > ColdFire V2 uClinux.
Microcontrollers V10.x Targeting Manual
81
DRAFT
Working with Projects
Creating Projects
Figure 2.57 Device used for Linux Application Debug Page
8. Click Next.
The Project Language and Output page (Figure 2.58) appears.
82
Microcontrollers V10.x Targeting Manual
DRAFT
Working with Projects
Creating Projects
Figure 2.58 Project Language and Output Page
9. Select the output type and the programming language you want to use for this project.
For example, select Application and C and C++.
10. Click Next.
The Connections page appears.
Microcontrollers V10.x Targeting Manual
83
DRAFT
Working with Projects
Creating Projects
Figure 2.59 Connections Page
11. Check the appropriate connection.
12. Click Next.
The Application debug options page appears.
84
Microcontrollers V10.x Targeting Manual
DRAFT
Working with Projects
Creating Projects
Figure 2.60 Application debug options Page
13. From the list, select the method with which you want the IDE to connect to the target
system.
14. In the Remote download path text box, specify the path. By default, it is /tmp.
15. In the CodeWarrior TRK TCP/IP Address and CodeWarrior TCP/IP text boxes,
enter the IP address and listening port of the target system. By default the is TCP/IP
address is 127.0.0.1 and the port number is 2000.
16. Click Finish.
The wizard closes. The IDE generates a new project according to your specifications.
The project window (Figure 2.61) appears.
Microcontrollers V10.x Targeting Manual
85
DRAFT
Working with Projects
Building Projects
Figure 2.61 Project Window
Building Projects
CodeWarrior IDE supports two modes of building projects:
• Manual-build Mode
• Auto-build Mode
Manual-build Mode
In large workspaces, building the entire workspace can take a long time if you make
changes with a significant impact on dependent projects. Often there are only a few
projects that really matter to you at a given time.
To build only the selected projects, and any prerequisite projects that need to be built in
order to correctly build the selected projects, select Project > Build Project from the
CodeWarrior IDE menu bar (Figure 2.62).
86
Microcontrollers V10.x Targeting Manual
DRAFT
Working with Projects
Building Projects
Figure 2.62 Project Menu — Build Project
Or
Alternatively, select Project > Build All (Figure 2.63).
Figure 2.63 Project Menu — Build All
Alternatively, right-click on the simulator project in the CodeWarrior Projects view.
A context menu appears. From the context menu, select Build Project. The IDE builds
the new project (Figure 2.64).
Figure 2.64 Context Menu — Build Project
Microcontrollers V10.x Targeting Manual
87
DRAFT
Working with Projects
Debugging Projects
Auto-build Mode
CodeWarrior IDE takes care of compiling source files automatically. Builds occur
automatically in the background every time you change files in the workspace (for
example saving an editor), if auto-build is enabled.
To automatically build all the projects in a workspace, select Project > Build
Automatically from the CodeWarrior IDE menu bar (Figure 2.65).
Figure 2.65 Project Menu — Build Automatically
Debugging Projects
When you use the New Bareboard Project wizard to create a new project, the wizard
sets the debugger settings of the project's launch configurations to default values. You can
change these default values based on your requirements.
To debug a project, perform these steps.
1. Launch the IDE.
2. From the main menu bar of the IDE, select Run > Debug Configurations. The IDE
uses the settings in the launch configuration to generate debugging information and
initiate communications with the target board.
The Debug Configurations dialog box appears. The left side of this dialog box has a
list of debug configurations that apply to the current application.
NOTE
For more information on how to use the debugger, refer to the Freescale
Eclipse Extensions Guide and the Working with Debugger chapter of this
manual.
3. Expand the CodeWarrior Download configuration.
88
Microcontrollers V10.x Targeting Manual
DRAFT
Working with Projects
Debugging Projects
4. From the expanded list, select the debug configuration that you want to modify.
Figure 2.66 displays the Debug Configurations dialog box with the settings for the
debug configuration you selected.
Figure 2.66 Debug Configurations Dialog Box
5. Click the Debugger tab.
The Debugger page appears in the area beneath the tabs.
Microcontrollers V10.x Targeting Manual
89
DRAFT
Working with Projects
Debugging Projects
Figure 2.67 Debug Configurations Dialog Box — Debugger Page
6. Change the settings on this page as per your requirements. For example, select the
required target processor and simulator/emulator.
NOTE
For more information on debugger, refer chapter Working with Debugger.
7. Click Apply to save the new settings.
8. Click Debug to start the debugging session.
You just finished starting a debugging session and attaching the debugger to a process.
NOTE
90
You can click Revert to undo any of the unsaved changes. The IDE restores
the last set of saved settings to all pages of the Debug Configurations dialog
box. Also, the IDE disables Revert until you make new pending changes.
Microcontrollers V10.x Targeting Manual
DRAFT
Working with Projects
Deleting Projects
Deleting Projects
To delete a project, follow these steps.
1. Select the project you want to delete in the CodeWarrior Projects view.
2. Select Edit > Delete.
The Confirm Project Delete dialog box appears.
NOTE
Alternatively, you can also select Delete from the context menu when you
right-click on the project.
3. Select the Also delete contents under <filepath> option if you want to delete the
contents of the selected project. Else, select the Do not delete contents option.
NOTE
You will not be able to restore your project using “Undo”, if you select the
Also delete contents under <filepath> option.
4. Click Yes.
The project is removed from the CodeWarrior Projects view.
Importing Classic CodeWarrior Projects
The CodeWarrior Project Importer feature in Eclipse helps automate the conversion of a
legacy C/C++ CodeWarrior 5.x project to an Eclipse CDT project.
This feature lets you:
• select the classic CodeWarrior project,
• set targets to import,
• configure source trees and shielded folders,
• edit access paths for each target,
• list files that are not found in the previous settings,
• specify the new Eclipse project name and location,
• list warning or errors in the conversion process, and
• open the newly created Eclipse project.
NOTE
For more information on importing classic CodeWarrior projects to Eclipse
IDE, refer to the Freescale Eclipse Extensions Guide and CodeWarrior Project
Importer Quick Start.
Microcontrollers V10.x Targeting Manual
91
DRAFT
Working with Projects
Tutorials — Importing Connection-Specific Projects
NOTE
For information on importing connection-specific Microcontroller projects,
refer to the Tutorials — Importing Connection-Specific Projects topic.
Tutorials — Importing Connection-Specific
Projects
This topic consists of tutorials that demonstrate how to import connection-specific classic
Microcontrollers projects to Eclipse.
The tutorials include:
• Tutorial A: Porting Classic HCS08 Project
• Tutorial B: Porting Classic RS08 Project
• Tutorial C: Porting Classic ColdFire V1 Project
• Tutorial D: Porting Classic ColdFire V2/3/4 Project
Tutorial A: Porting Classic HCS08 Project
The goal of this tutorial is to import a classic HCS08 project to Eclipse.
NOTE
Before starting the process ensure that the CodeWarrior HCS08 project you
want to import has all of its files, such as the source, linker command, and
settings file.
To port a classic HCS08 project, perform these steps.
1. Select File > Import from the Workbench menu bar.
The Import dialog box appears.
2. Expand the CodeWarrior tree control and select CodeWarrior Project Importer.
92
Microcontrollers V10.x Targeting Manual
DRAFT
Working with Projects
Tutorials — Importing Connection-Specific Projects
Figure 2.68 Import Dialog Box
3. Click Next.
The first page of the CodeWarrior Project Importer wizard appears.
4. Enter the path and name of the classic CodeWarrior project file to import in the
Project file text box. Alternatively, click Browse and use the Select The
CodeWarrior Project File to Import dialog box to select the project file to import. In
this case, assume that the classic CodeWarrior project filename is
hcs08_projectimporter_test.mcp.
TIP
The project file has an extension of .mcp. Select the .mcp file.
Microcontrollers V10.x Targeting Manual
93
DRAFT
Working with Projects
Tutorials — Importing Connection-Specific Projects
Figure 2.69 Select The CodeWarrior Project File to Import Dialog Box
The path of the project file to import appears in the Project file text box.
Figure 2.70 Path of CodeWarrior Project File to Import
94
Microcontrollers V10.x Targeting Manual
DRAFT
Working with Projects
Tutorials — Importing Connection-Specific Projects
5. Click Next.
The Options page of the CodeWarrior Project Importer wizard appears.
Figure 2.71 CodeWarrior Project Importer — Options Page
6. Select the build target that uses the HCS08 toolchain you want the generated Eclipse
project to use, from the Toolchain Target list box.
NOTE
The toolchain target linker in the classic project defines the project type of the
generated Eclipse project, including toolchain and build settings.
The build targets table displays all the targets discovered in the project file and is used
to generate equivalent Eclipse build configurations.
7. You can import each build target in the classic CodeWarrior project based upon
predefined configurations of the toolchain. For example: The HCS08 project in the
example lists these values:
• Imported Project Type = Freescale HCS08 Project
• Enabled = true
• CodeWarrior Target Name = <Toolchain Target>
• Eclipse Configuration Name = HCS08
Microcontrollers V10.x Targeting Manual
95
DRAFT
Working with Projects
Tutorials — Importing Connection-Specific Projects
TIP
To disable the generation of specific configurations, click a row in the build target
table. In the Edit Table Values dialog box set Enabled to false and click OK.
8. If you want to import sub-projects included in the classic CodeWarrior project, check
the Recursively Import Sub-Projects checkbox.
The CodeWarrior Project Importer wizard imports the sub-projects with the main
project.
NOTE
The CodeWarrior Project Importer wizard will copy only those files that are
displayed in the CodeWarrior’s project window. The wizard will not import a
file if it is not displayed or does not include project information.
9. Click Advanced.
Figure 2.72 CodeWarrior Project Importer — Options Page
The Advanced Options dialog box appears.
96
Microcontrollers V10.x Targeting Manual
DRAFT
Working with Projects
Tutorials — Importing Connection-Specific Projects
Figure 2.73 Advanced Options
WARNING!
Checking the Duplicate files included in the .mcp project under the
new project location in the workspace checkbox may cause build
errors.
10. Check the Duplicate files included in the .mcp project under the new project
location in the workspace checkbox.
11. Click OK to close the dialog box.
12. Click Next.
The Globals page of the CodeWarrior Project Importer wizard appears. This page
lets you edit global settings that can effect how the project's build options are
imported.
Figure 2.74 CodeWarrior Project Importer — Globals Page
Microcontrollers V10.x Targeting Manual
97
DRAFT
Working with Projects
Tutorials — Importing Connection-Specific Projects
Table 2.14 lists the options on the CodeWarrior Project Importer — Globals page.
Table 2.14 CodeWarrior Project Importer — Globals Page Options
Options
Description
Shielded Folder List
Previous versions of the CodeWarrior tools let you conceal
the contents of folders from the IDE's search operations
during a build. This was done by placing special characters in
the directory name. For example, sample code was
concealed in a (CodeWarrior Examples) folder.
The Shielded Folder List table lists these options:
• \(.*\)
• CVS
• .*[ _]Data
You use the Add, Delete, and Clear buttons to modify the
information in this list. Table 2.15 lists these buttons with their
descriptions.
Source Trees
Specifies the location of the source trees. If an access path is
defined relative to a source tree, the source tree should be
listed in this table. The {Project} source tree is defined
automatically.
The Sources Trees table lists these options:
• Name — Lists the source name. For example:
Compiler.
• Compiler — Lists the path source name. For
example: <CW Install>/
<Microcontrollers_version>.
You use the Add, Delete, and Clear buttons to modify the
information in this list. Table 2.15 lists these buttons with their
descriptions.
Table 2.15 CodeWarrior Project Importer — Globals Page Buttons
98
Button
Description
Add
Add a new entry to the list.
Delete
Deletes the selected item.
Clear
Clears the entire list.
Microcontrollers V10.x Targeting Manual
DRAFT
Working with Projects
Tutorials — Importing Connection-Specific Projects
13. To add a new expression to the Shielded Folder List table, perform these steps.
a. Click Add.
(regular_expression) appears in the shielded folder list.
b. Double-click (regular_expression) and type the required expression.
The new expression appears in shielded folder list.
Figure 2.75 Shielded Folder List
14. To delete an existing expression from the Shielded Folder List table, select the
expression and click Delete.
The selected expression is deleted from the shielded folder list.
15. To remove all the existing expressions from the Shielded Folder List table, click
Clear.
All the expressions are deleted from the shielded folder list.
16. To add a new source to the Source Trees table, perform these steps.
a. Click Add.
SourceName appears in the source trees list.
Figure 2.76 Source Trees
b. Double-click SourceName.
The Edit Table Values dialog box appears.
Microcontrollers V10.x Targeting Manual
99
DRAFT
Working with Projects
Tutorials — Importing Connection-Specific Projects
Figure 2.77 Edit Table Values
c. In the Name text box, enter the source name.
d. In the Path text box, enter the path of the new source. Alternatively, click Browse
and use the Browse For Folder dialog box and navigate to the required source.
e. Click OK.
The new source appears in Source Trees list.
17. Click Next.
The CodeWarrior Project Importer - Access Paths page appears.
NOTE
Access paths are directory paths the CodeWarrior tools use to search for
libraries, runtime support files, and other object files.
Table 2.16 lists the options on the CodeWarrior Project Importer — Access Paths
page.
100
Microcontrollers V10.x Targeting Manual
DRAFT
Working with Projects
Tutorials — Importing Connection-Specific Projects
Table 2.16 CodeWarrior Project Importer — Access Paths Page
Option
Description
Build Target List Box
Lets you select the build target whose access
paths you want to modify. For example:
HCS08_TEST
Access Path Table
Lists the access paths used by the build target
selected in the Build Target list box. Each row
lists:
• Path — Directory path. For example:
The path is
{Compiler}\lib\HC08c\include.
• Recursive — Whether the path is
searched recursively. For example:
false or true.
• Type — Type of path to be searched.
For example: user or system.
• Error — Unresolved access paths,
marked as “X”, if any.
You use the Add, Delete, and Clear buttons to
modify the information in this list. Table 2.17 lists
these buttons with their descriptions.
Flatten Recursive Access Paths
Checkbox
Microcontrollers V10.x Targeting Manual
When checked, the CodeWarrior Project
Importer wizard automatically generates separate
include paths for each subdirectory that is a part of
the recursive path. This option is set by default as
most compilers do not support recursive include
paths passed by the command line.
101
DRAFT
Working with Projects
Tutorials — Importing Connection-Specific Projects
Figure 2.78 CodeWarrior Project Importer — Access Paths Page
Table 2.17 CodeWarrior Project Importer — Access Paths Page Buttons
Button
Description
Add
Add a new directory path to the list.
Delete
Deletes the selected directory path from the list.
Clear
Clears the entire list.
18. To add a new directory path to list, perform these steps.
a. Click Add.
(C:\SourcePath) appears in the Path list.
b. Click (C:\SourcePath).
The Edit Table Values dialog box appears.
102
Microcontrollers V10.x Targeting Manual
DRAFT
Working with Projects
Tutorials — Importing Connection-Specific Projects
Figure 2.79 Edit Table Values
c. In the Path text box, enter the directory path. Alternatively, click Browse and use
the Browse For Folder dialog box and navigate to the required source.
d. From the Recursive list box, select false or true.
e. From the Type list box, select user or system.
f. Click OK.
The new access path appears in table.
19. Click Next.
The CodeWarrior Project Importer — Files Not Found page appears. This page
displays the project files that the wizard could not locate. You can use the Build Target
list box to select another build target and view the missing files.
Figure 2.80 CodeWarrior Project Importer — Files Not Found Page
Microcontrollers V10.x Targeting Manual
103
DRAFT
Working with Projects
Tutorials — Importing Connection-Specific Projects
20. To locate the missing files, perform these steps.
a. Click Back to adjust the settings in the Globals and Access Paths pages so that the
wizard can locate the missing files.
b. Repeat till you narrow down the number of missing files.
NOTE
Some old files do not work with the <target> implementation, there will be
some files missing.
21. Click Next.
The CodeWarrior Project Importer - Project Name page appears. This page lets
you specify the name and select a location for the newly imported project.
Figure 2.81 CodeWarrior Project Importer - Project Name Page
22. To specify a name and location to the imported project, perform these steps.
a. Enter a name for the converted Eclipse project, in the New Project Name text box.
By default, the old project name is specified.
b. Check Use default location to save the project to the default Eclipse workspace.
By default, the location of the project is the directory of the classic project and not
the default Eclipse workspace.
104
Microcontrollers V10.x Targeting Manual
DRAFT
Working with Projects
Tutorials — Importing Connection-Specific Projects
TIP
If you want to save the converted project to a location other than the default
Eclipse workspace, click Browse and use the Browse To Folder dialog box to
navigate to the desired directory.
23. Click Finish.
The CodeWarrior Project Importer wizard translates the classic CodeWarrior
project and the new Eclipse project appears in the CodeWarrior Project view of the
Workbench window.
NOTE
Before debugging the new Eclipse project you might need to edit the build and
launch configuration settings. For information on build properties, refer to the
chapter Build Properties for Bareboard Projects.
Tutorial B: Porting Classic RS08 Project
The goal of this tutorial is to import a classic RS08 project to Eclipse.
NOTE
Before starting the process ensure that the CodeWarrior RS08 project you want
to import has all of its files, such as the source, linker command, and settings
file.
To port a classic RS08 project, perform these steps.
1. Select File > Import from the Workbench menu bar.
The Import dialog box appears.
2. Expand the CodeWarrior tree control and select CodeWarrior Project Importer.
Microcontrollers V10.x Targeting Manual
105
DRAFT
Working with Projects
Tutorials — Importing Connection-Specific Projects
Figure 2.82 Import Dialog Box
3. Click Next.
The first page of the CodeWarrior Project Importer wizard appears.
4. Enter the path and name of the classic CodeWarrior project file to import in the
Project file text box. Alternatively, click Browse and use the Select The
CodeWarrior Project File to Import dialog box to select the project file to import. In
this case, assume that the classic CodeWarrior project filename is
rs08_projectimporter_test.mcp.
TIP
106
The project file has an extension of .mcp. Select the .mcp file.
Microcontrollers V10.x Targeting Manual
DRAFT
Working with Projects
Tutorials — Importing Connection-Specific Projects
Figure 2.83 Select The CodeWarrior Project File to Import Dialog Box
The path of the project file to import appears in the Project file text box.
Figure 2.84 Path of CodeWarrior Project File to Import
5. Click Next.
The Options page of the CodeWarrior Project Importer wizard appears.
Microcontrollers V10.x Targeting Manual
107
DRAFT
Working with Projects
Tutorials — Importing Connection-Specific Projects
Figure 2.85 CodeWarrior Project Importer — Options Page
6. Select the build target that uses the RS08 toolchain you want the generated Eclipse
project to use, from the Toolchain Target list box.
NOTE
The toolchain target linker in the classic project defines the project type of the
generated Eclipse project, including toolchain and build settings.
The build targets table displays all the targets discovered in the project file and is used
to generate equivalent Eclipse build configurations.
7. You can import each build target in the classic CodeWarrior project based upon
predefined configurations of the toolchain. For example: The RS08 project in the
example lists these values:
• Imported Project Type = Freescale RS08 Project
• Enabled = true
• CodeWarrior Target Name = <Toolchain Target>
• Eclipse Configuration Name = RS08
108
Microcontrollers V10.x Targeting Manual
DRAFT
Working with Projects
Tutorials — Importing Connection-Specific Projects
TIP
To disable the generation of specific configurations, click a row in the build target
table. In the Edit Table Values dialog box set Enabled to false and click OK.
8. If you want to import sub-projects included in the classic CodeWarrior project, check
the Recursively Import Sub-Projects checkbox.
The CodeWarrior Project Importer wizard imports the sub-projects with the main
project.
NOTE
The CodeWarrior Project Importer wizard will copy only those files that are
displayed in the CodeWarrior’s project window. The wizard will not import a
file if it is not displayed or does not include project information.
9. Click Advanced.
Figure 2.86 CodeWarrior Project Importer — Options Page
The Advanced Options dialog box appears.
Microcontrollers V10.x Targeting Manual
109
DRAFT
Working with Projects
Tutorials — Importing Connection-Specific Projects
Figure 2.87 Advanced Options
WARNING!
Checking the Duplicate files included in the .mcp project under the
new project location in the workspace checkbox may cause build
errors.
10. Check the Duplicate files included in the .mcp project under the new project
location in the workspace checkbox.
11. Click OK to close the dialog box.
12. Click Next.
The Globals page of the CodeWarrior Project Importer wizard appears. This page
lets you edit global settings that can effect how the project's build options are
imported.
Figure 2.88 CodeWarrior Project Importer — Globals Page
110
Microcontrollers V10.x Targeting Manual
DRAFT
Working with Projects
Tutorials — Importing Connection-Specific Projects
Table 2.18 lists the options on the CodeWarrior Project Importer — Globals page.
Table 2.18 CodeWarrior Project Importer — Globals Page Options
Options
Description
Shielded Folder List
Previous versions of the CodeWarrior tools let you conceal
the contents of folders from the IDE's search operations
during a build. This was done by placing special characters in
the directory name. For example, sample code was
concealed in a (CodeWarrior Examples) folder.
The Shielded Folder List table lists these options:
• \(.*\)
• CVS
• .*[ _]Data
You use the Add, Delete, and Clear buttons to modify the
information in this list. Table 2.19 lists these buttons with their
descriptions.
Sources
Specifies the location of the source trees. If an access path is
defined relative to a source tree, the source tree should be
listed in this table. The {Project} source tree is defined
automatically.
The Sources Trees table lists these options:
• Name — Lists the source name. For example:
Compiler.
• Compiler — Lists the path source name. For
example: <CW Install>/
<Microcontrollers_version>.
You use the Add, Delete, and Clear buttons to modify the
information in this list. Table 2.19 lists these buttons with their
descriptions.
Table 2.19 CodeWarrior Project Importer — Globals Page Buttons
Button
Description
Add
Add a new entry to the list.
Delete
Deletes the selected item.
Clear
Clears the entire list.
Microcontrollers V10.x Targeting Manual
111
DRAFT
Working with Projects
Tutorials — Importing Connection-Specific Projects
13. To add a new expression to the Shielded Folder List table, perform these steps.
a. Click Add.
(regular_expression) appears in the shielded folder list.
b. Double-click (regular_expression) and type the required expression.
The new expression appears in shielded folder list.
Figure 2.89 Shielded Folder List
14. To delete an existing expression from the Shielded Folder List table, select the
expression and click Delete.
The selected expression is deleted from the shielded folder list.
15. To remove all the existing expressions from the Shielded Folder List table, click
Clear.
All the expressions are deleted from the shielded folder list.
16. To add a new source to the Source Trees table, perform these steps.
a. Click Add.
SourceName appears in the source trees list.
Figure 2.90 Sources Trees
b. Double-click SourceName.
The Edit Table Values dialog box appears.
112
Microcontrollers V10.x Targeting Manual
DRAFT
Working with Projects
Tutorials — Importing Connection-Specific Projects
Figure 2.91 Edit Table Values
c. In the Name text box, enter the source name.
d. In the Path text box, enter the path of the new source. Alternatively, click Browse
and use the Browse For Folder dialog box and navigate to the required source.
e. Click OK.
The new source appears in Source Trees list.
17. Click Next.
The CodeWarrior Project Importer - Access Paths page appears.
NOTE
Access paths are directory paths the CodeWarrior tools use to search for
libraries, runtime support files, and other object files.
Table 2.20 lists the options on the CodeWarrior Project Importer — Access Paths
page.
Microcontrollers V10.x Targeting Manual
113
DRAFT
Working with Projects
Tutorials — Importing Connection-Specific Projects
Table 2.20 CodeWarrior Project Importer — Access Paths Page
Option
Description
Build Target List Box
Lets you select the build target whose access
paths you want to modify. For example:
RS08_TEST
Access Path Table
Lists the access paths used by the build target
selected in the Build Target list box. Each row
lists:
• Path — Directory path. For example:
The path is
{Compiler}\lib\rs08c\include.
• Recursive — Whether the path is
searched recursively. For example:
false or true.
• Type — Type of path to be searched.
For example: user or system.
• Error — Unresolved access paths,
marked as “X”, if any.
You use the Add, Delete, and Clear buttons to
modify the information in this list. Table 2.21 lists
these buttons with their descriptions.
Flatten Recursive Access Paths
Checkbox
114
When checked, the CodeWarrior Project
Importer wizard automatically generates separate
include paths for each subdirectory that is a part of
the recursive path. This option is set by default as
most compilers do not support recursive include
paths passed by the command line.
Microcontrollers V10.x Targeting Manual
DRAFT
Working with Projects
Tutorials — Importing Connection-Specific Projects
Figure 2.92 CodeWarrior Project Importer — Access Paths Page
Table 2.21 CodeWarrior Project Importer — Access Paths Page Buttons
Button
Description
Add
Add a new directory path to the list.
Delete
Deletes the selected directory path from the list.
Clear
Clears the entire list.
18. To add a new directory path to list, perform these steps.
a. Click Add.
(C:\SourcePath) appears in the Path list.
b. Click (C:\SourcePath).
The Edit Table Values dialog box appears.
Microcontrollers V10.x Targeting Manual
115
DRAFT
Working with Projects
Tutorials — Importing Connection-Specific Projects
Figure 2.93 Edit Table Values
c. In the Path text box, enter the directory path. Alternatively, click Browse and use
the Browse For Folder dialog box and navigate to the required source.
d. From the Recursive list box, select false or true.
e. From the Type list box, select user or system.
f. Click OK.
The new access path appears in table.
19. Click Next.
The CodeWarrior Project Importer — Files Not Found page appears. This page
displays the project files that the wizard could not locate. You can use the Build Target
list box to select another build target and view the missing files.
Figure 2.94 CodeWarrior Project Importer — Files Not Found Page
116
Microcontrollers V10.x Targeting Manual
DRAFT
Working with Projects
Tutorials — Importing Connection-Specific Projects
20. To locate the missing files, peform these steps.
a. Click Back to adjust the settings in the Globals and Access Paths pages so that the
wizard can locate the missing files.
b. Repeat till you narrow down the number of missing files.
NOTE
Some old files do not work with the <target> implementation, there will be
some files missing.
21. Click Next.
The CodeWarrior Project Importer - Project Name page appears. This page lets
you specify the name and select a location for the newly imported project.
Figure 2.95 CodeWarrior Project Importer - Project Name Page
22. To specify a name and location to the imported project, perform these steps.
a. Enter a name for the converted Eclipse project, in the New Project Name text box.
By default, the old project name is specified.
b. Check Use default location to save the project to the default Eclipse workspace.
By default, the location of the project is the directory of the classic project and not
the default Eclipse workspace.
Microcontrollers V10.x Targeting Manual
117
DRAFT
Working with Projects
Tutorials — Importing Connection-Specific Projects
TIP
If you want to save the converted project to a location other than the default
Eclipse workspace, click Browse and use the Browse To Folder dialog box to
navigate to the desired directory.
23. Click Finish.
The CodeWarrior Project Importer wizard translates the classic CodeWarrior
project and the new Eclipse project appears in the CodeWarrior Project view of the
Workbench window.
NOTE
Before debugging the new Eclipse project you might need to edit the build and
launch configuration settings. For information on build properties, refer to the
chapter Build Properties for Bareboard Projects.
Tutorial C: Porting Classic ColdFire V1
Project
The goal of this tutorial is to import a classic ColdFire V1 project to Eclipse.
NOTE
Before starting the process ensure that the ColdFire V1 project you want to
import has all of its files, such as the source, linker command, and settings file.
To port a classic ColdFire V1 project, perform these steps.
1. Select File > Import from the Workbench menu bar.
The Import dialog box appears.
2. Expand the CodeWarrior tree control and select CodeWarrior Project Importer.
118
Microcontrollers V10.x Targeting Manual
DRAFT
Working with Projects
Tutorials — Importing Connection-Specific Projects
Figure 2.96 Import Dialog Box
3. Click Next.
The first page of the CodeWarrior Project Importer wizard appears.
4. Enter the path and name of the classic CodeWarrior project file to import in the
Project file text box. Alternatively, click Browse and use the Select The
CodeWarrior Project File to Import dialog box to select the project file to import. In
this case, assume that the classic CodeWarrior project filename is
cfv1_projectimporter_test.mcp.
TIP
The project file has an extension of .mcp. Select the .mcp file.
Microcontrollers V10.x Targeting Manual
119
DRAFT
Working with Projects
Tutorials — Importing Connection-Specific Projects
Figure 2.97 Select The CodeWarrior Project File to Import Dialog Box
The path of the project file to import appears in the Project file text box.
Figure 2.98 Path of CodeWarrior Project File to Import
5. Click Next.
The Options page of the CodeWarrior Project Importer wizard appears.
120
Microcontrollers V10.x Targeting Manual
DRAFT
Working with Projects
Tutorials — Importing Connection-Specific Projects
Figure 2.99 CodeWarrior Project Importer — Options Page
6. Select the build target that uses the ColdFire toolchain you want the generated Eclipse
project to use, from the Toolchain Target list box.
NOTE
The toolchain target linker in the classic project defines the project type of the
generated Eclipse project, including toolchain and build settings.
The build targets table displays all the targets discovered in the project file and is used
to generate equivalent Eclipse build configurations.
7. You can import each build target in the classic CodeWarrior project based upon
predefined configurations of the toolchain. For example: The ColdFire project in the
example lists these values:
• Imported Project Type = Freescale ColdFire
• Enabled = true
• CodeWarrior Target Name = <Toolchain Target>
• Eclipse Configuration Name = ColdFire
Microcontrollers V10.x Targeting Manual
121
DRAFT
Working with Projects
Tutorials — Importing Connection-Specific Projects
TIP
To disable the generation of specific configurations, click a row in the build target
table. In the Edit Table Values dialog box set Enabled to false and click OK.
8. If you want to import sub-projects included in the classic CodeWarrior project, check
the Recursively Import Sub-Projects checkbox.
The CodeWarrior Project Importer wizard imports the sub-projects with the main
project.
NOTE
The CodeWarrior Project Importer wizard will copy only those files that are
displayed in the CodeWarrior’s project window. The wizard will not import a
file if it is not displayed or does not include project information.
9. Click Advanced.
Figure 2.100 CodeWarrior Project Importer — Options Page
The Advanced Options dialog box appears.
122
Microcontrollers V10.x Targeting Manual
DRAFT
Working with Projects
Tutorials — Importing Connection-Specific Projects
Figure 2.101 Advanced Options
WARNING!
Checking the Duplicate files included in the .mcp project under the
new project location in the workspace checkbox may cause build
errors.
10. Check the Duplicate files included in the .mcp project under the new project
location in the workspace checkbox.
11. Click OK to close the dialog box.
12. Click Next.
The Globals page of the CodeWarrior Project Importer wizard appears. This page
lets you edit global settings that can effect how the project's build options are
imported.
Figure 2.102 CodeWarrior Project Importer — Globals Page
Microcontrollers V10.x Targeting Manual
123
DRAFT
Working with Projects
Tutorials — Importing Connection-Specific Projects
Table 2.22 lists the options on the CodeWarrior Project Importer — Globals page.
Table 2.22 CodeWarrior Project Importer — Globals Page Options
Options
Description
Shielded Folder List
Previous versions of the CodeWarrior tools let you conceal
the contents of folders from the IDE's search operations
during a build. This was done by placing special characters in
the directory name. For example, sample code was
concealed in a (CodeWarrior Examples) folder.
The Shielded Folder List table lists these options:
• \(.*\)
• CVS
• .*[ _]Data
You use the Add, Delete, and Clear buttons to modify the
information in this list. Table 2.23 lists these buttons with their
descriptions.
Sources
Specifies the location of the source trees. If an access path is
defined relative to a source tree, the source tree should be
listed in this table. The {Project} source tree is defined
automatically.
The Sources Trees table lists these options:
• Name — Lists the source name. For example:
Compiler.
• Compiler — Lists the path source name. For
example: <CW Install>/
<Microcontrollers_version>.
You use the Add, Delete, and Clear buttons to modify the
information in this list. Table 2.23 lists these buttons with their
descriptions.
Table 2.23 CodeWarrior Project Importer — Globals Page Buttons
124
Button
Description
Add
Add a new entry to the list.
Delete
Deletes the selected item.
Clear
Clears the entire list.
Microcontrollers V10.x Targeting Manual
DRAFT
Working with Projects
Tutorials — Importing Connection-Specific Projects
13. To add a new expression to the Shielded Folder List table, perform these steps.
a. Click Add.
(regular_expression) appears in the shielded folder list.
b. Double-click (regular_expression) and type the required expression.
The new expression appears in shielded folder list.
Figure 2.103 Shielded Folder List
14. To delete an existing expression from the Shielded Folder List table, select the
expression and click Delete.
The selected expression is deleted from the shielded folder list.
15. To remove all the existing expressions from the Shielded Folder List table, click
Clear.
All the expressions are deleted from the shielded folder list.
16. To add a new source to the Source Trees table, perform these steps.
a. Click Add.
SourceName appears in the source trees list.
Figure 2.104 Sources Trees
b. Double-click SourceName.
The Edit Table Values dialog box appears.
Microcontrollers V10.x Targeting Manual
125
DRAFT
Working with Projects
Tutorials — Importing Connection-Specific Projects
Figure 2.105 Edit Table Values
c. In the Name text box, enter the source name.
d. In the Path text box, enter the path of the new source. Alternatively, click Browse
and use the Browse For Folder dialog box and navigate to the required source.
e. Click OK.
The new source appears in Source Trees list.
17. Click Next.
The CodeWarrior Project Importer - Access Paths page appears.
NOTE
Access paths are directory paths the CodeWarrior tools use to search for
libraries, runtime support files, and other object files.
Table 2.24 lists the options on the CodeWarrior Project Importer — Access Paths
page.
126
Microcontrollers V10.x Targeting Manual
DRAFT
Working with Projects
Tutorials — Importing Connection-Specific Projects
Table 2.24 CodeWarrior Project Importer — Access Paths Page
Option
Description
Build Target List Box
Lets you select the build target whose access
paths you want to modify. For example:
CFV1_TEST
Access Path Table
Lists the access paths used by the build target
selected in the Build Target list box. Each row
lists:
• Path — Directory path. For example:
The path is
{Compiler}\ColdFire_Support\h
cs08_compatibility.
• Recursive — Whether the path is
searched recursively. For example:
false or true.
• Type — Type of path to be searched.
For example: user or system.
• Error — Unresolved access paths,
marked as “X”, if any.
You use the Add, Delete, and Clear buttons to
modify the information in this list. Table 2.25 lists
these buttons with their descriptions.
Flatten Recursive Access Paths
Checkbox
Microcontrollers V10.x Targeting Manual
When checked, the CodeWarrior Project
Importer wizard automatically generates separate
include paths for each subdirectory that is a part of
the recursive path. This option is set by default as
most compilers do not support recursive include
paths passed by the command line.
127
DRAFT
Working with Projects
Tutorials — Importing Connection-Specific Projects
Figure 2.106 CodeWarrior Project Importer — Access Paths Page
Table 2.25 CodeWarrior Project Importer — Access Paths Page Buttons
Button
Description
Add
Add a new directory path to the list.
Delete
Deletes the selected directory path from the list.
Clear
Clears the entire list.
18. To add a new directory path to list, perform these steps.
a. Click Add.
(C:\SourcePath) appears in the Path list.
b. Click (C:\SourcePath).
The Edit Table Values dialog box appears.
128
Microcontrollers V10.x Targeting Manual
DRAFT
Working with Projects
Tutorials — Importing Connection-Specific Projects
Figure 2.107 Edit Table Values
c. In the Path text box, enter the directory path. Alternatively, click Browse and use
the Browse For Folder dialog box and navigate to the required source.
d. From the Recursive list box, select false or true.
e. From the Type list box, select user or system.
f. Click OK.
The new access path appears in table.
19. Click Next.
The CodeWarrior Project Importer — Files Not Found page appears. This page
displays the project files that the wizard could not locate. You can use the Build Target
list box to select another build target and view the missing files.
Figure 2.108 CodeWarrior Project Importer — Files Not Found Page
Microcontrollers V10.x Targeting Manual
129
DRAFT
Working with Projects
Tutorials — Importing Connection-Specific Projects
20. To locate the missing files, peform these steps.
a. Click Back to adjust the settings in the Globals and Access Paths pages so that the
wizard can locate the missing files.
b. Repeat till you narrow down the number of missing files.
NOTE
Some old files do not work with the <target> implementation, there will be
some files missing.
21. Click Next.
The CodeWarrior Project Importer - Project Name page appears. This page lets
you specify the name and select a location for the newly imported project.
Figure 2.109 CodeWarrior Project Importer - Project Name Page
22. To specify a name and location to the imported project, perform these steps.
a. Enter a name for the converted Eclipse project, in the New Project Name text box.
By default, the old project name is specified.
b. Check Use default location to save the project to the default Eclipse workspace.
By default, the location of the project is the directory of the classic project and not
the default Eclipse workspace.
130
Microcontrollers V10.x Targeting Manual
DRAFT
Working with Projects
Tutorials — Importing Connection-Specific Projects
TIP
If you want to save the converted project to a location other than the default
Eclipse workspace, click Browse and use the Browse To Folder dialog box to
navigate to the desired directory.
23. Click Finish.
The CodeWarrior Project Importer wizard translates the classic CodeWarrior
project and the new Eclipse project appears in the CodeWarrior Project view of the
Workbench window.
NOTE
Before debugging the new Eclipse project you might need to edit the build and
launch configuration settings. For information on build properties, refer to the
chapter Build Properties for Bareboard Projects.
Tutorial D: Porting Classic ColdFire V2/3/4
Project
The goal of this tutorial is to import a classic ColdFireV2/3/4 project to Eclipse.
NOTE
Before starting the process ensure that the CodeWarrior V2/3/4 project you
want to import has all of its files, such as the source, linker command, and
settings file.
To port a classic ColdFire V2/3/4 project, perform these steps.
1. Select File > Import from the Workbench menu bar.
The Import dialog box appears.
2. Expand the CodeWarrior tree control and select CodeWarrior Project Importer.
Microcontrollers V10.x Targeting Manual
131
DRAFT
Working with Projects
Tutorials — Importing Connection-Specific Projects
Figure 2.110 Import Dialog Box
3. Click Next.
The first page of the CodeWarrior Project Importer wizard appears.
4. Enter the path and name of the classic CodeWarrior project file to import in the
Project file text box. Alternatively, click Browse and use the Select The
CodeWarrior Project File to Import dialog box to select the project file to import. In
this case, assume that the classic CodeWarrior project filename is
cfv2_projectimporter_test.mcp.
TIP
132
The project file has an extension of .mcp. Select the .mcp file.
Microcontrollers V10.x Targeting Manual
DRAFT
Working with Projects
Tutorials — Importing Connection-Specific Projects
Figure 2.111 Select The CodeWarrior Project File to Import Dialog Box
The path of the project file to import appears in the Project file text box.
Figure 2.112 Path of CodeWarrior Project File to Import
Microcontrollers V10.x Targeting Manual
133
DRAFT
Working with Projects
Tutorials — Importing Connection-Specific Projects
5. Click Next.
The Options page of the CodeWarrior Project Importer wizard appears.
Figure 2.113 CodeWarrior Project Importer — Options Page
6. Select the build target that uses the ColdFire toolchain you want the generated Eclipse
project to use, from the Toolchain Target list box.
NOTE
The toolchain target linker in the classic project defines the project type of the
generated Eclipse project, including toolchain and build settings.
The build targets table displays all the targets discovered in the project file and is used
to generate equivalent Eclipse build configurations.
7. You can import each build target in the classic CodeWarrior project based upon
predefined configurations of the toolchain. For example: The ColdFire project in the
example lists these values:
• Imported Project Type = Freescale ColdFire
• Enabled = true
• CodeWarrior Target Name = <Toolchain Targets>
• Eclipse Configuration Name = ColdFire
134
Microcontrollers V10.x Targeting Manual
DRAFT
Working with Projects
Tutorials — Importing Connection-Specific Projects
TIP
To disable the generation of specific configurations, click a row in the build target
table. In the Edit Table Values dialog box set Enabled to false and click OK.
8. If you want to import sub-projects included in the classic CodeWarrior project, check
the Recursively Import Sub-Projects checkbox.
The CodeWarrior Project Importer wizard imports the sub-projects with the main
project.
NOTE
The CodeWarrior Project Importer wizard will copy only those files that are
displayed in the CodeWarrior’s project window. The wizard will not import a
file if it is not displayed or does not include project information.
9. Click Advanced.
Figure 2.114 CodeWarrior Project Importer — Options Page
The Advanced Options dialog box appears.
Microcontrollers V10.x Targeting Manual
135
DRAFT
Working with Projects
Tutorials — Importing Connection-Specific Projects
Figure 2.115 Advanced Options
WARNING!
Checking the Duplicate files included in the .mcp project under the
new project location in the workspace checkbox may cause build
errors.
10. Check the Duplicate files included in the .mcp project under the new project
location in the workspace checkbox.
11. Click OK to close the dialog box.
12. Click Next.
The Globals page of the CodeWarrior Project Importer wizard appears. This page
lets you edit global settings that can effect how the project's build options are
imported.
Figure 2.116 CodeWarrior Project Importer — Globals Page
136
Microcontrollers V10.x Targeting Manual
DRAFT
Working with Projects
Tutorials — Importing Connection-Specific Projects
Table 2.26 lists the options on the CodeWarrior Project Importer — Globals page.
To add a new expression to the Shielded Folder List table, perform these steps.
Table 2.26 CodeWarrior Project Importer — Globals Page Options
Options
Description
Shielded Folder List
Previous versions of the CodeWarrior tools let you conceal
the contents of folders from the IDE's search operations
during a build. This was done by placing special characters in
the directory name. For example, sample code was
concealed in a (CodeWarrior Examples) folder.
The Shielded Folder List table lists these options:
• \(.*\)
• CVS
• .*[ _]Data
You use the Add, Delete, and Clear buttons to modify the
information in this list. Table 2.27 lists these buttons with their
descriptions.
Sources
Specifies the location of the source trees. If an access path is
defined relative to a source tree, the source tree should be
listed in this table. The {Project} source tree is defined
automatically.
The Sources Trees table lists these options:
• Name — Lists the source name. For example:
Compiler.
• Compiler — Lists the path source name. For
example: <CW Install>/
<Microcontrollers_version>.
You use the Add, Delete, and Clear buttons to modify the
information in this list. Table 2.27 lists these buttons with their
descriptions.
Table 2.27 CodeWarrior Project Importer — Globals Page Buttons
Button
Description
Add
Add a new entry to the list.
Delete
Deletes the selected item.
Clear
Clears the entire list.
Microcontrollers V10.x Targeting Manual
137
DRAFT
Working with Projects
Tutorials — Importing Connection-Specific Projects
a. Click Add.
(regular_expression) appears in the shielded folder list.
b. Double-click (regular_expression) and type the required expression.
The new expression appears in shielded folder list.
Figure 2.117 Shielded Folder List
13. To delete an existing expression from the Shielded Folder List table, select the
expression and click Delete.
The selected expression is deleted from the shielded folder list.
14. To remove all the existing expressions from the Shielded Folder List table, click
Clear.
All the expressions are deleted from the shielded folder list.
15. To add a new source to the Source Trees table, perform these steps.
a. Click Add.
SourceName appears in the source trees list.
Figure 2.118 Sources Trees
b. Double-click SourceName.
The Edit Table Values dialog box appears.
138
Microcontrollers V10.x Targeting Manual
DRAFT
Working with Projects
Tutorials — Importing Connection-Specific Projects
Figure 2.119 Edit Table Values
c. In the Name text box, enter the source name.
d. In the Path text box, enter the path of the new source. Alternatively, click Browse
and use the Browse For Folder dialog box and navigate to the required source.
e. Click OK.
The new source appears in Source Trees list.
16. Click Next.
The CodeWarrior Project Importer - Access Paths page appears.
NOTE
Access paths are directory paths the CodeWarrior tools use to search for
libraries, runtime support files, and other object files.
Table 2.28 lists the options on the CodeWarrior Project Importer — Access Paths
page.
Microcontrollers V10.x Targeting Manual
139
DRAFT
Working with Projects
Tutorials — Importing Connection-Specific Projects
Table 2.28 CodeWarrior Project Importer — Access Paths Page
Option
Description
Build Target List Box
Lets you select the build target whose access
paths you want to modify. For example:
CONSOLE_EXTERNAL_RAM.
Access Path Table
Lists the access paths used by the build target
selected in the Build Target list box. Each row
lists:
• Path — Directory path. For example:
The path is
{Compiler}\ColdFire_Support\e
wl.
• Recursive — Whether the path is
searched recursively. For example:
false or true.
• Type — Type of path to be searched.
For example: user or system.
• Error — Unresolved access paths,
marked as “X”, if any.
You use the Add, Delete, and Clear buttons to
modify the information in this list. Table 2.29 lists
these buttons with their descriptions.
Flatten Recursive Access Paths
Checkbox
140
When checked, the CodeWarrior Project
Importer wizard automatically generates separate
include paths for each subdirectory that is a part of
the recursive path. This option is set by default as
most compilers do not support recursive include
paths passed by the command line.
Microcontrollers V10.x Targeting Manual
DRAFT
Working with Projects
Tutorials — Importing Connection-Specific Projects
Figure 2.120 CodeWarrior Project Importer — Access Paths Page
Table 2.29 CodeWarrior Project Importer — Access Paths Page Buttons
Button
Description
Add
Add a new directory path to the list.
Delete
Deletes the selected directory path from the list.
Clear
Clears the entire list.
17. To add a new directory path to list, perform these steps.
a. Click Add.
(C:\SourcePath) appears in the Path list.
b. Click (C:\SourcePath).
The Edit Table Values dialog box appears.
Microcontrollers V10.x Targeting Manual
141
DRAFT
Working with Projects
Tutorials — Importing Connection-Specific Projects
Figure 2.121 Edit Table Values
c. In the Path text box, enter the directory path. Alternatively, click Browse and use
the Browse For Folder dialog box and navigate to the required source.
d. From the Recursive list box, select false or true.
e. From the Type list box, select user or system.
f. Click OK.
The new access path appears in table.
18. Click Next.
The CodeWarrior Project Importer — Files Not Found page appears. This page
displays the project files that the wizard could not locate. You can use the Build Target
list box to select another build target and view the missing files.
Figure 2.122 CodeWarrior Project Importer — Files Not Found Page
142
Microcontrollers V10.x Targeting Manual
DRAFT
Working with Projects
Tutorials — Importing Connection-Specific Projects
19. To locate the missing files, peform these steps.
a. Click Back to adjust the settings in the Globals and Access Paths pages so that the
wizard can locate the missing files.
b. Repeat till you narrow down the number of missing files.
NOTE
Some old files do not work with the <target> implementation, there will be
some files missing.
20. Click Next.
The CodeWarrior Project Importer - Project Name page appears. This page lets
you specify the name and select a location for the newly imported project.
Figure 2.123 CodeWarrior Project Importer - Project Name Page
21. To specify a name and location to the imported project, perform these steps.
a. Enter a name for the converted Eclipse project, in the New Project Name text box.
By default, the old project name is specified.
b. Check Use default location to save the project to the default Eclipse workspace.
By default, the location of the project is the directory of the classic project and not
the default Eclipse workspace.
Microcontrollers V10.x Targeting Manual
143
DRAFT
Working with Projects
Tutorials — Importing Connection-Specific Projects
TIP
If you want to save the converted project to a location other than the default
Eclipse workspace, click Browse and use the Browse To Folder dialog box to
navigate to the desired directory.
22. Click Finish.
The CodeWarrior Project Importer wizard translates the classic CodeWarrior
project and the new Eclipse project appears in the CodeWarrior Project view of the
Workbench window.
NOTE
144
Before debugging the new Eclipse project you might need to edit the build and
launch configuration settings. For information on build properties, refer to the
chapter Build Properties for Bareboard Projects.
Microcontrollers V10.x Targeting Manual
DRAFT
3
Build Properties for
Bareboard Projects
This chapter explains build properties for Microcontrollers project. The Microcontrollers
New Bareboard Project wizard uses the information it gathers from you to set up the
project’s build and launch configurations.
A project’s build configuration contains information on the tool settings used to make the
program. For example, it describes the compiler and linker settings, and the files involved,
such as source and libraries.
A project’s launch configuration describes how the IDE starts the program, such as
whether it executes by itself on a target, or under debugger control. Launch configurations
also specify the core the program executes on (if the target processor has multiple
cores).They also specify the connection interface and communications protocol that the
debugger uses to control the environment that the program executes in.
NOTE
The settings of the CodeWarrior IDE’s build and launch configuration
correspond to an object called a target made by the classic CodeWarrior IDE.
When the wizard completes its process, it generates launch configurations with names that
follow the pattern projectname - configtype - targettype, where:
• projectname represents the name of the project
• configtype represents the project’s name, which usually describes the build
configuration
• targettype represents the type of target software or hardware on which the launch
configuration acts
For each launch configuration, you can specify build properties, such as:
• additional libraries to use for building code
• behavior of the compilers, linkers, assemblers, and other build-related tools
• specific build properties, such as the byte ordering of the generated code
The topics in this chapter are:
• Changing Build Properties
• Restoring Build Properties
Microcontrollers V10.x Targeting Manual
145
DRAFT
Build Properties for Bareboard Projects
Changing Build Properties
• Build Properties for HCS08
• Build Properties for RS08
• Build Properties for ColdFire
Changing Build Properties
The Microcontrollers New Bareboard Project wizard creates a set of build properties for
the project. You can modify these build properties to better suit your needs.
Perform these steps to change build properties:
1. Start the IDE.
2. In the CodeWarrior Projects view, select the project for which you want to modify
the build properties.
3. Select Project > Properties.
The Properties window appears. The left side of this window has a properties list.
This list shows the build properties that apply to the current project.
4. Expand the C/C++ Build property.
5. Select Settings.
The Properties window shows the corresponding build properties as in Figure 3.1.
146
Microcontrollers V10.x Targeting Manual
DRAFT
Build Properties for Bareboard Projects
Restoring Build Properties
Figure 3.1 Properties for <Project> Window
6. Use the Configuration drop-down list to specify the launch configuration for which
you want to modify the build properties.
7. Click the Tool Settings tab.
The corresponding page appears.
8. From the list of tools on the Tool Settings page, select the tool for which you want to
modify properties.
9. Change the settings that appear in the page.
10. Click Apply.
The IDE saves your new settings.
You can select other tool pages and modify their settings. When you finish, click OK to
save your changes and close the Properties window.
Restoring Build Properties
If you modify a build configuration that the CodeWarrior wizard generates, you can
restore that configuration to its default state. You might want to restore the build
properties in order to have a factory-default configuration, or to revert to a last-known
Microcontrollers V10.x Targeting Manual
147
DRAFT
Build Properties for Bareboard Projects
Build Properties for HCS08
working build configuration. To undo your modifications to build properties, click the
Restore Defaults button at the bottom of the Properties window.
This changes the values of the options to the absolute default of the toolchain. By default,
the toolchain options are blank.
For example, when a HCS08 project is created the Linker > Input panel has some values
set for the Parameter File and Libraries options, which are specific to the project.
Clicking the Restore Defaults button defaults the values of the Parameter File and
Libraries options to the blank state of the toolchain .
Build Properties for HCS08
The Properties for <project> window shows the corresponding build properties for an
HCS08 project (Figure 3.2).
Figure 3.2 Build Properties - HCS08
Table 3.1 lists the build properties specific to developing software for HCS08.
The properties that you specify in these panels apply to the selected build tool on the Tool
Settings page of the Properties for <project> window.
148
Microcontrollers V10.x Targeting Manual
DRAFT
Build Properties for Bareboard Projects
Build Properties for HCS08
Table 3.1 Build Properties for HCS08
Build Tool
Build Properties Panels
Messages
Messages
General
General
Disassembler
Disassembler > Output
Linker
Linker > Input
Linker > Optimization
Linker > Output
Linker > General
Burner
Burner > General
HCS08 Compiler
HCS08 Compiler > Preprocessor
HCS08 Compiler > Input
HCS08 Compiler > Language
HCS08 Compiler > Type Sizes
HCS08 Compiler > Code Generation
HCS08 Compiler > Optimization
HCS08 Compiler > Output
HCS08 Compiler > General
HCS08 Assembler
HCS08 Assembler > Input
HCS08 Assembler > Language
HCS08 Assembler > Output
HCS08 Assembler > General
Messages
Use this panel to specify whether to generate symbolic information for debugging the
build target (Figure 3.3).
Microcontrollers V10.x Targeting Manual
149
DRAFT
Build Properties for Bareboard Projects
Build Properties for HCS08
Figure 3.3 Tool Settings - Messages
Table 3.2 lists and describes the message options.
Table 3.2 Tool Settings - Messages Options
Option
Description
Maximum number of error messages (WmsgNe)
Specify the number of errors allowed until
the application stops processing.
Maximum number of information
messages (-WmsgNi)
Specify the maximum number of information
messages allowed.
Maximum number of warning messages
(-WmsgNw)
Specify the maximum number of warnings
allowed.
Disable user messages (-WmsgNu)
Check to disable user messages and allow
only the normal message categories
(WARNING, INFORMATION, ERROR, or
FATAL); reduces the number of messages,
and simplifies the error parsing of other tools.
Other Flags
Specify additional command line options;
type in custom flags that are not otherwise
available in the UI.
Default value is -WmsgFob"%%f%%e:%%l:
%%k: %%m\n"
150
Microcontrollers V10.x Targeting Manual
DRAFT
Build Properties for Bareboard Projects
Build Properties for HCS08
General
Use this panel to specify the memory model that the architecture uses. The build tools
(compiler, linker, and assembler) use the properties that you specify.
Figure 3.4 shows the General settings.
Figure 3.4 Tool Settings - General
Table 3.3 lists and describes the memory model options for HCS08.
Microcontrollers V10.x Targeting Manual
151
DRAFT
Build Properties for Bareboard Projects
Build Properties for HCS08
Table 3.3 Tool Settings - General
Option
Description
Memory Model (-M)
Specify the memory model for the build tools:
• Tiny — Assumes that data
pointers have 8-bit addresses
unless explicitly specified with the
keyword __far
• Small — Default memory model;
assumes that all functions and
pointers have 16 bit addresses
and requires code and data to be
located in 64 kilobytes address
space
• Banked — Lets you place
program code into atmost 256
pages of 16 kilobytes each, but
does not affect data allocation
Enable Memory Management Unit
(MMU) Support (-MMU)
Check to inform the compiler that CALL and
RTC instructions are available, enabling code
banking, and that the current architecture
has extended data access capabilities,
enabling support for __linear data types.
This option can be used only when -Cs08 is
enabled.
Disassembler
Use this panel to specify the command, options, and expert settings for HCS08
Disassembler.
Figure 3.5 shows the Disassembler page.
152
Microcontrollers V10.x Targeting Manual
DRAFT
Build Properties for Bareboard Projects
Build Properties for HCS08
Figure 3.5 Tool Settings > Disassembler
Table 3.4 lists and describes the Disassembler options.
Table 3.4 Tool Settings - Disassembler Options
Option
Description
Command
Shows the location of the disassembler
executable file; default is ${HC08Tools}/
decoder.
All options
Shows the actual command line the linker
will be called with.
Expert Settings
Shows the expert settings command line
parameters; default is ${COMMAND}
${FLAGS} O${OUTPUT_PREFIX}${OUTPUT}
${INPUTS}
Command line pattern
Disassembler > Output
Use this panel to control how the disassembler generates the output file.
Figure 3.6 shows the Output panel.
Microcontrollers V10.x Targeting Manual
153
DRAFT
Build Properties for Bareboard Projects
Build Properties for HCS08
Figure 3.6 Tool Settings - Disassembler > Output
Table 3.5 lists and describes the output options for HCS08 disassembler.
Table 3.5 Tool Settings - Disassembler > Output Options
154
Option
Description
Print full listing
Prints a listing with the header information of the object file.
Write disassembly
listing with source
code
Check to enable the decoder decoding Freescale object files
write the source code within the disassembly listing.
Decode DWARF
section
Check to write the DWARF section information in the listing file.
Decoding from the DWARF section inserts this information in the
listing file. See the following listings for more information.
Configure which
parts of DWARF in
formation to
decode
Check to configure parts of DWARF in formation to decode.
Decode ELF
sections
Check to ensure that the ELF section information is also written to
the listing file. Decoding from the ELF section inserts the following
information in the listing file.
This option setting is default for the Freescale object files as
input.
Microcontrollers V10.x Targeting Manual
DRAFT
Build Properties for Bareboard Projects
Build Properties for HCS08
Table 3.5 Tool Settings - Disassembler > Output Options (continued)
Option
Description
Dump ELF
sections
Check to generate a HEX dump of all ELF sections.
Dump ELF
sections in LST file
Check to generate a HEX dump of all ELF sections in a LST file.
Produce inline
assembly file
Check to ensure that the output listing is an inline assembly file
without additional information, but in C comments.
No symbols in
disassembled
listing
Check to prevent symbols from printing in the disassembled
listing.
Shows the cycle
count for each
instruction
Check to ensure that each instruction line contains the count of
cycles in '[',']' braces. The cycle count is written before the
mnemonics of the instruction. Note that the cycle count display is
not supported for all architectures.
Write disassembly
listing only
Check to ensure that the Decoder decoding Freescale object files
writes the source code within the disassembly listing only.
Write disassembly
listing with source
and all comments
Check to write the origin source and its comments within the
disassembly listing.
Linker
Use this panel to specify the command, options, and expert settings for the build tool
linker. Additionally, the Linker tree control includes the general, libraries, and search path
settings.
Figure 3.7 shows the Linker settings.
Microcontrollers V10.x Targeting Manual
155
DRAFT
Build Properties for Bareboard Projects
Build Properties for HCS08
Figure 3.7 Tool Settings - Linker
Table 3.6 lists and describes the linker options for HCS08.
Table 3.6 Tool Settings - Linker Options
Option
Description
Command
Shows the location of the linker executable
file.
Default value is "${HC08Tools}/
linker.exe"
All options
Shows the actual command line the linker
will be called with.
Expert Settings
Shows the expert settings command line
parameters; default is ${COMMAND}
${FLAGS}
${OUTPUT_FLAG}${OUTPUT_PREFIX}${O
UTPUT} -add( ${INPUTS} )
Command line pattern
Linker > Input
Use this panel to specify the parameter file path, startup function, object file search paths,
and any additional libraries that the C/C++ Linker should use. You can specify multiple
additional libraries and library search paths. Also, you can change the order in which the
IDE uses or searches the libraries.
156
Microcontrollers V10.x Targeting Manual
DRAFT
Build Properties for Bareboard Projects
Build Properties for HCS08
The IDE first looks for an include file in the current directory, or the directory that you
specify in the INCLUDE directive. If the IDE does not find the file, it continues searching
the paths shown in this panel. The IDE keeps searching paths until it finds the #include
file or finishes searching the last path at the bottom of the Include File Search Paths list.
The IDE appends to each path the string that you specify in the INCLUDE directive.
NOTE
The IDE displays an error message if a header file is in a different directory
from the referencing source file. Sometimes, the IDE also displays an error
message if a header file is in the same directory as the referencing source file.
For example, if you see the message Could not open source file myfile.h,
you must add the path for myfile.h to this panel.
Figure 3.8 shows the Input panel.
Figure 3.8 Tool Settings - Linker > Input
Table 3.7 lists and describes the linker input options for HCS08.
Microcontrollers V10.x Targeting Manual
157
DRAFT
Build Properties for Bareboard Projects
Build Properties for HCS08
Table 3.7 Tool Settings - Linker > Input Options
Option
Description
Parameter File
Shows the path of the parameter file. Default
value is ${ProjDirPath}/
Project_Settings/Linker_Files/
Project.prm.
Specify startup function (-E)
Specify the path of command-line tool to
preprocess source files.
Search paths (-L)
Shows the list of all search paths; the ELF
part of the linker searches object files first in
all paths and then the usual environment
variables are considered.
Libraries
Lists paths to additional libraries that the C/
C++ linker uses. Default value is
"${MCUToolsBaseDir}/lib/hc08c/
lib/ansiis.lib"
Table 3.8 lists and describes the toolbar buttons that help work with the libraries and the
additional object file search paths.
Table 3.8 Search Paths Toolbar Buttons
Button
Description
Add — Click to open the Add directory
path dialog box (Figure 3.9) and specify the
object file search path.
Delete — Click to delete the selected object
file search path. To confirm deletion, click
Yes in the Confirm Delete dialog box.
Edit — Click to open the Edit directory
path dialog box (Figure 3.10) and update
the selected object file search path.
158
Microcontrollers V10.x Targeting Manual
DRAFT
Build Properties for Bareboard Projects
Build Properties for HCS08
Table 3.8 Search Paths Toolbar Buttons (continued)
Button
Description
Move up — Click to move the selected
object file search path one position higher in
the list.
Move down — Click to move the selected
object file search path one position lower in
the list.
Figure 3.9 shows the Add directory path dialog box.
Figure 3.9 Add directory path Dialog Box
Figure 3.10 shows the Edit directory path dialog box.
Figure 3.10 Edit directory path Dialog Box
The buttons in the Add directory path and Edit directory path dialog boxes help work
with the object file search paths.
• OK — Click to confirm the action and exit the dialog box.
• Cancel — Click to cancel the action and exit the dialog box.
• Workspace — Click to display the Folder Selection dialog box and specify the
object file search path. The resulting path, relative to the workspace, appears in the
appropriate list.
• File system — Click to display the Browse for Folder dialog box and specify the
object file search path. The resulting path appears in the appropriate list.
Microcontrollers V10.x Targeting Manual
159
DRAFT
Build Properties for Bareboard Projects
Build Properties for HCS08
Table 3.9 lists and describes the toolbar buttons that help work with the libraries and the
additional object files.
Table 3.9 Libraries Toolbar Buttons
Button
Description
Add — Click to open the Add file path
dialog box (Figure 3.11) and specify
location of the library you want to add.
Delete — Click to delete the selected library
path. To confirm deletion, click Yes in the
Confirm Delete dialog box.
Edit — Click to open the Edit file path
dialog box (Figure 3.12) and update the
selected path.
Move up — Click to move the selected path
one position higher in the list.
Move down — Click to move the selected
path one position lower in the list.
Figure 3.11 shows the Add file path dialog box.
Figure 3.11 Tool Settings - Linker > Libraries - Add file path Dialog Box
Figure 3.12 shows the Edit file path dialog box.
160
Microcontrollers V10.x Targeting Manual
DRAFT
Build Properties for Bareboard Projects
Build Properties for HCS08
Figure 3.12 Tool Settings - Linker > Libraries - Edit file path Dialog Box
The buttons in the Add file path and Edit file path dialog boxes help work with the file
paths.
• OK — Click to confirm the action and exit the dialog box.
• Cancel — Click to cancel the action and exit the dialog box.
• Workspace — Click to display the File Selection dialog box and specify the file
path. The resulting path, relative to the workspace, appears in the appropriate list.
• File system — Click to display the Open dialog box and specify the file path. The
resulting absolute path appears in the appropriate list.
Linker > Optimization
Use this panel to control linker optimizations. The linker’s optimizer can apply any of its
optimizations in either global or non-global optimization mode. You can apply global
optimization at the end of the development cycle, after compiling and optimizing all
source files individually or in groups.
Figure 3.13 shows the Optimization panel.
Microcontrollers V10.x Targeting Manual
161
DRAFT
Build Properties for Bareboard Projects
Build Properties for HCS08
Figure 3.13 Tool Settings - Linker > Optimization
Table 3.10 lists and describes the linker optimization options for HCS08.
162
Microcontrollers V10.x Targeting Manual
DRAFT
Build Properties for Bareboard Projects
Build Properties for HCS08
Table 3.10 Tool Settings - Linker > Optimization Options
Option
Description
Allocation over
segment
boundaries (-Alloc)
The linker supports to allocate objects from one ELF section into
different segments. The allocation strategy controls where space
for the next object is allocated as soon as the first segment is full.
In the AllocNext strategy, the linker always takes the next
segment as soon as the current segment is full. Holes generated
during this process are not used later. With this strategy, the
allocation order corresponds to the definition order in the object
files. Objects defined first in a source file are allocated before
later defined objects.
In the AllocFirst strategy, the linker checks for every object, if
there is a previously only partially used segment, into which the
current object does fit. This strategy does not maintain the
definition order.
In the AllocChange strategy, the linker checks as soon as a object
does no longer fit into the current segment, if there is a previously
only partially used segment, into which the current object does fit.
This strategy does not maintain the definition order, but it does
however use fewer different ranges than the AllocFirst case.
Overlap constants
in ROM (-COCC)
Defines the default if constants and code should be optimized;
commands DO_OVERLAP_CONSTS and
DO_NOT_OVERLAP_CONSTS take precedence over the option.
Optimize copy
down (-OCopy)
Changes the copy down structure to use few spaces.
The optimization does assume that the application does perform
both the zero out and the copy down step of the global
initialization. If a value is set to zero by the zero out, then zero
values are removed from the copy down information. The
resulting initialization is not changed by this optimization if the
default startup code is used.
Linker > Output
Use this panel to control how the linker formats the listing file, as well as error and
warning messages. Figure 3.14 shows the Output panel.
Microcontrollers V10.x Targeting Manual
163
DRAFT
Build Properties for Bareboard Projects
Build Properties for HCS08
Figure 3.14 Tool Settings - Linker > Output
Table 3.11 lists and describes the linker output options for HCS08.
Table 3.11 Tool Settings - Linker > Output Options
164
Option
Description
Link as ROM
library (-AsROMlib)
Check to link the application as a ROM library. This option has
the same effect as specifying AS ROM_LIB in the linker
parameter file.
Generate S_record
file (-B)
Check to specify that in addition to an absolute file, also an
srecord file should be generated. The name of the srecord file is
the same as the name of the abs file, except that the extension
"SX" is used. The default.env variable "SRECORD" may specify
an alternative extension.
Check if objects
overlap in the
absolute file (even
if different address
spaces) (CheckAcrossAddr
Space)
Check to instruct the linker to check if objects overlap, taking into
account their address space.
Generate map file
(-M)
Check to scan source files for dependencies and emit a Makefile,
without generating object code.
Microcontrollers V10.x Targeting Manual
DRAFT
Build Properties for Bareboard Projects
Build Properties for HCS08
Table 3.11 Tool Settings - Linker > Output Options (continued)
Option
Description
Strip symbolic
information (-S)
Check to disable the generation of DWARF sections in the
absolute file to save memory space.
Generate fixups in
abs file (-SFixups)
Check to ensure compatibility with previous linker versions.
Usually, absolute files do not contain any fixups because all
fixups are evaluated at link time. But with fixups, the decoder
might symbolically decode the content in absolute files. Some
debuggers do not load absolute files which contain fixups
because they assume that these fixups are not yet evaluated. But
the fixups inserted with this option are actually already handled by
this linker.
Specify statistic file
(e.g. statistic.txt) (StatF)
Specify the name of the linker statistic file. The statistic file reports
each allocated object and its attributes. Every attribute is
separated by a tab character, so it can be easily imported into a
spreadsheet/database program for further processing.
Linker > General
Use this panel to specify the general linker behavior.
Figure 3.15 shows the General panel.
Figure 3.15 Tool Settings - Linker > General
Microcontrollers V10.x Targeting Manual
165
DRAFT
Build Properties for Bareboard Projects
Build Properties for HCS08
Table 3.12 lists and describes the general linker options for HCS08.
Table 3.12 Tool Settings - Linker > General Options
Option
Description
Other flags
Specify additional command line options for the linker; type in
custom flags that are not otherwise available in the UI.
Default value is: -WmsgSd1100 -WmsgSd1912
Burner
Use the Burner for HCS08 Preference Panel to map *.bbl (batch burner language) files to
the Burner Plug-In. When the project folder contains a *.bbl file, *.bbl file processing
during the post-link phase uses the settings in the Burner preference panel.
Figure 3.16 shows the HCS08 Burner settings.
Figure 3.16 Tool Settings > Burner
Table 3.15 lists and describes the burner options for HCS08.
166
Microcontrollers V10.x Targeting Manual
DRAFT
Build Properties for Bareboard Projects
Build Properties for HCS08
Table 3.13 Tool Settings - Burner Options
Option
Description
Command
Shows the location of the linker executable
file.
Default value is:"${HC08Tools}/burner"
All options
Shows the actual command line the burner
will be called with.
Expert Settings
Shows the expert settings command line
parameters; default is ${COMMAND}
${FLAGS} ${INPUTS}.
Command line pattern
Burner > General
Use this panel to specify other flags for the HCS08 Burner to use.
Figure 3.17 shows the General panel.
Figure 3.17 Tool Settings - Burner > General
Microcontrollers V10.x Targeting Manual
167
DRAFT
Build Properties for Bareboard Projects
Build Properties for HCS08
Table 3.14 lists and describes the general options for HCS08 burner.
Table 3.14 Tool Settings - Burner > General Options
Option
Description
Other flags
Specify additional command line options for
the burner; type in custom flags that are not
otherwise available in the UI.
HCS08 Compiler
Use this panel to specify the command, options, and expert settings for the build tool
compiler. Additionally, the HCS08 Compiler tree control includes the general, include file
search path settings.
Figure 3.18 shows the HCS08 Compiler settings.
Figure 3.18 Tool Settings - HCS08 Compiler
Table 3.15 lists and describes the compiler options for HCS08.
168
Microcontrollers V10.x Targeting Manual
DRAFT
Build Properties for Bareboard Projects
Build Properties for HCS08
Table 3.15 Tool Settings - Compiler Options
Option
Description
Command
Shows the location of the linker executable
file.
Default value is:"${HC08Tools}/
chc08.exe"
All options
Shows the actual command line the compiler
will be called with.
Expert Settings
Shows the expert settings command line
parameters; default is ${COMMAND}
${FLAGS}${OUTPUT_FLAG}${OUTPUT_PR
EFIX}${OUTPUT} ${INPUTS}.
Command line pattern
HCS08 Compiler > Preprocessor
Use this panel to specify preprocessor behavior. You can specify the file paths and define
macros. Figure 3.19 shows the Preprocessor panel.
Figure 3.19 Tool Settings - HCS08 Compiler > Preprocessor
Table 3.16 lists and describes the preprocessor options for HCS08 Compiler.
Microcontrollers V10.x Targeting Manual
169
DRAFT
Build Properties for Bareboard Projects
Build Properties for HCS08
Table 3.16 Tool Settings - HCS08 Compiler > Preprocessor Option
Option
Description
Define preprocessor macros (-D)
Define, delete, or rearrange preprocessor
macros. You can specify multiple macros
and change the order in which the IDE uses
the macros.
Define preprocessor macros and optionally
assign their values. This setting is equivalent
to specifying the -D name[=value]
command-line option. To assign a value, use
the equal sign (=) with no white space.
For example, this syntax defines a
preprocessor value named
EXTENDED_FEATURE and assigns ON as its
value:
EXTENDED_FEATURE=ON
Note: If you do not assign a value to the
macro, the shell assigns a default value of 1.
Table 3.17 lists and describes the toolbar buttons that help work with preprocessor macro
definitions.
Table 3.17 Define Preprocessor Macros Toolbar Buttons
Button
Description
Add — Click to open the Enter Value
dialog box (Figure 3.20) and specify the
path/macro.
Delete — Click to delete the selected path/
macro. To confirm deletion, click Yes in the
Confirm Delete dialog box.
Edit — Click to open the Edit Dialog dialog
box (Figure 3.21) and update the selected
path/macro.
170
Microcontrollers V10.x Targeting Manual
DRAFT
Build Properties for Bareboard Projects
Build Properties for HCS08
Table 3.17 Define Preprocessor Macros Toolbar Buttons (continued)
Button
Description
Move up — Click to move the selected path/
macro one position higher in the list.
Move down — Click to move the selected
path/macro one position lower in the list.
Figure 3.11 shows the Enter Value dialog box.
Figure 3.20 Tool Settings - HCS08 Compiler > Preprocessor - Enter Value Dialog Box
Figure 3.12 shows the Edit Dialog dialog box.
Figure 3.21 Tool Settings - HCS08 Compiler > Preprocessor - Edit Dialog Dialog Box
The buttons in the Enter Value and Edit dialog boxes help work with the preprocessor
macros.
• OK — Click to confirm the action and exit the dialog box.
• Cancel — Click to cancel the action and exit the dialog box.
HCS08 Compiler > Input
Use this panel to specify file search paths and any additional include files the HCS08
Compiler should use. You can specify multiple search paths and the order in which you
want to perform the search.
Microcontrollers V10.x Targeting Manual
171
DRAFT
Build Properties for Bareboard Projects
Build Properties for HCS08
The IDE first looks for an include file in the current directory, or the directory that you
specify in the INCLUDE directive. If the IDE does not find the file, it continues searching
the paths shown in this panel. The IDE keeps searching paths until it finds the #include
file or finishes searching the last path at the bottom of the Include File Search Paths list.
The IDE appends to each path the string that you specify in the INCLUDE directive.
NOTE
The IDE displays an error message if a header file is in a different directory
from the referencing source file. Sometimes, the IDE also displays an error
message if a header file is in the same directory as the referencing source file.
For example, if you see the message Could not open source file myfile.h,
you must add the path for myfile.h to this panel.
Figure 3.22 shows the Input panel.
Figure 3.22 Tool Settings - HCS08 Compiler > Input
Table 3.18 lists and describes the input options for HCS08 Compiler.
172
Microcontrollers V10.x Targeting Manual
DRAFT
Build Properties for Bareboard Projects
Build Properties for HCS08
Table 3.18 Tool Settings - HCS08 Compiler > Input Options
Option
Description
Include File Path (-I)
Specify, delete, or rearrange file search
paths.
Additional Include Files (-AddInd)
Specify, delete, or rearrange paths to search
any additional #include files.
Include files only once (-Pio)
Check to include every header file only once;
duplicates are ignored.
Table 3.19 lists and describes the toolbar buttons that help work with the file paths.
Table 3.19 Include File Path (-I) Toolbar Buttons
Button
Description
Add — Click to open the Add directory
path dialog box (Figure 3.9) and specify
location of the library you want to add.
Delete — Click to delete the selected library
path. To confirm deletion, click Yes in the
Confirm Delete dialog box.
Edit — Click to open the Edit directory
path dialog box (Figure 3.10) and update
the selected path.
Move up — Click to move the selected path
one position higher in the list.
Move down — Click to move the selected
path one position lower in the list.
Table 3.20 lists and describes the toolbar buttons that help work with the search paths.
Microcontrollers V10.x Targeting Manual
173
DRAFT
Build Properties for Bareboard Projects
Build Properties for HCS08
Table 3.20 Additional Include Files (-AddIncl) Toolbar Buttons
Button
Description
Add — Click to open the Add directory
path dialog box (Figure 3.23) and specify
location of the library you want to add.
Delete — Click to delete the selected library
path. To confirm deletion, click Yes in the
Confirm Delete dialog box.
Edit — Click to open the Edit directory
path dialog box (Figure 3.24) and update
the selected path.
Move up — Click to move the selected path
one position higher in the list.
Move down — Click to move the selected
path one position lower in the list.
Figure 3.23 Tool Settings - HCS08 Compiler > Input - Add file path Dialog Box
Figure 3.24 Tool Settings - HCS08 Compiler > Input - Edit file path Dialog Box
The buttons in the Add file path (Figure 3.23) and Edit file path (Figure 3.24) dialog
boxes help work with the paths.
174
Microcontrollers V10.x Targeting Manual
DRAFT
Build Properties for Bareboard Projects
Build Properties for HCS08
• OK — Click to confirm the action and exit the dialog box.
• Cancel — Click to cancel the action and exit the dialog box.
• Workspace — Click to display the File Selection dialog box and specify the path.
The resulting path, relative to the workspace, appears in the appropriate list.
• File system — Click to display the Open dialog box and specify the path. The
resulting path appears in the appropriate list.
HCS08 Compiler > Language
Use this panel to specify code- and symbol-generation options for the HCS08 Compiler.
Figure 3.25 shows the Language panel.
Figure 3.25 Tool Settings - HCS08 Compiler > Language
Table 3.21 lists and describes the language options for HCS08.
Microcontrollers V10.x Targeting Manual
175
DRAFT
Build Properties for Bareboard Projects
Build Properties for HCS08
Table 3.21 Tool Settings - HCS08 Compiler > Language Options
Option
Description
Strict ANSI
Check if you want the C compiler to operate
in strict ANSI mode. In this mode, the
compiler strictly applies the rules of the
ANSI/ISO specification to all input files. This
setting is equivalent to specifying the ansi command-line option. The compiler
issues a warning for each ANSI/ISO
extension it finds.
C++
With this option enabled, the Compiler
behaves as a C++ Compiler. You can select
between three different types of C++:
• Full C++ (-C++f) — Supports the
whole C++ language.
• Embedded C++ (-C++e) —
Supports a constant subset of the
C++ language. EC++ does not
support inefficient things like
templates, multiple inheritance,
virtual base classes and exception
handling.
• CompactC++ (-C++c) —
Supports a configurable subset of
the C++ language. You can
configure this subset with the
option -Cn.
• No C++ — If the option is not set,
the Compiler behaves as an ANSIC Compiler.
If the option is enabled and the source file
name extension is *.c, the Compiler behaves
as a C++ Compiler.
If the option is not set, but the source
filename extension is .cpp or .cxx, the
Compiler behaves as if the -C++f option
were set.
176
Microcontrollers V10.x Targeting Manual
DRAFT
Build Properties for Bareboard Projects
Build Properties for HCS08
Table 3.21 Tool Settings - HCS08 Compiler > Language Options (continued)
Option
Description
Cosmic compatibility mode for space
modifiers @near, @far, and @tiny (Ccx)
Check to allow Cosmic style @near, @far
and @tiny space modifiers as well as
@interrupt in your C code. The -ANSI option
must be switched off. It is not necessary to
remove the Cosmic space modifiers from
your application code. There is no need to
place the objects to sections addressable by
the Cosmic space modifiers.
The following is done when a Cosmic
modifier is parsed:
The objects declared with the space modifier
are always allocated in a special Cosmic
compatibility (_CX) section (regardless of
which section pragma is set) depending on
the space modifier, on the const qualifier or if
it is a function or a variable.
Space modifiers on the left hand side of a
pointer declaration specify the pointer type
and pointer size, depending on the target.
Bigraph and trigraph support (-Ci)
Check to replace certain unavailable tokens
with the equivalent keywords.
C++ comments in ANSI-C (-Cppc)
Check to allow C++ comments.
Propagate const and colatile qualifiers
for structs (-Cq)
Check to propagate const and volatile
qualifiers for structures. If all members of a
structure are constant or volatile, the
structure itself is constant or volatile. If the
structure is declared as constant or volatile,
all its members are constant or volatile,
respectively.
Conversion from ‘const T*’ to ‘T*’ (-Ec)
Check to enable this non-ANSI compliant
extension allows the compiler to treat a
pointer to a constant type like a pointer to the
non-constant equivalent of the type. Earlier
Compilers did not check a store to a constant
object through a pointer. This option is useful
when compiling older source code.
Microcontrollers V10.x Targeting Manual
177
DRAFT
Build Properties for Bareboard Projects
Build Properties for HCS08
HCS08 Compiler > Type Sizes
Use this panel to specify the available data type size options for the HCS08 Compiler.
Figure 3.25 shows the Type Sizes panel.
Figure 3.26 Tool Settings - HCS08 Compiler > Type Sizes
Table 3.22 lists and describes the possible type size options for HCS08 Compiler using the
-T option.
178
Microcontrollers V10.x Targeting Manual
DRAFT
Build Properties for Bareboard Projects
Build Properties for HCS08
Table 3.22 Tool Settings - HCS08 Compiler > Type Sizes
Option
Description
char
Selects the size of the char type. Options
are:
• Default (unsigned 8bit)
• unsigned 8bit (-TuCC1)
• signed 8bit (-TsCC1)
• signed 16bit (-TsCC2)
• signed 32bit (-TsCC4)
short
Selects the size of the short type. Options
are:
• Default (16bit)
• signed 8bit (-TS1)
• signed 16bit (-TS2)
• signed 32bit (-TS4)
int
Selects the size of the int type. Options are:
• Default (16bit)
• signed 8bit (-TI1)
• signed 16bit (-TI2)
• signed 32bit (-TI4)
long
Selects the size of the long type. Options
are:
• Default (32bit)
• signed 8bit (-TL1)
• signed 16bit (-TL2)
• signed 32bit (-TL4)
long long
Selects the size of the long long type.
Options are:
• Default (32bit)
• signed 8bit (-TLL1)
• signed 16bit (-TLL2)
• signed 32bit (-TLL4)
Microcontrollers V10.x Targeting Manual
179
DRAFT
Build Properties for Bareboard Projects
Build Properties for HCS08
Table 3.22 Tool Settings - HCS08 Compiler > Type Sizes (continued)
Option
Description
enum
Selects the size of the enum type. Options
are:
• Default (signed 16bit)
• signed 8bit (-TE1sE)
• signed 16bit (-TE2sE)
• signed 32bit (-TE4sE)
• unsigned 8bit (-TE1uE)
float
Selects the size of the float type. Options
are:
• Default (IEEE32)
• IEEE32
• IEEE64
double
Selects the size of the double type. Options
are:
• Default (IEEE64)
• IEEE32
• IEEE64
long double
Selects the size of the long double type.
Options are:
• Default (IEEE64)
• IEEE32
• IEEE64
long long double
Selects the size of the long long double
type. Options are:
• Default (IEEE64)
• IEEE32
• IEEE64
HCS08 Compiler > Code Generation
Use this panel to specify code- and symbol-generation options for the HCS08 Compiler
Figure 3.27 shows the Code Generation panel.
180
Microcontrollers V10.x Targeting Manual
DRAFT
Build Properties for Bareboard Projects
Build Properties for HCS08
Figure 3.27 Tool Settings - HCS08 Compiler > Code Generation
Table 3.23 lists and describes the code generation options for HCS08 compiler.
Table 3.23 Tool Settings - HCS08 Compiler > Code Generation Options
Option
Description
Bit field gap limits (-BfaGapLimitBits)
Check to affect the maximum allowable
number of gap bits. The bitfield allocation
tries to avoid crossing a byte boundary
whenever possible. To optimize accesses,
the compiler may insert some padding or gap
bits.
Bit field type size reduction
This option is configurable whether or not the
compiler uses type-size reduction for
bitfields. Type-size reduction means that the
compiler can reduce the type of an int bitfield
to a char bitfield if it fits into a character. This
allows the compiler to allocate memory only
for one byte instead of for an integer. Options
are:
• Enabled (-BfaTSRON)
• Disabled (-BfaTSROFF)
Microcontrollers V10.x Targeting Manual
181
DRAFT
Build Properties for Bareboard Projects
Build Properties for HCS08
Table 3.23 Tool Settings - HCS08 Compiler > Code Generation Options (continued)
Option
Description
Maximum load factor for switch tables (100) (-CswMaxLF)
Allows changing the default strategy of the
Compiler to use tables for switch statements;
is only available if the compiler supports
switch tables.
Minimum number of labels for switch
tables (-CswMinLB)
Allows changing the default strategy of the
Compiler using tables for switch statements;
is only available if the compiler supports
switch tables.
Minimum load factor for switch tables
(100) (-CswMinLF)
Allows the Compiler to use tables for switch
statements; is only available if the compiler
supports switch tables.
Qualifier for virtual table pointers (-Qvtp)
Using a virtual function in C++ requires an
additional pointer to virtual function tables.
The Compiler cannot access the pointer and
generates the pointer in every class object
when virtual function tables are associated.
Options are:
• None
• Near
• Far
Use IEEE32 for double (default is
IEEE64)
Check to use doubles that are in IEEE32
instead of IEEE64 (default).
Assume HLI code saves modified
registers
With this option set, the compiler assumes
that registers touched in HLI are saved or
restored in the HLI code as well. If this option
is not set, the compiler saves or restores the
H, X, and A registers.
HCS08 Compiler > Optimization
Use this panel to control compiler optimizations. The compiler’s optimizer can apply any
of its optimizations in either global or non-global optimization mode. You can apply
global optimization at the end of the development cycle, after compiling and optimizing
all source files individually or in groups.
Figure 3.28 shows the Optimization panel.
182
Microcontrollers V10.x Targeting Manual
DRAFT
Build Properties for Bareboard Projects
Build Properties for HCS08
Figure 3.28 Tool Settings - HCS08 Compiler > Optimization
Table 3.24 lists and describes the optimization options for HCS08 compiler.
Table 3.24 Tool Settings - HCS08 Compiler > Optimization Options
Option
Description
Disable optimization (-O0)
Disables all optimizations.
No integral promotion on characters (Cni)
Enhances character operation code density
by omitting integral promotion. This option
enables behavior that is not ANSI-C
compliant.
Code generated with this option set does not
conform to ANSI standards. Code compiled
with this option is not portable. Using this
option is not recommended in most cases.
Microcontrollers V10.x Targeting Manual
183
DRAFT
Build Properties for Bareboard Projects
Build Properties for HCS08
Table 3.24 Tool Settings - HCS08 Compiler > Optimization Options (continued)
Option
Description
Loop unrolling (i[number]) (-Cu)
Enables loop unrolling with the following
restrictions:
• Only simple for statements are
unrolled, e.g., for (i=0; i<10; i++)
• Initialization and test of the loop
counter must be done with a
constant.
• Only <, >, <=, >= are permitted in a
condition.
• Only ++ or -- are allowed for the
loop variable increment or
decrement.
• The loop counter must be integral.
• No change of the loop counter is
allowed within the loop.
• The loop counter must not be used
on the left side of an assignment.
• No address operator (&) is allowed
on the loop counter within the loop.
• Only small loops are unrolled:
Loops with few statements within
the loop.
Loops with fewer than 16
increments or decrements of the
loop counter.
The bound may be changed with
the optional argument =
i<number>.
The -Cu=i20 option unrolls loops
with a maximum of 20 iterations.
184
Microcontrollers V10.x Targeting Manual
DRAFT
Build Properties for Bareboard Projects
Build Properties for HCS08
Table 3.24 Tool Settings - HCS08 Compiler > Optimization Options (continued)
Option
Description
Main Optimize Target: Optimize for
There are various points where the Compiler
has to select between two possibilities: it can
either generate fast, but large code, or small
but slower code.
The Compiler generally optimizes on code
size. It often has to decide between a
runtime routine or an expanded code. The
programmer can decide whether to select
between the slower and shorter or the faster
and longer code sequence by setting a
command line switch.
• The Code Size (-Os) option
directs the Compiler to optimize
the code for smaller code size.
The Compiler trades faster-larger
code for slower-smaller code.
• The Execution Time (-Ot) option
directs the Compiler to optimize
the code for faster execution time.
The Compiler replaces slower/
smaller code with faster/larger
code. This option only affects
some special code sequences.
This option has to be set together
with other optimization options
(e.g., register optimization) to get
best results.
Create sub-functions with common
code
Performs the reverse of inlining. It detects
common code parts in the generated code.
The Compiler moves the common code to a
different place and replaces all occurrences
with a JSR to the moved code. At the end of
the common code, the Compiler inserts an
RTS instruction. The Compiler increases all
SP uses by an address size. This
optimization takes care of stack allocation,
control flow, and of functions having
arguments on the stack.
Inline assembler code is never treated as
common code. Options are:
• Default
• Disable (-Onf)
• Off (-Of)
Microcontrollers V10.x Targeting Manual
185
DRAFT
Build Properties for Bareboard Projects
Build Properties for HCS08
Table 3.24 Tool Settings - HCS08 Compiler > Optimization Options (continued)
Option
Description
Dynamic options configuration for
functions (-OdocF)
Allows the Compiler to select from a set of
options to reach the smallest code size for
every function. Without this feature, you must
set fixed Compiler switches over the whole
compilation unit. With this feature, the
Compiler finds the best option combination
from a user-defined set for every function.
Inlining (C[n] or OFF) (-Oi)
Enables inline expansion. If there is a
#pragma INLINE before a function definition,
all calls of this function are replaced by the
code of this function, if possible.
Using the -Oi=c0 option switches off inlining.
Functions marked with the #pragma INLINE
are still inlined. To disable inlining, use the Oi=OFF option.
Optimize library function (-OiLib)
Enables the compiler to optimize specific
known library functions to reduce execution
time. The Compiler frequently uses small
functions such as strcpy(), strcmp(), and so
forth.
Disable alias checking (-Ona)
Prevents the Compiler from redefining these
variables, which lets you reuse alreadyloaded variables or equivalent constants.
Use this option only when you are sure no
real writes of aliases to a variable memory
location will occur.
Disable branch optimizer (-OnB)
Disables all branch optimizations.
Do generate copy down information for
zero values (-OnCopyDown)
Using this option, the compiler does not
generate a copy down for i.
The initialization with zero optimization
shown for the arr array only works in the
HIWARE format. The ELF format requires
initializing the whole array to zero.
Disable CONST variable by constant
replacement (-OnCstVar)
186
Lets you switch OFF the replacement of
CONST variable by the constant value.
Microcontrollers V10.x Targeting Manual
DRAFT
Build Properties for Bareboard Projects
Build Properties for HCS08
Table 3.24 Tool Settings - HCS08 Compiler > Optimization Options (continued)
Option
Description
Disable peephole optimization (-OnP)
Disables the whole peephole optimizer. To
disable only a single peephole optimization,
use the optional syntax -OnP=<char>.
Disable code generation for NULL
Pointer to Member check (-OnPMNC)
Before assigning a pointer to a member in
C++, you must ensure that the pointer to the
member is not NULL in order to generate
correct and safe code. In embedded systems
development, the difficulty becomes
generating the denser code while avoiding
overhead whenever possible (this NULL
check code is a good example). This option
enables you to switch off the code
generation for the NULL check.
Disable tree optimizer (-Ont)
Disables the tree optimizer. Use this option
for debugging and to force the Compiler to
produce 'straightforward' code. Note that the
optimizations below are just examples for the
classes of optimizations.
Large return value type
Compiler supports this option even though
returning a 'large' return value may be not as
efficient as using an additional pointer. The
Compiler introduces an additional parameter
for the return value if the return value cannot
be passed in registers. Options are:
• Default
• Large return value pointer,
always with temporary (-Rpt)
• Large return value pointer and
temporary elimination (-Rpe)
Optimize bitfields and volatile bitfields
Microcontrollers V10.x Targeting Manual
Use this option to optimize bitfields and
volatile bitfields. The compiler changes the
access order or combines many accesses
into one, even if the bitfields are declared as
volatile.
187
DRAFT
Build Properties for Bareboard Projects
Build Properties for HCS08
Table 3.24 Tool Settings - HCS08 Compiler > Optimization Options (continued)
188
Option
Description
Keep loop induction variables in
registers
Limits the number of loop induction variables
the Compiler keeps in registers. Specify any
number down to zero (no loop induction
variables). The compiler reads and writes
loop induction variables within the loop (e.g.,
loop counter), and attempts to keep the
variables in registers to reduce execution
time and code size. The Compiler takes the
optimal number (code density) when this
option is not specified. Specifying a high
number of loop induction variables may
increase code size, particularly for spill and
merge code.
Disable optimize bitfields
Prevents the Compiler from combining
sequences of bitfield assignments containing
constants. This simplifies debugging and
makes the code more readable.
Disable ICG level branch tail merging
Switches the ICG level branch tail merging
off. This simplifies debugging and produces
more readable code.
Disable any constant folding
Prevents the Compiler from folding constants
over statement boundaries. All arithmetical
operations are coded. This option must be
set when using the library functions setjmp()
and longjmp(), or the Compiler makes wrong
assumptions.
Disable any constant folding in the case
of a new constant
Prevents the Compiler from folding constants
when the resulting constant is new. The
option affects only those processors where
constants are difficult to load (e.g., RISC
processors). On other processors this option
makes no change.
Microcontrollers V10.x Targeting Manual
DRAFT
Build Properties for Bareboard Projects
Build Properties for HCS08
Table 3.24 Tool Settings - HCS08 Compiler > Optimization Options (continued)
Option
Description
Disable any low level common
subexpression elimination
Prevents the Compiler from reusing common
subexpressions, such as array indexes and
array base addresses. The code size may
increase. The low-level CSE does not have
the alias problems of the frontend CSE and
is therefore switched on by default.
The two CSE optimizations do not cover the
same cases. The low-level CSE has a finer
granularity but does not handle all cases of
the frontend CSE.
Use this option only to generate more
readable code for debugging.
Allocate local variables into registers
Allocates local variables (char or int) in
registers. The number of local variables
allocated in registers depends on the number
of available registers. Use this option when
using variables as loop counters or switch
selectors or when the processor requires
register operands for multiple operations
(e.g., RISC processors). Compiling with this
option may increase your code size (spill and
merge code).
This optimization may increase code
complexity when using High-Level
Languages, making debugging more difficult.
Microcontrollers V10.x Targeting Manual
189
DRAFT
Build Properties for Bareboard Projects
Build Properties for HCS08
Table 3.24 Tool Settings - HCS08 Compiler > Optimization Options (continued)
Option
Description
Optimize dead assignments
Optimizes dead assignments. The Compiler
removes assignments to unused local
variables.
There are three possible settings for this
option:
• Always, even if HLI present in
function: Always optimize dead
assignments (even if HLI is
present in current function). The
Compiler does not consider inline
assembler accesses.
Note: This option is unsafe when inline
assembler code contains accesses to local
variables.
• Yes, but never if HLI present in
function: No optimization occurs.
This generates the best possible
debug information, and produces
larger and slower code.
• Never: Optimize dead
assignments if HLI is not present
in the current function.
Disable frame pointer optimization (OnX)
Prevents the Compiler from converting stack
pointer-relative accesses into X-relative
accesses. The frame optimizer tries to
convert all SP-relative accesses (local
variables, spills) into shorter and faster Xrelative accesses. In addition, the Compiler
traces the value of H:X and removes useless
TSX and AIX instructions. Using -OnX to
switch the frame optimizer off facilitates
debugging.
HCS08 Compiler > Output
Use this panel to control how the compiler generates the output file, as well as error and
warning messages. You can specify whether to allocate constant objects in ROM, generate
debugging information, and strip file path information.
Figure 3.29 shows the Output panel.
190
Microcontrollers V10.x Targeting Manual
DRAFT
Build Properties for Bareboard Projects
Build Properties for HCS08
Figure 3.29 Tool Settings - HCS08 Compiler > Output
Table 3.25 lists and describes the output options for HCS08 compiler.
Table 3.25 Tool Settings - HCS08 Compiler > Output Options
Option
Description
Allocate CONST objects in ROM (-Cc)
Check if you want the compiler to assign
const objects into the ROM_VAR segment,
which the Linker parameter file assigns to a
ROM section.
Encrypt Files (e.g. %f.e%e) (-Eencrypt)
Encrypts all files passed together with this
option, using the given key with the -Ekey:
Encryption Key option.
Encryption key (-EKey)
Encrypts files with the given key number (Eencrypt option).
Microcontrollers V10.x Targeting Manual
191
DRAFT
Build Properties for Bareboard Projects
Build Properties for HCS08
Table 3.25 Tool Settings - HCS08 Compiler > Output Options (continued)
Option
Description
General Assembler Include File (e.g.
%f.inc) (-La)
Enables the Compiler to generate an
assembler include file when the
CREATE_ASM_LISTING pragma occurs.
This option specifies the name of the created
file. If no name is specified, the compiler
takes a default of %f.inc. To put the file into
the directory specified by the TEXTPATH:
Text File Path environment variable, use the
option "-la=%n.inc". The %f option already
contains the path of the source file. When %f
is used, the compiler puts the generated file
in the same directory as the source file.
The content of all modifiers refers to the main
input file and not to the actual header file.
The main input file is the one specified on the
command line.
Generate Listing File (e.g. %n.lst) (Lasm)
Enables the Compiler to generate an
assembler listing file directly. The Compiler
also prints all assembler-generated
instructions to this file. The option specifies
the name of the file. If no name is specified,
the Compiler takes a default of %n.lst. If the
resulting filename contains no path
information the Compiler uses the
TEXTPATH: Text File Path environment
variable.
The syntax does not always conform with the
inline assembler or the assembler syntax.
Therefore, use this option only to review the
generated code. It cannot currently be used
to generate a file for assembly.
Log predefined defines to file (e.g.
predef.h) (-Ldf)
192
Enables the Compiler to generate a text file
that contains a list of the compiler-defined
#define. The default filename is predef.h, but
may be changed (e.g., -Ldf="myfile.h"). The
file is generated in the directory specified by
the TEXTPATH: Text File Path environment
variable. The defines written to this file
depend on the actual Compiler option
settings (e.g., type size settings or ANSI
compliance).
Microcontrollers V10.x Targeting Manual
DRAFT
Build Properties for Bareboard Projects
Build Properties for HCS08
Table 3.25 Tool Settings - HCS08 Compiler > Output Options (continued)
Option
Description
List of included files to ‘.inc’ file (-Li)
Enables the Compiler to generate a text file
which contains a list of the #include files
specified in the source. This text file shares
the same name as the source file but with
the extension, *.inc. The Compiler stores the
file in the path specified by the TEXTPATH:
Text File Path environment variable. The
generated file may be used in make files.
Write statistic output to file (e.g.
logfile.txt) (-Ll)
Enables the Compiler to append statistical
information about the compilation session to
the specified file. The information includes
Compiler options, code size (in bytes), stack
usage (in bytes) and compilation time (in
seconds) for each procedure of the compiled
file. The Compiler appends the information to
the specified filename (or the file make.txt, if
no argument given). Set the TEXTPATH:
Text File Path environment variable to store
the file into the path specified by the
environment variable. Otherwise the
Compiler stores the file in the current
directory.
Strip path information
Check to enable the compiler remove both
unreferenced path reference from your
program. Enabling this option reduces your
program's memory footprint.
HCS08 Compiler > General
Use this panel to specify other flags for the HCS08 Compiler to use.
Figure 3.30 shows the General panel.
Microcontrollers V10.x Targeting Manual
193
DRAFT
Build Properties for Bareboard Projects
Build Properties for HCS08
Figure 3.30 Tool Settings - HCS08 Compiler > General
Table 3.26 lists and describes the general options for HCS08 compiler.
Table 3.26 Tool Settings - HCS08 Compiler > General Options
Option
Description
Other flags
Specify additional command line options for
the compiler; type in custom flags that are
not otherwise available in the UI.
HCS08 Assembler
Use this panel to specify the command, options, and expert settings for the build tool
assembler.
Figure 3.31 shows the Assembler settings.
194
Microcontrollers V10.x Targeting Manual
DRAFT
Build Properties for Bareboard Projects
Build Properties for HCS08
Figure 3.31 Tool Settings - Assembler
Table 3.27 lists and describes the assembler options for HCS08.
Table 3.27 Tool Settings - Assembler Options
Option
Description
Command
Shows the location of the assembler
executable file.
All options
Shows the actual command line the
assembler will be called with.
Expert Settings
Shows the expert settings command line
parameters; default is ${COMMAND}
Command line pattern
Microcontrollers V10.x Targeting Manual
${FLAGS}Objn${OUTPUT_PREFIX}${OUTPUT}
${INPUTS}.
195
DRAFT
Build Properties for Bareboard Projects
Build Properties for HCS08
HCS08 Assembler > Input
Use this panel to specify file search paths and any additional include files the HCS08
Assembler should use. You can specify multiple search paths and the order in which you
want to perform the search.
Figure 3.22 shows the Input panel.
Figure 3.32 Tool Settings - HCS08 Assembler > Input
Table 3.28 lists and describes the toolbar buttons that help work with the file search paths.
Table 3.28 Search Paths Toolbar Buttons
Button
Description
Add — Click to open the Add directory
path dialog box (Figure 3.9) and specify the
file search path.
Delete — Click to delete the selected file
search path. To confirm deletion, click Yes
in the Confirm Delete dialog box.
196
Microcontrollers V10.x Targeting Manual
DRAFT
Build Properties for Bareboard Projects
Build Properties for HCS08
Table 3.28 Search Paths Toolbar Buttons (continued)
Button
Description
Edit — Click to open the Edit directory
path dialog box (Figure 3.10) and update
the selected object file search path.
Move up — Click to move the selected file
search path one position higher in the list.
Move down — Click to move the selected
file search path one position lower in the
list.
HCS08 Assembler > Language
Use this panel to specify code- and symbol-generation options for the HCS08 Compiler.
Figure 3.33 shows the Language panel.
Figure 3.33 Tool Settings - HCS08 Assembler > Language
Microcontrollers V10.x Targeting Manual
197
DRAFT
Build Properties for Bareboard Projects
Build Properties for HCS08
Table 3.29 lists and describes the language options for HCS08 Assembler.
.
Table 3.29 Tool Settings - HCS08 Assembler > Language Options
Option
Description
Case insensitivity
on label name (-Ci)
Turns off case sensitivity on label names. When this option is
activated, the Assembler ignores case sensitivity for label names.
If the Assembler generates object files but not absolute files
directly (-FA2 assembler option), the case of exported or imported
labels must still match. Or, the -Ci assembler option should be
specified in the linker as well.
Define label ( use
spaces to separate
labels ) (-D)
Lets you define labels and assign them values. The labels are
used for conditional compilation, where a common source file can
be used to generate code for different processor derivatives,
based on the labels supplied here.
Support for
structured types (Struct)
Enables the Macro Assembler support the definition and usage of
structured types. This is interesting for application containing both
ANSI-C and Assembly modules.
Angle brackets for
macro arguments
grouping (CMacAngBrack)
Controls whether the < > syntax for macro invocation argument
grouping is available. When it is disabled, the Assembler does not
recognize the special meaning for < in the macro invocation
context. There are cases where the angle brackets are
ambiguous. In new code, use the [? ?] syntax instead.
Options are:
• Allow
• Disallow
Square braces for
macro arguments
grouping (CMacBrackets)
Controls the availability of the [? ?] syntax for macro invocation
argument grouping. When it is disabled, the Assembler does not
recognize the special meaning for [? in the macro invocation
context.
Options are:
• Allow
• Disallow
198
Microcontrollers V10.x Targeting Manual
DRAFT
Build Properties for Bareboard Projects
Build Properties for HCS08
Table 3.29 Tool Settings - HCS08 Assembler > Language Options (continued)
Option
Description
Compatibitlity
modes (-Compat)
Controls some compatibility enhancements of the Assembler.
The goal is not to provide 100% compatibility with any other
Assembler but to make it possible to reuse as much as possible.
The various suboptions control different parts of the assembly.
Maximum
MacroNest nesting
(-MacroNest)
Controls how deep macros calls can be nested. Its main purpose
is to avoid endless recursive macro invocations.
HCS08 Assembler > Output
Use this panel to control how the assembler generates the output file, as well as error and
warning messages. You can specify whether to allocate constant objects in ROM, generate
debugging information, and strip file path information.
Figure 3.34 shows the Output panel.
Figure 3.34 Tool Settings - HCS08 Assembler > Output
Microcontrollers V10.x Targeting Manual
199
DRAFT
Build Properties for Bareboard Projects
Build Properties for HCS08
Table 3.30 lists and describes the output options for HCS08 Assembler.
Table 3.30 Tool Settings - HCS08 Assembler > Output Options
Option
Description
Object File Format
(-F)
Defines the format for the output file generated by the Assembler.
Show label
statistics (-Ll)
Enables the Compiler to append statistical information about the
compilation session to the specified file. The information includes
Compiler options, code size (in bytes), stack usage (in bytes) and
compilation time (in seconds) for each procedure of the compiled
file. The Compiler appends the information to the specified
filename (or the file make.txt, if no argument given). Set the
TEXTPATH: Text File Path environment variable to store the file
into the path specified by the environment variable. Otherwise the
Compiler stores the file in the current directory.
Generate listing file
( for example,
%(TEXTPATH)/
%n.lst ) (-L)
Specifies the name, %n, of the assembly listing file. The file is
placed in the directory specified by %TEXTPATH. If this option is
left blank, no listing file is output.
Address size in the
listing file (-Lasms)
Specifies the size of the addresses displayed in the listing.
Options are:
• 1 to display addresses as xx
• 2 to display addresses as xxxx
• 3 to display addresses as xxxxxx
• 4 to display addresses asf xxxxxxxx
200
Do not print macro
call in listing file (Lc)
Specifies whether macro calls encountered in the source code
are expanded and appear in the listing file.
Do not print macro
definition in listing
file (-Ld)
Instructs the Assembler to generate a listing file but not including
any macro definitions. The listing file contains macro invocation
and expansion lines as well as expanded include files.
Do not print macro
expansion in listing
file (-Le)
Switches on the generation of the listing file, but macro
expansions are not present in the listing file. The listing file
contains macro definition and invocation lines as well as
expanded include files.
Microcontrollers V10.x Targeting Manual
DRAFT
Build Properties for Bareboard Projects
Build Properties for HCS08
Table 3.30 Tool Settings - HCS08 Assembler > Output Options (continued)
Option
Description
Do not print
included files in
listing file (-Li)
Switches on the generation of the listing file, but include files are
not expanded in the listing file. The listing file contains macro
definition, invocation, and expansion lines.
Associate debug
information to
assembly source
file (-AsmDbg)
Enables the Assembler to produce debugging information for the
generated files and associate the debug information to the
assembly source file.
HCS08 Assembler > General
Use this panel to specify the general assembler behavior.
Figure 3.35 shows the General panel.
Figure 3.35 Tool Settings - HCS08 Assembler > General
Table 3.31 lists and describes the general assembler options for HCS08.
Microcontrollers V10.x Targeting Manual
201
DRAFT
Build Properties for Bareboard Projects
Build Properties for RS08
Table 3.31 Tool Settings - Assembler > General Options
Option
Description
MMU Support (MMU)
Check to inform the compiler that CALL and RTC instructions are
available, enabling code banking, and that the current
architecture has extended data access capabilities, enabling
support for __linear data types. This option can be used only
when -Cs08 is enabled.
MCUasm
compatibility (MCUasm)
Check to activate the compatibility mode with the MCUasm
Assembler.
Other Flags
Specify additional command line options for the assembler; type
in custom flags that are not otherwise available in the UI.
Build Properties for RS08
The Properties for <project> window shows the corresponding build properties for an
RS08 project (Figure 3.36).
Figure 3.36 Build Properties - RS08
202
Microcontrollers V10.x Targeting Manual
DRAFT
Build Properties for Bareboard Projects
Build Properties for RS08
Table 3.32 lists the build properties specific to developing software for HCS08.
The properties that you specify in these panels apply to the selected build tool on the Tool
Settings page of the Properties for <project> window.
Table 3.32 Build Properties for RS08
Build Tool
Build Properties Panels
Messages
Messages
General
General
Disassembler
Disassembler > Output
Linker
Linker > Input
Linker > Optimization
Linker > Output
Linker > General
Burner
Burner > General
RS08 Compiler
RS08 Compiler > Preprocessor
RS08 Compiler > Input
RS08 Compiler > Language
RS08 Compiler > Type Sizes
RS08 Compiler > Code Generation
RS08 Compiler > Optimization
RS08 Compiler > Output
RS08 Compiler > General
RS08 Assembler
RS08 Assembler > Input
RS08 Assembler > Language
RS08 Assembler > Output
RS08 Assembler > General
Microcontrollers V10.x Targeting Manual
203
DRAFT
Build Properties for Bareboard Projects
Build Properties for RS08
Messages
Use this panel to specify whether to generate symbolic information for debugging the
build target
Figure 3.37 shows the Messages panel.
Figure 3.37 Tool Settings - Messages
Table 3.33 lists and describes the message options.
Table 3.33 Tool Settings - Messages Options
204
Option
Description
Maximum number of error
messages (-WmsgNe)
Specify the number of errors allowed until the
application stops processing
Maximum number of information
messages (-WmsgNi)
Limits the number of information messages that
the Compiler logs.
Maximum number of warning
messages (-WmsgNw)
Specify the maximum number of warnings
allowed.
Microcontrollers V10.x Targeting Manual
DRAFT
Build Properties for Bareboard Projects
Build Properties for RS08
Table 3.33 Tool Settings - Messages Options (continued)
Option
Description
Disable user messages (-WmsgNu)
The application produces some messages which
are not in the normal message categories
(WARNING, INFORMATION, ERROR, or
FATAL). With this option such messages can be
disabled. The purpose for this option is to reduce
the amount of messages and to simplify the error
parsing of other tools.
Other Flags
Specify additional command line options; type in
custom flags that are not otherwise available in
the UI. Default value is: WmsgFob"%%f%%e:%%l: %%k: %%m\n
General
Use this panel to specify the memory model that the architecture uses. The build tools
(compiler, linker, and assembler) use the properties that you specify.
Figure 3.38 shows the General panel.
Figure 3.38 Tool Settings - General
Table 3.34 lists and describes the memory model options for RS08.
Microcontrollers V10.x Targeting Manual
205
DRAFT
Build Properties for Bareboard Projects
Build Properties for RS08
Table 3.34 Tool Settings - General
Option
Description
Memory Model (-M)
Specify the memory model for the build tools:
• Tiny — Assumes that data
pointers have 8-bit addresses
unless explicitly specified with the
keyword __far
• Small — Default memory model;
assumes that all functions and
pointers have 16 bit addresses
and requires code and data to be
located in 64 kilobytes address
space
• Banked — Lets you place
program code into atmost 256
pages of 16 kilobytes each, but
does not affect data allocation
Enable Memory Management Unit
(MMU) Support (-MMU)
Check to inform the compiler that CALL and
RTC instructions are available, enabling code
banking, and that the current architecture
has extended data access capabilities,
enabling support for __linear data types.
This option can be used only when -Cs08 is
enabled.
Disassembler
Use this panel to specify the command, options, and expert settings for RS08
Disassembler.
Figure 3.39 shows the Disassembler page.
206
Microcontrollers V10.x Targeting Manual
DRAFT
Build Properties for Bareboard Projects
Build Properties for RS08
Figure 3.39 Tool Settings > Disassembler
Table 3.35 lists and describes the Disassembler options.
Table 3.35 Tool Settings - Disassembler Options
Option
Description
Command
Shows the location of the disassembler
executable file; default is ${HC08Tools}/
decoder.
All options
Shows the actual command line the linker
will be called with.
Expert Settings
Shows the expert settings command line
parameters; default is ${COMMAND}
${FLAGS} O${OUTPUT_PREFIX}${OUTPUT}
${INPUTS}
Command line pattern
Disassembler > Output
Use this panel to control how the disassembler generates the output file.
Figure 3.40 shows the Output panel.
Microcontrollers V10.x Targeting Manual
207
DRAFT
Build Properties for Bareboard Projects
Build Properties for RS08
Figure 3.40 Tool Settings - Disassembler > Output
Table 3.36 lists and describes the output options for RS08 disassembler.
Table 3.36 Tool Settings - Disassembler > Output Options
208
Option
Description
Print full listing
Prints a listing with the header information of the object file.
Write disassembly
listing with source
code
Check to enable the decoder decoding Freescale object files
write the source code within the disassembly listing.
Decode DWARF
section
Check to write the DWARF section information in the listing file.
Decoding from the DWARF section inserts this information in the
listing file. See the following listings for more information.
Configure which
parts of DWARF in
formation to
decode
Check to configure parts of DWARF in formation to decode.
Decode ELF
sections
Check to ensure that the ELF section information is also written to
the listing file. Decoding from the ELF section inserts the following
information in the listing file.
This option setting is default for the Freescale object files as
input.
Microcontrollers V10.x Targeting Manual
DRAFT
Build Properties for Bareboard Projects
Build Properties for RS08
Table 3.36 Tool Settings - Disassembler > Output Options (continued)
Option
Description
Dump ELF
sections
Check to generate a HEX dump of all ELF sections.
Dump ELF
sections in LST file
Check to generate a HEX dump of all ELF sections in a LST file.
Produce inline
assembly file
Check to ensure that the output listing is an inline assembly file
without additional information, but in C comments.
No symbols in
disassembled
listing
Check to prevent symbols from printing in the disassembled
listing.
Shows the cycle
count for each
instruction
Check to ensure that each instruction line contains the count of
cycles in '[',']' braces. The cycle count is written before the
mnemonics of the instruction. Note that the cycle count display is
not supported for all architectures.
Write disassembly
listing only
Check to ensure that the Decoder decoding Freescale object files
writes the source code within the disassembly listing only.
Write disassembly
listing with source
and all comments
Check to write the origin source and its comments within the
disassembly listing.
Linker
Use this panel to specify the command, options, and expert settings for the build tool
linker. Additionally, the Linker tree control includes the general, libraries, and search path
settings.
Figure 3.41 shows the Linker settings.
Microcontrollers V10.x Targeting Manual
209
DRAFT
Build Properties for Bareboard Projects
Build Properties for RS08
Figure 3.41 Tool Settings - Linker
Table 3.37 lists and describes the linker options for RS08.
Table 3.37 Tool Settings - Linker Options
Option
Description
Command
Shows the location of the linker executable
file.
All options
Shows the actual command line the linker
will be called with.
Expert Settings
Shows the expert settings command line
parameters; default is ${COMMAND}
${FLAGS}${OUTPUT_FLAG}${OUTPUT_PR
EFIX}${OUTPUT} -add( ${INPUTS} ).
Command line pattern
Linker > Input
Use this panel to specify the parameter file path, startup function, object file search paths,
and any additional libraries that the C/C++ Linker should use. You can specify multiple
additional libraries and library search paths. Also, you can change the order in which the
IDE uses or searches the libraries.
The IDE first looks for an include file in the current directory, or the directory that you
specify in the INCLUDE directive. If the IDE does not find the file, it continues searching
210
Microcontrollers V10.x Targeting Manual
DRAFT
Build Properties for Bareboard Projects
Build Properties for RS08
the paths shown in this panel. The IDE keeps searching paths until it finds the #include
file or finishes searching the last path at the bottom of the Include File Search Paths list.
The IDE appends to each path the string that you specify in the INCLUDE directive.
NOTE
The IDE displays an error message if a header file is in a different directory
from the referencing source file. Sometimes, the IDE also displays an error
message if a header file is in the same directory as the referencing source file.
For example, if you see the message Could not open source file myfile.h,
you must add the path for myfile.h to this panel.
Figure 3.42 shows the Input panel.
Figure 3.42 Tool Settings - Linker > Input
Table 3.38 lists and describes the linker input options for RS08.
Microcontrollers V10.x Targeting Manual
211
DRAFT
Build Properties for Bareboard Projects
Build Properties for RS08
Table 3.38 Tool Settings - Linker > Input Options
Option
Description
Parameter File
Shows the path of the parameter file. Default
value is: ${ProjDirPath}/
Project_Settings/Linker_Files/
Project.prm.
Specify startup function (-E)
Tells the command-line tool to preprocess
source files.
Search paths (-L)
Shows the list of all search paths; the ELF
part of the linker searches object files first in
all paths and then the usual environment
variables are considered.
Libraries
Lists paths to additional libraries that the C/
C++ linker uses
Table 3.39 lists and describes the toolbar buttons that help work with the libraries and the
additional object file search paths.
Table 3.39 Search Paths Toolbar Buttons
Button
Description
Add — Click to open the Add directory
path dialog box (Figure 3.43) and specify
the object file search path.
Delete — Click to delete the selected object
file search path. To confirm deletion, click
Yes in the Confirm Delete dialog box.
Edit — Click to open the Edit directory
path dialog box (Figure 3.44) and update
the selected object file search path.
Move up — Click to move the selected
object file search path one position higher in
the list.
Move down — Click to move the selected
object file search path one position lower in
the list.
212
Microcontrollers V10.x Targeting Manual
DRAFT
Build Properties for Bareboard Projects
Build Properties for RS08
Figure 3.43 shows the Add directory path dialog box.
Figure 3.43 Add directory path Dialog Box
Figure 3.44 shows the Edit directory path dialog box.
Figure 3.44 Edit directory path Dialog Box
The buttons in the Add directory path and Edit directory path dialog boxes help work
with the object file search paths.
• OK — Click to confirm the action and exit the dialog box.
• Cancel — Click to cancel the action and exit the dialog box.
• Workspace — Click to display the Folder Selection dialog box and specify the
object file search path. The resulting path, relative to the workspace, appears in the
appropriate list.
• File system — Click to display the Browse for Folder dialog box and specify the
object file search path. The resulting path appears in the appropriate list.
Table 3.40 lists and describes the toolbar buttons that help work with the libraries and the
additional object files.
Microcontrollers V10.x Targeting Manual
213
DRAFT
Build Properties for Bareboard Projects
Build Properties for RS08
Table 3.40 Libraries Toolbar Buttons
Button
Description
Add — Click to open the Add file path
dialog box (Figure 3.45) and specify
location of the library you want to add.
Delete — Click to delete the selected library
path. To confirm deletion, click Yes in the
Confirm Delete dialog box.
Edit — Click to open the Edit file path
dialog box (Figure 3.46) and update the
selected path.
Move up — Click to move the selected path
one position higher in the list.
Move down — Click to move the selected
path one position lower in the list.
Figure 3.45 shows the Add file path dialog box.
Figure 3.45 Tool Settings - Linker > Libraries - Add file path Dialog Box
Figure 3.46 shows the Edit file path dialog box.
214
Microcontrollers V10.x Targeting Manual
DRAFT
Build Properties for Bareboard Projects
Build Properties for RS08
Figure 3.46 Tool Settings - Linker > Libraries - Edit file path Dialog Box
The buttons in the Add file path and Edit file path dialog boxes help work with the file
paths.
• OK — Click to confirm the action and exit the dialog box.
• Cancel — Click to cancel the action and exit the dialog box.
• Workspace — Click to display the File Selection dialog box and specify the file
path. The resulting path, relative to the workspace, appears in the appropriate list.
• File system — Click to display the Open dialog box and specify the file path. The
resulting absolute path appears in the appropriate list.
Linker > Optimization
Use this panel to control linker optimizations. The linker’s optimizer can apply any of its
optimizations in either global or non-global optimization mode. You can apply global
optimization at the end of the development cycle, after compiling and optimizing all
source files individually or in groups.
Figure 3.47 shows the Optimization panel.
Microcontrollers V10.x Targeting Manual
215
DRAFT
Build Properties for Bareboard Projects
Build Properties for RS08
Figure 3.47 Tool Settings - Linker > Optimizations
Table 3.41 lists and describes the linker optimization options for RS08.
216
Microcontrollers V10.x Targeting Manual
DRAFT
Build Properties for Bareboard Projects
Build Properties for RS08
Table 3.41 Tool Settings - Linker > Optimization Options
Option
Description
Allocation over segment
boundaries (-Alloc)
The linker supports to allocate objects from one ELF
section into different segments. The allocation strategy
controls where space for the next object is allocated as
soon as the first segment is full. Options are:
• Always use next segment: In the AllocNext
strategy, the linker always takes the next
segment as soon as the current segment is
full. Holes generated during this process are
not used later. With this strategy, the
allocation order corresponds to the definition
order in the object files. Objects defined first
in a source file are allocated before later
defined objects.
• Always check for free previous segment:
In the AllocFirst strategy, the linker checks
for every object, if there is a previously only
partially used segment, into which the
current object does fit. This strategy does
not maintain the definition order.
• Check for free previous segment when
current is full: In the AllocChange strategy,
the linker checks as soon as a object does
no longer fit into the current segment, if
there is a previously only partially used
segment, into which the current object does
fit. This strategy does not maintain the
definition order, but it does however use
fewer different ranges than the AllocFirst
case.
Microcontrollers V10.x Targeting Manual
217
DRAFT
Build Properties for Bareboard Projects
Build Properties for RS08
Table 3.41 Tool Settings - Linker > Optimization Options
Option
Description
Overlap constants in ROM (COCC)
Defines the default if constants and code should be
optimized. The commands DO_OVERLAP_CONSTS
and DO_NOT_OVERLAP_CONSTS take precedence
over the option.
Options are:
• Default
• Overlap constant data and code
• Overlap constant data
• Overlap code
Optimize copy down (-OCopy)
Changes the copy down structure to use few spaces.
The optimization does assume that the application
does perform both the zero out and the copy down
step of the global initialization. If a value is set to zero
by the zero out, then zero values are removed from the
copy down information. The resulting initialization is
not changed by this optimization if the default startup
code is used.
Options are:
• Enable
• Disable
Linker > Output
Use this panel to control how the linker formats the listing file, as well as error and
warning messages.
Figure 3.48 shows the Output panel.
218
Microcontrollers V10.x Targeting Manual
DRAFT
Build Properties for Bareboard Projects
Build Properties for RS08
Figure 3.48 Tool Settings - Linker > Output
Table 3.42 lists and describes the linker output options for RS08.
Table 3.42 Tool Settings - Linker > Output Options
Option
Description
Link as ROM
library (-AsROMlib)
Check to link the application as a ROM library. This option has
the same effect as specifying AS ROM_LIB in the linker
parameter file.
Generate S_record
file (-B)
Check to specify that in addition to an absolute file, also an
srecord file should be generated. The name of the srecord file is
the same as the name of the abs file, except that the extension
SX is used. The default env variable SRECORD may specify an
alternative extension.
Check if objects
overlap in the
absolute file (even
if different address
spaces) (CheckAcrossAddr
Space)
Check to instruct the linker to check if objects overlap, taking into
account their address space.
Generate map file
(-M)
Forces the generation of a map file after a successful linking
session.
Microcontrollers V10.x Targeting Manual
219
DRAFT
Build Properties for Bareboard Projects
Build Properties for RS08
Table 3.42 Tool Settings - Linker > Output Options (continued)
Option
Description
Strip symbolic
information (-S)
Check to disable the generation of DWARF sections in the
absolute file to save memory space.
Generate fixups in
abs file (-SFixups)
Check to ensure compatibility with previous linker versions.
Usually, absolute files do not contain any fixups because all
fixups are evaluated at link time. But with fixups, the decoder
might symbolically decode the content in absolute files. Some
debuggers do not load absolute files which contain fixups
because they assume that these fixups are not yet evaluated. But
the fixups inserted with this option are actually already handled by
this linker.
Specify statistic file
(e.g. statistic.txt) (StatF)
Specify the name of the linker statistic file. The statistic file reports
each allocated object and its attributes. Every attribute is
separated by a tab character, so it can be easily imported into a
spreadsheet/database program for further processing.
Linker > General
Use this panel to specify the general linker behavior.
Figure 3.49 shows the General panel.
220
Microcontrollers V10.x Targeting Manual
DRAFT
Build Properties for Bareboard Projects
Build Properties for RS08
Figure 3.49 Tool Settings - Linker > General
Table 3.43 lists and describes the general linker options for RS08.
Table 3.43 Tool Settings - Linker > General Options
Option
Description
Other flags
Specify additional command line options for the linker; type in
custom flags that are not otherwise available in the UI. default
value is -WmsgSd1100 -WmsgSd1912.
Burner
Use the Burner for RS08 Preference Panel to map *.bbl (batch burner language) files to
the Burner Plug-In. When the project folder contains a *.bbl file, *.bbl file processing
during the post-link phase uses the settings in the Burner preference panel.
Figure 3.50 shows the RS08 Burner settings.
Microcontrollers V10.x Targeting Manual
221
DRAFT
Build Properties for Bareboard Projects
Build Properties for RS08
Figure 3.50 Tool Settings > Burner
Table 3.44 lists and describes the burner options for RS08.
Table 3.44 Tool Settings - Burner Options
Option
Description
Command
Shows the location of the linker executable
file.
Default value is:"${HC08Tools}/burner"
All options
Shows the actual command line the burner
will be called with.
Expert Settings
Shows the expert settings command line
parameters; default is ${COMMAND}
${FLAGS} ${INPUTS}.
Command line pattern
Burner > General
Use this panel to specify other flags for the RS08 Burner to use.
Figure 3.51 shows the General panel.
222
Microcontrollers V10.x Targeting Manual
DRAFT
Build Properties for Bareboard Projects
Build Properties for RS08
Figure 3.51 Tool Settings - Burner > General
Table 3.45 lists and describes the general options for RS08 burner.
Table 3.45 Tool Settings - Burner > General Options
Option
Description
Other flags
Specify additional command line options for
the burner; type in custom flags that are not
otherwise available in the UI.
RS08 Compiler
Use this panel to specify the command, options, and expert settings for the build tool
compiler. Additionally, the RS08 Compiler tree control includes the general, include file
search path settings.
Figure 3.52 shows the RS08 Compiler settings.
Microcontrollers V10.x Targeting Manual
223
DRAFT
Build Properties for Bareboard Projects
Build Properties for RS08
Figure 3.52 Tool Settings - RS08 Compiler
Table 3.46 lists and describes the compiler options for RS08
.
Table 3.46 Tool Settings - Compiler Options
Option
Description
Command
Shows the location of the linker executable
file. Default value is : "${HC08Tools}/
crs08.exe"
All options
Shows the actual command line the compiler
will be called with.
Expert Settings
Shows the expert settings command line
parameters; default is {COMMAND}
${FLAGS}${OUTPUT_FLAG}${OUTPUT_PR
EFIX}${OUTPUT} ${INPUTS}.
Command line pattern
RS08 Compiler > Preprocessor
Use this panel to specify preprocessor behavior and define macros.
Figure 3.53 shows the Preprocessor panel.
224
Microcontrollers V10.x Targeting Manual
DRAFT
Build Properties for Bareboard Projects
Build Properties for RS08
Figure 3.53 Tool Settings - RS08 Compiler > Preprocessor
Table 3.47 lists and describes the preprocessor options for RS08 Compiler.
Table 3.47 Tool Settings - RS08 Compiler > Preprocessor Options
Option
Description
Define preprocessor macros (-D)
Define, delete, or rearrange preprocessor
macros. You can specify multiple macros
and change the order in which the IDE uses
the macros.
Define preprocessor macros and optionally
assign their values. This setting is equivalent
to specifying the -D name[=value]
command-line option. To assign a value, use
the equal sign (=) with no white space.
For example, this syntax defines a
preprocessor value named
EXTENDED_FEATURE and assigns ON as its
value:
EXTENDED_FEATURE=ON
Note that if you do not assign a value to the
macro, the shell assigns a default value of 1.
Microcontrollers V10.x Targeting Manual
225
DRAFT
Build Properties for Bareboard Projects
Build Properties for RS08
Table 3.48 lists and describes the toolbar buttons that help work with preprocessor macro
definitions.
Table 3.48 Define Preprocessor Macros Toolbar Buttons
Button
Description
Add — Click to open the Enter Value
dialog box (Figure 3.54) and specify the
path/macro.
Delete — Click to delete the selected path/
macro. To confirm deletion, click Yes in the
Confirm Delete dialog box.
Edit — Click to open the Edit Dialog dialog
box (Figure 3.55) and update the selected
path/macro.
Move up — Click to move the selected path/
macro one position higher in the list.
Move down — Click to move the selected
path/macro one position lower in the list
Figure 3.54 shows the Enter Value dialog box.
Figure 3.54 Tool Settings - RS08 Compiler > Preprocessor - Enter Value Dialog Box
Figure 3.55 shows the Edit Dialog dialog box.
226
Microcontrollers V10.x Targeting Manual
DRAFT
Build Properties for Bareboard Projects
Build Properties for RS08
Figure 3.55 Tool Settings - RS08 Compiler > Preprocessor - Edit Dialog Dialog Box
The buttons in the Enter Value and Edit dialog boxes help work with the preprocessor
macros.
• OK — Click to confirm the action and exit the dialog box.
• Cancel — Click to cancel the action and exit the dialog box.
RS08 Compiler > Input
Use this panel to specify file search paths and any additional include files the RS08
Compiler should use. You can specify multiple search paths and the order in which you
want to perform the search.
The IDE first looks for an include file in the current directory, or the directory that you
specify in the INCLUDE directive. If the IDE does not find the file, it continues searching
the paths shown in this panel. The IDE keeps searching paths until it finds the #include
file or finishes searching the last path at the bottom of the Include File Search Paths list.
The IDE appends to each path the string that you specify in the INCLUDE directive.
NOTE
The IDE displays an error message if a header file is in a different directory
from the referencing source file. Sometimes, the IDE also displays an error
message if a header file is in the same directory as the referencing source file.
For example, if you see the message Could not open source file myfile.h,
you must add the path for myfile.h to this panel.
Figure 3.56 shows the Input panel.
Microcontrollers V10.x Targeting Manual
227
DRAFT
Build Properties for Bareboard Projects
Build Properties for RS08
Figure 3.56 Tool Settings - RS08 Compiler > Input
Table 3.49 lists and describes the input options for RS08 Compiler.
Table 3.49 Tool Settings - RS08 Compiler > Input Options
Option
Description
Include File Path (-I)
Specify, delete, or rearrange file search
paths.
Additional Include Files (-AddInd)
Specify, delete, or rearrange paths to search
any additional #include files.
Include files only once
Check to include every header file only once;
duplicates are ignored.
Table 3.50 lists and describes the toolbar buttons that help work with the file paths.
228
Microcontrollers V10.x Targeting Manual
DRAFT
Build Properties for Bareboard Projects
Build Properties for RS08
Table 3.50 Include File Path (-I) Toolbar Buttons
Button
Description
Add — Click to open the Add directory
path dialog box (Figure 3.57) and specify
location of the library you want to add.
Delete — Click to delete the selected library
path. To confirm deletion, click Yes in the
Confirm Delete dialog box.
Edit — Click to open the Edit directory
path dialog box (Figure 3.58) and update
the selected path.
Move up — Click to move the selected path
one position higher in the list.
Move down — Click to move the selected
path one position lower in the list.
Table 3.51 lists and describes the toolbar buttons that help work with the search paths.
Table 3.51 Additional Include Files (-AddIncl) Toolbar Buttons
Button
Description
Add — Click to open the Add directory
path dialog box (Figure 3.57) and specify
location of the library you want to add.
Delete — Click to delete the selected library
path. To confirm deletion, click Yes in the
Confirm Delete dialog box.
Edit — Click to open the Edit directory
path dialog box (Figure 3.58) and update
the selected path.
Microcontrollers V10.x Targeting Manual
229
DRAFT
Build Properties for Bareboard Projects
Build Properties for RS08
Table 3.51 Additional Include Files (-AddIncl) Toolbar Buttons (continued)
Button
Description
Move up — Click to move the selected path
one position higher in the list.
Move down — Click to move the selected
path one position lower in the list.
Figure 3.57 Tool Settings - RS08 Compiler > Input - Add file path Dialog Box
Figure 3.58 Tool Settings - RS08 Compiler > Input - Edit file path Dialog Box
The buttons in the Add file path (Figure 3.57) and Edit file path (Figure 3.58) dialog
boxes help work with the paths.
• OK — Click to confirm the action and exit the dialog box.
• Cancel — Click to cancel the action and exit the dialog box.
• Workspace — Click to display the File Selection dialog box and specify the path.
The resulting path, relative to the workspace, appears in the appropriate list.
• File system — Click to display the Open dialog box and specify the path. The
resulting path appears in the appropriate list.
RS08 Compiler > Language
Use this panel to specify code- and symbol-generation options for the RS08 Compiler.
230
Microcontrollers V10.x Targeting Manual
DRAFT
Build Properties for Bareboard Projects
Build Properties for RS08
Figure 3.59 shows the Language panel.
Figure 3.59 Tool Settings - RS08 Compiler > Language
Table 3.52 lists and describes the language options for RS08.
Microcontrollers V10.x Targeting Manual
231
DRAFT
Build Properties for Bareboard Projects
Build Properties for RS08
Table 3.52 Tool Settings - RS08 Compiler > Language Options
Option
Description
Strict ANSI
Check if you want the C compiler to operate
in strict ANSI mode. In this mode, the
compiler strictly applies the rules of the
ANSI/ISO specification to all input files. This
setting is equivalent to specifying the ansi command-line option. The compiler
issues a warning for each ANSI/ISO
extension it finds.
C++
With this option enabled, the Compiler
behaves as a C++ Compiler. You can select
between three different types of C++:
• Full C++ (-C++f) — Supports the
whole C++ language.
• Embedded C++ (-C++e) —
Supports a constant subset of the
C++ language. EC++ does not
support inefficient things like
templates, multiple inheritance,
virtual base classes and exception
handling.
• CompactC++ (-C++c) —
Supports a configurable subset of
the C++ language. You can
configure this subset with the
option -Cn.
• No C++ — If the option is not set,
the Compiler behaves as an ANSIC Compiler.
If the option is enabled and the source file
name extension is *.c, the Compiler behaves
as a C++ Compiler.
If the option is not set, but the source
filename extension is .cpp or .cxx, the
Compiler behaves as if the -C++f option
were set.
232
Microcontrollers V10.x Targeting Manual
DRAFT
Build Properties for Bareboard Projects
Build Properties for RS08
Table 3.52 Tool Settings - RS08 Compiler > Language Options (continued)
Option
Description
Cosmic compatibility mode for space
modifiers @near, @far, and @tiny (Ccx)
Check to allow Cosmic style @near, @far
and @tiny space modifiers as well as
@interrupt in your C code. The -ANSI option
must be switched off. It is not necessary to
remove the Cosmic space modifiers from
your application code. There is no need to
place the objects to sections addressable by
the Cosmic space modifiers.
The following is done when a Cosmic
modifier is parsed:
The objects declared with the space modifier
are always allocated in a special Cosmic
compatibility (_CX) section (regardless of
which section pragma is set) depending on
the space modifier, on the const qualifier or if
it is a function or a variable.
Space modifiers on the left hand side of a
pointer declaration specify the pointer type
and pointer size, depending on the target.
Bigraph and trigraph support (-Ci)
Check to replace certain unavailable tokens
with the equivalent keywords.
C++ comments in ANSI-C (-Cppc)
Check to allow C++ comments.
Propagate const and colatile qualifiers
for structs (-Cq)
Check to propagate const and volatile
qualifiers for structures. If all members of a
structure are constant or volatile, the
structure itself is constant or volatile. If the
structure is declared as constant or volatile,
all its members are constant or volatile,
respectively.
Conversion from ‘const T*’ to ‘T*’ (-Ec)
Check to enable this non-ANSI compliant
extension allows the compiler to treat a
pointer to a constant type like a pointer to the
non-constant equivalent of the type. Earlier
Compilers did not check a store to a constant
object through a pointer. This option is useful
when compiling older source code.
Microcontrollers V10.x Targeting Manual
233
DRAFT
Build Properties for Bareboard Projects
Build Properties for RS08
RS08 Compiler > Type Sizes
Use this panel to specify the available data type size options for the RS08 Compiler.
Figure 3.60 shows the Type Sizes panel.
Figure 3.60 Tool Settings - RS08 Compiler > Type Sizes
Table 3.53 lists and describes the type size options for RS08 Compiler.
234
Microcontrollers V10.x Targeting Manual
DRAFT
Build Properties for Bareboard Projects
Build Properties for RS08
Table 3.53 Tool Settings - RS08 Compiler > Type Sizes
Option
Description
char
Selects the size of the char type. Options
are:
• Default (unsigned 8bit)
• unsigned 8bit (-TuCC1)
• signed 8bit (-TsCC1)
• signed 16bit (-TsCC2)
• signed 32bit (-TsCC4)
short
Selects the size of the short type. Options
are:
• Default (16bit)
• signed 8bit (-TS1)
• signed 16bit (-TS2)
• signed 32bit (-TS4)
int
Selects the size of the int type. Options are:
• Default (16bit)
• signed 8bit (-TI1)
• signed 16bit (-TI2)
• signed 32bit (-TI4)
long
Selects the size of the long type. Options
are:
• Default (32bit)
• signed 8bit (-TL1)
• signed 16bit (-TL2)
• signed 32bit (-TL4)
long long
Selects the size of the long long type.
Options are:
• Default (32bit)
• signed 8bit (-TLL1)
• signed 16bit (-TLL2)
• signed 32bit (-TLL4)
Microcontrollers V10.x Targeting Manual
235
DRAFT
Build Properties for Bareboard Projects
Build Properties for RS08
Table 3.53 Tool Settings - RS08 Compiler > Type Sizes (continued)
Option
Description
enum
Selects the size of the enum type. Options
are:
• Default (signed 16bit)
• signed 8bit (-TE1sE)
• signed 16bit (-TE2sE)
• signed 32bit (-TE4sE)
• unsigned 8bit (-TE1uE)
float
Selects the size of the float type. Options
are:
• Default (IEEE32)
• IEEE32
double
Selects the size of the double type. Options
are:
• Default (IEEE32)
• IEEE32
long double
Selects the size of the long double type.
Options are:
• Default (IEEE32)
• IEEE32
long long double
Selects the size of the long long double
type. Options are:
• Default (IEEE32)
• IEEE32
RS08 Compiler > Code Generation
Use this panel to specify code- and symbol-generation options for the RS08 Compiler
Figure 3.61 shows the Code Generation panel.
236
Microcontrollers V10.x Targeting Manual
DRAFT
Build Properties for Bareboard Projects
Build Properties for RS08
Figure 3.61 Tool Settings - RS08 Compiler > Code Generation
Table 3.54 lists and describes the code generation options for RS08 compiler.
Table 3.54 Tool Settings - RS08 Compiler > Code Generation Options
Option
Description
Bit field gap limits (-BfaGapLimitBits)
Check to affect the maximum allowable
number of gap bits. The bitfield allocation
tries to avoid crossing a byte boundary
whenever possible. To optimize accesses,
the compiler may insert some padding or gap
bits.
Bit field type size reduction
This option is configurable whether or not the
compiler uses type-size reduction for
bitfields. Type-size reduction means that the
compiler can reduce the type of an int bitfield
to a char bitfield if it fits into a character. This
allows the compiler to allocate memory only
for one byte instead of for an integer. Options
are:
• Enabled (-BfsTSRON)
• Disabled (-BfsTSOFF)
Microcontrollers V10.x Targeting Manual
237
DRAFT
Build Properties for Bareboard Projects
Build Properties for RS08
Table 3.54 Tool Settings - RS08 Compiler > Code Generation Options (continued)
Option
Description
Maximum load factor for switch tables (100) (-CswMaxLF)
Allows changing the default strategy of the
Compiler to use tables for switch statements;
is only available if the compiler supports
switch tables.
Minimum number of labels for switch
tables (-CswMinLB)
Allows changing the default strategy of the
Compiler using tables for switch statements;
is only available if the compiler supports
switch tables.
Minimum load factor for switch tables
(100) (-CswMinLF)
Allows the Compiler to use tables for switch
statements; is only available if the compiler
supports switch tables.
Qualifier for virtual table pointers (-Qvtp)
Using a virtual function in C++ requires an
additional pointer to virtual function tables.
The Compiler cannot access the pointer and
generates the pointer in every class object
when virtual function tables are associated.
Use IEEE32 for double
Check to use IEEE32 for doubles instead of
IEEE64 (default).
RS08 Compiler > Optimization
Use this panel to control compiler optimizations. The compiler’s optimizer can apply any
of its optimizations in either global or non-global optimization mode. You can apply
global optimization at the end of the development cycle, after compiling and optimizing
all source files individually or in groups.
Figure 3.62 shows the Optimization panel.
238
Microcontrollers V10.x Targeting Manual
DRAFT
Build Properties for Bareboard Projects
Build Properties for RS08
Figure 3.62 Tool Settings - RS08 Compiler > Optimization
Table 3.55 lists and describes the optimization options for RS08 compiler.
Microcontrollers V10.x Targeting Manual
239
DRAFT
Build Properties for Bareboard Projects
Build Properties for RS08
Table 3.55 Tool Settings - RS08 Compiler > Output Options
Option
Description
No integral promotion on
characters (-Cni)
Enhances character operation code density by
omitting integral promotion. This option enables
behavior that is not ANSI-C compliant.
Code generated with this option set does not
conform to ANSI standards. Code compiled with
this option is not portable. Using this option is not
recommended in most cases.
Loop unrolling i[number]) (-Cu)
Enables loop unrolling with the following
restrictions:
• Only simple for statements are unrolled,
e.g., for (i=0; i<10; i++)
• Initialization and test of the loop counter
must be done with a constant.
• Only <, >, <=, >= are permitted in a
condition.
• Only ++ or -- are allowed for the loop
variable increment or decrement.
• The loop counter must be integral.
• No change of the loop counter is
allowed within the loop.
• The loop counter must not be used on
the left side of an assignment.
• No address operator (&) is allowed on
the loop counter within the loop.
• Only small loops are unrolled:
Loops with few statements within the
loop.
Loops with fewer than 16 increments or
decrements of the loop counter.
The bound may be changed with the
optional argument = i<number>.
The -Cu=i20 option unrolls loops with a
maximum of 20 iterations.
240
Microcontrollers V10.x Targeting Manual
DRAFT
Build Properties for Bareboard Projects
Build Properties for RS08
Table 3.55 Tool Settings - RS08 Compiler > Output Options (continued)
Option
Description
Main Optimize Target: Optimize for
There are various points where the Compiler has
to select between two possibilities: it can either
generate fast, but large code, or small but slower
code.
The Compiler generally optimizes on code size. It
often has to decide between a runtime routine or
an expanded code. The programmer can decide
whether to select between the slower and shorter
or the faster and longer code sequence by setting
a command line switch.
• The Code Size (-Os) option directs the
Compiler to optimize the code for
smaller code size. The Compiler trades
faster-larger code for slower-smaller
code.
• The Execution Time (-Ot) option
directs the Compiler to optimize the
code for faster execution time. The
Compiler replaces slower/smaller code
with faster/larger code. This option only
affects some special code sequences.
This option has to be set together with
other optimization options (e.g., register
optimization) to get best results.
Create sub-functions with common
code
Performs the reverse of inlining. It detects
common code parts in the generated code. The
Compiler moves the common code to a different
place and replaces all occurrences with a JSR to
the moved code. At the end of the common code,
the Compiler inserts an RTS instruction. The
Compiler increases all SP uses by an address
size. This optimization takes care of stack
allocation, control flow, and of functions having
arguments on the stack.
Inline assembler code is never treated as
common code. Options are:
• Default
• Disable (-Onf)
• Enable (-Of)
Microcontrollers V10.x Targeting Manual
241
DRAFT
Build Properties for Bareboard Projects
Build Properties for RS08
Table 3.55 Tool Settings - RS08 Compiler > Output Options (continued)
Option
Description
Dynamic options configuration for
functions (-OdocF)
Allows the Compiler to select from a set of options
to reach the smallest code size for every function.
Without this feature, you must set fixed Compiler
switches over the whole compilation unit. With this
feature, the Compiler finds the best option
combination from a user-defined set for every
function.
Inlining (C[n] or OFF) (-Oi)
Enables inline expansion. If there is a #pragma
INLINE before a function definition, all calls of this
function are replaced by the code of this function,
if possible.
Using the -Oi=c0 option switches off inlining.
Functions marked with the #pragma INLINE are
still inlined. To disable inlining, use the -Oi=OFF
option.
242
Optimize library function (-OiLib)
Enables the compiler to optimize specific known
library functions to reduce execution time. The
Compiler frequently uses small functions such as
strcpy(), strcmp(), and so forth.
Disable alias checking (-Ona)
Prevents the Compiler from redefining these
variables, which lets you reuse already-loaded
variables or equivalent constants. Use this option
only when you are sure no real writes of aliases to
a variable memory location will occur.
Disable branch optimizer (-OnB)
Disables all branch optimizations.
Do generate copy down
information for zero values (OnCopyDown)
Restricts the compiler from generating a copy
down for i.
Disable CONST variable by
constant replacement (-OnCsfVar)
Lets you switch OFF the replacement of CONST
variable by the constant value.
Disable peephole optimization (OnP)
Disables the whole peephole optimizer. To
disable only a single peephole optimization, use
the optional syntax -OnP=<char>.
The initialization with zero optimization shown for
the arr array only works in the HIWARE format.
The ELF format requires initializing the whole
array to zero.
Microcontrollers V10.x Targeting Manual
DRAFT
Build Properties for Bareboard Projects
Build Properties for RS08
Table 3.55 Tool Settings - RS08 Compiler > Output Options (continued)
Option
Description
Disable code generation for NULL
Pointer to Member check (OnPMNC)
Before assigning a pointer to a member in C++,
you must ensure that the pointer to the member is
not NULL in order to generate correct and safe
code. In embedded systems development, the
difficulty becomes generating the denser code
while avoiding overhead whenever possible (this
NULL check code is a good example). This option
enables you to switch off the code generation for
the NULL check.
Disable tree optimizer (-Ont)
Disables the tree optimizer. Use this option for
debugging and to force the Compiler to produce
'straightforward' code. Note that the optimizations
below are just examples for the classes of
optimizations.
Large return value type
Compiler supports this option even though
returning a 'large' return value may be not as
efficient as using an additional pointer. The
Compiler introduces an additional parameter for
the return value if the return value cannot be
passed in registers. Options are:
• Default
• Large return value pointer, always
with temporary (-Rpt)
• Large return value pointer and
temporary elimination (-Rpe)
Disable mid level optimizations
The backend of this compiler is based on the
second generation intermediate code generator
(SICG). All intermediate language and processor
independent optimizations (cf. NULLSTONE) are
performed by the SICG optimizer using the
powerful static single assignment form (SSA
form). The optimizations are switched off using od. Currently four optimizations are implemented.
Disable mid level branch
optimizations
Disables branch optimizations on the SSA form
based on control flows.
Label rearranging sorts all labels of the control
flow to generate a minimum amount of branches.
Microcontrollers V10.x Targeting Manual
243
DRAFT
Build Properties for Bareboard Projects
Build Properties for RS08
Table 3.55 Tool Settings - RS08 Compiler > Output Options (continued)
Option
Description
Disable far to near optimization
Disables the JSR to BSR optimization. The
compiler checks the range of the call to determine
if a BSR can be generated instead of a JSR. If Onbsr is used this optimization will be disabled.
Disable reload from register
optimization
Disables the low level register trace optimizations.
If you use the option the code becomes more
readable, but less optimal.
Disable tail call optimizations
Allows the compiler to remove all the entry and
exit code from the current function.By default, the
compiler replaces trailing calls (JSR/BSR) with
JMP instructions if the function does not contain
any other function calls.
Reuse locals of stack frame
Instructs the compiler to reuse the location of local
variables/temporaries whenever possible. When
used, the compiler analyzes which local variables
are alive simultaneously. Based on that analysis
the compiler selects the best memory layout for
for variables. Two or more variables may end up
sharing the same memory location.
Alias analysis options
Allows the programmer to control the alias
behavior of the compiler. The option -oaaddr is
the default because it is safe for all C programs.
Use option -oaansi if the source code follows the
ANSI C99 alias rules. If objects with different
types never overlap in your program, use option
-oatype. If your program doesn't have aliases at
all, use option -oanone (or the ICG option -ona,
which is supported for compatibility reasons).
Option are:
• All objects in same address area
may overlap
• Only objects in same address area
with same type
• Assume no objects do overlap
• Use ANSI99 rules
244
Microcontrollers V10.x Targeting Manual
DRAFT
Build Properties for Bareboard Projects
Build Properties for RS08
RS08 Compiler > Output
Use this panel to control how the compiler generates the output file, as well as error and
warning messages. You can specify whether to allocate constant objects in ROM, generate
debugging information, and strip file path information.
Figure 3.63 shows the Output panel.
Figure 3.63 Tool Settings - RS08 Compiler > Output
Table 3.56 lists and describes the output options for RS08 compiler.
Table 3.56 Tool Settings - RS08 Compiler > Output Options
Option
Description
Allocate CONST objects in ROM (-Cc)
Check to enables the Compiler assign const
objects into the ROM_VAR segment, which
the parameter file assigns to a ROM section.
Encrypt File (e.g. %f.e%e) (-Eencrypt)
Encrypts using the given key with the -Ekey:
Encryption Key option.
Encryption key (-EKey)
Encrypt files with the given key number (Eencrypt option).The default encryption key
is 0. Using this default is not recommended.
Microcontrollers V10.x Targeting Manual
245
DRAFT
Build Properties for Bareboard Projects
Build Properties for RS08
Table 3.56 Tool Settings - RS08 Compiler > Output Options (continued)
Option
Description
General Assembler Include File (e.g.
%f.inc) (-La)
Enables the Compiler to generate an
assembler include file when the
CREATE_ASM_LISTING pragma occurs.
The name of the created file is specified by
this option. If no name is specified, a default
of %f.inc is taken. To put the file into the
directory specified by the TEXTPATH: Text
File Path environment variable, use the
option -la=%n.inc. The %f option already
contains the path of the source file. When %f
is used, the generated file is in the same
directory as the source file.
The content of all modifiers refers to the main
input file and not to the actual header file.
The main input file is the one specified on the
command line.
Generate Listing File (e.g. %n.lst) (Lasm)
Enables the Compiler to generate an
assembler listing file directly. The Compiler
also prints all assembler-generated
instructions to this file. The option specifies
the name of the file. If no name is specified,
the Compiler takes a default of %n.lst. If the
resulting filename contains no path
information the Compiler uses the
TEXTPATH: Text File Path environment
variable.
The syntax does not always conform with the
inline assembler or the assembler syntax.
Therefore, use this option only to review the
generated code. It cannot currently be used
to generate a file for assembly.
246
Microcontrollers V10.x Targeting Manual
DRAFT
Build Properties for Bareboard Projects
Build Properties for RS08
Table 3.56 Tool Settings - RS08 Compiler > Output Options (continued)
Option
Description
Log predefined defines to file (e.g.
predef.h) (-Ldf)
Enables the Compiler to generate a text file
that contains a list of the compiler-defined
#define. The default filename is predef.h, but
may be changed (e.g., -Ldf="myfile.h"). The
file is generated in the directory specified by
the TEXTPATH: Text File Path environment
variable. The defines written to this file
depend on the actual Compiler option
settings (e.g., type size settings or ANSI
compliance).
Note: The defines specified by the
command line (-D: Macro Definition
option) are not included.
This option may be very useful for SQA. With
this option it is possible to document every
#define which was used to compile all
sources.
Note: This option only has an effect if a file is
compiled. This option is unusable if you are
not compiling a file.
List of included files to ‘.inc’ file (-Li)
Microcontrollers V10.x Targeting Manual
Enables the Compiler to generate a text file
which contains a list of the #include files
specified in the source. This text file shares
the same name as the source file but with
the extension, *.inc. The files are stored in
the path specified by the TEXTPATH: Text
File Path environment variable. The
generated file may be used in make files.
247
DRAFT
Build Properties for Bareboard Projects
Build Properties for RS08
Table 3.56 Tool Settings - RS08 Compiler > Output Options (continued)
Option
Description
Write statistic output to file (e.g.
logfile.txt) (-Ll)
Enables the Compiler append statistical
information about the compilation session to
the specified file. The information includes
Compiler options, code size (in bytes), stack
usage (in bytes) and compilation time (in
seconds) for each procedure of the compiled
file. The Compiler appends the information to
the specified filename (or the file make.txt, if
no argument given). Set the TEXTPATH:
Text File Path environment variable to store
the file into the path specified by the
environment variable. Otherwise the
Compiler stores the file in the current
directory.
Strip path information
Check to enable the compiler remove both
unreferenced path reference from your
program. This reduces your program's
memory footprint.
RS08 Compiler > General
Use this panel to specify other flags for the RS08 Compiler to use.
Figure 3.64 shows the General panel.
248
Microcontrollers V10.x Targeting Manual
DRAFT
Build Properties for Bareboard Projects
Build Properties for RS08
Figure 3.64 Tool Settings - RS08 Compiler > General
Table 3.57 lists and describes the general options for RS08 compiler.
Table 3.57 Tool Settings - RS08 Compiler > General Options
Option
Description
Other flags
Specify additional command line options for
the compiler; type in custom flags that are
not otherwise available in the UI.
RS08 Assembler
Use this panel to specify the command, options, and expert settings for the build tool
assembler.
Figure 3.65 shows the Assembler settings.
Microcontrollers V10.x Targeting Manual
249
DRAFT
Build Properties for Bareboard Projects
Build Properties for RS08
Figure 3.65 Tool Settings - RS08 Assembler
Table 3.58 lists and describes the assembler options for RS08.
Table 3.58 Tool Settings - Assembler Options
Option
Description
Command
Shows the location of the assembler
executable file. Default value is:
"${HC08Tools}/ahc08.exe"
All options
Shows the actual command line the
assembler will be called with.
Expert Settings
Shows the expert settings command line
parameters; default is ${COMMAND}
Command line pattern
250
${COMMAND} ${FLAGS}Objn${OUTPUT_PREFIX}${OUTPUT}
${INPUTS}.
Microcontrollers V10.x Targeting Manual
DRAFT
Build Properties for Bareboard Projects
Build Properties for RS08
RS08 Assembler > Input
Use this panel to specify file search paths and any additional include files the RS08
Assembler should use. You can specify multiple search paths and the order in which you
want to perform the search.
Figure 3.66 shows the Input panel.
Figure 3.66 Tool Settings - RS08 Assembler > Input
Table 3.59 lists and describes the toolbar buttons that help work with the file search paths.
Table 3.59 Search Paths Toolbar Buttons
Button
Description
Add — Click to open the Add directory
path dialog box (Figure 3.43) and specify
the file search path.
Delete — Click to delete the selected file
search path. To confirm deletion, click Yes
in the Confirm Delete dialog box.
Microcontrollers V10.x Targeting Manual
251
DRAFT
Build Properties for Bareboard Projects
Build Properties for RS08
Table 3.59 Search Paths Toolbar Buttons (continued)
Button
Description
Edit — Click to open the Edit directory
path dialog box (Figure 3.44) and update
the selected object file search path.
Move up — Click to move the selected file
search path one position higher in the list.
Move down — Click to move the selected
file search path one position lower in the
list.
RS08 Assembler > Language
Use this panel to specify code- and symbol-generation options for the RS08 Compiler.
Figure 3.67 shows the Language panel.
Figure 3.67 Tool Settings - RS08 Assembler > Language
Table 3.29 lists and describes the language options for RS08 Assembler.
252
Microcontrollers V10.x Targeting Manual
DRAFT
Build Properties for Bareboard Projects
Build Properties for RS08
.
Table 3.60 Tool Settings - RS08 Assembler > Language Options
Option
Description
Case insensitivity
on label name (-Ci)
Turns off case sensitivity on label names. When this option is
activated, the Assembler ignores case sensitivity for label names.
If the Assembler generates object files but not absolute files
directly (-FA2 assembler option), the case of exported or imported
labels must still match. Or, the -Ci assembler option should be
specified in the linker as well.
Define label ( use
spaces to separate
labels ) (-D)
Lets you define labels and assign them values. The labels are
used for conditional compilation, where a common source file can
be used to generate code for different processor derivatives,
based on the labels supplied here.
Support for
structured types (Struct)
Enables the Macro Assembler to support the definition and usage
of structured types. This allows an easier way to access ANSI-C
structured variable in the Macro Assembler.
Angle brackets for
macro arguments
grouping (CMacAngBrack)
Controls whether the < > syntax for macro invocation argument
grouping is available. When it is disabled, the Assembler does not
recognize the special meaning for < in the macro invocation
context. There are cases where the angle brackets are
ambiguous. In new code, use the [? ?] syntax instead.
Options are:
• Allow
• Disallow
Square braces for
macro arguments
grouping (CMacBrackets)
Controls the availability of the [? ?] syntax for macro invocation
argument grouping. When it is disabled, the Assembler does not
recognize the special meaning for [?] in the macro invocation
context.
Options are:
• Allow
• Disallow
Compatibitlity
modes (-Compat)
Controls some compatibility enhancements of the Assembler.
The goal is not to provide 100% compatibility with any other
Assembler but to make it possible to reuse as much as possible.
Various suboptions control different parts of the assembly.
Maximum
MacroNest nesting
(-MacroNest)
Controls how deep macros calls can be nested. Its main purpose
is to avoid endless recursive macro invocations.
Microcontrollers V10.x Targeting Manual
253
DRAFT
Build Properties for Bareboard Projects
Build Properties for RS08
RS08 Assembler > Output
Use this panel to control how the assembler generates the output file, as well as error and
warning messages. You can specify whether to allocate constant objects in ROM, generate
debugging information, and strip file path information.
Figure 3.68 shows the Output panel.
Figure 3.68 Tool Settings - RS08 Assembler > Output
Table 3.30 lists and describes the output options for RS08 Assembler.
254
Microcontrollers V10.x Targeting Manual
DRAFT
Build Properties for Bareboard Projects
Build Properties for RS08
Table 3.61 Tool Settings - RS08 Assembler > Output Options
Option
Description
Object File Format
Defines the format for the output file generated by the Assembler.
Show label
statistics (-Li)
Using the -Ll option, the Compiler appends statistical information
about the compilation session to the specified file. The
information includes Compiler options, code size (in bytes), stack
usage (in bytes) and compilation time (in seconds) for each
procedure of the compiled file. The Compiler appends the
information to the specified filename (or the file make.txt, if no
argument given). Set the TEXTPATH: Text File Path environment
variable to store the file into the path specified by the environment
variable. Otherwise the Compiler stores the file in the current
directory.
Generate listing file
( e.g.
%(TEXTPATH)/
%n.lst ) (-L)
The -Lasm option causes the Compiler to generate an assembler
listing file directly. The Compiler also prints all assemblergenerated instructions to this file. The option specifies the name
of the file. If no name is specified, the Compiler takes a default of
%n.lst. If the resulting filename contains no path information the
Compiler uses the TEXTPATH: Text File Path environment
variable.
The syntax does not always conform with the inline assembler or
the assembler syntax. Therefore, use this option only to review
the generated code. It cannot currently be used to generate a file
for assembly.
Address size in the
listing file (-Lasms)
Specifies the size of the addresses displayed in the listing.
Options are:
• 1 to display addresses as xx
• 2 to display addresses as xxxx
• 3 to display addresses as xxxxxx
• 4 to display addresses asf xxxxxxxx
Do not print macro
call in listing file (Lc)
Specifies whether macro calls encountered in the source code
are expanded and appear in the listing file.
Do not print macro
definition in listing
file (-Ld)
Instructs the Assembler to generate a listing file but not including
any macro definitions. The listing file contains macro invocation
and expansion lines as well as expanded include files.
Microcontrollers V10.x Targeting Manual
255
DRAFT
Build Properties for Bareboard Projects
Build Properties for RS08
Table 3.61 Tool Settings - RS08 Assembler > Output Options (continued)
Option
Description
Do not print macro
expansion in listing
file (-Le)
Switches on the generation of the listing file, but macro
expansions are not present in the listing file. The listing file
contains macro definition and invocation lines as well as
expanded include files.
Do not print
included files in
listing file (-Li)
Switches on the generation of the listing file, but include files are
not expanded in the listing file. The listing file contains macro
definition, invocation, and expansion lines.
Associate debug
information to
assembly source
file (-AsmDbg)
Enables the Assembler to produce debugging information for the
generated files and associate debug information to the assembly
source file.
RS08 Assembler > General
Use this panel to specify the general assembler behavior. Figure 3.69 shows the General
panel.
Figure 3.69 Tool Settings - RS08 Assembler > General
Table 3.31 lists and describes the general assembler options for RS08.
256
Microcontrollers V10.x Targeting Manual
DRAFT
Build Properties for Bareboard Projects
Build Properties for ColdFire
Table 3.62 Tool Settings - Assembler > General Options
Option
Description
MMU Support (MMU)
Check to inform the compiler that CALL and RTC instructions are
available, enabling code banking, and that the current
architecture has extended data access capabilities, enabling
support for __linear data types. This option can be used only
when -Cs08 is enabled.
MCUasm
compatibility (MCUasm)
Check to activate the compatibility mode with the MCUasm
Assembler.
Other Flags
Specify additional command line options for the assembler; type
in custom flags that are not otherwise available in the UI.
Build Properties for ColdFire
The Properties for <project> window shows the corresponding build properties for a
ColdFire project (Figure 3.70).
Figure 3.70 Build Properties - ColdFire Debug
Microcontrollers V10.x Targeting Manual
257
DRAFT
Build Properties for Bareboard Projects
Build Properties for ColdFire
Table 3.63 lists the build properties specific to developing software for ColdFire Debug.
The properties that you specify in these panels apply to the selected build tool on the Tool
Settings page of the Properties for <project> window.
Table 3.63 Build Properties for ColdFire Debug
Build Tool
Build Properties Panels
ColdFire CPU
ColdFire CPU
Debugging
Debugging
Messages
Messages
Librarian
Librarian
Burner
Burner > General
ColdFire Linker
ColdFire Linker > Input
ColdFire Linker > General
ColdFire Linker > Output
ColdFire Compiler
ColdFire Compiler > Input
ColdFire Compiler > Warnings
ColdFire Compiler > Optimization
ColdFire Compiler > Processor
ColdFire Compiler > Language Settings
ColdFire Assembler
ColdFire Assembler > Input
ColdFire Assembler > General
ColdFire
Preprocessor
ColdFire Preprocessor > Preprocessor Settings
ColdFire
Disassembler
ColdFire Disassembler > Disassembler Settings
ColdFire CPU
Use this panel to specify the CPU type, and the memory model that the architecture uses.
The build tools (compiler, linker, and assembler) then use the properties set in this panel to
generate CPU-specific code.
258
Microcontrollers V10.x Targeting Manual
DRAFT
Build Properties for Bareboard Projects
Build Properties for ColdFire
Figure 3.71 Tool Settings - ColdFire CPU
Table 3.64 lists and describes the ColdFire CPU options.
Table 3.64 Tool Settings - ColdFire CPU Options
Option
Description
Processor Family (-proc)
Lists the processor families supported by the
ColdFire compiler. When you select a
processor from this list, the compiler
generates code that makes use of any of its
hardware features or special instructions.
For more detailed information on the features
of each processor, consult its reference
manual document.
Debugging
Use this panel to specify the whether to generate symbolic information for debugging the
build target (Figure 3.72).
Microcontrollers V10.x Targeting Manual
259
DRAFT
Build Properties for Bareboard Projects
Build Properties for ColdFire
Figure 3.72 Tool Settings - Debugging
Table 3.65 lists and describes the debugging options.
Table 3.65 Tool Settings - Debugging Options
Option
Description
Generate Symbolic Info
Specify whether to generate symbolic
information for debugging:
• Off - Select if you do not want to
generate symbolic information for
debugging the build target.
• On - Select to generate symbolic
information for debugging the build
target.
• Store Full Path Names - Select to
generate symbolic information and
store full path names for
debugging the build target.
Messages
Use this panel to specify the whether to generate symbolic information for debugging the
build target (Figure 3.73).
260
Microcontrollers V10.x Targeting Manual
DRAFT
Build Properties for Bareboard Projects
Build Properties for ColdFire
Figure 3.73 Tool Settings - Messages
Table 3.66 lists and describes the message options.
Table 3.66 Tool Settings - Messages Options
Option
Description
Message Style
List options to select message style.
• GCC(default) — Uses the
message style of the Gnu
Compiler Collection tools
• MPW — Uses the Macintosh
Programmer's Workshop (MPW®)
message style
• Standard — Uses the standard
message style
• IDE — Uses context-free machine
parseable message style
• Enterprise-IDE — Uses
CodeWarrior's Integrated
Development Environment (IDE)
message style.
• Parseable — Uses parseable
message style.
Microcontrollers V10.x Targeting Manual
261
DRAFT
Build Properties for Bareboard Projects
Build Properties for ColdFire
Table 3.66 Tool Settings - Messages Options (continued)
Option
Description
Maximum Number of Errors
Specify the number of errors allowed until
the application stops processing.
Maximum Number of Warnings
Specify the maximum number of warnings.
Librarian
Use this panel to select whether the linker will identify standard libraries (Figure 3.74).
Figure 3.74 Tool Settings - Librarian
Table 3.67 lists and describes the librarian options.
262
Microcontrollers V10.x Targeting Manual
DRAFT
Build Properties for Bareboard Projects
Build Properties for ColdFire
Table 3.67 Tool Settings - Librarian Options
Option
Description
Enable automatic library configurations
Select to let the compiler identify standard
libraries.
Model
Select a standard complying or EWL model
from the drop-down list. EWL lets you
precisely define the I/O operations.
EWL drastically reduces the size of
executables as you explicitly select the
appropriate I/O behavior .
Options are: ewl, c9x, ewl_c++, and
c9x_c++.
Print formats
Select the print formats from the drop-down
list. The available options are: int,
int_FP, int_LL, and int_LL_FP.
Scan formats
Select the scan formats from the drop-down
list. The available options are: int,
int_FP, int_LL, and int_LL_FP.
IO Mode
Select the input-output mode from the dropdown list. The available options are: raw
and buffered.
Burner
Use the Burner for ColdFire Preference Panel to map *.bbl (batch burner language) files to
the Burner Plug-In. When the project folder contains a *.bbl file, *.bbl file processing
during the post-link phase uses the settings in the Burner preference panel.
Figure 3.75 shows the ColdFire Burner settings.
Microcontrollers V10.x Targeting Manual
263
DRAFT
Build Properties for Bareboard Projects
Build Properties for ColdFire
Figure 3.75 Tool Settings > Burner
Table 3.68 lists and describes the burner options for ColdFire.
Table 3.68 Tool Settings - Burner Options
Option
Description
Command
Shows the location of the linker executable
file.
Default value is:"${HC08Tools}/
burner.exe"
All options
Shows the actual command line the burner
will be called with.
Expert Settings
Shows the expert settings command line
parameters; default is ${COMMAND}
${FLAGS} ${INPUTS}.
Command line pattern
Burner > General
Use this panel to specify other flags for the ColdFire Burner to use.
Figure 3.76 shows the General panel.
264
Microcontrollers V10.x Targeting Manual
DRAFT
Build Properties for Bareboard Projects
Build Properties for ColdFire
Figure 3.76 Tool Settings - Burner > General
Table 3.69 lists and describes the general options for ColdFire burner.
Table 3.69 Tool Settings - Burner > General Options
Option
Description
Other flags
Specify additional command line options for
the burner; type in custom flags that are not
otherwise available in the UI.
ColdFire Linker
Use this panel to specify ColdFire linker behavior. You can specify the command, options,
and expert settings for the build tool linker. Additionally, the Linker tree control includes
the input, general, and output settings.
Figure 3.77 shows the ColdFire Linker settings.
Microcontrollers V10.x Targeting Manual
265
DRAFT
Build Properties for Bareboard Projects
Build Properties for ColdFire
Figure 3.77 Tool Settings - ColdFire Linker
Table 3.70 lists and describes the linker options for ColdFire.
Table 3.70 Tool Settings - ColdFire Linker Options
Option
Description
Command
Shows the location of the linker executable
file. Default value is: "${CF_ToolsDir}/
mwldmcf".
All options
Shows the actual command line the ColdFire
linker will be called with.
Expert Settings
Shows the expert settings command line
parameters; default is ${COMMAND}
${FLAGS} ${OUTPUT_FLAG}
${OUTPUT_PREFIX}${OUTPUT}
${INPUTS}.
Command line pattern
ColdFire Linker > Input
Use this panel to specify files the ColdFire Linker should use. You can specify multiple
additional libraries and library search paths. Also, you can change the order in which the
IDE uses or searches the libraries.
Figure 3.78 shows the Input panel.
266
Microcontrollers V10.x Targeting Manual
DRAFT
Build Properties for Bareboard Projects
Build Properties for ColdFire
Figure 3.78 Tool Settings - ColdFire Linker > Input
Table 3.71 lists and describes the input options for ColdFire.
Table 3.71 Tool Settings - ColdFire Linker > Input Options
Option
Description
No Standard Library (-nostdlib)
Select if there is no standard library attached
Link Command File (.lcf)
Consists of three kinds of segments, which
must be in this order:
• A memory segment, which begins
with the MEMORY{} directive
• Optional closure segments, which
begin with the FORCE_ACTIVE{},
KEEP_SECTION{}, or
REF_INCLUDE{} directives
• A sections segment, which begins
with the SECTIONS{} directive
Microcontrollers V10.x Targeting Manual
267
DRAFT
Build Properties for Bareboard Projects
Build Properties for ColdFire
Table 3.71 Tool Settings - ColdFire Linker > Input Options (continued)
Option
Description
Entry Point
Specifies the program starting point: the first
function the debugger uses upon program
start; default: __start.
This default function is in file
ColdFire__startup.c. It sets up the ColdFire
EABI environment before code execution. Its
final task is calling main().
Library Search Paths (-L +path)
Specifies the search pathname of libraries or
other resources related to the project. Type
the pathname into this text box. Alternatively,
click Workspace or File system, then use
the subsequent dialog box to browse to the
correct location.
Library Files ?(-l +file)
Specifies the pathname of libraries or other
resources related to the project. Type the
pathname into this text box. Alternatively,
click Workspace or File system, then use
the subsequent dialog box to browse to the
correct location.
Force Active Symbols
Disables deadstripping for particular
symbols, enter the symbol names in the
Force Active Symbols text box of the
ColdFire Linker Panel.
ColdFire Linker > General
Use this panel to specify the general linker behavior.
Figure 3.79 shows the General panel.
268
Microcontrollers V10.x Targeting Manual
DRAFT
Build Properties for Bareboard Projects
Build Properties for ColdFire
Figure 3.79 Tool Settings - ColdFire Linker > General
Table 3.72 lists and describes the general linker options for ColdFire.
Table 3.72 Tool Settings - ColdFire Linker > General Options
Option
Description
Other Flags
Specify additional command line options for the linker; type in
custom flags that are not otherwise available in the UI.
ColdFire Linker > Output
Use this panel to specify the output settings for the ColdFire linker.
Figure 3.80 shows the Output panel.
Microcontrollers V10.x Targeting Manual
269
DRAFT
Build Properties for Bareboard Projects
Build Properties for ColdFire
Figure 3.80 Tool Settings - ColdFire Linker > Output
Table 3.73 lists and describes the output settings for ColdFire linker.
Table 3.73 Tool Settings - ColdFire Linker > Output Options
270
Option
Description
Output Type
Select application as Application (default), Static Library, or
Shared Library.
Generate Link Map
Check to generate link map.
Generate Link Map
- List Inused
Objects
Check to generate link map and list unused objects; appears
grayed out if the Generate Link Map checkbox is not checked.
Generate Link Map
-Show Transitive
Closure
Check to generate link map and show transitive closure; appears
grayed out if the Generate Link Map checkbox is not checked.
Generate Link Map
-Always Keep Map
Check to generate link map and always keep the map; appears
grayed out if the Generate Link Map checkbox is not checked.
Generate Link Map
- Generate SRecord File
Check to generate link map and generate a S-record file.
Microcontrollers V10.x Targeting Manual
DRAFT
Build Properties for Bareboard Projects
Build Properties for ColdFire
Table 3.73 Tool Settings - ColdFire Linker > Output Options (continued)
Option
Description
Max S-Record
Length
Specify the maximum length for S-record; appears grayed out if
the Generate S-Record File checkbox is not checked. The default
value is 252.
EOL Character
Specify the end-of-line character; appears grayed out if the
Generate S-Record File checkbox is not checked. The default
value is DOS.
Generate Listing
File
Check to generate a listing file named lstfil.lst.
Generate Elf
Symbol Table
Check to generate an ELF symbol table.
Generate Binary
Image
Check to generate a binary image.
Max Bin Record
Specify the maximumvalue for bin record; appears grayed out if
the Generate Binary Image checkbox is not checked. The default
value is 252.
Generate Warning
Messages
Select whether you want to generate warning messages, warn
superseded definitions, or treat warnings as errors.
ColdFire Compiler
Use this panel to specify the command, options, and expert settings for the build tool
compiler. Additionally, the ColdFire Compiler tree control includes the general, include
file search path settings.
Figure 3.81 shows the ColdFire Compiler settings.
Microcontrollers V10.x Targeting Manual
271
DRAFT
Build Properties for Bareboard Projects
Build Properties for ColdFire
Figure 3.81 Tool Settings - ColdFire Compiler
Table 3.74 lists and describes the compiler options for ColdFire.
Table 3.74 Tool Settings - Compiler Options
Option
Description
Command
Shows the location of the linker executable
file. Default value is: "${CF_ToolsDir}/
mwccmcf".
All options
Shows the actual command line the ColdFire
compiler will be called with.
Expert Settings
Shows the expert settings command line
parameters; default is ${COMMAND}
${FLAGS} ${OUTPUT_FLAG}
${OUTPUT_PREFIX}${OUTPUT}
${INPUTS}.
Command line pattern
ColdFire Compiler > Input
Use this panel to specify additional files the ColdFire Compiler should use. You can
specify multiple additional libraries and library search paths. Also, you can change the
order in which the IDE uses or searches the libraries.
272
Microcontrollers V10.x Targeting Manual
DRAFT
Build Properties for Bareboard Projects
Build Properties for ColdFire
Figure 3.82 shows the Input panel.
Figure 3.82 Tool Settings - ColdFire Compiler > Input
Table 3.75 lists and describes the input options for ColdFire compiler.
Table 3.75 Tool Settings - ColdFire Compiler > Input Options
Option
Description
Compile only, So Nt Link (-c)
Check if you want to compile only and do not
want to link the file.
Do not use MWCIncludes variable (nostdinc)
Check if you do not want to use
MWCIncludes variable.
Always Search User Paths (-nosyspath)
Check if you want to always search user
paths.
User Path (-i)
Lists the available user paths.
System Path
Lists the available system paths.
Table 3.76 lists and describes the toolbar buttons that help work with the user and system
search paths.
Microcontrollers V10.x Targeting Manual
273
DRAFT
Build Properties for Bareboard Projects
Build Properties for ColdFire
Table 3.76 Search Paths Toolbar Buttons
Button
Description
Add — Click to open the Add directory
path dialog box (Figure 3.83) and specify
the search path.
Delete — Click to delete the selected search
path. To confirm deletion, click Yes in the
Confirm Delete dialog box.
Edit — Click to open the Edit directory
path dialog box (Figure 3.84) and update
the selected search path.
Move up — Click to move the selected
search path one position higher in the list
Move down — Click to move the selected
search path one position lower in the list
Figure 3.83 shows the Add directory path dialog box.
Figure 3.83 Add directory path Dialog Box
Figure 3.84 shows the Edit directory path dialog box.
274
Microcontrollers V10.x Targeting Manual
DRAFT
Build Properties for Bareboard Projects
Build Properties for ColdFire
Figure 3.84 Edit directory path Dialog Box
The buttons in the Add directory path and Edit directory path dialog boxes help work
with the object file search paths.
• OK — Click to confirm the action and exit the dialog box.
• Cancel — Click to cancel the action and exit the dialog box.
• Workspace — Click to display the Folder Selection dialog box and specify the
object file search path. The resulting path, relative to the workspace, appears in the
appropriate list.
• File system — Click to display the Browse for Folder dialog box and specify the
object file search path. The resulting path appears in the appropriate list.
ColdFire Compiler > Warnings
Use this panel to control how the ColdFire compiler formats the listing file, as well as
error and warning messages.
Figure 3.85 shows the Warnings panel.
Microcontrollers V10.x Targeting Manual
275
DRAFT
Build Properties for Bareboard Projects
Build Properties for ColdFire
Figure 3.85 Tool Settings - ColdFire Compiler > Warnings
Table 3.77 lists and describes the warnings options for ColdFire compiler.
Table 3.77 Tool Settings - ColdFire Compiler > Warnings Options
276
Option
Description
Treat All Warnings As Errors
Check to treat all warnings as errors. The
compiler will stop if it generates a warning
message.
Illegal Pragmas
Check to notify the presence of illegal
pragmas.
Possible Errors
Check to suggest possible errors.
Extended Error Checking
Check if you want to do an extended error
checking.
Microcontrollers V10.x Targeting Manual
DRAFT
Build Properties for Bareboard Projects
Build Properties for ColdFire
Table 3.77 Tool Settings - ColdFire Compiler > Warnings Options (continued)
Option
Description
Hidden virtual functions
Check to generate a warning message if you
declare a non-virtual member function that
prevents a virtual function, that was defined
in a superclass, from being called and is
equivalent to pragma warn_hidevirtual
and the command-line option -warnings
hidevirtual.
Implicit Arithmentic Conversions
Check to warn of implict arithmetic
conversions.
Implicit Integer to Float Conversions
Check to warn of implict conversion of an
integer variable to floating-point type.
Implicit Float to Integer Conversions
Check to warn of implict conversions of a
floating-point variable to integer type.
Implicit Signed/Unsigned Conversion
Check to enable warning of implict
conversions between signed and unsigned
variables.
Pointer/Integral Conversions
Check to enable warnings of conversions
between pointer and integers.
Unused Arguments
Check to warn of unused arguments in a
function.
Unused Variables
Check to warn of unused variables in the
code.
Unused Result From Non-VoidReturning Function
Check to warn of unused result from nonvoid-returning functions.
Missing ‘return’ Statement
Check to warn of when a function lacks a
return statement.
Expression Has No Side Effect
Check to issue a warning message if a
source statement does not change the
program's state. This is equivalent to the
pragma warn_no_side_effect, and the
command-line option -warnings
unusedexpr.
Microcontrollers V10.x Targeting Manual
277
DRAFT
Build Properties for Bareboard Projects
Build Properties for ColdFire
Table 3.77 Tool Settings - ColdFire Compiler > Warnings Options (continued)
Option
Description
Extra Commas
Check to issue a warning message if a list in
an enumeration terminates with a comma.
The compiler ignores terminating commas in
enumerations when compiling source code
that conforms to the ISO/IEC 9899-1999
("C99") standard and is equivalent to pragma
warn_extracomma and the command-line
option -warnings extracomma.
278
Empty Declarations
Check to warn of empty declarations.
Inconsistent ‘class’ / ‘struct’ Usage
Check to warn of inconsistent usage of class
or struct.
Include File Capitalization
Check to issue a warning message if the
name of the file specified in a #include "file"
directive uses different letter case from a file
on disk and is equivalent to pragma
warn_filenamecaps and the commandline option -warnings filecaps.
Check System Includes
Check to issue a warning message if the
name of the file specified in a #include <file>
directive uses different letter case from a file
on disk and is equivalent to pragma
warn_filenamecaps_system and the
command-line option -warnings
sysfilecaps.
Pad Bytes Added
Check to issue a warning message when the
compiler adjusts the alignment of
components in a data structure and is
equivalent to pragma warn_padding and
the command-line option -warnings
padding.
Undefined Macro in #if
Check to issues a warning message if an
undefined macro appears in #if and #elif
directives and is equivalent to pragma
warn_undefmacro and the command-line
option -warnings undefmacro.
Microcontrollers V10.x Targeting Manual
DRAFT
Build Properties for Bareboard Projects
Build Properties for ColdFire
Table 3.77 Tool Settings - ColdFire Compiler > Warnings Options (continued)
Option
Description
Non-Inlined Functions
Check to issue a warning message if a call to
a function defined with the inline, __inline__,
or __inline keywords could not be replaced
with the function body and is equivalent to
pragma warn_notinlined and the
command-line option -warnings
notinlined.
Token not formed by ## operator
Check to enable warnings for the illegal uses
of the preprocessor’s token concatenation
operator (##). It is equivalent to the pragma
warn_illtokenpasting on.
ColdFire Compiler > Optimization
Use this panel to control compiler optimizations. The compiler’s optimizer can apply any
of its optimizations in either global or non-global optimization mode. You can apply
global optimization at the end of the development cycle, after compiling and optimizing
all source files individually or in groups.
Figure 3.86 shows the Optimization panel.
Microcontrollers V10.x Targeting Manual
279
DRAFT
Build Properties for Bareboard Projects
Build Properties for ColdFire
Figure 3.86 Tool Settings - ColdFire Compiler > Optimization
Table 3.78 lists and defines each option of the Optimization panel.
280
Microcontrollers V10.x Targeting Manual
DRAFT
Build Properties for Bareboard Projects
Build Properties for ColdFire
Table 3.78 Tool Settings - ColdFire Compiler > Optimization Options
Option
Description
Optimization Level (-opt)
Specify the optimizations that you want the
compiler to apply to the generated object code:
• 0—Disable optimizations. This setting is
equivalent to specifying the -O0
command-line option. The compiler
generates unoptimized, linear
assembly-language code.
• 1—The compiler performs all targetindependent (that is, non-parallelized)
optimizations, such as function inlining.
This setting is equivalent to specifying
the -O1 command-line option.
The compiler omits all target-specific
optimizations and generates linear
assembly-language code.
• 2—The compiler performs all
optimizations (both target-independent
and target-specific). This setting is
equivalent to specifying the -O2
command-line option. The compiler
outputs optimized, non-linear,
parallelized assembly-language code.
• 3—The compiler performs all the level 2
optimizations, then the low-level
optimizer performs global-algorithm
register allocation. This setting is
equivalent to specifying the -O3
command-line option.
At this optimization level, the compiler generates
code that is usually faster than the code
generated from level 2 optimizations.
Speed Vs Size
Use to specify an Optimization Level greater
than 0.
• Speed—The compiler optimizes object
code at the specified Optimization
Level such that the resulting binary file
has a faster execution speed, as
opposed to a smaller executable code
size.
• Size—The compiler optimizes object
code at the specified Optimization
Level such that the resulting binary file
has a smaller executable code size, as
opposed to a faster execution speed.
This setting is equivalent to specifying
the -Os command-line option.
Microcontrollers V10.x Targeting Manual
281
DRAFT
Build Properties for Bareboard Projects
Build Properties for ColdFire
Table 3.78 Tool Settings - ColdFire Compiler > Optimization Options (continued)
Option
Description
Inlining
Enables inline expansion. If there is a #pragma
INLINE before a function definition, all calls of this
function are replaced by the code of this function,
if possible.
Using the -Oi=c0 option switches off inlining.
Functions marked with the #pragma INLINE are
still inlined. To disable inlining, use the -Oi=OFF
option.
Bottom-up Inlining
Check to control the bottom-up function inlining
method. When active, the compiler inlines
function code starting with the last function in the
chain of functions calls, to the first one.
ColdFire Compiler > Processor
Use this panel to specify processor behavior. You can specify the file paths and define
macros.
Figure 3.87 shows the Processor panel.
282
Microcontrollers V10.x Targeting Manual
DRAFT
Build Properties for Bareboard Projects
Build Properties for ColdFire
Figure 3.87 Tool Settings - ColdFire Compiler > Processor
Table 3.79 lists and defines each option of the Processor panel.
Microcontrollers V10.x Targeting Manual
283
DRAFT
Build Properties for Bareboard Projects
Build Properties for ColdFire
Table 3.79 Tool Settings - ColdFire Compiler > Processor Options
Option
Description
Struct Align (-align)
Specifies record and structure alignment in
memory:
• Byte — Aligns all fields on 1 byte
boundaries
• 68k (word) — Aligns all fields on
word boundaries
• coldfire (long) — Aligns all fields
on long word boundaries
• Default — Coldfire (long).
This panel element corresponds to the
options align pragma.
Note: When you compile and link, ensure
that alignment is the same for all files and
libraries.
Code Model
Specifies access addressing for data and
instructions in the object code:
• Smart — Relative (16-bit) for
function calls in the same
segment; otherwise absolute (32bit)
• Near (16 bit) — Relative for all
function calls
• Far (32 bit) — Absolute for all
function calls
Data Model
Specifies global-data storage and reference:
• Far (32 bit) — Storage in far data
space; available memory is the
only size limit.
• Near (16 bit) — Storage in near
data space; size limit is 64K.
• Default — Far (32 bit).
This panel element corresponds the far_data
pragma
284
Microcontrollers V10.x Targeting Manual
DRAFT
Build Properties for Bareboard Projects
Build Properties for ColdFire
Table 3.79 Tool Settings - ColdFire Compiler > Processor Options (continued)
Option
Description
Floating Point
Specifies handling method for floating point
operations:
• Software — C runtime library
code emulates floating-point
operations.
• Hardware — Processor hardware
performs floating point operations;
only appropriate for processors
that have floating-point units.
• None
Default: Software
For software selection, your project must
include the appropriate FP_ColdFire C
runtime library file.
Grayed out if your target processor lacks an
FPU.
A6 Stack Frame (-a6)
Clear to disable call-stack tracing; generates
faster and smaller code.
By default, the option is checked.
Pool Sections (-pool)
Check to collect all string constants into a
single data object so your program needs
one data section for all of them.
Generate Code for Profiling (-profile)
Check to enable the processor generate
code for use with a profiling tool. Checking
this box corresponds to using the commandline option -profile. Clearing this
checkbox is equivalent to using the
command-line option -noprofile
Position-Independent Code (-pic)
Check to generate position independent
code (PIC) that is non relocatable.
Position-Independent Data (-pid)
Check to generate non-relocatable positionindependent data (PID). PID is available with
16- and 32-bit addressing.
Register Coloring (-coloring)
Clear to enable the Compiler force all local
variables to be stack-based except for
compiler generated temporaries.
Microcontrollers V10.x Targeting Manual
285
DRAFT
Build Properties for Bareboard Projects
Build Properties for ColdFire
Table 3.79 Tool Settings - ColdFire Compiler > Processor Options (continued)
Option
Description
Instruction Scheduling (-scheduling)
Clear to prevent from scheduling
instructions.
Peephole (-peephole)
Clear to prevent the compiler from compiling
long instruction sequences into compact
ones.
By default, the option is checked.
When on (default setting) it does not affect
debugging unless the resulting instruction is
a memory-to-memory operation which might
make a variable used as temporary
disappear.
Use .sdata.sbiss for (byte in integer
between -1.32K)
The options are:
• All data — Select this option
button to store all data items in the
small data address space
• All data smaller than — Select this
option button to specify the
maximum size for items stored in
the small data address space;
enter the maximum size in the text
box. Using the small data area
speeds data access, but has
ramifications for the hardware
memory map. The default settings
specify not using the small data
area.
By default,All data smaller than is checked.
ColdFire Compiler > Language Settings
Use this panel direct the ColdFire compiler to apply specific processing modes to the
language source code. You can compile source files with just one collection at a time. To
compile source files with multiple collections, you must compile the source code
sequentially. After each compile iteration change the collection of settings that the
ColdFire compiler uses.
Figure 3.88 shows the Language Settings panel.
286
Microcontrollers V10.x Targeting Manual
DRAFT
Build Properties for Bareboard Projects
Build Properties for ColdFire
Figure 3.88 Tool Settings - ColdFire Compiler > Language Settings
Table 3.80 lists and defines each option of the Language Settings panel.
Table 3.80 Tool Settings - ColdFire Compiler > Language Settings Options
Option
Description
Require Prototypes (-requireprotos)
Check to enforce the requirement of function
prototypes. the compiler generates an error
message if you define a previously
referenced function that does not have a
prototype. If you define the function before it
is referenced but do not give it a prototype,
this setting causes the compiler to issue a
warning message.
Enable C++ ‘bool’ type, ‘true’ and ‘false’
Constants (-bool)
Check to enable the C++ compiler
recognize the bool type and its true and false
values specified in the ISO/IEC 14882-1998
C++ standard; is equivalent to pragma bool
and the command-line option -bool.
Microcontrollers V10.x Targeting Manual
287
DRAFT
Build Properties for Bareboard Projects
Build Properties for ColdFire
Table 3.80 Tool Settings - ColdFire Compiler > Language Settings Options (continued)
288
Option
Description
ISO C++ Template Parser (iso_templates)
Check to follow the ISO/IEC 14882-1998
standard for C++ to translate templates,
enforcing more careful use of the typename
and template keywords. The compiler also
follows stricter rules for resolving names
during declaration and instantiation and is
equivalent to pragma parse_func_templ
and the command-line option iso_templates .
Use Instance Manager (-inst)
Check to reduce compile time by generating
any instance of a C++ template (or noninlined inline) function only once.
Force C++ Compilation (-lang c99)
Check to translates all C source files as C++
source code and is equivalent to pragma
cplusplus and the command-line option lang c++.
Enable GCC extensions (-gcc)
Check to recognize language features of the
GNU Compiler Collection (GCC) C compiler
that are supported by CodeWarrior
compilers; is equivalent to pragma
gcc_extensions and the command-line
option -gcc_extensions.
Enable C99 Extensions (-lang c99)
Check to recognize ISO/IEC 9899-1999
("C99") language features; is equivalent to
pragma c99 and the command-line option dialect c99.
Enable C++ Exceptions (Cpp_Exceptions)
Check to generate executable code for C++
exceptions; is equivalent to pragma
exceptions and the command-line option cpp_exceptions.
Enable RTTI (-RTTI)
Check to allow the use of the C++ runtime
type information (RTTI) capabilities,
including the dynamic_cast and typeid
operators; is equivalent to pragma RTTI and
the command-line option -RTTI.
Microcontrollers V10.x Targeting Manual
DRAFT
Build Properties for Bareboard Projects
Build Properties for ColdFire
Table 3.80 Tool Settings - ColdFire Compiler > Language Settings Options (continued)
Option
Description
Enable wchar_tSupport
Check to enable C++ compiler recognize
the wchar_t data type specified in the ISO/
IEC 14882-1998 C++ standard; is equivalent
to pragma wchar_type and the commandline option -wchar_t.
ANSI Strict
Check to enable C compiler operate in strict
ANSI mode. In this mode, the compiler
strictly applies the rules of the ANSI/ISO
specification to all input files. This setting is
equivalent to specifying the - ansi
command-line option. The compiler issues a
warning for each ANSI/ISO extension it finds.
ANSI Keywords Only
Check to generate an error message for all
non-standard keywords (ISO/IEC 9899-1990
C, §6.4.1). If you must write source code that
strictly adheres to the ISO standard, enable
this setting; is equivalent to pragma
only_std_keywords and the commandline option -stdkeywords.
Expand Trigraphs
Check to recognize trigraph sequences
(ISO/IEC 9899-1990 C, §5.2.1.1); is
equivalent to pragma trigraphs and the
command-line option -trigraphs.
Legacy for-scoping
Check to generate an error message when
the compiler encounters a variable scope
usage that the ISO/IEC 14882-1998 C++
standard disallows, but is allowed in the C++
language specified in The Annotated C++
Reference Manual ("ARM"); is equivalent to
pragma ARM_scoping and the commandline option -for_scoping.
Enum Always Int
Check to use signed integers to represent
enumerated constants and is equivalent to
pragma enumsalwaysint and the
command-line option -enum.
Use Unsigned Chars
Check to treat char declarations as
unsigned char declarations and is equivalent
to pragma unsigned_char and the
command-line option -char unsigned.
Microcontrollers V10.x Targeting Manual
289
DRAFT
Build Properties for Bareboard Projects
Build Properties for ColdFire
Table 3.80 Tool Settings - ColdFire Compiler > Language Settings Options (continued)
Option
Description
Pool Strings
Check to collect all string constants into a
single data section in the object code it
generates and is equivalent to pragma
pool_strings and the command-line
option -strings pool.
Reuse Strings
Check to store only one copy of identical
string literals and is equivalent to opposite of
the pragma dont_reuse_strings and the
command-line option -string reuse.
IPA
Specifies the Interprocedural Analysis (IPA)
policy.
• Off — No interprocedural analysis,
but still performs function-level
optimization. Equivalent to the "no
deferred inlining" compilation
policy of older compilers.
• File — Completely parse each
translation unit before generating
any code or data. Equivalent to the
"deferred inlining" option of older
compilers. Also performs an early
dead code and dead data analysis
in this mode. Objects with
unreferenced internal linkages will
be dead-stripped in the compiler
rather than in the linker.
• Program —Completely parse the
entire program before optimizing
and generating code, providing
many optimization benefits. For
example, the compiler can autoinline functions that are defined in
another translation unit.
Other flags
Specify additional command line options for
the compiler; type in custom flags that are
not otherwise available in the UI.
ColdFire Assembler
Use this panel to specify the command, options, and expert settings for the build tool
assembler. Additionally, the Assembler tree control includes the general and include file
search path settings.
Figure 3.89 shows the Assembler settings.
290
Microcontrollers V10.x Targeting Manual
DRAFT
Build Properties for Bareboard Projects
Build Properties for ColdFire
Figure 3.89 Tool Settings - ColdFire Assembler
Table 3.81 lists and defines each option of the ColdFire Assembler panel.
Table 3.81 Tool Settings - ColdFire Assembler Options
Option
Description
Command
Shows the location of the assembler
executable file.
All options
Shows the actual command line the
assembler will be called with.
Expert Settings
Shows the expert settings command line
parameters; default is ${COMMAND}
${FLAGS} ${OUTPUT_FLAG}
${OUTPUT_PREFIX}${OUTPUT}
${INPUTS}.
Command line pattern
ColdFire Assembler > Input
Use this panel to specify additional files the ColdFire Assembler should use. You can
specify multiple additional libraries and library search paths. Also, you can change the
order in which the IDE uses or searches the libraries.
Microcontrollers V10.x Targeting Manual
291
DRAFT
Build Properties for Bareboard Projects
Build Properties for ColdFire
Figure 3.90 shows the Input panel.
Figure 3.90 Tool Settings - ColdFire Assembler > Input
Table 3.82 lists and describes the input options for ColdFire assembler.
Table 3.82 Tool Settings - ColdFire Compiler > Input Options
Option
Description
User Path (-i)
Lists the available user paths.
System Path
Lists the available system paths.
Table 3.83 lists and describes the toolbar buttons that help work with the user and system
search paths.
292
Microcontrollers V10.x Targeting Manual
DRAFT
Build Properties for Bareboard Projects
Build Properties for ColdFire
Table 3.83 Search Paths Toolbar Buttons
Button
Description
Add — Click to open the Add directory
path dialog box (Figure 3.91) and specify
the search path.
Delete — Click to delete the selected search
path. To confirm deletion, click Yes in the
Confirm Delete dialog box.
Edit — Click to open the Edit directory
path dialog box (Figure 3.92) and update
the selected search path.
Move up — Click to move the selected
search path one position higher in the list
Move down — Click to move the selected
search path one position lower in the list
Figure 3.91 shows the Add directory path dialog box.
Figure 3.91 Add directory path Dialog Box
Figure 3.92 shows the Edit directory path dialog box.
Microcontrollers V10.x Targeting Manual
293
DRAFT
Build Properties for Bareboard Projects
Build Properties for ColdFire
Figure 3.92 Edit directory path Dialog Box
The buttons in the Add directory path and Edit directory path dialog boxes help work
with the object file search paths.
• OK — Click to confirm the action and exit the dialog box.
• Cancel — Click to cancel the action and exit the dialog box.
• Workspace — Click to display the Folder Selection dialog box and specify the
object file search path. The resulting path, relative to the workspace, appears in the
appropriate list.
• File system — Click to display the Browse for Folder dialog box and specify the
object file search path. The resulting path appears in the appropriate list.
ColdFire Assembler > General
Use this panel to specify the general assembler behavior.
Figure 3.93 shows the General panel.
294
Microcontrollers V10.x Targeting Manual
DRAFT
Build Properties for Bareboard Projects
Build Properties for ColdFire
Figure 3.93 Tool Settings - ColdFire Assembler > General
Figure 3.85 lists and describes the general assembler options for ColdFire.
Table 3.84 Tool Settings - Assembler > General Options
Option
Description
Label Must End
With ‘:’
Clear if system does not require labels to end with colons. By
default, the option is checked.
Directives Begin
With ‘.’
Clear if the system does not require directives to start with
periods. By default, the option is checked.
Case Sensitive
Identifier
Clear to instruct the assembler to ignore case in identifiers. By
default, the option is checked.
Allow Space In
Operand Field
Clear to restrict the assembler from adding spaces in operand
fields. By default, the option is checked.
Other Flags
Specify additional command line options for the assembler; type
in custom flags that are not otherwise available in the UI.
Microcontrollers V10.x Targeting Manual
295
DRAFT
Build Properties for Bareboard Projects
Build Properties for ColdFire
ColdFire Preprocessor
Use this panel to specify preprocessor behavior and define macros.
Figure 3.94 shows the Preprocessor panel.
Figure 3.94 Tool Settings - ColdFire Preprocessor
Figure 3.46 lists and describes the preprocessor options for ColdFire.
Table 3.85 Tool Settings - ColdFire Preprocessor Options
Option
Description
Command
Shows the location of the disassembler
executable file
All options
Shows the actual command line the
preprocessor will be called with
Expert Settings
Shows the expert settings command line
parameters; default ${COMMAND}
${FLAGS} ${INPUTS}
Command line pattern
296
Microcontrollers V10.x Targeting Manual
DRAFT
Build Properties for Bareboard Projects
Build Properties for ColdFire
ColdFire Preprocessor > Preprocessor Settings
Use this panel to specify preprocessor behavior.
Figure 3.95 shows the Preprocessor panel.
Figure 3.95 Tool Settings - ColdFire Preprocessor> Preprocessor Settings
Table 3.86 lists and describes the preprocessor options for ColdFire.
Table 3.86 Tool Settings - ColdFire Compiler > Preprocessor Options
Option
Description
Emit file change (-ppopt break)
Check to notify file changes (or #line
changes) appear in the output.
Emit #pragmas (-ppopt pragma)
Check to show pragma directives in the
preprocessor output. Essential for producing
reproducible test cases for bug reports.
Show full path (-ppopt full)
Check to display file changes in comments
(as before) or in #line directives.
Keep comment (-ppopt comment)
Check to display comments in the
preprocessor output.
Microcontrollers V10.x Targeting Manual
297
DRAFT
Build Properties for Bareboard Projects
Build Properties for ColdFire
Table 3.86 Tool Settings - ColdFire Compiler > Preprocessor Options (continued)
Option
Description
Use #include line (-ppopt line)
Check to display file changes in comments
(as before) or in #line directives.
Keep whitespace (-ppopt nospace)
Check to copy whitespaces in preprocessor
output. This is useful for keeping the starting
column aligned with the original source,
though the compiler attempts to preserve
space within the line. This does not apply
when macros are expanded.
ColdFire Disassembler
Use this panel to specify the command, options, and expert settings for ColdFire
Disassembler.
Figure 3.96 shows the ColdFire Disassembler page.
Figure 3.96 Tool Settings - ColdFire Disassembler
Table 3.87 lists and describes the ColdFire disassembler options.
298
Microcontrollers V10.x Targeting Manual
DRAFT
Build Properties for Bareboard Projects
Build Properties for ColdFire
Table 3.87 Tool Settings - Linker Options
Option
Description
Command
Shows the location of the disassembler
executable file
All options
Shows the actual command line the linker
will be called with
Expert Settings
Shows the expert settings command line
parameters; default is${COMMAND} -dis
${FLAGS} ${INPUTS}
Command line pattern
ColdFire Disassembler > Disassembler Settings
Use this panel to control how the disassembler formats the listing file, as well as error and
warning messages. You can specify verbosity of messages, whether to show headers, core
modules, extended mnemonics, addresses, object or source code, ldata modules, exception
tables, and debug information.
Figure 3.97 shows the ColdFire Disassembler settings.
Figure 3.97 Tool Settings - ColdFire Disassembler Settings
Microcontrollers V10.x Targeting Manual
299
DRAFT
Build Properties for Bareboard Projects
Build Properties for ColdFire
Table 3.88 lists and describes the ColdFire disassembler settings.
Table 3.88 Tool Settings - ColdFire Disassembler Options
300
Option
Description
Show Headers
Check to display headers in the listing file;
disassembler writes listing headers, titles,
and subtitles to the listing file
Show Symbol and String Tables
Check to display symbol and string tables
directives to the listing file
Verbose Info
Check to shows each command line that it
passes to the shell, along with all progress,
error, warning, and informational messages
that the tools emit
Show Core Modules
Check to show core modules in the listing file
Show Extended Mnemonics
Check to show the extended mnemonics in
the listing file
Show Addresses and Object Code
Check to show the addresses and object
code in the listing file
Show Source Code
Check to show the source code in the listing
file
Show Comments
Check to show the comments in the listing
file
Show Data Modules
Check to show the data modules in the listing
file
Disassemble Exception Tables
Check to disassemble exception tables in the
listing file
Show Debug Info
Check to generate symbolic information for
debugging the build target
Microcontrollers V10.x Targeting Manual
DRAFT
4
Working with Debugger
This chapter explains how to use the CodeWarrior™ development tools to debug the bare
board and externally built executable files for microcontrollers.
This chapter also documents debugger features that are specific to the CodeWarrior
Development Studio for Microcontrollers product. For documentation of debugger
features that are common in all CodeWarrior products, refer to the Freescale Eclipse
Extensions Guide.
The topics in this chapter are:
• Standard Debugging Features
• Debugging Bare Board Software
• Debugging Externally Built Executable Files
Standard Debugging Features
This topic describes debugging features that apply to all of the microcontrollers:
• CodeWarrior Debugger Settings
• Debugging Code
• Attaching Processes
• Connecting Target
CodeWarrior Debugger Settings
A CodeWarrior project can have multiple associated launch configurations. A launch
configuration is a named collection of settings that the CodeWarrior tools use.
The CodeWarrior project wizard generates launch configurations with names that follow
the pattern projectname - configtype - targettype, where:
• projectname represents the name of the project
• configtype represents the type of launch configuration
• targettype represents the type of target software or hardware on which the launch
configuration acts
Launch configurations for debugging code let you specify settings, such as:
Microcontrollers V10.x Targeting Manual
301
DRAFT
Working with Debugger
Standard Debugging Features
• the files that belong to the launch configuration
• behavior of the debugger and the related debugging tools
Editing Debugger Settings
When you use the CodeWarrior wizard to create a new project, the wizard sets the
debugger settings of the project's launch configurations to default values. You can change
these default values based on your program’s requirements.
To modify the debugger settings:
1. Start the CodeWarrior IDE.
2. From the main menu bar of the IDE, select Run > Debug Configurations.
The Debug Configurations dialog box appears. The left side of this window has a list
of debug configurations that apply to the current application.
3. Expand the CodeWarrior Download configuration.
4. From the expanded list, select the debug configuration that you want to modify.
Figure 4.1 shows the Debug Configurations dialog box with the settings for the
debug configuration you selected.
Figure 4.1 Debug Configurations Dialog Box
302
Microcontrollers V10.x Targeting Manual
DRAFT
Working with Debugger
Standard Debugging Features
5. In the group of tabs in the upper-right side of the window, click the Debugger tab.
The debugger setting page appears in the area beneath the tabs (Figure 4.2.)
Figure 4.2 Debugger Page
6. Change the settings on this page as per your requirements. Refer Table 4.1 for details
on the various settings of this page.
7. Click Apply to save the new settings.
8. Click Revert to undo any of the unsaved changes.
The IDE restores the last set of saved settings to all pages of the Debug
Configurations dialog box. Also, the IDE disables Revert until you make new
pending changes.
Reverting Debugger Settings
As you modify a launch configuration's debugger settings, you create pending, or unsaved,
changes to that launch configuration.
• To save the pending changes, you must click the Apply button of the Debug
Configurations dialog box, or click the Close button and then the Yes button.
You can revert pending changes and restore their last saved settings:
• To undo pending changes, click the Revert button at the bottom of the Debug
Configurations dialog box.
The IDE restores the last set of saved settings to all pages of the Debug Configurations
dialog box. Also, the IDE disables the Revert button until you make new pending
changes.
Microcontrollers V10.x Targeting Manual
303
DRAFT
Working with Debugger
Standard Debugging Features
Debugger Settings for Supported
Microcontrollers
You select the debugger to use from the Debugger list box at the top of the Debugger
page. These are the debugger types:
• CodeWarrior Debugger for HCS08
• CodeWarrior Debugger for RS08
• CodeWarrior Debugger for ColdFire
• CodeWarrior Linux Application Debugger for ColdFire.
After you have selected the debugger, you next use the settings tabs within the Debugger
Options area to modify its settings.
This topic covers the settings tabs for the CodeWarrior Debugger for the various
microcontrollers. Table 4.1 lists the settings for the various debuggers.
The tabs are also organized into sub-topics whose settings apply only to specific
microcontrollers. There is also a sub-section whose settings apply to all of them. These
sub-topics are:
• HCS08-specific Settings
• RS08-specific Settings
• ColdFire-specific Settings
• Settings Common to all Microcontrollers
Table 4.1 Debugger Setting Tabs
Debugger
Debugger Settings
CodeWarrior Debugger for HCS08
HCS08 Tab
Download Tab
Connection Tab — HCS08
PIC Tab
Other Executables Tab
Symbolics Tab
304
Microcontrollers V10.x Targeting Manual
DRAFT
Working with Debugger
Standard Debugging Features
Table 4.1 Debugger Setting Tabs (continued)
Debugger
Debugger Settings
CodeWarrior Debugger for RS08
RS08 Tab
Download Tab
Connection Tab — RS08
PIC Tab
Other Executables Tab
Symbolics Tab
CodeWarrior Debugger for ColdFire
ColdFire Tab
Exceptions Tab — ColdFire
Reset Tab — ColdFire
Interrupts Tab — ColdFire
Download Tab
Connection Tab — ColdFire
PIC Tab
Remote Tab — ColdFire
Other Executables Tab
Symbolics Tab
OS Awareness Tab — ColdFire
CodeWarrior Linux Application
Debugger for ColdFire
ColdFire — Linux Applications Tab
Connection Tab — ColdFire Linux
Remote Tab — ColdFire
Other Executables Tab
Symbolics Tab
HCS08-specific Settings
The following debugger tab manages the settings specific to the HCS08 microcontroller.
Microcontrollers V10.x Targeting Manual
305
DRAFT
Working with Debugger
Standard Debugging Features
HCS08 Tab
Use this tab to specify the processor derivative, simulator/emulator option, target
initialization files, and memory configuration files. Figure 4.3 shows the HCS08 tab.
Figure 4.3 HCS08 Tab
Table 4.2 describes the debugger settings for the HCS08 tab.
Table 4.2 HCS08 Tab — Debugger Settings
Option
Description
Target Processor
Specifies the target hardware on which you debug the generated
binary file.
Simulator/Emulator
Specifies the simulator or emulator to be used to debug the
program.
Select the appropriate option from the listbox.
306
Microcontrollers V10.x Targeting Manual
DRAFT
Working with Debugger
Standard Debugging Features
Table 4.2 HCS08 Tab — Debugger Settings (continued)
Option
Description
Initialize Target
Specifies the target initialization file to be used by the debugger at
the start of each debugging session
Check this option to activate the Target Initialization File text box
where you can specify the path of the initialization file.
Alternatively, you can specify the file path by using any of the
buttons listed below:
• Workspace — Opens a dialog box where you can
specify the initialization file in terms of a location
relative to the IDE's workspace directory. After you
select the file, the path to that file appears in the Target
Initialization File text box, relative to the path of the
variable workspace_loc. The IDE resolves this
variable to the absolute file system path of the
workspace directory root.
• File System — Opens a dialog box where you can
browse for the initialization file. After you select the file,
the absolute path to that file appears in the Target
Initialization File text box.
• Variables — Opens a dialog box where you can
specify the initialization file in terms of IDE path
variables. After you specify the file, the path to that file
appears in the Target Initialization File text box, relative
to the path variables that you use. The IDE resolves
each path variable as explained in the Variable
Description box at the bottom of the Select Variable
dialog box.
Clear this option if you want the debugger to use a default target
initialization file.
Microcontrollers V10.x Targeting Manual
307
DRAFT
Working with Debugger
Standard Debugging Features
Table 4.2 HCS08 Tab — Debugger Settings (continued)
Option
Description
Use Memory
Configuration File
Specifies the memory configuration file to be used by the
debugger at the start of each debugging session.
Check this option to activate the Memory Configuration File text
box where you can specify the path of the configuration file.
Alternatively, you can specify the file path by using any of the
buttons listed below:
• Workspace — Opens a dialog box where you can
specify the initialization file in terms of a location
relative to the IDE's workspace directory. After you
specify the file, the path to that file appears in the
Memory Configuration File text box, relative to the path
of the variable workspace_loc. The IDE resolves this
variable to the absolute file system path of the
workspace directory root.
• File System — Opens a dialog box where you can
browse for the initialization file. After you specify the
file, the absolute path to that file appears in the Memory
Configuration File text box.
• Variables — Opens a dialog box where you can
specify the initialization file in terms of IDE path
variables. After you specify the file, the path to that file
appears in the Memory Configuration File text box,
relative to the path variables that you use. The IDE
resolves each path variable as explained in the
Variable Description box at the bottom of the Select
Variable dialog box.
Check the Use Default option to use the default memory
configuration file and to deactivate the Memory Configuration File
text box and the three buttons.
Use Default
Check this checkbox to use the default memory configuration file.
Connection Tab — HCS08
Use this tab to specify the connection interface that the debugger uses to communicate
with the HCS08 on the target hardware. Figure 4.4 shows the Connection tab.
308
Microcontrollers V10.x Targeting Manual
DRAFT
Working with Debugger
Standard Debugging Features
Figure 4.4 Connection Tab — HCS08
Table 4.3 describes the debugger settings on the Connection tab.
Table 4.3 Connection Tab — HCS08 Settings
Option
Description
Connection Protocol
Specifies the protocol used to manage communications
between the debugger and the target.
Enable Logging
Specifies if the debugger’s communications is logged.
Check this option to have the debugger’s
communications session logged to the Console in the
Debug view.
Clear this option to disable logging.
Microcontrollers V10.x Targeting Manual
309
DRAFT
Working with Debugger
Standard Debugging Features
Table 4.3 Connection Tab — HCS08 Settings (continued)
Option
Description
Connection
Specifies the hardware interface used to connect the
workstation to the target. The Connection drop-down list
contains the following values:
• Generic — Use this setting if you manually
launch and configure the connection-protocol
service (such as CCS), or if you are debugging
code with a simulator. It is used to
communicate with the instruction set simulator
and to configure hardware probes not predefined in the Physical Connection option. The
Connection tab displays a table of named
attributes and their assigned values. These
attribute/value pairs are used to configure the
characteristics of the interface. For more
information, refer to the topic Softec.
• SofTec — Use this setting to connect a
SofTec HCS08 probe with the target
hardware. When the debugger runs the
SofTec HCS08 connection, it can
communicate and debug HCS08 core-based
hardware connected through the SofTec incircuit debugger/programmer units — SofTec
Microsystems HCS08 ISP Debuggers/
Programmers (inDART Series) and Starter
Kits (PK and newer Series). For more
information, refer to the topic Softec.
Note: Refer to the inDART®-HCS08 In-Circuit
Debugger/Programmer for Freescale HCS08 Family
FLASH Devices User’s Manual from SofTec for
communication hardware requirements and SofTec
product installation.
Connection
• P&E HCS08 Multilink/Cyclone Pro — Use
this setting to connect a P&E Multilink/Cyclone
Pro probe with the target hardware. For more
information, refer to the topics P&E HCS08
Multilink\Cyclone Pro and P&E HCS08
Multilink\Cyclone Pro Connection-Specific
Options.
• OSBDM — The 8/16 bits debugger (and then
the CodeWarrior IDE) can be connected to
HCS08 hardware using the HCS08 OSBDM
(Open Source BDM) cable. When the
debugger runs the HCS08 Open Source BDM
connection, it can communicate and debug
HCS08 core-based hardware connected
through the Open Source BDM Interface as
described at the Freescale Semiconductor
web site: http://www.freescale.com (keyword:
OSBDM08). For more information, refer to the
topic Open Source BDM.
310
Microcontrollers V10.x Targeting Manual
DRAFT
Working with Debugger
Standard Debugging Features
Table 4.3 Connection Tab — HCS08 Settings (continued)
Option
Description
Attribute
Specifies an interface characteristic or option.
Value
Describes the current value or setting applied to the
attribute.
Add
Click to add a new attribute/value pair. For more
information, refer to the topic Add Attribute/Value.
Remove
Click to remove an existing attribute/value pair. For more
information, refer to the topic Remove Attribute/Value.
The following topics explain how to add, modify, and delete entries in the Attribute/Value
table:
• Add Attribute/Value
• Edit Existing Attribute/Value
• Remove Attribute/Value
Add Attribute/Value
To add a new attribute/value pair, perform these steps.
1. Click Add.
The default entry New attribute appears in the Attribute column of the table, and
the default entry value appears in the Value column. The new attribute’s name is
highlighted.
2. Type in a name for an attribute into this field, using alphanumeric characters only. The
text replaces the default name.
3. Click on value.
The text in this text box is highlighted.
4. Type in a value to replace the default value.
5. To save the changes, click Apply.
Edit Existing Attribute/Value
To modify an attribute/value pair already in the table:
1. Click on an attribute name in the Attribute column of the table.
The attribute name is highlighted.
Microcontrollers V10.x Targeting Manual
311
DRAFT
Working with Debugger
Standard Debugging Features
2. Type in the name of the new attribute into this field, using alphanumeric characters
only.
The text replaces the previous name.
3. Click on the value field.
The text in this text box is highlighted.
4. Type in a value to replace the previous value.
5. To save the changes, click Apply.
Remove Attribute/Value
To delete an existing attribute/pair in the table:
1. Double-click on the row of an attribute/pair in the table.
The row is highlighted.
2. Click Remove.
The row containing the selected attribute/value is deleted.
3. Click Apply to save any changes.
NOTE
For more information on the physical connection options presented with the
option of probe, refer to the chapter Connections — HCS08.
RS08-specific Settings
The following debugger tabs manage the settings specific to the RS08 microcontroller.
RS08 Tab
Use this tab to specify the target processor, simulator/emulator option, target initialization
files, and memory configuration files. Figure 4.5 shows the RS08 tab.
312
Microcontrollers V10.x Targeting Manual
DRAFT
Working with Debugger
Standard Debugging Features
Figure 4.5 RS08 Tab
Table 4.4 describes the debugger settings on the RS08 tab.
Table 4.4 RS08 Tab — Debugger Settings
Option
Description
Target Processor
Specifies the target hardware on which you debug the generated
binary file.
Simulator/Emulator
Specifies the simulator or emulator to be used to debug the
program.
Select the appropriate option from the drop-down list.
Microcontrollers V10.x Targeting Manual
313
DRAFT
Working with Debugger
Standard Debugging Features
Table 4.4 RS08 Tab — Debugger Settings (continued)
Option
Description
Initialize Target
Specifies the target initialization file to be used by the debugger at
the start of each debugging session
Check this option to activate the Target Initialization File text box
where you can specify the path of the initialization file.
Alternatively, you can specify the file path by using any of the
buttons listed below:
• Workspace — Opens a dialog box where you can
specify the initialization file in terms of a location
relative to the IDE's workspace directory. After you
select the file, the path to that file appears in the Target
Initialization File text box, relative to the path of the
variable workspace_loc. The IDE resolves this
variable to the absolute file system path of the
workspace directory root.
• File System — Opens a dialog box where you can
browse for the initialization file. After you select the file,
the absolute path to that file appears in the Target
Initialization File text box.
• Variables — Opens a dialog box where you can
specify the initialization file in terms of IDE path
variables. After you specify the file, the path to that file
appears in the Target Initialization File text box, relative
to the path variables that you use. The IDE resolves
each path variable as explained in the Variable
Description box at the bottom of the Select Variable
dialog box.
Clear this option if you want the debugger to use a default target
initialization file.
314
Microcontrollers V10.x Targeting Manual
DRAFT
Working with Debugger
Standard Debugging Features
Table 4.4 RS08 Tab — Debugger Settings (continued)
Option
Description
Use Memory
Configuration File
Specifies the memory configuration file to be used by the
debugger at the start of each debugging session.
Check this option to activate the Memory Configuration File text
box where you can specify the path of the configuration file.
Alternatively, you can specify the file path by using any of the
buttons listed below:
• Workspace — Opens a dialog box where you can
specify the initialization file in terms of a location
relative to the IDE's workspace directory. After you
specify the file, the path to that file appears in the
Memory Configuration File text box, relative to the path
of the variable workspace_loc. The IDE resolves this
variable to the absolute file system path of the
workspace directory root.
• File System — Opens a dialog box where you can
browse for the initialization file. After you specify the
file, the absolute path to that file appears in the Memory
Configuration File text box.
• Variables — Opens a dialog box where you can
specify the initialization file in terms of IDE path
variables. After you specify the file, the path to that file
appears in the Memory Configuration File text box,
relative to the path variables that you use. The IDE
resolves each path variable as explained in the
Variable Description box at the bottom of the Select
Variable dialog box.
Check the Use Default option to use the default memory
configuration file and to deactivate the Memory Configuration File
text box and the three buttons.
Use Default
Check this checkbox to use the default memory configuration file.
Connection Tab — RS08
Use this tab to specify the connection interface that the debugger uses to communicate
with the RS08 on the target hardware. Figure 4.6 shows the Connection tab.
Microcontrollers V10.x Targeting Manual
315
DRAFT
Working with Debugger
Standard Debugging Features
Figure 4.6 Connection Tab — RS08
Table 4.5 describes the debugger settings on the Connection tab.
Table 4.5 Connection Tab — RS08 Settings
Option
Description
Connection Protocol
Specifies the protocol used to manage communications
between the debugger and the target.
Enable Logging
Specifies if the debugger’s communications is logged.
Check this option to have the debugger’s communications
session logged to the Console in the Debug view.
Clear this option to disable logging.
316
Microcontrollers V10.x Targeting Manual
DRAFT
Working with Debugger
Standard Debugging Features
Table 4.5 Connection Tab — RS08 Settings
Option
Description
Connection
Specifies the hardware interface used to connect the
workstation to the target. The Connection list box contains
the following values:
• Generic — Use this setting if you manually launch
and configure the connection-protocol service
(such as CCS), or if you are debugging code with a
simulator. For more information, refer to the topic
P&E Full Chip Simulation.
• SofTec — Use this setting to connect a SofTec
HCS08 probe with the target hardware. When the
debugger runs the SofTec RS08 connection, it can
communicate and debug RS08 core based
hardware connected through the SofTec in-circuit
debugger/programmer units SofTec Microsystems
HCS08 ISP Debuggers/Programmers (inDART
Series) and Starter Kits (PK and newer Series). For
more information, refer to the topic Softec.
Note: Refer to the inDART®-HCS08 In-Circuit Debugger/
Programmer for Freescale HCS08 Family FLASH Devices
User’s Manual from SofTec for communication hardware
requirements and SofTec product installation.
• P&E RS08 Multilink/Cyclone Pro — Use this
setting to connect a P&E Multilink/Cyclone Pro
probe with the target hardware. For information
refer to the topics P&E RS08 Multilink\Cyclone Pro
and P&E RS08 Multilink\Cyclone Pro ConnectionSpecific Options.
• OSBDM — The 8/16 bits debugger (and then the
CodeWarrior IDE) can be connected to HCS08
hardware using the HCS08 OSBDM (Open Source
BDM) cable. When the debugger runs the HCS08
Open Source BDM connection, it can communicate
and debug HCS08 core-based hardware
connected through the Open Source BDM
Interface as described at the Freescale
Semiconductor web site: http://www.freescale.com
(keyword: OSBDM08). For information refer to the
topic Open Source BDM.
Attribute
Specifies an interface characteristic or option.
Value
Describes the current value or setting applied to the attribute.
Add
Click to add a new attribute/value pair. For more information,
refer to the topic Add Attribute/Value.
Remove
Click to remove an existing attribute/value pair. For more
information, refer to the topic Remove Attribute/Value.
Microcontrollers V10.x Targeting Manual
317
DRAFT
Working with Debugger
Standard Debugging Features
The following topics explain how to add, modify, and delete entries in the Attribute/Value
table:
• Add Attribute/Value
• Edit Existing Attribute/Value
• Remove Attribute/Value
Add Attribute/Value
To add a new attribute/value pair, perform these steps.
1. Click Add.
The default entry New attribute appears in the Attribute column of the table, and
the default entry value appears in the Value column. The new attribute’s name is
highlighted.
2. Type in a name for an attribute into this field, using alphanumeric characters only. The
text replaces the default name.
3. Click on value.
The text in this text box is highlighted.
4. Type in a value to replace the default value.
5. To save the changes, click Apply.
Edit Existing Attribute/Value
To modify an attribute/value pair already in the table:
1. Click on an attribute name in the Attribute column of the table.
The attribute name is highlighted.
2. Type in the name of the new attribute into this field, using alphanumeric characters
only.
The text replaces the previous name.
3. Click on the value field.
The text in this text box is highlighted.
4. Type in a value to replace the previous value.
5. To save the changes, click Apply.
Remove Attribute/Value
To delete an existing attribute/pair in the table:
1. Double-click on the row of an attribute/pair in the table.
The row is highlighted.
318
Microcontrollers V10.x Targeting Manual
DRAFT
Working with Debugger
Standard Debugging Features
2. Click Remove.
The row containing the selected attribute/value is deleted.
3. Click Apply to save any changes.
NOTE
For more information on the physical connection options presented with the
option of probe, consult the chapter, Connections — RS08.
ColdFire-specific Settings
The following debugger tab manage the settings specific to the ColdFire microcontroller.
ColdFire Tab
Use this tab to specify the target processor, simulator/emulator option, target initialization
files, and memory configuration files. Figure 4.7 shows the ColdFire tab.
Figure 4.7 ColdFire Tab
Table 4.6 describes the debugger settings on the ColdFire tab.
Microcontrollers V10.x Targeting Manual
319
DRAFT
Working with Debugger
Standard Debugging Features
Table 4.6 ColdFire Tab — Debugger Settings
Option
Description
Target Processor
Specifies the target hardware on which you debug the generated
binary file. The options are:
• Generic — The debugger uses those hardware
features that are common to all ColdFire processors.
• ColdFire derivative — The debugger uses the
hardware features available on the selected processor.
Simulator/Emulator
Specifies the simulator or emulator to be used to debug the
program.
Select the appropriate option from the listbox. The options are:
• None — No special protocol is used to connect to the
target.
• CCSIM2 ISS — The debugger uses the CodeWarrior
Connection Protocol (CCS) to connect to the
Instruction Sect Simulator (ISS).
Execute Reset
Specifies that the debugger resets the target hardware before
downloading a program for debugging purposes.
Check this option to have the debugger reset the target before
downloading the program to it.
Clear this option to have the debugger download a program to the
target without resetting that target.
Run Out of Reset
Determines what the ColdFire Microcontroller does after it is
reset.
Check this option to have the Microcontroller begin executing the
program after it is reset.
Clear this option to have the Microcontroller remain in debug
mode after it it reset.
320
Microcontrollers V10.x Targeting Manual
DRAFT
Working with Debugger
Standard Debugging Features
Table 4.6 ColdFire Tab — Debugger Settings (continued)
Option
Description
Initialize Target
Specifies the target initialization file to be used by the debugger at
the start of each debugging session
Check this option to activate the Target Initialization File text box
where you can specify the path of the initialization file.
Alternatively, you can specify the file path by using any of the
buttons listed below:
• Workspace — Opens a dialog box where you can
specify the initialization file in terms of a location
relative to the IDE's workspace directory. After you
select the file, the path to that file appears in the Target
Initialization File text box, relative to the path of the
variable workspace_loc. The IDE resolves this
variable to the absolute file system path of the
workspace directory root.
• File System — Opens a dialog box where you can
browse for the initialization file. After you select the file,
the absolute path to that file appears in the Target
Initialization File text box.
• Variables — Opens a dialog box where you can
specify the initialization file in terms of IDE path
variables. After you specify the file, the path to that file
appears in the Target Initialization File text box, relative
to the path variables that you use. The IDE resolves
each path variable as explained in the Variable
Description box at the bottom of the Select Variable
dialog box.
Clear this option if you want the debugger to use a default target
initialization file.
Microcontrollers V10.x Targeting Manual
321
DRAFT
Working with Debugger
Standard Debugging Features
Table 4.6 ColdFire Tab — Debugger Settings (continued)
Option
Description
Use Memory
Configuration File
Specifies the memory configuration file to be used by the
debugger at the start of each debugging session.
Check this option to activate the Memory Configuration File text
box where you can specify the path of the configuration file.
Alternatively, you can specify the file path by using any of the
buttons listed below:
• Workspace — Opens a dialog box where you can
specify the initialization file in terms of a location
relative to the IDE's workspace directory. After you
specify the file, the path to that file appears in the
Memory Configuration File text box, relative to the path
of the variable workspace_loc. The IDE resolves this
variable to the absolute file system path of the
workspace directory root.
• File System — Opens a dialog box where you can
browse for the initialization file. After you specify the
file, the absolute path to that file appears in the Memory
Configuration File text box.
• Variables — Opens a dialog box where you can
specify the initialization file in terms of IDE path
variables. After you specify the file, the path to that file
appears in the Memory Configuration File text box,
relative to the path variables that you use. The IDE
resolves each path variable as explained in the
Variable Description box at the bottom of the Select
Variable dialog box.
Check the Use Default option to use the default memory
configuration file and to deactivate the Memory Configuration File
text box and the three buttons.
ColdFire — Linux Applications Tab
Use this tab to specify the target processor that the Linux application executes on. Figure
4.8 shows the ColdFire tab for debugging Linux applications.
NOTE
322
For this release of the tools, Linux application debugging is not supported.
Microcontrollers V10.x Targeting Manual
DRAFT
Working with Debugger
Standard Debugging Features
Figure 4.8 ColdFire — Linux Applications Tab
Table 4.7 describes the debugger settings on the ColdFire tab.
Table 4.7 ColdFire — Linux Application Tab — Debugger Settings
Option
Description
Target Processor
Specifies the target hardware on which you debug the generated
binary file. The options are:
• Generic — The debugger uses those hardware
features that are common to all ColdFire processors.
• ColdFire derivative — The debugger will use the
hardware features available on the selected processor.
Exceptions Tab — ColdFire
The Exceptions tab (Figure 4.9) is available with P&E Microcomputer Systems,
simulator, and Freescale USB and Ethernet TAP remote connections.
Use this tab to specify hardware exceptions that you want the debugger to catch.
Before you load and run the program, the debugger inserts its own exception vector for
each exception you check in tab. To use your own exception vectors instead, clear the
corresponding checkboxes.
If you check any options, the debugger reads the Vector_Based_Register (VBR), finds the
corresponding existing exception vector and then writes a new vector at that register
location. The address of this new vector is offset 0x408 from the VBR address. For
Microcontrollers V10.x Targeting Manual
323
DRAFT
Working with Debugger
Standard Debugging Features
example, if the VBR address is 0x0000 0000, the new vector at address 0x0000 0408
catches and handles the checked exceptions.
The debugger writes a Halt instruction and a Return from Exception instruction at this
same location.
NOTE
If your exceptions are in Flash or ROM, do not check any boxes in the CF
Exceptions panel. Abatron ignores this tab, using instead the exception
definitions in the Abatron firmware.
Figure 4.9 Exceptions Tab — ColdFire
324
Microcontrollers V10.x Targeting Manual
DRAFT
Working with Debugger
Standard Debugging Features
Table 4.8 describes the exceptions settings on the ColdFire tab.
Table 4.8 Exceptions Settings — ColdFire
Option
Purpose
2 — Access Error
Determines whether the debugger handles the
access error exception.
Check this option to catch and display access
errors.
Clear this option to ignore access errors.
3 — Address error
Determines whether the debugger handles the
address error exception.
Check this option to catch and display address
errors.
Clear this option to ignore address errors.
4 — Illegal
instruction
Determines whether the debugger handles an
invalid instruction exception.
Check this option to catch and display invalid
instructions.
Clear this option to ignore invalid instructions.
5 — Divide by zero
Determines whether the debugger handles a
divide by zero exception.
Check this option to catch and display any
attempt to divide by zero.
Clear this option to ignore divide by zero
attempts.
8 — Privilege
Violation
Determines whether the debugger handles a
privilege violation exception.
Check this option to catch and display privilege
violations.
Clear this option to ignore privilege violations.
9 — Trace
Determines whether the debugger handles a
Trace exception.
Check this option to catch and display trace
exceptions.
Clear this option to ignore trace exceptions.
Microcontrollers V10.x Targeting Manual
325
DRAFT
Working with Debugger
Standard Debugging Features
Table 4.8 Exceptions Settings — ColdFire (continued)
Option
Purpose
10 —
Unimplemented
line-a opcode
Determines whether the debugger handles a
unimplemented line-A opcode exception.
Check this option to catch and display
unimplemented line-A opcodes
Clear this option to ignore unimplemented line-A
opcodes.
11—
Unimplemented
line-f opcode
Determines whether the debugger handles a
unimplemented line-F opcode exception.
Check this option to catch and display
unimplemented line-F opcodes
Clear this option to ignore unimplemented line-F
opcodes.
12 — Non-PC
breakpoint debug
interrupt
Determines whether the debugger handles nonPC breakpoint debug interrupts.
Check this option to catch and display non-PC
breakpoint debug interrupts.
Clear this option to ignore non-PC breakpoint
debug interrupts.
13 — PC
breakpoint debug
interrupt
Determines whether the debugger handles PC
breakpoint debug interrupts.
Check this option to catch and display PC
breakpoint debug interrupts.
Clear this option to ignore PC breakpoint debug
interrupts.
14 — Format error
Determines whether the debugger handles
format error exceptions.
Check this option to catch and display format
errors.
Clear this option to ignore format errors.
15 — Uninitialized
interrupt
Determines whether the debugger handles
uninitialized interrupts.
Check this option to catch and display
uninitialized interrupts.
Clear this option to ignore uninitialized interrupts.
326
Microcontrollers V10.x Targeting Manual
DRAFT
Working with Debugger
Standard Debugging Features
Table 4.8 Exceptions Settings — ColdFire (continued)
Option
Purpose
24 — Spurious
interrupt
Determines whether the debugger handles
spurious interrupts.
Check this option to catch and display spurious
interrupts.
Clear this option to ignore spurious interrupts.
31 — Level 7
autovectored
interrupt (Suspend
Button)
Determines whether the debugger handles level
7 suspend button exceptions.
Check this option to catch and display the use of
the level 7 interrupts.
Clear this option to ignore level 7 interrupts.
46 — Trap #14
instruction
(Console I/O)
Determines whether the debugger handles trap #
14 instructions, which implement console I/O.
Clear this option to ignore trap 14 instructions.
Check this option to catches and display uses of
trap 14 instructions.
61 — Unsupported
instruction
Determines whether the debugger handles the
unsupported instruction exception.
Check this options to catch and display
unsupported instructions.
Clear this option to ignore unsupported
instructions.
Handle user
application
provided Trap #14
for console I/O
Determines whether the debugger handles trap #
14 exceptions when they occur in an application.
Clear this option to ignore trap 14 instructions.
Check this option to catches and display uses of
trap 14 instructions.
Reset Tab — ColdFire
The Reset tab Figure 4.10) specifies the setup actions that the microcontroller takes when
it comes out of a reset.
Microcontrollers V10.x Targeting Manual
327
DRAFT
Working with Debugger
Standard Debugging Features
Figure 4.10 Reset Tab — ColdFire
Table 4.9 describes the behavior of each option.
Table 4.9 Reset Tab — ColdFire Settings
Option
Description
Fetch SP and PC from Reset Vector
When selected, the debugger fetches the
base of the stack and the start address from
the reset vector, and loads them into the
Microcontroller’s SP and PC, respectively.
Used for ROM build targets.
Set PC to program Entry Point
When selected, the debugger sets the
Microcontroller’s PC to the program’s start
address. Used to emulate reset for RAM
build targets.
Set PC and SP to specified value
When selected, the debugger takes the usersupplied values for the SP and PC and loads
them the corresponding Microcontroller
registers. Used to reference the entry point
of a boot loader.
When selected, the SP: and PC: text entry
boxes are active. Enter the hexadecimal
addresses for the SP and PC in these boxes.
Do not set SP or PC
When selected, the debugger takes no
action and the Microcontroller uses the
default addresses in the PC and SP.
Interrupts Tab — ColdFire
Debugging an application involves single-stepping through code. However, if you do not
modify the behavior of interrupts that are part of normal code execution, an interrupt may
occur and the debugger jumps to the interrupt handler code, rather than single-stepping to
the next instruction. Therefore, you must mask, or inhibit, certain interrupt levels to
prevent the interrupts from happening. The interrupt levels that you inhibit varies,
depending upon the microcontroller.
328
Microcontrollers V10.x Targeting Manual
DRAFT
Working with Debugger
Standard Debugging Features
Use this tab to inhibit or allow interrupts. When inhibiting interrupts, you can mask
interrupts below a level that you specify. Figure 4.11 shows the Interrupts tab.
Figure 4.11 Interrupts Tab — ColdFire
Table 4.10 explains each option.
Table 4.10 Interrupts Tab — ColdFire
Option
Description
Mask Interrupts
Determines whether the debugger inhibits or
allows interrupts
Check this option to inhibit interrupts, using
the level specified in the Interrupt Level
option.
Uncheck this option to permit all interrupts.
Interrupt Level
Use this option to specify the interrupt level
that the debugger inhibits.
Level 0 corresponds to the lowest priority
interrupt, while level 7 is the highest. If you
specify a level of 4, then the debugger
inhibits interrupts of level 0 through 4, while
interrupts at levels 5 through 7 execute.
NOTE
The exact definitions of interrupt levels are different for each target
microcontroller, and masking all interrupts can cause erratic behavior. This
means that finding the best interrupt level to mask can involve trial and error.
Be alert for any code statements that change the interrupt mask; stepping over
such a statement can modify the settings in the tab.
Connection Tab — ColdFire
Use this tab to specify the type of connection between the CodeWarrior debugger and the
target hardware, settings for the target hardware, and the type of physical connection.
Figure 4.12 shows the Connection tab.
Microcontrollers V10.x Targeting Manual
329
DRAFT
Working with Debugger
Standard Debugging Features
Figure 4.12 Connection Tab — ColdFire
Table 4.11 describes the settings available on the Connection Settings tab.
330
Microcontrollers V10.x Targeting Manual
DRAFT
Working with Debugger
Standard Debugging Features
Table 4.11 Connection Tab — ColdFire Settings
Option
Description
Connection Protocol
Specify the method by which the CodeWarrior debugger
communicates with the target hardware.
For example, specify CCS to have the debugger use the
CodeWarrior Connection Server to communicate with the
target hardware.
Available connection protocols are:
• Generic Debug Instrument Interface (GDI) —
GDI is an open standard interface that enables
debugger communications and control between a
debugger and run control hardware. It is used to
configure and communicate with hardware probes
not pre-defined in the Physical Connection option.
• Abatron BDI — A communications protocol used
with Abatron BDI probes.
• CodeWarrior Connection Server (CCS) — A
communications protocol used with P&E
Microcomputer Systems probes, USB and
EtherTAP run control probes, and the instruction
set simulator (ISS). For more information, refer to
the topic CCS Advanced Settings.
Enable Logging
Check this option to have the debugger output connectionprotocol activity to a console in the Console view.
Clear this option if you do not want the debugger to output
connection-protocol activity to a console.
Advanced
Click this button to configure additional options for the
specified Connection Protocol.
Physical Connection
Specify the type of physical connection between the
debugger and the target hardware.
Depending on the selected connection protocol, the options
in the Connection drop-down list change.
Microcontrollers V10.x Targeting Manual
331
DRAFT
Working with Debugger
Standard Debugging Features
Table 4.11 Connection Tab — ColdFire Settings (continued)
Option
Description
<When the connection
protocol is CCS>
For the CCS option, the Connection drop-down list contains
the following values:
• Generic — The debugger does not configure the
connection protocol for any particular physical
connection. Use this setting if you manually
launch and configure the connection-protocol
service (such as CCS), or if you are debugging
code with a simulator.
• USB TAP — The debugger uses a USB TAP
probe to connect to the target hardware. If you
have multiple USB TAP probes available, check
the USB TAP Serial Number checkbox and enter
the serial number (in hexadecimal notation) of the
probe to which you want the debugger to connect.
• Ethernet TAP — The debugger uses an Ethernet
TAP probe to connect to the target hardware.
Enter in the Hostname/IP Address text box the
host name or Internet Protocol address of the
probe to which you want the debugger to connect
By default, the Ethernet TAP probe uses Dynamic
Host Configuration Protocol (DHCP) to acquire an
IP address, netmask, and default gateway
settings. If your network has a DHCP server which
registers host names to the network’s name
server, you can use the default host name to
access the Ethernet TAP probe. Access is
available when the HEARTBEAT LED starts
flashing green.
332
Microcontrollers V10.x Targeting Manual
DRAFT
Working with Debugger
Standard Debugging Features
Table 4.11 Connection Tab — ColdFire Settings (continued)
Option
Description
<When the connection
protocol is GDI>
For the GDI option, the Connection drop-down list contains
the following values:
• Generic — The debugger does not configure the
connection protocol for any particular physical
connection. Use this setting if you manually
launch and configure the connection-protocol
service (such as CCS), or if you are debugging
code with a simulator.
• Software ColdFire V1 in-DART — This option
specifies a hardware connection of a SofTec
inDART debugger/programmer using the BDM
interface. The Connection tab displays a table of
named attributes and their assigned values .
These attribute/value pairs are used to configure
the connection parameters for the interface.
• OSBDM - JM60 ColdFire V2\3\4 — This option
specifies a hardware connection for OSBDM JM60 ColdFire V2\3\4.
• P&E ColdFire V1 Multilink\Cyclone Pro — This
option specifies that the hardware connection is
either a P&E Microsystems Multilink or a P&E
Multisystems Cyclone Pro.
• P&E ColdFire V234 Multilink\Cyclone Max — This
option specifies that the hardware connection is
either a P&E Microsystems Multilink or a P&E
Multisystems Cyclone Max.
<When the connection
protocol is Abraton BDI>
For the Abraton BDI option, the Connection drop-down list
contains the following values:
• TCP/IP — This option specifies that the physical
connection uses TCP/IP as the interface for
debugging communications.
• Serial — This option specifies that the physical
connection uses a serial connection as the
interface for debugging communications.
Attribute
Specifies an interface characteristic or option.
Value
Describes the current value or setting applied to the
attribute.
Add
Click to add a new attribute/value pair. For more information,
refer to the topic Add Attribute/Value.
Remove
Click to remove an existing attribute/value pair. For more
information, refer to the topic Remove Attribute/Value.
Microcontrollers V10.x Targeting Manual
333
DRAFT
Working with Debugger
Standard Debugging Features
The following topics explain how to add, modify, and delete entries in the Attribute/Value
table:
• Add Attribute/Value
• Edit Existing Attribute/Value
• Remove Attribute/Value
Add Attribute/Value
To add a new attribute/value pair, perform these steps.
1. Click Add.
The default entry New attribute appears in the Attribute column of the table, and
the default entry value appears in the Value column. The new attribute’s name is
highlighted.
2. Type in a name for an attribute into this field, using alphanumeric characters only. The
text replaces the default name.
3. Click on value.
The text in this text box is highlighted.
4. Type in a value to replace the default value.
5. To save the changes, click Apply.
Edit Existing Attribute/Value
To modify an attribute/value pair already in the table:
1. Click on an attribute name in the Attribute column of the table.
The attribute name is highlighted.
2. Type in the name of the new attribute into this field, using alphanumeric characters
only.
The text replaces the previous name.
3. Click on the value field.
The text in this text box is highlighted.
4. Type in a value to replace the previous value.
5. To save the changes, click Apply.
Remove Attribute/Value
To delete an existing attribute/pair in the table:
1. Double-click on the row of an attribute/pair in the table.
The row is highlighted.
334
Microcontrollers V10.x Targeting Manual
DRAFT
Working with Debugger
Standard Debugging Features
2. Click Remove.
The row containing the selected attribute/value is deleted.
3. Click Apply to save any changes.
NOTE
For more information on the physical connection options presented with the
option of probe, consult the chapter, Connections — ColdFire V1.
CCS Advanced Settings
After you use the Connection Protocol list box to specify CCS, click Advanced to open
the CCS Advanced Settings dialog box as seen in Figure 4.13. Use this dialog box to
specify additional CodeWarrior Connection Server parameters.
Figure 4.13 CCS Advanced Settings Dialog Box
Table 4.12 describes the CCS Advanced settings.
Table 4.12 CCS Advanced Settings
Option
Description
Use Remote
CCS Server
Check this option to specify the Hostname/IP Address of the remote
CCS instance with which you want the debugger to communicate.
Clear this option if you want the debugger to communicate with a
CCS instance that runs on your own computer.
Port#
Specifies the port number through which the debugger
communicates with the CCS instance.
Microcontrollers V10.x Targeting Manual
335
DRAFT
Working with Debugger
Standard Debugging Features
Table 4.12 CCS Advanced Settings (continued)
Option
Description
Specify CCS
Executable
Check this option to specify the path to the CCS executable file
(other than the default executable file) that the debugger launches if
no CCS service is running at the time you start a debugging session.
Enter the full path in the text box, or, you can specify the file path by
using any of the buttons listed below:
• Workspace — Opens a dialog box where you can specify
the CCS executable file in terms of a location relative to
the IDE's workspace directory. After you select the file, the
path to that file appears in the CCS Executable File text
box, relative to the path of the variable workspace_loc.
The IDE resolves this variable to the absolute file system
path of the workspace directory root.
• File System — Opens a dialog box where you can browse
for the executable file. After you select the file, the
absolute path to that file appears in the CCS Executable
File text box.
• Variables — Opens a dialog box where you can specify
the executable file in terms of IDE path variables. After you
specify the file, the path to that file appears in the CCS
Executable File text box, relative to the path variables that
you use. The IDE resolves each path variable as
explained in the Variable Description box at the bottom of
the Select Variable dialog box.
Clear this option if you want the debugger to launch the default CCS
executable file if no CCS service is running at the time you start a
debugging session.
This setting holds true only when no CCS service is running at the
time the debugging session starts. For example, if you check this
checkbox and specify C:\ccs\ccs.exe, but you have
C:\otherccs\ccs.exe already running when you start a
debugging session, this setting has no effect. The IDE uses this
setting just when it cannot find a local running CCS session.
BDM Clock
Speed
336
Use the text box to specify the default clock speed (in kilohertz) of
the connection between your computer and the BDM header of the
target-hardware chain.
Microcontrollers V10.x Targeting Manual
DRAFT
Working with Debugger
Standard Debugging Features
Table 4.12 CCS Advanced Settings (continued)
Option
Description
CCS Timeout
Enter the number of seconds after which you want the debugger to
treat CCS as unresponsive. The debugger treats the time interval
that you specify as a window of validity in which CCS must complete
debugger requests. If CCS does not complete the requests during
the specified time interval, the debugger treats CCS as
unresponsive.
For example, you might specify 30 seconds to give intensive CCS
operations enough time to succeed during a debugging session. You
don't want to wait 30 seconds for the initial connect operation,
however, if you mistyped the Ethernet TAP probe's IP address, or if
you forgot to turn on the target hardware. For these reasons, the
debugger treats the specified value differently for initial-connect
operations.
Disable
Synchronous
Clocking
Check this option to have the debugger use a standard (slow)
procedure to write to memory on the target system.
Clear this option to have the debugger use an optimized (fast)
download procedure to write to memory on the target system. The
fast download mechanism is used by default when writing to target
memory.
Check this option if the fast download procedure results in load
failures.
OS Awareness Tab — ColdFire
Use this tab to specify the operating system (OS) that resides on the target device. Figure
4.14 shows the OS Awareness tab view.
NOTE
Linux support is not implemented for this release.
Figure 4.14 OS Awareness Tab — ColdFire
Microcontrollers V10.x Targeting Manual
337
DRAFT
Working with Debugger
Standard Debugging Features
Use the Target OS list box to specify the OS that runs on the target device, or specify
None to have the debugger use the bare board.
Remote Tab — ColdFire
When debugging a Linux application, use this tab to specify where the debugger
downloads the program for debug on the Linux host system, and whether to launch any
optional applications while debugging. Figure 4.15 shows the Remote tab view.
Figure 4.15 Remote Tab — ColdFire
Table 4.13 describes the Remote tab settings.
Table 4.13 Remote Tab settings
Option
Description
Remote download path
Specifies the directory path that the
debugger downloads the test program into.
Launch remote host application
Specifies the directory path of a Linux
program that is to be launched along with the
test program.
Connection Tab — ColdFire Linux
Use this tab (Figure 4.16) to specify how the debugger communicates with a Linux
application under debug control.
338
Microcontrollers V10.x Targeting Manual
DRAFT
Working with Debugger
Standard Debugging Features
Figure 4.16 Connection Tab — ColdFire Linux
Table 4.14 describes the various options.
Table 4.14 Connection Tab settings — ColdFire Linux
Option
Description
Connection Protocol
Specifies the communications protocol used
to control the application under debug on the
Linux system.
Enable Loggings
Specifies if the debugger’s communications
is logged.
Check this option to have the debugger’s
communications session logged to the
Console in the Debug view.
Clear this option to disable logging.
Connection
Specifies the physical connection used to
connect the debugger to the host Linux
system. The options are:
• Serial — A serial cable connects
the host computer to the target
Linux system.
• TCP/IP — The host computer
communicates with the target
Linux system over a TCP/IP
connectione.
Hostname/IP address
Microcontrollers V10.x Targeting Manual
Use this option to specify the IP address of
the target Linux system. Available only when
using the TCP/IP connection.
339
DRAFT
Working with Debugger
Standard Debugging Features
Table 4.14 Connection Tab settings — ColdFire Linux (continued)
Option
Description
Port #
Use this option to specify the IP port used to
communicate with the target Linux system.
Available only when using the TCP/IP
connection.
Port
Specifies the serial port the host system
uses. Options are:
• COM1
• COM2
• COM3
• COM4
Rate
Specifies the bit-rate of the serial interface.
Options are:
• 300
• 1200
• 2400
• 4800
• 9600
• 19200
• 34800
• 57600
• 115200
• 230400
Data Bits
Specifies the bit size of the characters sent
through the serial interface. Options are:
• 4
• 5
• 6
• 7
• 8
340
Microcontrollers V10.x Targeting Manual
DRAFT
Working with Debugger
Standard Debugging Features
Table 4.14 Connection Tab settings — ColdFire Linux (continued)
Option
Description
Parity
Specifies if a parity bit is included with the
character for error-correction. Options are:
• None
• Odd
• Even
Stop Bits
Specifies if a termination bit is appended to
the character. Options are:
•
• 1.5
• 2
Flow Control
Specifies how the serial transfer of
characters is controlled to prevent data overruns. Options are:
• None
• Hardware (RTS/CTS)
• Software (XON/XOFF)
Settings Common to all Microcontrollers
The following tab views manage debugger settings that apply to all of the
microcontrollers.
Download Tab
Use this tab to specify which program sections the debugger downloads to the target, and
whether the debugger should read back those sections and verify them.
NOTE
Checking all checkboxes in the Program Download Options group
significantly increases download time.
Figure 4.17 shows the Download tab. Briefly, the section data types are:
• Executable — These sections contain your program’s code.
• Constant Data — These sections contain your program’s constants. These values can
not be modified
• Initialized Data — Initialized data sections contain your program’s modifiable data.
Microcontrollers V10.x Targeting Manual
341
DRAFT
Working with Debugger
Standard Debugging Features
• Uninitialized Data — Uninitialized data sections contain your program’s
uninitialized variables.
Table 4.15 explains each option.
Initial Launch options apply to the first debugging session. Successive Runs options apply
to subsequent debugging sessions. The Download options control whether the debugger
downloads the specified Section Data type to the target hardware. The Verify options
control whether the debugger reads the specified Section Data type from the target
hardware and compares the read data against the data written to the device.
Figure 4.17 Download Tab
Table 4.15 Download Tab Settings
342
Section Data Type
DescriptionDescription
Executable
Controls downloading and verification for
executable sections. Check appropriate
checkboxes to specify downloading and
verifications, for initial launch and for
successive runs.
Constant Data
Controls downloading and verification for
constant-data sections. Check appropriate
checkboxes to specify downloading and
verifications, for initial launch and for
successive runs.
Microcontrollers V10.x Targeting Manual
DRAFT
Working with Debugger
Standard Debugging Features
Table 4.15 Download Tab Settings (continued)
Section Data Type
DescriptionDescription
Initialized Data
Controls downloading and verification for
initialized-data sections. Check appropriate
checkboxes to specify downloading and
verifications, for initial launch and for
successive runs.
Uninitialized Data
Controls downloading and verification for
uninitialized-data sections. Check
appropriate checkboxes to specify
downloading and verifications, for initial
launch and for successive runs.
Select All
Selects all of the options available for
downloading and verifying the program.
Deselect All
The debugger will not download or verify any
program sections.
PIC Tab
Use this tab to specify an alternate address for the debugger to load a PIC module on a
target board. Usually, Position Independent Code (PIC) is linked in such a way that the
entire image starts at address 0x00000000. The PIC tab lets you specify an alternate
address at which the debugger will load the PIC module in target memory. Figure 4.18
shows the PIC tab.
Figure 4.18 PIC Tab
Check the Alternate Load Address option and then enter the address (in hexadecimal
notation) in the corresponding text box. The address that you specify is the starting
address at which the debugger loads your program. You can also use this setting when you
have an application which is built with ROM addresses and then relocates itself to RAM
(such as U-Boot). Specifying a relocation address lets the debugger map the symbolic
debugging information contained in the original ELF file (built for ROM addresses) to the
relocated application image in RAM.
Microcontrollers V10.x Targeting Manual
343
DRAFT
Working with Debugger
Standard Debugging Features
NOTE
The debugger does not verify whether your code can execute at the specified
address. As a result, the PIC generation settings of the compiler, linker and
your program's startup routines must correctly set any base registers and
perform any required relocations.
Clear the Alternate Load Address option to have the debugger load your program at a
default starting address.
Other Executables Tab
Use this tab to specify additional ELF files to download or debug in addition to the main
executable file associated with the launch configuration.
Figure 4.19 shows the Other Executables tab view.
Figure 4.19 Other Executables Tab
Table 4.16 describes the Other Executables debugger settings.
344
Microcontrollers V10.x Targeting Manual
DRAFT
Working with Debugger
Standard Debugging Features
Table 4.16 Other Executables Tab Settings
Option
Description
File list
Shows files and projects that the debugger uses during each debug
session
The Debug column (
) — If this option is checked the
debugger loads symbolics for the file. If you clear this option, the
IDE does not load symbolics for the file.
The Download column (
) — If this option is checked the
debugger downloads the file to the target device. If you clear this
option, the debugger does not download the file to the target device.
Add
Click to open the Debug Other Executable dialog box. Use the
dialog box to specify the following settings:
• Specify the location of the additional executable — Enter the path
to the executable file that the debugger controls in addition to the
current project's executable file. Alternatively, click Browse to
specify the file path.
• Load symbols — Check this option to have the debugger load
symbols for the specified file. Clear to prevent the debugger from
loading the symbols. The Debug column of the File list corresponds
to this setting.
• Download to device — Check this option to have the debugger
download the specified file to the target device. Clear this option to
prevent the debugger from downloading the file to the device. The
Download column of the File list corresponds to this setting.
• OK — Click to add the information that you specify in the Debug
Other Executable dialog box to the File list.
Change
Click to open the Debug Other Executable dialog box. The dialog
box shows the current settings for selected executable file in the File
list column.
Change this information as required and click OK to update the
entry in the File list.
Remove
Click to remove the entry currently selected in the File list.
Symbolics Tab
Use this tab to specify whether the debugger keeps symbolics in memory. Symbolics
represent an application's debugging and symbolic information. Keeping symbolics in
Microcontrollers V10.x Targeting Manual
345
DRAFT
Working with Debugger
Standard Debugging Features
memory, known as caching symbolics, is beneficial when you debug a large-size
application. Figure 4.20 shows the Symbolics tab.
Consider a situation in which the debugger loads symbolics for a large application, but
does not download content to a hardware device and the project uses custom makefiles
with several build steps to generate this application. In such a situation, caching symbolics
helps speed up the debugging process. The debugger uses the readily available cached
symbolics during subsequent debugging sessions. Otherwise, the debugger spends
significant time creating an in-memory representation of symbolics during subsequent
debugging sessions.
NOTE
Caching symbolics provides significant benefit for large applications, where
doing so speeds up application-launch time. If you debug a small application,
caching symbolics does not significantly improve the launch time.
Figure 4.20 Symbolics Tab
Table 4.17 describes the Symbolics debugger settings.
346
Microcontrollers V10.x Targeting Manual
DRAFT
Working with Debugger
Standard Debugging Features
Table 4.17 Symbolics Tab Settings
Option
Description
Cache Symbolics
Between Sessions
Check this option to have the debugger cache symbolics
between debugging sessions. If you check this checkbox
and clear the Create and Use Copy of Executable
checkbox, the executable file remains locked after the
debugging session ends. In the Debug view, right-click on
the locked file and select Un-target Executables to have
the debugger delete its symbolics cache and release the
file lock. The IDE enables this menu command when
there are currently unused cached symbolics that it can
purge.
Clear this option so that the debugger does not cache
symbolics between debugging sessions.
Create and
Use Copy of Executable
Check this option to have the debugger create and use a
copy of the executable file. Using the copy helps avoid
file-locking issues with the build system. If you check this
checkbox, the IDE can build the executable file in the
background during a debugging session.
Clear this option so that the debugger does not create
and use a copy of the executable file.
Debugging Code
This section explains how to use the CodeWarrior™ debugger to debug source-code
features specific to Freescale microcontrollers.
Using the CodeWarrior debugger to debug an application follows this overall process:
1. Configure the target.
2. Download program to the target.
3. Load symbolics into the debugger.
4. Start a debugging session.
You can use the default CodeWarrior launch configurations to perform or skip specific
steps of the overall process. Table 4.18 shows the steps of the debugging process that each
default launch configuration supports. Yes indicates that the launch configuration supports
the step. No indicates that the launch configuration does not support the step.
NOTE
The CodeWarrior Attach launch configuration does not support restarting a
debugging session.
Microcontrollers V10.x Targeting Manual
347
DRAFT
Working with Debugger
Standard Debugging Features
Table 4.18 CodeWarrior™ Launch Configurations—Supported Debugging Steps
Debugging Step
Debug
(CodeWarr
ior
Download)
Run
(CodeWarr
ior
Download)
CodeWarri
or Attach
CodeWarrio
r Connect
Configure the
target
Yes
Yes
No
Yes
Download code
to the target
Yes
Yes
No
No
Load symbolics
into the debugger
Yes
No
Yes
No
Start a
debugging session
Yes
No
Yes
Yes
Ways to Initiate Debug Session
The CodeWarrior debugger provides three ways to initiate a debug session:
• Attach to Process
• Connect
• Debug
NOTE
These commands are available in the Debug Configurations dialog box.
Select Run > Debug Configurations to open the Debug Configurations
dialog box.
These commands differ in these ways:
• The Attach to Process command assumes that code is already running on the board
and therefore does not run a target initialization file. The state of the running
program is undisturbed. The debugger loads symbolic debugging information for the
current build target’s executable. The result is that you have the same source-level
debugging facilities you have in a normal debug session (the ability to view source
code and variables, and so on). The Attach to Process function does not reset the
target, even if the launch configuration specifies this action. Further, the command
loads symbolics, does not stop the target, run an initialization script, download an
ELF file, or modify the program counter (PC).
348
Microcontrollers V10.x Targeting Manual
DRAFT
Working with Debugger
Standard Debugging Features
NOTE
The debugger assumes that the current build target’s generated executable
matches the code currently running on the target.
• The Connect command runs the target initialization file specified in the HCS08,
RS08, or ColdFire tab of the Debug Configurations dialog box. This file is
responsible for setting up the board before connecting to it. The Connect function
does not load any symbolic debugging information for the current build target’s
executable. You therefore do not have access to source-level debugging and variable
display. The Connect command resets the target if the launch configuration specifies
this action. Further, the command stops the target, (optionally) runs an initialization
script, does not load symbolics, download an ELF file, or modify the program
counter (PC).
• The Debug command resets the target if the launch configuration specifies the
action. Further, the command stops the target, (optionally) runs an initialization
script, downloads the specified ELF file, and modifies the PC.
Table 4.19 Effect of Each Launch Configuration Type
Launch
Configura
tion Type
Resets
Target
on
Launch
Stop
s
Targ
et
Runs Init
Script
Uses
Symbol
ics
Modifie
s Entry
PC
Downloa
ds
Applicati
on
Attach
Never
No
No
Yes
No
Never
Connect
Per
Remote
Connecti
on
setting:
Usually
set to
Yes
Only if
Reset
on
Launc
h
Per
debugger
Global
Setting
panel
No
Yes
Never
Debug
Per
Remote
Connecti
on
setting:
Usually
set to
Yes
Only if
Reset
on
Launc
h
Per
debugger
Global
Setting
panel
Yes
Yes
Per
HCS08/
RS08/
ColdFire
Debugger
Settings
Microcontrollers V10.x Targeting Manual
349
DRAFT
Working with Debugger
Standard Debugging Features
Table 4.20 Connection Type: Use Cases
Connection Type
Typical Use Example
Attach
Debug a target system without modifying its state at all initially,
but allow use of symbolics during actual debug. Useful for
debugging a system that is already up and running.
Connect
Raw debug of a board without any software or symbolics.
Useful during hardware bring up, and often combined with
scripts for checking various aspects of the hardware.
Debug
Develop code that gets downloaded to the system on
debugger launch. Useful for bare board code development
without a working bootloader.
NOTE
The default debugger configuration causes the debugger to cache symbolics
between sessions. However, the Connect command invalidates this cache. If
you must preserve the contents of the symbolics cache, and you plan to use the
Connect command, uncheck the Cache Symbolics Between Sessions
checkbox in the Symbolics page of the Debug Configurations dialog box just
before you issue the Connect command.
Attaching Processes
In a debugging session, the CodeWarrior Attach launch configuration skips setting up the
target hardware, and downloading the program image to that target hardware. The code
image might reside on the target hardware already, or you might want to skip setting up
the target hardware. Like the CodeWarrior Connect launch configuration, the settings in
the Arguments and Environment panels do not apply.
Although similar to a debugging session, the goal of attaching the debugger to a process is
to get insight into the current state of that process, and to do so with minimal disturbance
to its state of execution. Having the debugger attach to a process skips most of the statealtering steps involved in starting a debugging session, such as resetting the target,
initializing the target, and downloading code. When the debugger finishes attaching to the
process, you have many of the debugging capabilities that you would have in a debugging
session (such as source-level debugging, line breakpoints, watchpoints, console input/
output, and so on).
NOTE
350
The debugger does not support restarting debugging sessions that you start by
attaching the debugger to a process.
Microcontrollers V10.x Targeting Manual
DRAFT
Working with Debugger
Standard Debugging Features
A process is an active program and related resources:
• Executing program code
• An address space
• One or more threads of execution. A thread is a unit of activity that has a program
counter and a set of processor registers
• A data section
• A set of resources, such as open files and pending signals
On a bare board (without an operating system), a given core has one process: one thread of
execution executing one program in one address space. With an operating system, there
can be several processes on a given core (with one active at any given moment).These
processes either run different programs in different address spaces or even execute the
same program, sharing an address space, open files, and so on.
You use the CodeWarrior Debug Configurations dialog box to view and attach to
processes. To attach to a process:
1. In the CodeWarrior Projects view, select the project for which you want to start a
debugging session in which you will attach to a process.
2. Select Run > Debug Configurations
The Debug Configurations dialog box appears.
3. Expand the CodeWarrior Attach group.
4. Select an existing configuration from the expanded CodeWarrior Attach group.
NOTE
If the CodeWarrior Attach group does not yet have any existing configuration,
select the CodeWarrior Attach title and click the New launch configuration
toolbar button of the Debug Configurations dialog box to create a new
configuration.
5. Click the Debugger tab.
6. In the Debugger page, specify parameters for the debugger and the target simulator or
device.
7. If you want to specify source lookup paths, click the Source tab and then use that page
to specify the path information.
8. Click Apply to save your changes.
9. Click Debug to start the debugging session.
You just finished starting a debugging session and attaching the debugger to a process.
Microcontrollers V10.x Targeting Manual
351
DRAFT
Working with Debugger
Debugging Bare Board Software
Connecting Target
In a debugging session, the CodeWarrior Connect launch configuration skips
downloading the code image to the target hardware, and loading symbolics into the
debugger. Skipping these steps is useful for board initialization and bringup. The code
might reside on the target hardware already, or you might want to skip loading symbolics
into the debugger.
Like the CodeWarrior Attach launch configuration, the settings in the Arguments and
Environment panels do not apply. The Source tab is available, however, so that you can
specify source paths in order to load an image after connecting the debugger to the target.
Similar to starting a debugging session, you use the Debug Configurations dialog box to
connect to a target:
1. In the C/C++ Projects view, select Run > Debug Configurations.
2. Expand the CodeWarrior Connect group.
3. Select an existing configuration from the expanded CodeWarrior Connect group.
NOTE
If the CodeWarrior Connect group does not yet have any existing
configuration, select the CodeWarrior Connect title and click the New launch
configuration toolbar button of the Debug Configurations dialog box to
create a new configuration.
4. Click the Debugger tab.
5. In the Debugger panel, specify parameters for the debugger and the target device.
6. If you want to specify source lookup paths, click the Source tab and then use that page
to specify the path information.
7. Click Debug to start the debugging session.
You just finished starting a debugging session and connecting the debugger to the target.
Debugging Bare Board Software
This topic applies to debugging software on bare board systems, that is, for hardware that
is not running an operating system.
The topics are:
• Displaying Register Contents
• Using Register Details Window
• Setting Watchpoints
• Removing Watchpoints
• Setting Breakpoints
352
Microcontrollers V10.x Targeting Manual
DRAFT
Working with Debugger
Debugging Bare Board Software
• Removing Breakpoints
• Setting Stack Crawl Depth
• Hard Resetting
Displaying Register Contents
Use the Registers view to display and modify the contents of the registers of the processor
on your target board. To display this view from the Debug perspective, Select Window >
Show View > Registers, and the Registers view appears.
The Registers view displays categories of registers in a tree format. To display the
contents of a particular category of registers, expand the tree element of the register
category of interest. Figure 4.21 shows the Registers view with the General Purpose
Registers tree element expanded.
TIP
You can also view and update registers by issuing the reg, change, and
display commands in the CodeWarrior Debugger Shell view.
Figure 4.21 Registers View
Adding Register Group
The default display of the Registers view groups related registers into a tree structure.
You can add a custom group of registers to the default tree structure. To add a new register
group:
1. Right-click in the Registers view.
A context menu appears.
Microcontrollers V10.x Targeting Manual
353
DRAFT
Working with Debugger
Debugging Bare Board Software
2. Select Add Register Group.
The Register Group dialog box appears (Figure 4.22).
Figure 4.22 Register Group Dialog Box
3. Enter in the Group Name text box a descriptive name for the new group. For example,
MyGroup.
4. Check the checkbox adjacent to each register you want to appear in the new group.
TIP
Click Select All to check all of the checkboxes. Click Deselect All to clear all the
checkboxes.
5. Click OK.
The Register Group dialog box closes. The new group name appears in the Registers
view.
354
Microcontrollers V10.x Targeting Manual
DRAFT
Working with Debugger
Debugging Bare Board Software
Figure 4.23 New Register Group
Editing Register Group
In the Registers view, you can edit both the default register groups and the groups that
you add. To do so:
1. In the Register view, right-click on the name of the register group you want to edit.
For example, right-click on MyGroup.
A context menu appears.
2. Select Edit Register Group.
The Register Group dialog box appears (Figure 4.22).
3. If required, enter a new name for the group in the Group Name text box.
4. Check the checkbox adjacent to each register you want to appear in the group.
TIP
Click Select All to check all of the checkboxes. Click Deselect All to clear all the
checkboxes.
5. Click OK.
The Register Group dialog box closes. The new group name appears in the Registers
view.
Removing Register Group
In the Registers view, you can remove register groups. To remove a register group:
1. In the Registers view, right-click on the register group you want to remove.
A context menu appears.
Microcontrollers V10.x Targeting Manual
355
DRAFT
Working with Debugger
Debugging Bare Board Software
2. Select Remove Register Group.
The selected register group is removed from the Registers view.
Changing Register’s Bit Value
To change a bit value in a register, first switch the IDE to the Debug perspective, start a
debugging session and perform these steps.
1. Open the Registers view by selecting Window > Show View > Registers.
2. Expand the register group that contains the register with the bit value that you want to
change.
3. Click on the register’s current bit value in the view’s Value column.
The value appears editable.
4. Type in the new value.
5. Press the Enter key.
The debugger updates the bit value. The bit value in the Value column changes to
reflect your modification.
NOTE
Modified values are highlighted in yellow.
Using Register Details Window
The default state of the Registers view is to provide details on the processor’s registers
(Figure 4.24).
356
Microcontrollers V10.x Targeting Manual
DRAFT
Working with Debugger
Debugging Bare Board Software
Figure 4.24 Register View — Detailed Information
The Registers view displays several types of register details:
• Bit Fields
• Description
• Actions
NOTE
To display the register details, first you have to select a register, then expand
the view by clicking and dragging the areas at the bottom of the Registers view
to reveal the Bit Field, Description, and Actions portions of the view.
Bit Fields
The Bit Fields group of the Registers view (Figure 4.25) shows a graphical representation
of the selected register's bit values. This graphical representation shows how the register
organizes bits. You can use this representation to select and change the register's bit
Microcontrollers V10.x Targeting Manual
357
DRAFT
Working with Debugger
Debugging Bare Board Software
values. Hover the cursor over each part of the graphical representation in order to see
additional information.
Figure 4.25 Register Details — Bit Fields Group
TIP
You can also view register details by issuing the reg command in the Debugger
Shell view.
A bit field is either a single bit or a collection of bits within a register. Each bit field has a
mnemonic name that identifies it. You can use the Field list box to view and select a
particular bit field of the selected register. The list box shows the mnemonic name and bitvalue range of each bit field. In the Bit Fields graphical representation, a box surrounds
each bit field. A red box surrounds the bit field shown in the Field list box.
After you use the Field list box to select a particular bit field, you see its current value in
the = text box. If you change the value shown in the text box, the Registers view shows
the new bit-field value.
The minimum resolution of bit-field descriptions is 2 bits. Consequently, register details
are not available for single-bit overflow registers.
The maximum resolution of bit-field descriptions is 32 bits.
358
Microcontrollers V10.x Targeting Manual
DRAFT
Working with Debugger
Debugging Bare Board Software
Changing Bit Field
To change a bit field in a register, you must first start a debugging session and then open
the Registers view.
To change a bit field, perform these steps.
1. In the Registers view, view register details.
2. Expand the register group that contains the bit field you want to change.
3. Expand the Bit Field and Description groups.
Register details appear (Figure 4.26) in the Registers view.
Figure 4.26 Registers View — Register Details
4. From the expanded register group above the register details, select the name of the
register that contains the bit field that you want to change.
The Bit Fields group displays a graphical representation of the selected bit field. The
Description group displays explanatory information about the selected bit field and
parent register.
5. In the Bit Fields group, click the bit field that you want to change. Alternatively, use
the Field list box to specify the bit field that you want to change.
6. In the = text box, type the new value that you want to assign to the bit field.
7. In the Action group, click the Write button.
Microcontrollers V10.x Targeting Manual
359
DRAFT
Working with Debugger
Debugging Bare Board Software
NOTE
The Revert and Write buttons appear enabled if the value in the = field is
changed or you reset the values.
The debugger updates the bit-field value. The bit values in the Value column and the
Bit Fields group change to reflect your modification.
NOTE
Click the Reset button to discard your changes and restore the original bit-field
value. Click the Revert button to revert to the last changes made.
Description
The Description group of the Registers view (Figure 4.27) shows explanatory information
for the selected register.
Figure 4.27 Register View — Description Group
The registers information covers:
• Name
• Current Value
• Description
• Bit field explanations and values
Some registers have multiple modes (meaning that the register’s bits can have multiple
meanings, depending on the current mode). If the register you examine has multiple
modes, you must select the appropriate mode.
Actions
Use the Actions group of the Registers view (Figure 4.28) to perform various operations
on the selected register's bit-field values.
360
Microcontrollers V10.x Targeting Manual
DRAFT
Working with Debugger
Debugging Bare Board Software
Figure 4.28 Register View — Actions Group
Table 4.21 lists each item in the Actions group and explains the purpose of each.
Table 4.21 Actions Group Items
Item
Description
Revert
Discard your changes to the current bit-field value and restore the last
change you made.
The debugger disables this button if you have not made any changes to
the bit-field value.
Write
Save your changes to the current bit-field value and write those changes
into the register's bit field.
The debugger disables this button after writing the new bit-field value, or
if you have not made any changes to that value.
Reset
Change each bit of the bit-field value to its register-reset value. The
register takes on this value after a target-device reset occurs.
To confirm the bit-field change, click Write. To cancel the change, click
Reset.
Summary
Display Description group content in a pop-up window. Press the Esc
key to close the pop-up window.
Format
Specify the data format of the displayed bit-field values.
Register Details Context Menu
To display the Register Details context menu, right-click on a bit-field value in the
Registers view. This menu's commands duplicate capabilities available in the Register
Details view.
Table 4.22 lists each command in the Registers view and explains the purpose of each.
Microcontrollers V10.x Targeting Manual
361
DRAFT
Working with Debugger
Debugging Bare Board Software
Table 4.22 Register Details Context Menu
Menu Command
Description
Select All
Selects the entire contents of the current bit-field value
Copy Registers
Copies to selected bit fields content to the system
clipboard
Enable
Lets the debugger to access the selected bit fields
Disable
Prevents the debugger from accessing the selected bit
fields
Display as Array
Opens a dialog box that you can use to display the
selected bit fields as an array of bit values
Cast to Type
Opens a dialog box that you can use to cast the selected
bit field values to a different data type
Restore Original Type
Reverts the selected bit-field values to their default data
types
Find
Opens a dialog box that you can use to select a particular
register or bit field
Change Value
Opens a dialog box that you can use to change the
current bit field value
Show Details As
Lets you specify how the debugger displays the register’s
contents. The options are:
Register Details Pane — The register’s values are
display in a bit format, along with a description of their
purpose.
Default Viewer — The register’s contents are displayed
as a hexadecimal value
362
Add Register Group
Opens a dialog box that you can use to create a new
collection of registers to display in the Registers view
Edit Register Group
Opens a dialog box that you can use to modify the
collection of registers that the Registers view displays for
the selected register group
Remove Register Group
Deletes the selected register group from the Registers
view
Microcontrollers V10.x Targeting Manual
DRAFT
Working with Debugger
Debugging Bare Board Software
Table 4.22 Register Details Context Menu (continued)
Menu Command
Description
Format
Use to specify the displayed data format of the selected
bit field values:
• Natural—default data format
• Binary—binary data format
• Decimal—decimal data format
• Hexadecimal—hexadecimal data format
Create Watch Expression
Adds a new watch-expression entry to the Expressions
view
Viewing Register Details
To open the Registers view, you must first start a debugging session.
To see the registers and their descriptions, perform these steps.
1. In the Debug perspective, click the Registers tab.
The Registers view (Figure 4.29) appears.
Figure 4.29 Registers View, Register Details
2. Click the toolbar’s menu button (the inverted triangle highlighted in Figure 4.29 ).
3. Select Layout > Vertical View Orientation or Layout > Horizontal View
Orientation to see the register details.
Microcontrollers V10.x Targeting Manual
363
DRAFT
Working with Debugger
Debugging Bare Board Software
NOTE
Selecting Layout > Registers View Only hides the register details.
4. Expand a register group to see individual registers.
5. Select a specific register by clicking on it.
The debugger enables the appropriate buttons in the Actions group of the Registers
view.
NOTE
Use the Format list box to specify the format of data that appears in the
Registers view.
6. Use the Register view to examine register details.
For example, examine register details in these ways:
• Expand the Bit Fields group to see a graphical representation of the selected
register's bit fields. You can use this graphical representation to select specific bits
or bit fields.
• Expand the Description group to see an explanation of the selected register, bit
field, or bit value.
TIP
To enlarge the Registers view, click Maximize of the view's toolbar. After you
finish looking at the register details, click Restore of the view's toolbar to return
the view to its previous size. Alternatively, right-click the Registers tab and select
Detached. The Registers view becomes a floating window that you can resize.
After you finish looking at the register details, right-click the Registers tab of the
floating window and select Detached again. You can rearrange the re-attached
view by dragging its tab to a different collection of view tabs.
Viewing Cache
NOTE
Cache not supported at this time.
Cache View Toolbar Menu
NOTE
364
Cache not supported at this time.
Microcontrollers V10.x Targeting Manual
DRAFT
Working with Debugger
Debugging Bare Board Software
Using Cache Coherency Switch
NOTE
Cache not supported at this time.
Setting Watchpoints
A watchpoint is another name for a data breakpoint. The debugger halts execution each
time the watchpoint location is read, written, or accessed (read or written). The debugger
lets you set a watchpoint on an address or range of addresses in memory.
NOTE
The debugger does not support setting a watchpoint on a stack variable or a
register variable. Watchpoint set on a local variable may result in halt of
execution at unexpected locations.
You can set the watchpoint from the:
• Add Watchpoint dialog box
• Breakpoints view
• Memory view
• Variables view
Setting the watchpoint type defines the conditions under which the debugger halts
execution.
The debugger handles both watchpoints and breakpoints in a similar way. You use the
Breakpoints view to manage both types. For example, you use the Breakpoints view to
add, remove, enable, and disable both watchpoints and breakpoints. The debugger
attempts to set the watchpoint if a session is in progress based on the active debugging
context (the active context is the selected project in the Debug view).
If the debugger sets the watchpoint when no debugging session is in progress, or when restarting a debugging session, the debugger attempts to set the watchpoint at startup as it
does for breakpoints. The Problems view displays error messages when the debugger fails
to set a watchpoint. For example, if you set watchpoints on overlapping memory ranges,
or if a watchpoint falls out of execution scope, an error message appears in the Problems
view. You can use this view to see additional information about the error.
Add Watchpoint Dialog Box
Use the Add Watchpoint dialog box to create a watchpoint for a memory range. You can
specify these parameters for a watchpoint:
• an address (including memory space)
• an expression that evaluates to an address
Microcontrollers V10.x Targeting Manual
365
DRAFT
Working with Debugger
Debugging Bare Board Software
• a memory range
• an access type on which to trigger
To open the Add Watchpoint dialog box:
1. Open the Debug perspective.
2. Click one of these tabs:
• Breakpoints
• Memory
• Variables
The corresponding view appears.
3. Right-click the appropriate content inside the view as mentioned in Table 4.23.
Table 4.23 Opening Add Watchpoint Dialog Box
In the View...
Right-Click...
Breakpoints
an empty area inside the view.
Memory
the cell or range of cells on which you want to set the watchpoint.
Variables
a global variable. Note that the debugger does not support setting
a watchpoint on a stack variable or a register variable.
4. Select Add Watchpoint (C/C++) from the context menu.
The Add Watchpoint dialog box appears as seen in Figure 4.30. The debugger sets
the watchpoint according to the settings that you specify in the Add Watchpoint
dialog box. The Breakpoints view shows information about the newly set watchpoint.
The Problems view shows error messages when the debugger fails to set the
watchpoint.
366
Microcontrollers V10.x Targeting Manual
DRAFT
Working with Debugger
Debugging Bare Board Software
Figure 4.30 Add Watchpoint Dialog Box
Table 4.24 describes the Add Watchpoint dialog box options.
Table 4.24 Add Watchpoint Dialog Box Options
Option
Description
Expression to watch
Enter an expression that evaluates to an address on the target
device. The debugger displays an error message when the
specified expression evaluates to an invalid address.
You can enter these types of expressions:
• An r-value, such as &variable
• A register-based expression. Use the $ character to
denote register names. For example, enter $SP-12
to have the debugger set a watchpoint on the stack
pointer address minus 12 bytes.
The Add Watchpoint dialog box does not support entering
expressions that evaluate to registers.
Memory space
Check this option to specify an address, including memory
space, at which to set the watchpoint.
Use the text box to specify the address or address range on
which to set the watchpoint. If a debugging session is not
active, the text/list box is empty, but you can still type an
address or address range.
Units
Enter the number of addressable units that the watchpoint
monitors.
Microcontrollers V10.x Targeting Manual
367
DRAFT
Working with Debugger
Debugging Bare Board Software
Table 4.24 Add Watchpoint Dialog Box Options (continued)
Option
Description
Write
Check this option to enable the watchpoint to monitor write
activity on the specified memory space and address range.
Clear this option if you do not want the watchpoint to monitor
write activity.
Read
Check this option to enable the watchpoint to monitor read
activity on the specified memory space and address range.
Clear this option if you do not want the watchpoint to monitor
read activity.
Removing Watchpoints
To remove a watchpoint, perform these steps.
1. Open the Breakpoints view if it is not already open by choosing Window > Show
View > Breakpoints.
The Breakpoint view appears, displaying a list of watchpoints.
2. Right-click on the watchpoint you wish to remove and select Remove from the menu
that appears.
The selected watchpoint is removed, and it disappears from the list in the Breakpoints
view.
Setting Breakpoints
The different breakpoint types that you can set are listed below:
• Software
The debugger sets a software breakpoint into target memory. When program
execution reaches the breakpoint, the processor stops and activates the debugger. The
breakpoint remains in the target memory until you remove it.
The breakpoint can only be set in writable memory like SRAM or DDR. You cannot
use this type of breakpoints in ROM.
• Hardware
Selecting the Hardware menu option causes the debugger to use the internal
processor breakpoints. These breakpoints are usually very few and can be used with
all types of memories (ROM/RAM) because they are implemented by using
processor registers.
368
Microcontrollers V10.x Targeting Manual
DRAFT
Working with Debugger
Debugging Bare Board Software
TIP
You can also set breakpoint types by issuing the bp command in the CodeWarrior
Debugger Shell view.
To set a breakpoint:
1. In the IDE's Debug perspective, click the Debug tab.
Figure 4.31 shows the Debug view.
2. Right clicking on a code line will set a breakpoint.
Figure 4.31 Debug View
3. Expand the Thread group.
4. Under the Thread group, select the thread that has the main() function.
The source code appears in an editor view as in Figure 4.32. The small blue arrow to
the left of the source code indicates which code statement the processor's program
counter is set to execute next.
Figure 4.32 Editor View
Microcontrollers V10.x Targeting Manual
369
DRAFT
Working with Debugger
Debugging Bare Board Software
5. In the editor view, place the cursor on the line that has this statement:
printf(“Hello World in C++!\n\r”);
6. Select Run > Toggle Line Breakpoint.
7. A blue dot appears in the marker bar to the left of the line as seen in Figure 4.33. This
dot indicates an enabled breakpoint. After the debugger installs the breakpoint, a blue
checkmark appears beside the dot. The debugger installs a breakpoint by loading into
the Java™ virtual machine the code in which you set that breakpoint.
TIP
An alternate way to set a breakpoint is to double-click the marker bar to the left of
any source-code line. If you set the breakpoint on a line that does not have an
executable statement, the debugger moves the breakpoint to the closest subsequent
line that has an executable statement. The marker bar shows the installed
breakpoint location. If you want to set a hardware breakpoint instead of a software
breakpoint, use the bp command in the Debugger Shell view. You can also rightclick on the marker bar to the left of any source-code line, and select Set Special
Breakpoint from the context menu.
Figure 4.33 Editor View — After Setting Breakpoints
8. From the menu bar, select Run > Resume.
The debugger executes all lines up to, but not including, the line at which you set the
breakpoint. The editor view highlights the line at which the debugger suspended
execution as shown in Figure 4.34. Note also that the program counter (blue arrow) is
positioned here.
370
Microcontrollers V10.x Targeting Manual
DRAFT
Working with Debugger
Debugging Bare Board Software
Figure 4.34 Editor View — After Reaching Breakpoint
Setting Hardware Breakpoints
There are two ways to set hardware breakpoints. These are:
• Using IDE to Set Hardware Breakpoint
• Using Debugger Shell to Set Hardware Breakpoint
Using IDE to Set Hardware Breakpoint
In either the C/C++ perspective or the Debug perspective, select the source line in the
Editor view where you want to place the breakpoint. Go to the marker bar on the left side
of the Editor view. Right-click on it to display a menu. Select Set Special Breakpoint >
Hardware to set a hardware breakpoint.
Using Debugger Shell to Set Hardware Breakpoint
Use the Debugger Shell view to set hardware breakpoints. Perform these steps to use the
debugger shell to set a hardware breakpoint:
1. Open the Debugger Shell view.
2. Begin the command line with the text: bp -hw
3. Complete the command line by specifying the function, address, or file at which you
want to set the hardware breakpoint.
For example, to set a breakpoint at line 6 in the source file main.c, type:
bp -hw main.c 6
4. Press the Enter key.
The debugger shell executes the command and sets the hardware breakpoint.
Microcontrollers V10.x Targeting Manual
371
DRAFT
Working with Debugger
Debugging Bare Board Software
TIP
Enter help bp at the command-line prompt to see examples of the bp
command syntax and usage.
Removing Breakpoints
To remove a breakpoint from your program, you have two options. These are:
• Remove Breakpoint Using Marker Bar
• Remove Breakpoint Using Breakpoints View
NOTE
To remove hardware breakpoints, see the topic Removing Hardware
Breakpoints, for more information.
Remove Breakpoint Using Marker Bar
To remove an existing breakpoint using the marker bar, perform these steps.
1. Right-click on the existing breakpoint in the marker bar.
2. Select Toggle Breakpoint from the menu that appears.
Remove Breakpoint Using Breakpoints View
To remove an existing breakpoint using the Breakpoints view, perform these steps.
1. Open the Breakpoints view if it is not already open by choosing Window > Show
View > Breakpoints.
The Breakpoint view appears, displaying a list of breakpoints.
2. Right-click on the breakpoint you want to remove and select Remove from the context
menu (Figure 4.35).
The selected breakpoint is removed, and it disappears from the both the marker bar and
the list in the view.
NOTE
372
To remove all of the breakpoints from the program at once, select Remove All
from the context menu.
Microcontrollers V10.x Targeting Manual
DRAFT
Working with Debugger
Debugging Bare Board Software
Figure 4.35 Removing Breakpoint
Removing Hardware Breakpoints
There are two ways to remove existing hardware breakpoints. These are:
• Remove Hardware Breakpoint Using IDE
• Remove Hardware Breakpoint Using Debugger Shell
Remove Hardware Breakpoint Using IDE
To remove a hardware breakpoint, perform these steps.
1. Right-click on the existing breakpoint in the marker bar.
2. Select Toggle Breakpoint from the menu that appears.
Alternatively, you may remove the breakpoint from the Breakpoint view by performing
these steps.
1. Open the Breakpoints view if it is not already open by choosing Window > Show
View > Breakpoints.
The Breakpoint view appears, displaying a list of breakpoints.
2. Right-click on the hardware breakpoint you wish to remove and select Remove from
the menu that appears, as shown in Figure 4.35.
The selected breakpoint is removed, and it disappears from the both the marker bar and
the list in the view.
Remove Hardware Breakpoint Using Debugger Shell
To remove a hardware breakpoint using the Debugger Shell view, perform these steps.
Microcontrollers V10.x Targeting Manual
373
DRAFT
Working with Debugger
Debugging Bare Board Software
1. Open the Debugger Shell view.
2. Begin the command line with the text: bp#
3. Complete the command line by specifying the function, address, or file at which you
want to remove the hardware breakpoint.
For example, to remove a breakpoint at line 6 in the source file main.c, type:
bp#<bp_index> off
Where, <bp_index> is the index if the hardware breakpoint is at line 6.
4. Press the Enter key.
The debugger shell executes the command and removes the hardware breakpoint.
Setting Stack Crawl Depth
Select the Maximum stack crawl depth command lets you set the depth of the stack to
read and display. Showing all levels of calls when you are examining function calls
several levels deep can sometimes make stepping through code more time-consuming.
Therefore, you can use this menu option to reduce the depth of calls that the debugger
displays.
To set the stack crawl depth, perform these step:
1. Select Window > Preferences.
The Preferences window appears.
2. Expand the C/C++ tree control and select Debug.
The general settings for C/C++ debugging are displayed on the right-hand side of the
Preferences window.
3. Specify the appropriate stack crawl depth, in the Maximum stack crawl depth text
box.
NOTE
You can specify any integer from 1 to 100.
Viewing Memory
Use the Memory view to examine the active memory rendering of a specified expression
or address. To display this view from the Debug perspective, Select Window > Show
View > Memory, and the Memory view appears.
The Memory view supports the display of multiple memory spaces. Figure 4.36 shows the
Memory view with the Expression:baseaddr <name> tree active memory rendering tab.
374
Microcontrollers V10.x Targeting Manual
DRAFT
Working with Debugger
Debugging Bare Board Software
Figure 4.36 Memory View
Adding Memory Monitor
You can add multiple memory monitors to the Memory view. To add a new memory
monitor, perform these steps.
1. Start a debugging session.
2. Open the Memory view.
3. Click the plus-sign
icon on the Monitors pane toolbar. Alternatively, right-click
in the Monitors pane and select Add Memory Monitor from the context menu.
4. The Monitor Memory dialog box (Figure 4.37) appears.
NOTE
The Enter memory space and address option appears only when the
debugger associated with the active debugging context supports memory
spaces, and the currently debugged process has multiple memory spaces.
5. Specify options as explained in Table 4.25.
Table 4.25 Monitor Memory Dialog Box Options
Option
Description
Enter address or
expression
Enter the expression to monitor in decimal or hexadecimal
values. You can use the drop-down list to select a previously
specified expression
Memory Space
Check to specify the memory space (Paged or Flash).
Microcontrollers V10.x Targeting Manual
375
DRAFT
Working with Debugger
Debugging Bare Board Software
Figure 4.37 Monitor Memory Dialog Box
6. Click OK.
The memory monitor appears in the Memory view (Figure 4.36).
Adding Memory Rendering
You can use the Renderings pane of the Memory view to examine the memory content,
starting at any valid address. The information displayed in this page is readonly and
cannot be used to modify the memory content.
To add a new memory rendering, perform these steps.
1. Start a debugging session.
2. Open the Memory view.
3. In the Monitors pane, select the memory monitor for which you want to add a memory
rendering.
NOTE
To create a memory monitor, right-click a blank area in the Monitors pane and
select Add Memory Monitor. Alternatively, click the plus-sign
icon in
the Monitors pane toolbar.
4. Click the New Renderings tab.
The New Renderings view appears.
Figure 4.38 New Renderings View
376
Microcontrollers V10.x Targeting Manual
DRAFT
Working with Debugger
Debugging Bare Board Software
5. Select a rendering type from the Select rendering(s) to create list and click the Add
Rendering(s) button. Alternatively, right-click in the Renderings pane and select
Add Memory Rendering from the context menu. For example, select Disassembly.
6. Click OK.
The selected memory rendering type appears in the Memory view.
Figure 4.39 Added Rendering
Removing Memory Rendering
To remove a memory rendering from the Memory view, perform these steps.
1. Open the Memory view.
2. In the Renderings pane, select the tab that corresponds to the memory rendering that
you want to remove.
3. Click the cross-sign
icon on the Renderings pane toolbar. Alternatively, rightclick on the Renderings pane and select Remove Rendering from the context menu.
The memory rendering is removed from the Memory view.
Resetting to Base Address
To reset the memory rendering and display the base address of the rendering, perform
these steps.
1. Open the Memory view.
2. In the Renderings pane, select the tab that corresponds to the disassembly rendering
that you want to reset to the base address.
3. Right-click in the Renderings pane and select Reset to Base from the context menu.
4. The disassembly rendering scrolls to the line that contains the base address of the
displayed rendering.
Microcontrollers V10.x Targeting Manual
377
DRAFT
Working with Debugger
Debugging Externally Built Executable Files
Go to Address
The memory view provides graphical controls to display memory at a specific address. To
go to a specific address, perform these steps.
1. Open the Memory view.
2. In the Renderings pane, select the tab that corresponds to the disassembly rendering
for which you want to display a specific address.
3. Right-click in the Renderings pane and select Go to Address from the context menu.
A group of controls appears on the Renderings pane (Figure 4.40).
4. In the blank text box, enter the address that you want to display.
Figure 4.40 Disassembly Rendering - Go to Address
NOTE
Check the Input as Hex checkbox only if you enter the address in hexadecimal
notation.
5. Click OK to have the Disassembly rendering scroll to the specified address.
Alternatively, click Cancel to abort the operation and hide the group of controls.
Hard Resetting
Use the reset hard command in the Debugger Shell view to send a hard reset signal
to the target processor.
NOTE
The Hard Reset command is enabled only if the debug hardware you are using
supports it.
Debugging Externally Built Executable Files
You can use the Microcontrollers ELF executable wizard to debug an .elf file generated by
a different IDE. To debug externally built executable files, perform these steps.
378
Microcontrollers V10.x Targeting Manual
DRAFT
Working with Debugger
Debugging Externally Built Executable Files
The main purpose of the MCU Executable Import wizard is to create a CodeWarrior for
Microcontrollers Eclipse project that can be readily debugged starting from an executable
file build with a Microcontrollers toolchain.
The MCU Executable Import wizard lets you import a *.elf, *.abs, or *.flt file
and associate it to a project.
This topic describes the various pages that the wizard displays as it assists you in
importing and associating an executable (*.elf, *.abs, or *.flt) file to a project.
• Import a MCU Executable File Page
• Select MCU executable file to be imported Page
• Device and Connection Page
• Connections Page
• Debug an Externally Built Executable File
Import a MCU Executable File Page
Use this page to name your new project, and specify the workspace directory.
Figure 4.41 Import MCU Executable — Import a MCU Executable File Page
Table 4.26 describes the purpose of the various options.
Microcontrollers V10.x Targeting Manual
379
DRAFT
Working with Debugger
Debugging Externally Built Executable Files
Table 4.26 Import a MCU Executable File Page Settings
Option
Description
New Project Name
Enter the name for the new project in this
text box.
Use default location
Stores the files required to build the program
in the Workbench’s current workspace
directory. The project files are located in the
directory you specify. Use the Location
option to select the directory.
Location
Specifies the directory that contains the
project files. Click Browse to navigate to the
desired directory. This option is only
available when Use default location is
clear.
Select MCU executable file to be imported
Page
Use this page to select an existing Microcontrollers ELF, ABS, or FLT file you want
to import.
380
Microcontrollers V10.x Targeting Manual
DRAFT
Working with Debugger
Debugging Externally Built Executable Files
Figure 4.42 Import MCU Executable — Select MCU executable file to be imported Page
Table 4.27 explains the options available on the page.
Table 4.27 Select MCU executable file to be imported Page Settings
Option
Description
File to Import
Specifies the path of the ELF, ABS, or FLT
files.
Browse
Click to locate the directory that contains the
*.elf, *.abs, or *.flt files
Copy to project
Check to copy the selected import file in the
new project.
MCU Bare Board Executable
Select to use the microcontrollers bareboard
executable.
ColdFire Linux/uClinux Executable for
Application Debug
Select to use the ColdFire Linux/uClinux
executable for application debug.
Microcontrollers V10.x Targeting Manual
381
DRAFT
Working with Debugger
Debugging Externally Built Executable Files
Table 4.27 Select MCU executable file to be imported Page Settings
Option
Description
ColdFire Linux/uClinux Kernel Image
Select to use the ColdFire Linux/uClinux
Kernel Image.
Select binary parser
Select a binary parser for the executable to
be imported into the CodeWarrior IDE. The
drop-down list includes various parsers
supported by the CodeWarrior IDE.The
commonly used parsers are:
• ELF/ABS parser
• bFLT (uClinux flat binary) parser
Device and Connection Page
Use this page to select the derivative or board you would like to use.
Figure 4.43 Import MCU Executable — Device and Connection Page
382
Microcontrollers V10.x Targeting Manual
DRAFT
Working with Debugger
Debugging Externally Built Executable Files
Connections Page
Use this page to select a connection to use for the project. Depending on the selected
derivative or board, the connections will appear enabled or grayed out.
Figure 4.44 Import MCU Executable — Connections Page
Debug an Externally Built Executable File
You can use the Microcontrollers ELF Executable wizard to debug an .elf file generated
by a different IDE. To debug externally built executable files, perform these steps.
1. Import a MCU Executable File Page
2. Specify Executable File to Import
3. Select Derivative or Board
4. Select Connection
5. Edit Launch Configuration
6. Specify Source Lookup Path
7. Debug Executable File
Microcontrollers V10.x Targeting Manual
383
DRAFT
Working with Debugger
Debugging Externally Built Executable Files
Import a MCU Executable File
You specify the externally built executable file that you want to debug in the CodeWarrior
IDE. The IDE imports the executable file into a new project. To specify the executable
file, perform these steps.
1. Select Start > Programs > Freescale CodeWarrior > CW for Microcontrollers V
number > CodeWarrior, where number is the version number of your product.
The IDE launches and the WorkSpace Launcher dialog box prompts you to select a
workspace to use.
Figure 4.45 WorkSpace Launcher Dialog Box
2. Click OK to accept the default workspace. To use a workspace different from the
default, click Browse and specify the desired workspace.
The IDE starts and displays the Welcome page.
NOTE
You can also select the Use this as the default and do not ask again checkbox
to set default/selected path as a default location for storing all your projects.
3. Click the Go to Workbench link.
The Workbench window opens.
4. Select File > Import, from the IDE menu bar.
The Import wizard appears.
5. Expand the C/C++ group.
6. Select MCU Executable to debug a Microcontrollers *.elf, *.abs, or *.flt
file as shown in Figure 4.46.
384
Microcontrollers V10.x Targeting Manual
DRAFT
Working with Debugger
Debugging Externally Built Executable Files
Figure 4.46 Import Wizard — Select MCU Executable
7. Click Next.
The Import a MCU executable file page (Figure 4.47) appears.
8. Specify a name for the new project. For example, enter the project name as
ImportProject_1.
NOTE
Clear the Use default location checkbox and click Browse to specify different
location for the new project. By default, the Use default location checkbox is
checked.
Microcontrollers V10.x Targeting Manual
385
DRAFT
Working with Debugger
Debugging Externally Built Executable Files
Figure 4.47 Import MCU Executable — Import a MCU executable file Page
9. Click Next.
The Select MCU executable file to be imported page appears.
Specify Executable File to Import
1. Click Browse.
The Select file dialog box appears.
2. Navigate to the executable file that you want to import and click Open.
The path of the selected file appears in the File to import text box.
3. Check the Copy to project checkbox if you want to copy the specified file in the new
project. By default, the Copy to project checkbox is cleared.
4. From the Select binary parser to use drop-down list, select the parser you want to
use. (Figure 4.48).
386
Microcontrollers V10.x Targeting Manual
DRAFT
Working with Debugger
Debugging Externally Built Executable Files
Figure 4.48 MCU Executable — Specify MCU Executable File to Import
5. Click Next.
The Device and Connection page appears.
Select Derivative or Board
1. Expand the tree control and select the derivative or board you would like to use. For
example, select HCS08 > HCS08A Family > MC9S08AC128.
2. Click Next.
The Connections page appears.
Select Connection
1. Select the desired connection from the Connection to be used group. For example,
check the P&E Full Chip Simulation checkbox.
NOTE
You can select multiple connections by checking appropriate checkboxes in the
Connections page.
Microcontrollers V10.x Targeting Manual
387
DRAFT
Working with Debugger
Debugging Externally Built Executable Files
2. Click Finish.
The Import MCU Executable window closes and the wizard creates a project
according to your specifications. You can access the project from the CodeWarrior
Projects view in the Workbench window.
3. Right-click on the project and from the context menu select Build Project.
Figure 4.49 CodeWarrior Projects View
The new project is ready for use. You can now customize it by adding your own source
code files, changing debugger settings, or adding libraries.
Edit Launch Configuration
Before you edit the launch configuration, ensure that you create a project for the
executable file.
To edit the launch configuration for your executable file, perform these steps.
1. From the main menu bar of the IDE, select Run > Debug Configurations. The IDE
uses the settings in the launch configuration to generate debugging information and
initiate communications with the target board.
The Debug Configurations dialog box appears. The left side of this dialog box has a
list of debug configurations that apply to the current application.
388
Microcontrollers V10.x Targeting Manual
DRAFT
Working with Debugger
Debugging Externally Built Executable Files
Figure 4.50 Debug Configurations Dialog Box
2. Expand the CodeWarrior Download configuration.
3. From the expanded list, select the newly created debug configuration. For example,
select ImportProject_1 - MC9S08AC128.
Microcontrollers V10.x Targeting Manual
389
DRAFT
Working with Debugger
Debugging Externally Built Executable Files
Figure 4.51 Selected Launch Configuration
4. Click the Debugger tab of the Debug Configurations dialog box.
The corresponding page appears.
5. Use the Debugger list box to specify the debugger that corresponds to your type of
executable file.
6. Configure the debugger options as appropriate for your executable file.
For example, specify the appropriate target processor, any initialization files, and
connection protocol.
Specify Source Lookup Path
You need to specify the source lookup path in terms of the compilation path and the local
file-system path for the newly imported executable file. The CodeWarrior debugger uses
both of these paths to debug the executable file.
The compilation path is the path to the original project that built the executable file. If the
original project is from an IDE on a different computer, you specify the compilation path
in terms of the file system on that computer.
The local file-system path is the path to the project that the CodeWarrior IDE creates in
order to debug the executable file.
To specify a source lookup path for your executable file:
390
Microcontrollers V10.x Targeting Manual
DRAFT
Working with Debugger
Debugging Externally Built Executable Files
1. Click the Source tab of the Debug Configurations dialog box.
The corresponding page ( Figure 4.52) appears.
Figure 4.52 Debug Configurations Dialog Box—Source Page
2. Click Add.
The Add Source dialog box appears.
3. Select Path Mapping (Figure 4.53).
Figure 4.53 Add Source Dialog Box
4. Click OK.
The Add Source dialog box closes. The IDE selects the new mapping in the Source
Lookup Path list of the Source page.
Microcontrollers V10.x Targeting Manual
391
DRAFT
Working with Debugger
Debugging Externally Built Executable Files
Figure 4.54 Source Lookup Path
5. Click the Edit button of the Source page.
The Path Mappings dialog box (Figure 4.55) appears.
6. In the Name text box, enter the name of the new path mapping.
The name you enter also appears in the Source Lookup Path list of the Source page.
Figure 4.55 Path Mappings Dialog Box
7. Click Add.
The Path Mapping dialog box (Figure 4.56) appears.
392
Microcontrollers V10.x Targeting Manual
DRAFT
Working with Debugger
Debugging Externally Built Executable Files
Figure 4.56 Path Mapping Dialog Box
8. In the Compilation path text box, enter the path to the parent project of the executable
file, relative to the computer that generated the file.
TIP
You can use the IDE to discover the path to the parent project of the executable
file, relative to the computer that generated the file. In the C/C++ Projects view of
the C/C++ perspective, expand the project that contains the executable file that
you want to debug. Next, expand the group that has the name of the executable file
itself. A list of paths appears, relative to the computer that generated the file.
Search this list for the names of source files used to build the executable file. The
path to the parent project of one of these source files is the path you should enter in
the Compilation path text box.
9. In the Local file system path text box, enter the path to the parent project of the
executable file, relative to your computer. Alternatively, click the Browse button to
specify the parent project.
10. Click OK.
The Path Mapping dialog box closes. The mapping information now appears in the
Path Mappings dialog box.
Microcontrollers V10.x Targeting Manual
393
DRAFT
Working with Debugger
Debugging Externally Built Executable Files
Figure 4.57 Path Mappings Dialog Box
11. Click OK.
The Path Mappings dialog box closes. The mapping information now appears under
the path mapping shown in the Source Lookup Path list of the Source page.
12. If required, change the order in which the IDE searches the paths.
The IDE searches the paths in the order shown in the Source Lookup Path list,
stopping at the first match. To change this order, select a path, then click the Up or
Down button to change its position in the list.
13. Click Apply.
The IDE saves your changes.
Debug Executable File
Use the CodeWarrior debugger to debug the externally built executable file.
To debug the executable file, click the Debug button of the Debug Configurations dialog
box.
394
Microcontrollers V10.x Targeting Manual
DRAFT
5
Scripting
CodeWarrior supports a command-line interface to some of its features including the
debugger. You can use the command-line interface together with various scripting
engines, such as the Microsoft® Visual Basic® script engine, the Java™ script engine,
TCL, Python, and Perl. You can even issue a command that saves the command-line
activity to a log file.
You use the Debugger Shell view (Figure 5.1) to issue command lines to the IDE. For
example, you enter the command debug in this window to start a debugging session. The
window lists the standard output and standard error streams of command-line activity.
Figure 5.1 Debugger Shell View
To open the Debugger Shell view, perform these steps.
1. Switch the IDE to the Debug perspective and start a debugging session.
2. Select Window > Show View > Debugger Shell.
The Debugger Shell view appears (Figure 5.1).
NOTE
Alternatively, select Window > Show View > Other. Expand the Debug tree
control in the Show View dialog box, select Debugger Shell, and click OK.
Microcontrollers V10.x Targeting Manual
395
DRAFT
Scripting
Figure 5.2 Show View - Debugger Shell
To issue a command-line command, type the desired command at the command prompt
(%>) in the Debugger Shell view, then press Enter or Return. The command-line
debugger executes the specified command.
If you work with hardware as part of your project, you can use the command-line
debugger to issue commands to the debugger while the hardware is running.
NOTE
TIP
To list the commands the command-line debugger supports, type help at the
command prompt and press Enter. The help command lists each supported
command along with a brief description of each command.
To view page-wise listing of the debugger shell commands, right-click in the
Debugger Shell view and select Paging from the context menu. Alternatively,
click the Enable Paging
icon.
When you debug from the command line, you can use:
• Tcl Support
• Command-Line Debugging Tasks
• Debugger Shell Command List
• Microcontrollers-Specific HIWARE Commands
396
Microcontrollers V10.x Targeting Manual
DRAFT
Scripting
Tcl Support
Tcl Support
This topic describes command-line debugger’s Tcl support.
Resolution of Conflicting Command
Names
The names of several command-line debugger commands conflict with the Tcl
commands. Table 5.1 explains how the command-line debugger resolves such conflicts (if
the mode is set to auto).
Table 5.1 Resolving Conflicting Commands
Command
Resolution
load
If you pass the command-line debugger a load
command that includes a filename containing the
suffix .eld or .mcp, the debugger loads the
project. Otherwise, the debugger invokes the Tcl
load command.
bp
If you pass the command-line debugger a bp
command from within a script and the command
has no arguments, the debugger invokes the Tcl
break command. Otherwise, the debugger
interprets a break command as a command to
control breakpoints.
close
If you pass the command-line debugger a close
command that has no arguments, the debugger
terminates the debug session. Otherwise, the
debugger invokes the Tcl close command.
Execution of Script Files
Tcl usually executes a script file as one large block, returning only after execution of the
entire file. For the run command, however, the command-line debugger executes script
files line-by-line. If a particular line is not a complete Tcl command, the debugger
appends the next line. The debugger continues appending lines until it gets a complete Tcl
script block.
Listing 5.1 lists code that includes a script. For the Tcl source command, the
debugger executes this script as one block. But for the run debug command, the debugger
executes this script as two blocks: the set statement and the while loop.
Microcontrollers V10.x Targeting Manual
397
DRAFT
Scripting
Tcl Support
Listing 5.1 Example Tcl Script
set x 0;
while {$x < 5}
{
puts "x is $x";
set x [expr $x + 1]
}
NOTE
The run debug command synchronizes debug events between blocks in a
script file. For example, after a go, next, or step command, run polls the
debug thread state and does not execute the next line or block until the debug
thread terminates.
However, the Tcl source command does not consider the debug thread state.
Consequently, use the run debug command to execute script files that contain
these debug commands: debug, go, next, stop, and kill.
Tcl Startup Script
The command-line debugger can automatically run a Tcl script each time you open the
command-line debugger window. This script is called a startup script.
You can use both Tcl and command-line debugger commands in the startup script. For
example, you might include commands that set an alias or a define color configuration in a
startup script.
To create a command-line debugger startup script, follow these steps.
1. Put the desired Tcl and command-line debugger commands in a text file.
2. Name this file tcld.tcl.
3. Place tcld.tcl in one of the directories listed below.
• On a Windows® PC, put tcld.tcl in the system directory.
For example, on Windows XP, put tcld.tcl in the WINDOWS directory.
• On a Solaris Workstation, put tcld.tcl in your home directory.
NOTE
398
There is no synchronization of debug events in the startup script.
Consequently, put the c debug command to the startup script and place these
debug commands in another script so they will execute properly: debug, go,
stop, kill, next, and step.
Microcontrollers V10.x Targeting Manual
DRAFT
Scripting
Command-Line Debugging Tasks
Command-Line Debugging Tasks
Table 5.2 provides instructions for common command-line debugging tasks.
Table 5.2 Common Command-Line Debugging Tasks
Task
Instruction
Comments
Open the
Debugger Shell
Select Windows >
Show View > Others >
Debugger Shell
The Debugger Shell view appears.
Use the help
command
1. On the Debugger shell
command prompt (%>),
type help.
The Command List for CodeWarrior
is appears.
2. Press Enter.
Enter a command
1. On the Debugger
shell, type a command
followed by a space.
You can use shortcuts instead of
complete command names, such as
k for kill.
2. Type any valid
command-line options,
separating each with a
space.
3. Press Enter.
View debug
command hints
Type alias followed by a
space
Review previous
commands
Press Up Arrow and
Down Arrow keys
Clear command
from the command
line
Press the Esc key
Stop an executing
script
Press the Esc key
Toggle between
insert/overwrite
mode
Press the Insert key
Scroll up/ down a
page
Press Page Up or Page
The syntax for the rest of the
command appears.
Down key
Microcontrollers V10.x Targeting Manual
399
DRAFT
Scripting
Debugger Shell Command List
Table 5.2 Common Command-Line Debugging Tasks (continued)
Task
Instruction
Comments
Scroll left/right one
column
Press Ctrl-Left Arrow or
Ctrl-Right Arrow keys
Scroll to
beginning or end
of buffer
Press Ctrl-Home or CtrlEnd keys
Debugger Shell Command List
This topic lists and defines each command-line debugger command.
about
Lists the version information.
Syntax
about
alias
Creates an alias for a debug command, removes such an alias, or lists all current aliases.
Syntax
alias [<alias> [<command>]]
Parameters
alias
Lists current aliases.
Examples
Table 5.3 lists and defines examples of the alias command.
400
Microcontrollers V10.x Targeting Manual
DRAFT
Scripting
Debugger Shell Command List
Table 5.3 alias Command-Line Debugger Command — Examples
Command
Description
alias
Lists current aliases.
alias ls dir
Issue the dir command when ls is typed.
alias ls
Remove the alias ls.
bp
Sets a breakpoint, removes a breakpoint, or lists the current breakpoints.
Syntax
bp [-{hw|sw|auto}] {<func>|[<ms>:]<addr>|<file> <line>
[<column>]}
bp all|#<id>|<func>|<addr> off|enable|disable
Examples
Table 5.4 lists and defines examples of the bp command.
Table 5.4 bp Command-Line Debugger Command — Examples
Command
Description
bp
Lists all breakpoints.
bp -hw fn
Set hardware breakpoint at function fn().
bp -auto
Set an auto breakpoint on file file.cpp at line 101, column 1.
file.cpp 101 1
bp fn off
Remove the breakpoint at function fn().
bp 10343
Set a breakpoint at memory address 10343.
bp #4 off
Remove the breakpoint number 4.
bp #4 disable
Disable the breakpoint number 4.
Microcontrollers V10.x Targeting Manual
401
DRAFT
Scripting
Debugger Shell Command List
Table 5.4 bp Command-Line Debugger Command — Examples
Command
Description
bp #4 cond x
== 3
Set the condition for breakpoint number 4 to fire only if x == 3.
bp #4 cond Hit
Count % 3 == 0
Break every third time. Hit Count corresponds to the breakpoint
property of the same name.
cd
Changes to a different directory or lists the current directory. Pressing the Tab key
completes the directory name automatically.
Syntax
cd [<path>]
Parameter
path
Directory pathname; accepts asterisks and wildcards.
Examples
Table 5.5 lists and defines examples of the cd command.
Table 5.5 cd Command-Line Debugger Command—Examples
402
Command
Description
cd
Lists current directory.
cd c:
Changes to the C: drive root directory.
cd d:/mw/0622/
test
Changes to the specified D: drive directory
cd c:p*s
Changes to any C: drive directory whose name starts with p and
ends with s.
Microcontrollers V10.x Targeting Manual
DRAFT
Scripting
Debugger Shell Command List
change
Changes the contents of register, memory location, block of registers, or memory
locations.
Syntax
change <addr-spec> [<range>] [-s|-ns] [%<conv>] <value>
change <addr-spec>{..<addr>|#<n>} [<range>] [-s|ns] [%<conv>] <value>
change <reg-spec> [<n>] [-s|-ns] [%<conv>] <value>
change <reg-spec>{..<reg>|#<n>} [-s|-ns] [%<conv>]
<value>
change <var-spec> [-s|-ns] [%<conv>] <value>
change v <var> [-s|-ns] [%<conv>] <value>
Parameter
<addr-spec> [<ms>:]<addr>
On architectures supporting multiple memory spaces, specifies the memory space
in which <addr> is to be found.
See the help for the option -ms of display or mem for more information on memory
spaces. If unspecified, the setting config MemIdentifier is used.
<addr>
Target address in hex format.
<count>
Number of memory cells.
x<cell-size>
Memory is displayed in units called cells, where each cell consists of <cellsize> bytes. If unspecified, the setting config MemWidth is used.
h<access-size>
Memory is accessed with a hardware access size of <access-size> bytes.
If unspecified, the setting config MemWidth is used.
%<conv>
Specifies the type of the data. Possible values for <conv> are given below. The
default conversion is set by the radix command for memory and registers and by
the config var command for variables.
Microcontrollers V10.x Targeting Manual
403
DRAFT
Scripting
Debugger Shell Command List
• %x Hexadecimal
• %d Signed decimal
• %u Unsigned decimal
• %f Floating point
Examples
The examples assume the following settings:
• radix x
• config MemIdentifier 0
• config MemWidth 32
• config MemAccess 32
• config MemSwap off
Table 5.6 lists and defines Memory examples of the change command.
Table 5.6 change Command-Line Debugger Command—Memory Examples
Command
Description
change 10000
10
Change memory range 0x10000-3 to 0x10 (because radix is hex).
change 1:10000
20
Change memory range 0x10000-3, memory space 1, to 0x20.
change 10000
16 20
Change each of 16 cells in the memory range 0x10000-3f to
0x20.
change 10000
16x1h8 31
Change each of 16, 1-byte cells to 0x31, using a hardware
access size of 8-bytes per write.
change 10000 s %d 200
Change memory range 0x10000-3 to c8000000.
Table 5.7 lists and defines Register examples of the change command.
404
Microcontrollers V10.x Targeting Manual
DRAFT
Scripting
Debugger Shell Command List
Table 5.7 change Command-Line Debugger Command—Register Examples
Command
Description
change R1 123
Change register R1 to 0x123.
change R1..R5
5432
Change registers R1 through R5 to 0x5432.
change
"General
Purpose
Registers/R1"
100
Change register R1 in the General Purpose Register group to
0x100.
Table 5.8 lists and defines Variable examples of the change command.
Table 5.8 change Command-Line Debugger Command—Variable Examples
Command
Description
change myVar
10
Change the value of variable myVar to 16 (0x10)
cls
Clears the command line debugger window.
Syntax
cls
config
Lists current configuration information, provides the name of the default project or build
target, or configures:
• command-line debugger window colors.
• command-line debugger window scrolling size.
• command-line debugger window mode.
• Default build target
Microcontrollers V10.x Targeting Manual
405
DRAFT
Scripting
Debugger Shell Command List
• Hexadecimal prefix
• Memory identifier
• Processor name
• Subprocessor name
Syntax
conf[ig] [ c[olor] [r | m | c | s | e | n]
text_color [background_color] |
m[ode] [ dsp | tcl | auto] |
s[croll] number_of_lines |
h[exprefix] hexadecimal_prefix |
mem[identifier] memory_identifier |
p[rocessor] processor_name [subprocessor_name] ]
Parameter
color text indicators —
r (registers), m (memory), c (commands), s (script), e (errors), or n (normal)
text_color
Text color values for red, green, and blue, each from 0 through 255.
background_color
Background color values for red, green, and blue, each from 0 through 255.
mode
Command-name conflict resolution mode:
• dsp: use command-line debug commands
• tcl: use tcl commands
• auto: resolve automatically
number_of_lines
Number of lines to scroll.
hexadecimal_prefix
Prefix for display of hexadecimal values.
memory_identifier
Memory identifier.
processor_name
406
Microcontrollers V10.x Targeting Manual
DRAFT
Scripting
Debugger Shell Command List
Name or identifier of target processor.
subprocessor_name
Name or identifier of target subprocessor.
target_name
Name of build target.
Examples
Table 5.9 lists and defines examples of the config command.
Table 5.9 config Command-Line Debugger Command—Examples
Command
Description
config
Lists current configuration information.
config c e $ff
$0 $0
Sets error text to red.
config c r $0
$0 $0 $ff $ff
$ff
Sets register display to black, on a white background.
config m dsp
Sets clash resolution to dsp mode.
config
hexprefix 0x
Specifies 0x prefix for hexadecimal values.
config
memidentifier
m
Sets memory identifier to m.
config
processor 8101
Sets processor to 8101.
config project
Lists default-project name.
config target
Lists default build-target name.
config target
debug release
x86
Changes default build-target name to debug release x86.
Microcontrollers V10.x Targeting Manual
407
DRAFT
Scripting
Debugger Shell Command List
copy
Copies contents of a memory address or address block to another memory location.
Syntax
copy [<ms>:]<addr>[..<addr>|#<bytes>] [<ms>:]<addr>
Parameter
<addr>
One of these memory-address specifications:
• A single address
• First address of the destination memory block.
Examples
Table 5.10 lists and defines examples of the copy command.
Table 5.10 copy Command-Line Debugger Command—Examples
Command
Description
copy 00..1f 30
Copy memory addresses 00 through 1f to address 30.
copy 20#10 50
Copy 10 memory locations beginning at memory location 20 to
memory beginning at location 50.
debug
Launches a debug session.
Syntax
debug [<index> | <debug-config-name>]
Examples
Table 5.11 lists and defines examples of the debug command.
408
Microcontrollers V10.x Targeting Manual
DRAFT
Scripting
Debugger Shell Command List
Table 5.11 debug Command-Line Debugger Command—Examples
Command
Description
debug
Start debugging using the default launch configuration, which is
the last debugged configuration if one exists and index 0
otherwise.
debug 3
Start debugging using the launch configuration at index 3. Type
launch for the current set of launch configurations.
debug {My
Launch Config}
Start debugging using the launch configuration named My
Launch Config. Type launch for the current set of launch
configurations.
dir
Lists directory contents.
Syntax
dir [path|files]
Examples
Table 5.12 lists and defines examples of the dir command.
Table 5.12 dir Command-Line Debugger Command—Examples
Command
Description
dir
Lists all files of the current directory.
di *.txt
Lists all current-directory files that have the .txt file name
extension.
dir c:/tmp
Lists all files in the tmp directory on the C: drive.
dir /ad
Lists only the subdirectories of the current directory.
disassemble
Disassembles the instructions of the specified memory block.
Microcontrollers V10.x Targeting Manual
409
DRAFT
Scripting
Debugger Shell Command List
Syntax
disassemble
disassemble pc|[<ms>:]<addr> [<count>]
disassemble reset
disassemble [<ms>:]<a1>{..<a2>|#<n>}
Parameter
[none]
With no options, the next block of instructions is listed. After a target stop event,
the next block starts at the PC.
[<ms>:]<addr>
Target address in hex. On targets with multiple memory spaces, a memory space id
can be specified.
pc
The current program counter.
<count>
Number of instructions to be listed.
reset
Reset the next block to the PC and the instruction count to one screen.
<a1>{..<a2>|#<n>}
Specifies a range of memory either by two endpoints, <a1> and <a2>, or by a
startpoint and a count, <a1> and <n>.
Examples
Table 5.13 lists and defines examples of the disassemble command.
Table 5.13 disassemble Command-Line Debugger Command—Examples
410
Command
Description
disassemble
Lists the next block of instructions.
disassemble
reset
Reset the next block to the PC and the instruction count to one
screenful.
disassemble pc
Lists instructions starting at the PC.
disassemble pc
4
Lists 4 instructions starting at the PC. Sets the instruction count to
4.
Microcontrollers V10.x Targeting Manual
DRAFT
Scripting
Debugger Shell Command List
Table 5.13 disassemble Command-Line Debugger Command—Examples
Command
Description
disassemble
1000
Lists instructions starting at address 0x1000.
disassemble
p:1000 4
Lists 4 instructions from memory space p, address 1000.
Sets the instruction count to 4.
display
Lists the contents of a register or memory location; lists all register sets of a target; adds
register sets, registers, or memory locations; or removes register sets, registers, or memory
locations.
Syntax
display <addr-spec> [<range>] [-s|-ns] [%<conv>] [-np]
display -ms
display <addr-spec>{..<addr>|#<n>} [<range>] [-s|-ns]
[%<conv>] [-np]
display <reg-spec> [<n>] [-{d|nr|nv|np} ...] [-s|-ns]
[%<conv>]
display <reg-spec>{..<reg>|#<n>} [-{d|nr|nv|np} ...] [-s|-ns]
[%<conv>]
display all|r:|nr: [-{d|nr|nv|np} ...] [-s|-ns] [%<conv>]
display [-]regset
display <var-spec> [-np] [-s|-ns] [%<conv>]
display v: [-np] [-s|-ns] [%<conv>]
Parameter
<ms>
On architectures supporting multiple memory spaces, specifies the memory space
in which <addr> is to be found.
<addr>
Target address in hex.
<range>
Microcontrollers V10.x Targeting Manual
411
DRAFT
Scripting
Debugger Shell Command List
[<count>][x<cell-size>][h<access-size>] | [<count>] [{8,16,32,64}bit].
<count>
Number of memory cells.
x<cell-size>
Memory is displayed in units called cells, where each cell consists of <cellsize> bytes. If unspecified, the setting config MemWidth is used.
{8,16,32,64}bit
Sets both <cell-size> and <access-size>.
Examples
The examples assume the following settings:
• radix x
• config MemIdentifier 0
• config MemWidth 32
• config MemAccess 32
• config MemSwap off
Table 5.14 lists and defines examples of the display command.
Table 5.14 display Command-Line Debugger Command—Examples
412
Command
Description
display 10000
Display memory range 0x10000-3 as one cell.
display
1:10000
Display memory range 0x10000-3, memory space 1, as one cell.
display 10000
16
Display memory range 0x10000-3f as 16 cells.
display 10000
16x1h8
Display 16, 1-byte cells, with a hardware access size of 8-bytes
per read.
display 10000
8bit
Display one byte, with a hardware access size of one byte.
display 10000
-np
Return one cell, but don't print it to the Command Window.
display 10000
-s
Display one cell with the data endian-swapped.
Microcontrollers V10.x Targeting Manual
DRAFT
Scripting
Debugger Shell Command List
Table 5.14 display Command-Line Debugger Command—Examples (continued)
Command
Description
display 10000
%d
Display one cell in decimal format.
display -ms
Display the available memory spaces, if any.
display regset
List all the available register sets on the target chip.
display R1
Display the value of register R1.
display
"General
Purpose
Registers/R1"
Display the value of register R1 in the General Purpose Register
group.
display R1 -d
Display detailed "data book" contents of R1, including bitfields
and definitions.
display
"nr:General
Purpose
Registers/R1"
25
Beginning with register R1, display the next 25 registers. Register
groups are not recursively searched.
evaluate
Lists variable or expression.
Syntax
evaluate [#<format>] [-l] [<var|expr>]
Parameter
<format>
Output format and possible values:
#-, #Default
#d, #Signed
#u, #Unsigned
#h, #x, #Hex
Microcontrollers V10.x Targeting Manual
413
DRAFT
Scripting
Debugger Shell Command List
#c, #Char
#s, #CString
#p, #PascalString
#f, #Float
#e, #Enum
#i, #Fixed
#o, #w, #Unicode
#b, #Binary
<none>, #Fract
<none>, #Boolean
<none>, #SignedFixed
Examples
Table 5.15 lists and defines examples of the evaluate command.
Table 5.15 evaluate Command-Line Debugger Command—Examples
Command
Description
evaluate
List the types for all the variables in current and global stack.
evaluate i
Return the value of variable 'i'
evaluate #b i
Return the value of variable 'i' formatted in binary
evaluate -l 10
Return the address for line 10 in the current file
evaluate -l
myfile.c,10
Return the address for line 10 in file myfile.c
evaluate -l
+10
Return the address to an offset of 10 lines starting from the
current line
finish
Execute until the current function returns.
Syntax
finish
414
Microcontrollers V10.x Targeting Manual
DRAFT
Scripting
Debugger Shell Command List
fl::blankcheck
Test that the flash device is in the blank state.
Syntax
fl::blankcheck
fl::checksum
Calculate a checksum.
Syntax
fl::checksum
fl::device
Define the flash device.
Syntax
fl::device
fl::disconnect
Close the connection to the target.
Syntax
fl::disconnect
fl::dumps
Dumps the content of entire flash.
Microcontrollers V10.x Targeting Manual
415
DRAFT
Scripting
Debugger Shell Command List
Syntax
fl::dump [all | -range start_addr end_addr] -o <file>
Parameter
-all
Dumps content of entire flash.
-range <start_addr> <end_addr>
Sets the range of flash region to be dumped.
-t <type>
Sets the type of flash region to be dumped .
-o <file>
Dumps the flash to the specified file.
fl::erase
Erase the flash device.
Syntax
fl::erase
fl::image
Define the flash image settings.
Syntax
fl::image
fl::protect
Protects the sectors.
Syntax
fl::protect [on | off]
416
Microcontrollers V10.x Targeting Manual
DRAFT
Scripting
Debugger Shell Command List
Parameter
[on | off]
Enable or disable protection of sectors.
l::target
Define the target configuration settings.
Syntax
fl::target
fl::verify
Verify the flash device.
Syntax
fl::verify
fl::write
Write the flash device.
Syntax
fl::write
funcs
Displays information about functions.
Syntax
funcs [-all] <file> <line>
Microcontrollers V10.x Targeting Manual
417
DRAFT
Scripting
Debugger Shell Command List
Parameter
[-all]
Displays information about the functions using all debug contexts.
<file>
Specifies the file name.
<line>
Specifies the line number.
gdi
Forwards third party custom commands.
Syntax
gdi
getpid
List the ID of the process being debugged.
Syntax
getpid
go
Starts to debug your program from the current instruction.
Syntax
go [nowait | <timeout_s>]
Parameter
<none>
418
Microcontrollers V10.x Targeting Manual
DRAFT
Scripting
Debugger Shell Command List
Run the default thread. The command may wait for a thread break event before
returning, depending on the settings config runControlSync and config
autoThreadSwitch.
nowait
Return immediately without waiting for a thread break event.
<timeout_s>
Maximum number of seconds to wait for a thread break event. Can be set to
nowait.
Examples
Table 5.16 lists and defines examples of the go command.
Table 5.16 go Command-Line Debugger Command—Examples
Command
Description
go
Run the default thread.
go nowait
Run the default thread without waiting for a thread break event.
go 5
Run the default thread. If config runControlSync is enabled, then
the command will wait for a thread break event for a maximum of
5 seconds.
help
Lists debug command help in the command-line debugger window.
Syntax
help [-sort | -tree | <cmd>]
Parameter
command
Name or short-cut name of a command.
Examples
Table 5.17 lists and defines examples of the help command.
Microcontrollers V10.x Targeting Manual
419
DRAFT
Scripting
Debugger Shell Command List
Table 5.17 help Command-Line Debugger Command—Examples
Command
Description
help
Lists all debug commands.
help b
Lists help information for the break command.
history
Lists the history of the commands entered during the current debug session.
Syntax
history
kill
Stops one or all current debug sessions.
Syntax
kill [<index> ...]
Parameter
all
Specifier for all debug sessions.
Examples
Table 5.18 lists and defines examples of the help command.
Table 5.18 help Command-Line Debugger Command—Examples
420
Command
Description
kill
Kills the debug session for the current process.
kill 0 1
Kills debug sessions 0 and 1.
Microcontrollers V10.x Targeting Manual
DRAFT
Scripting
Debugger Shell Command List
jtagclock
Read or update the current JTAG clock speed.
Syntax
jtagclock
kill
Close the specified debug session.
Syntax
kill
launch
Lists the launch configurations.
Syntax
launch
linux::displaylinuxlist
Lists the expression for each element of a Linux list.
Syntax
linux::displaylinuxlist
linux::loadsymbolics
Load the symbolics for the selected module.
Microcontrollers V10.x Targeting Manual
421
DRAFT
Scripting
Debugger Shell Command List
Syntax
linux::loadsymbolics
linux::refreshmodules
Lists loaded modules.
Syntax
linux::refreshmodules
linux::selectmodule
Sets the current module.
Syntax
linux::selectmodules
linux::unloadsymbolics
Unloads the symbolics for the specified module.
Syntax
linux::unloadsymbolics
loadsym
Load a symbolic file.
Syntax
loadsym
422
Microcontrollers V10.x Targeting Manual
DRAFT
Scripting
Debugger Shell Command List
log
Logs the commands or lists entries of a debug session. If issued with no parameters, the
command lists all open log files.
Syntax
log c|s <filename>
log off [c|s] [all]
log
Parameter
c
Command specifier.
s
Lists entry specifier.
<filename>
Name of a log file.
Examples
Table 5.19 lists and defines examples of the log command.
Table 5.19 log Command-Line Debugger Command—Examples
Command
Description
log
Lists currently opened log files.
log s
session.log
Log all display entries to file session.log.
log off c
Close current command log file.
log off
Close current command and log file.
log off all
Close all log files.
Microcontrollers V10.x Targeting Manual
423
DRAFT
Scripting
Debugger Shell Command List
mem
Read and write memory.
Syntax
mem
next
Runs to next source line or assembly instruction in current frame.
Syntax
next
Remarks
If you execute the next command interactively, the command returns immediately,
and target-program execution starts. Then you can wait for execution to stop (for
example, due to a breakpoint) or type the stop command.
If you execute the next command in a script, the command-line debugger polls
until the debugger stops (for example, due to a breakpoint). Then the command line
debugger executes the next command in the script. If this polling continues
indefinitely because debugging does not stop, press the ESC key to stop the script.
next
Run to next source line or assembly instruction in current frame.
Syntax
next
oneframe
Query or set the one-frame stack crawl mode for the current thread.
424
Microcontrollers V10.x Targeting Manual
DRAFT
Scripting
Debugger Shell Command List
Syntax
oneframe
protocol
Executes a protocol plugin command (internal).
Syntax
protocol
pwd
Lists current working directory.
Syntax
pwd
quitIDE
Quits the IDE.
Syntax
quitIDE
radix
Lists or changes the default input radix (number base) for command entries, registers and
memory locations. Entering this command without any parameter values lists the current
default radix.
Syntax
radix [x|d|u|b|f|h]
Microcontrollers V10.x Targeting Manual
425
DRAFT
Scripting
Debugger Shell Command List
Parameter
x
Hexadecimal
d
Decimal
u
Unsigned decimal
b
Binary
f
Fractional
h
Hexadecimal
Examples
Table 5.20 lists and defines examples of the radix command.
Table 5.20 radix Command-Line Debugger Command—Examples
Command
Description
radix
Lists the current setting.
radix d
Change the setting to decimal.
radix x
Change the setting to hexadecimal.
refresh
Discard all cached target data and refresh views.
Syntax
refresh
426
Microcontrollers V10.x Targeting Manual
DRAFT
Scripting
Debugger Shell Command List
reg
Read and write registers.
Syntax
reg
reset
Reset the target hardware.
Syntax
reset
restart
Restarts the current debug session.
Syntax
restart
restore
Write file contents to memory.
Syntax
restore
run
Launch a process
Microcontrollers V10.x Targeting Manual
427
DRAFT
Scripting
Debugger Shell Command List
Syntax
run
save
Saves the contents of memory locations to a binary file or a text file containing
hexadecimal values.
Syntax
save -h|-b [<ms>:]<addr>... <filename> [-a|-o]
[8bit|16bit|32bit|64bit]
Parameter
-h|-b
Sets the output file format to hex or binary. For hex format, the address is also
saved so that the contents can easily be restored with the restore command.
[<ms>:]<addr>
Address to read from. For architectures with multiple memory spaces, a memory
space id may be specified.
-a
Append specifier. Instructs the command-line debugger to append the saved
memory contents to the current contents of the specified file.
-o
Overwrite specifier: tells the debugger to overwrite any existing contents of the
specified file.
Examples
Table 5.21 lists and defines examples of the save command.
428
Microcontrollers V10.x Targeting Manual
DRAFT
Scripting
Debugger Shell Command List
Table 5.21 save Command-Line Debugger Command—Examples
Command
Description
set
addressBlock1
"p:10..`31"
Dumps contents of two memory blocks to the text file hexfile.lod
(in append mode).
set
addressBlock2
"p:10000#20"
save -h
$addressBlock1
$addressBlock2
hexfile -a
set
addressBlock1
"p:10..`31"
Dumps contents of two memory blocks to the binary file
binfile.lod (in overwrite mode).
set
addressBlock2
"p:10000#20"
save -b
$addressBlock1
$addressBlock2
binfile -o
setpc
Set the value of the program counter register.
Syntax
setpc
setpicloadaddr
Indicate where a PIC executable is loaded.
Microcontrollers V10.x Targeting Manual
429
DRAFT
Scripting
Debugger Shell Command List
Syntax
setpicloadaddr
stack
Print the call stack.
Syntax
stack
status
Lists the debug status of all existing active targets.
Syntax
status
step
Steps through a program, automatically executing the display command.
Syntax
step [asm|src] [into|over|out]
step [nve|nxt|fwd|end|aft]
Parameter
asm|src
Controls whether the step is performed at the assembly instruction level or the
source code level.
into|over|out
Controls the type of step operation. If unspecified, into is used.
nve
430
Microcontrollers V10.x Targeting Manual
DRAFT
Scripting
Debugger Shell Command List
Step non optimized action.
nxt
Step next action.
fwd
Step forward action.
end
Step end of statement action.
aft
Step end all previous action.
Examples
Table 5.22 lists and defines examples of the step command.
Table 5.22 step Command-Line Debugger Command—Examples
Command
Description
step
Step into the current source or assembly line.
step over
Step over the current source or assembly line.
step out
Step out of a function.
step asm
Step over a single assembly instruction.
stepi
Execute to the next assembly instruction.
Syntax
stepi
stop
Stops a running program (started by a go, step, or next command).
Microcontrollers V10.x Targeting Manual
431
DRAFT
Scripting
Debugger Shell Command List
Syntax
stop
Examples
Table 5.23 lists and defines examples of the stop command.
Table 5.23 stop Command-Line Debugger Command—Examples
Command
Description
stop
Using it after command go/step out/next, this will stop the target
program.
switchtarget
Selects a thread for subsequent commands.
Syntax
switchtarget [<index> | -cur | -ResetIndex]
Parameter
index
Session Index number.
Examples
Table 5.24 lists and defines examples of the switchtarget command.
Table 5.24 switchtarget Command-Line Debugger Command—Examples
432
Command
Description
switchtarget
list currently available debug sessions.
switchtarget 0
select the thread with index 0
switchtarget cur
list the index of the current thread.
switchtarget ResetIndex
reset the index counter to 0, not valid while debugging.
Microcontrollers V10.x Targeting Manual
DRAFT
Scripting
Debugger Shell Command List
system
execute system command.
Syntax
system [command]
Parameter
command
Any system command that does not use a full screen display.
Examples
Table 5.25 lists and defines examples of the system command.
Table 5.25 system Command-Line Debugger Command—Examples
Command
Description
system del
*.tmp
Delete from the current directory all files that have the .tmp
filename extension.
var
Read and write variables or C-expressions.
Syntax
var
wait
Tells the debugger to wait for a specified amount of time, or until you press the space bar.
Syntax
wait <time-ms>
Microcontrollers V10.x Targeting Manual
433
DRAFT
Scripting
Debugger Shell Command List
Parameter
time-ms
Number of milliseconds to wait.
Examples
Table 5.26 lists and defines examples of the wait command.
Table 5.26 wait Command-Line Debugger Command—Examples
Command
Description
wait
Debugger waits until you press the space bar.
wait 2000
Wait for 2 seconds.
watchpoint
Sets, removes, disables, enables or list watchpoints. You can also set condition on
watchpoint.
Syntax
watchpoint
watchpoint [-{r|w|rw}] {<var>|[<ms>:]<addr> <length>}
watchpoint all|#<id>|<var>|[<ms>:]<addr> off|enable|disable
watchpoint #<id> cond <c-expr>
Examples
Table 5.27 lists and defines examples of the watchpoint command.
Table 5.27 watchpoint Command-Line Debugger Command—Examples
434
Command
Description
watchpoint
Display all watchpoints.
watchpoint
gData
Set read-write (the default) watchpoint on variable gData.
watchpoint -r
gData
Set read-only watchpoint on variable gData.
Microcontrollers V10.x Targeting Manual
DRAFT
Scripting
Microcontrollers-Specific HIWARE Commands
Table 5.27 watchpoint Command-Line Debugger Command—Examples (continued)
Command
Description
watchpoint all
off
Remove all watchpoints.
watchpoint #4
disable
Disable watchpoint number 4.
watchpoint
10343 4
Set a watchpoint at memory address 10343 of length 4.
Microcontrollers-Specific HIWARE
Commands
This topic lists and defines Microcontrollers-specific HIWARE commands.
Command List
Table 5.28 lists the HIWARE commands that are: supported followed by the CodeWarrior
debugger shell syntax, partially supported, command that are not applicable in
CodeWarrior, commands supported in script files with TCL control flow statements, and
unsupported commands.
The following columns represent the status in the CodeWarrior Eclipse IDE:
• S-CW — Command is supported followed by the CodeWarrior debugger shell syntax
• P — Command is partially supported, meaning some options/parameters are not
supported
• NA — Command is not applicable in CodeWarrior
• S-TCL — Commands is supported in script files with TCL control flow statements
• U — Command is not supported
Table 5.28 Microcontrollers-Specific Debugger Command Lis
Command
Status
Description
S-CW
Lists the version of all loaded commands
HIWARE
VER
Syntax
about
Microcontrollers V10.x Targeting Manual
435
DRAFT
Scripting
Microcontrollers-Specific HIWARE Commands
Table 5.28 Microcontrollers-Specific Debugger Command Lis
Command
Status
Description
AUTOSIZE
NA
Selects window sizing mode
OPENIO
NA
Loads an IO simulation component
OPENPROJECT
U
Opens an existing project
OPEN
NA
Opens a component window
SET
U
Loads a target component
LOAD
U
Loads an application (Code & Symbols)
LOADCODE
U
Loads an application (Code only)
LOADSYMBOLS
S-CW
Loads an application (Symbols only)
Syntax
loadsym <filename>
FONT
U
Changes font in component windows
BCKCOLOR
U
Changes background color of component
windows
SLAY
NA
Saves the layout and options of all
components
ACTIVATE
NA
Activates a window component (in/out focus)
CLOSE
NA
Closes a component window
SYSTEM
S-CW
Executes an external application
Syntax
system <command>
EXIT
S-CW
Terminates this application
Syntax
quitIDE
RESET
S-CW
Resets the target MCU
Syntax
Reset
436
Microcontrollers V10.x Targeting Manual
DRAFT
Scripting
Microcontrollers-Specific HIWARE Commands
Table 5.28 Microcontrollers-Specific Debugger Command Lis
Command
Status
Description
HELP
S-CW
Lists available commands; to get help on a
specific command, use the command followed
by '?'
Syntax
help
help <command>
<command> ?
HIWARE Engine
LF
S-CW
Opens a log file
Syntax (for command)
log c <file>
Syntax (for session)
log s <file>
NOLF
S-CW
Closes a log file
Syntax (for command)
log off c
Syntax (for session)
log off s
CR
U
Records all commands to a file
NOCR
U
Stops recording commands to a file
LOG
S-CW
Specifies items to be logged
Syntax (for command)
log c <file>
Syntax (for session)
log s <file>
Microcontrollers V10.x Targeting Manual
437
DRAFT
Scripting
Microcontrollers-Specific HIWARE Commands
Table 5.28 Microcontrollers-Specific Debugger Command Lis
Command
Status
Description
BS
P
Sets breakpoint
Syntax
bp [-{hw|sw|auto}]
{<func>|[<ms>:]<addr>|<file>
<line> [<column>]}
bp all|#<id>|<func>|<addr>
enable|disable|{ignore <count>}
bp #<id> cond <c-expr>
SAVEBP
U
Saves breakpoints into a file
STEPINTO
S-CW
Step Into
Syntax
step [asm|src] into
STEPOUT
S-CW
Step out
Syntax
step [asm|src] out
STEPOVER
S-CW
Step over
Syntax
step [asm|src] over
RESTART
S-CW
Restart execution
Syntax
restart
438
DDEPROTOCOL
U
DDE Protocol options
DEFINEVALUEDLG
U
Opens a GUI to define a value for the symbol/
variable given as parameter
Microcontrollers V10.x Targeting Manual
DRAFT
Scripting
Microcontrollers-Specific HIWARE Commands
Table 5.28 Microcontrollers-Specific Debugger Command Lis
Command
Status
Description
BC
S-CW
Clears breakpoint
Syntax
bp all|#<id>|<func>|<addr> off
BD
S-CW
Lists breakpoints
Syntax
bp
GO
S-CW
Starts execution (Go)
Syntax
go
STOP
S-CW
Stops execution (Halt)
Syntax
stop
S-CW
P
Executes an instruction (Flat step)
Syntax
stepi
S-CW
T
Executes CPU instructions
Syntax
stepi
Configuration Example
• radix x
• config MemIdentifier 0
• config MemWidth 32
• config MemAccess 32
config MemSwap off
Note: These options apply only to the memory commands below.
Microcontrollers V10.x Targeting Manual
439
DRAFT
Scripting
Microcontrollers-Specific HIWARE Commands
Table 5.28 Microcontrollers-Specific Debugger Command Lis
Command
Status
Description
WB
S-CW
Writes byte(s) into target memory
Syntax
mem <addr-spec> [<range>] [-s|-ns]
[%<conv>] =<value>
WW
S-CW
Writes word(s) into target memory (2 bytes)
Syntax
mem <addr-spec> [<range>] [-s|-ns]
[%<conv>] =<value>
WL
S-CW
Writes long(s) into target memory (4 bytes)
Syntax
mem <addr-spec> [<range>] [-s|-ns]
[%<conv>] =<value
MS
S-CW
Writes byte(s) into target memory (same as
WB)
Syntax
mem <addr-spec> [<range>] [-s|-ns]
[%<conv>] =<value>
RD
S-CW
Lists registers
Syntax
reg all
RS
S-CW
Sets registers
Syntax
reg <reg-spec>{..<reg>|#<n>} [-s|ns] [%<conv>] =<value>
MEM
U
Lists memory map
DASM
S-CW
Disassembles target memory
Syntax
disassemble pc|[<ms>:]<addr>
[<count>]
440
Microcontrollers V10.x Targeting Manual
DRAFT
Scripting
Microcontrollers-Specific HIWARE Commands
Table 5.28 Microcontrollers-Specific Debugger Command Lis
Command
Status
Description
DB
S-CW
Lists byte(s) from target memory
Syntax
mem <addr-spec> [<range>] [-s|-ns]
[%<conv>] [-np]
DW
S-CW
Lists words from target memory (2 bytes)
Syntax
mem <addr-spec> [<range>] [-s|-ns]
[%<conv>] [-np]
DL
S-CW
Lists long(s) from target memory (4 bytes)
Syntax
mem <addr-spec> [<range>] [-s|-ns]
[%<conv>] [-np]
CD
S-CW
Lists or changes directory
Syntax
cd
E
S-CW
Evaluates an expression and lists its result
Syntax
evaluate [#<format>] [-l]
[<var|expr>]
A
S-CW
Evaluates an expression and assigns its result
to an existing variable
Syntax
var <var-spec> [-s|-ns]
[%<conv>]=[evaluate [#<format>] [l] [<var|expr>]]
Example
var myVar = [evaluate 1+1] assigns value "2" to "myVar"
PRINTF
U
Display a string on the window using printf like
format
FPRINTF
U
Write a string to a file using fprintf like format
Microcontrollers V10.x Targeting Manual
441
DRAFT
Scripting
Microcontrollers-Specific HIWARE Commands
Table 5.28 Microcontrollers-Specific Debugger Command Lis
Command
Status
Description
NB
S-CW
Changes or displays the default number base
for the value of expressions
Syntax
evaluate [#<format>] [-l]
[<var|expr>]
LS
U
Lists also global variables and procedures of
the loaded application
SREC
P
Loads of Motorola S-records from a specified
file
Syntax
restore -h *.lod
[[<ms>:]<addr>|+<offset>]
[8bit|16bit|32bit|64bit]
restore -b *.lod [<ms>:]<addr>
[8bit|16bit|32bit|64bit]
SAVE
S-CW
Saves a specified block of memory to a
specified file in Motorola S-record format
Syntax
save -h|-b [<ms>:]<addr>...
<filename> [-a|-o]
[8bit|16bit|32bit|64bit]
442
PAUSETEXT
NA
Displays a modal message box for testing
purpose
TESTBOX
NA
Displays a modal message box with a given
string
REGFILE
U
Loads the I/O register descriptions from a
'register file'
REGBASE
U
Sets the base address of the on-chip I/O
registers
ANDB
U
Bitwise-AND with target memory byte
ANDW
U
Bitwise-AND with target memory word (2
bytes)
Microcontrollers V10.x Targeting Manual
DRAFT
Scripting
Microcontrollers-Specific HIWARE Commands
Table 5.28 Microcontrollers-Specific Debugger Command Lis
Command
Status
Description
ANDL
U
Bitwise-AND with target memory long (4
bytes)
NANDB
U
Bitwise-NAND with target memory byte
NANDW
U
Bitwise-NAND with target memory word (2
bytes)
NANDL
U
Bitwise-NAND with target memory long (4
bytes)
ORB
U
Bitwise-OR with target memory byte
ORW
U
Bitwise-OR with target memory word (2 bytes)
ORL
U
Bitwise-OR with target memory long (4 bytes)
NORB
U
Bitwise-NOR with target memory byte
NORW
U
Bitwise-NOR with target memory word (2
bytes)
NORL
U
Bitwise-NOR with target memory long (4
bytes)
EXORB
U
Bitwise-EXOR with target memory byte
EXORW
U
Bitwise-EXOR with target memory word (2
bytes)
EXORL
U
Bitwise-EXOR with target memory long (4
bytes)
MEMCOPY
S-CW
Copies the target memory
MEMBITCOPY
S-CW
Copies one bit from one memory address to
another bit to another memory address
Syntax
copy
[<ms>:]<addr>[..<addr>|#<bytes>]
[<ms>:]<addr>
DEFINE
S-CW
Defines a symbol and associates a value
Syntax
set varName ?value? <TCL command>
Microcontrollers V10.x Targeting Manual
443
DRAFT
Scripting
Microcontrollers-Specific HIWARE Commands
Table 5.28 Microcontrollers-Specific Debugger Command Lis
Command
Status
Description
UNDEF
S-CW
Removes a symbol definition
Syntax
unset varName <TCL command>
RETURN
U
Terminates the current command processing
level
GOTO
U
Goes to the line following the label
GOTOIF
U
Goes to the line following the label if condition
is TRUE
WHILE
S-TCL
Executes commands as long as the condition
is true
FOR
S-TCL
Executes commands up to a predefined
number of times
REPEAT
S-TCL
Executes commands until a certain condition
is true
IF
S-TCL
Executes different command sections
depending on the conditions
FOCUS
NA
Assigns a component as the destination for all
subsequent commands
WAIT
S-CW
Waits by time tenths of a second
Syntax
wait
AT
U
Executes the next command at time (in ms)
CF
S-CW
Executes commands in the specified
command file
CALL
S-CW
Executes commands in the specified
command file
Syntax
source
Source
444
Microcontrollers V10.x Targeting Manual
DRAFT
Scripting
Microcontrollers-Specific HIWARE Commands
Table 5.28 Microcontrollers-Specific Debugger Command Lis
Command
Status
Description
SPC
NA
Highlights the statement corresponding to the
code address
SMEM
NA
Highlights the statements corresponding to the
code address range
SMOD
NA
Loads the corresponding module's source text
SPROC
NA
Highlights the statement of the procedure that
is in the procedure chain
FOLD
NA
Hides source text for clearness at program
block level
UNFOLD
NA
Exhibits the contents of folded source text
blocks
SLINE
NA
Displays the line
FINDPROC
NA
Find the Procedure
FIND
NA
Searches an arbitrary pattern in the currently
loaded source file
ATTRIBUTES
NA
Sets up the display
SPC
NA
Lists the specified address
SMEM
NA
Lists the specified address
ATTRIBUTES
NA
Sets up the display
NA
Sets up the display
NA
Sets up the display
SPC
NA
Lists the address given as an argument
SMEM
NA
Lists the memory range given as an argument
Assembly
Procedure
ATTRIBUTES
Register
ATTRIBUTES
Memory
Microcontrollers V10.x Targeting Manual
445
DRAFT
Scripting
Microcontrollers-Specific HIWARE Commands
Table 5.28 Microcontrollers-Specific Debugger Command Lis
Command
Status
Description
SMOD
NA
Lists the first global variable of the module
FILL
S-CW
Fills a memory range with the given value
Syntax
mem <addr-spec> [<range>] [-s|-ns]
[%<conv>] =<value>
UPDATERATE
NA
Sets the update rate
ATTRIBUTES
NA
Sets up the display
COPYMEM
S-CW
Copies a memory range to a specified location
Syntax
copy
[<ms>:]<addr>[..<addr>|#<bytes>]
[<ms>:]<addr>
SEARCHPATTERN
NA
Search a pattern in memory
REFRESHMEMORY
S-CW
After releasing caches, refreshes the memory
Syntax
refresh
Data
446
SPROC
NA
Displays local or global variables of the
procedure given as parameter
ADDXPR
NA
Adds a new expression in the data component
PTRARRAY
NA
Switches on or off the pointer as array
displaying
SMOD
NA
Displays global variables of the module given
as parameter
ZOOM
NA
Exhibits the member fields of structures by
'diving' into the structure
UPDATERATE
NA
Sets the update rate of the data component
Microcontrollers V10.x Targeting Manual
DRAFT
Scripting
Microcontrollers-Specific HIWARE Commands
Table 5.28 Microcontrollers-Specific Debugger Command Lis
Command
Status
Description
DUMP
P
Dumps the content of the data component to
the command line
Syntax
display
ATTRIBUTES
NA
Sets up the display
REFRESHDATA
S-CW
After releasing caches, refreshes the display
Syntax
refresh
Command
CLR
S-CW
Clears the Command window
Syntax
cls
ATTRIBUTES
NA
Microcontrollers V10.x Targeting Manual
Sets up the display
447
DRAFT
Scripting
Microcontrollers-Specific HIWARE Commands
448
Microcontrollers V10.x Targeting Manual
DRAFT
6
Connections — HCS08
This chapter describes the features and settings of the connections that interface the
CodeWarrior debugger with the HCS08 simulator or the target board.
For the IDE to communicate with the target hardware, you must specify several key items:
the debugger protocol, a connection type, and any connection parameters. You enter the
first two items of information using options in the Connection tab. The Connection tab is
located in the Debugger tab of the Debug Configurations dialog box. These options are:
• The Connection Protocol option determines what debugger protocol the debugger
uses to communicate with the target.
• The Physical Connection option specifies the hardware probe or connection type
that physically connects the workstation hosting CodeWarrior to the target board
under debug. After you make the option of physical connection, the view changes to
display configuration options specific for the hardware probe.
You use the options in the revised view to configure the third item, the connection
parameters.
The topics in this chapter discuss the features and settings of the connections that interface
the CodeWarrior debugger with the HCS08-based bare board target.
The topics of this chapter are:
• Changing Connection in IDE
• P&E Full Chip Simulation
• P&E HCS08 Multilink\Cyclone Pro
• Softec
• Open Source BDM
Changing Connection in IDE
Full Chip Simulation (FCS) connection runs a complete simulation of all processor
peripherals and I/O on your personal computer. Thus, when debugging an FCS project for
a selected derivative it is not necessary to connect your PC with a Microcontrollers
development or target board.
To select Full Chip Simulation as the debugger connection:
Microcontrollers V10.x Targeting Manual
449
DRAFT
Connections — HCS08
P&E Full Chip Simulation
1. Select Project > Change Device/Connection from the IDE menu bar.
The Device/Connection Change wizard appears.
2. Type a name for the project, in the New Project Name text box. By default, it is the
existing project name.
NOTE
Clear the Use default location checkbox and click Browse to specify a
different location for the new project. By default, the Use default location
checkbox is checked.
3. Click Next.
The Device and Connection page appears.
4. Expand the HCS08 tree control and select the derivative or board you would like to
use. For example, select HCS08 > HCS08D Family > 9S08DE32.
5. Click Next.
The Connections page appears.
6. Check the P&E Full Chip Simulation checkbox.
NOTE
You can select multiple connections by checking appropriate checkboxes in the
Connections page.
7. Click Finish.
The wizard creates a simulator project for the HCS08 architecture according to your
specifications. You can access the project from the CodeWarrior Projects view in the
Workbench window.
8. Build the new project. For more information, refer to the topic Building Projects.
9. Debug the new project. For more information, refer to the topic Debugging Projects.
P&E Full Chip Simulation
This topic explains Chip View, which is a time-saving FCS feature. Additionally, it
describes the settings of the connections that interface the CodeWarrior debugger with the
HCS08 simulator.
Chip View
Chip View is an innovative feature designed to simplify Full Chip Simulation (FCS) and
In-Circuit Debugging (ICD) sessions. The Chip View provides instantaneous access to
internal modules of the chip and lets you instantly change any of the pin properties by
450
Microcontrollers V10.x Targeting Manual
DRAFT
Connections — HCS08
P&E Full Chip Simulation
clicking the pins. Each pin features the current pin direction, input/output value, and the
name of the signal that reflects the current module that controls it. These data features are
updated every 50ms throughout a running FCS or ICD session.
Figure 6.1 Chip View
To open Chip View, perform these steps.
1. From the IDE menu bar, select PEMicro > Device Package > Device Package:<
Pin>, where < Pin> is the pin package you would like to work with. (See Figure 6.2).
The Device Package can be changed before or after the Chip View window is invoked
within the CodeWarrior IDE.
Figure 6.2 Device Package Extended Menu
Microcontrollers V10.x Targeting Manual
451
DRAFT
Connections — HCS08
P&E Full Chip Simulation
2. From the IDE menu bar, select Window > Show View > Others (Figure 6.3).
Figure 6.3 Show View Extended Menu
The Show View dialog box appears.
3. Expand Other and select Chip View (Figure 6.4).
452
Microcontrollers V10.x Targeting Manual
DRAFT
Connections — HCS08
P&E Full Chip Simulation
Figure 6.4 Show View Menu
4. To change direction and values of the pin, double-click the corresponding arrow or the
number value. Details are listed below.
NOTE
If you close the Chip View Window during debug session, the Chip View will
not be accessible. You must reopen the Chip View window and restart the
current debugging session and to open the Chip View window again. Closing
Chip View should slightly improve the performance during existing debug
session.
Chip GUI - Ports Module Support
You can change the pin’s direction and values by double-clicking the corresponding arrow
or the number value. Figure 6.5 is an example of what the Chip View may look like before
any changes are made. When the pin direction is input, the pin will display the current pin
input value. When the pin direction is output, you have the option of double-clicking the
number value to control the output value for the pin.
Microcontrollers V10.x Targeting Manual
453
DRAFT
Connections — HCS08
P&E Full Chip Simulation
Figure 6.5 Chip View Display Before Change
Figure 6.6 is an example of the PTA2 pin value being changed from 0 to 1 by doubleclicking on the number value.
Figure 6.6 Chip View Display After Change
When you double-click the pin’s value or the direction, a pin configuration dialog appears
beneath the Chip View diagram (Figure 6.7). In the pin configuration options, you can
change the I/O settings for a given pin. You can select a pin from the pin-number dropdown list, select between analog and digital signals, and switch the pin directions. For the
digital I/O signal, you can switch between high or low signals (Figure 6.7).
454
Microcontrollers V10.x Targeting Manual
DRAFT
Connections — HCS08
P&E Full Chip Simulation
Figure 6.7 Chip View with Digital Pin Configuration Options
For the analog input signal, you can use the slider to change the analog signal value
(Figure 6.8).
Figure 6.8 Chip View with Analog Pin Configuration Options
Microcontrollers V10.x Targeting Manual
455
DRAFT
Connections — HCS08
P&E Full Chip Simulation
Chip GUI - Analog to Digital Module Support
The Analog to Digital (ATD) Module has a higher priority than the General Pin I/O
module. Therefore, you have an ATD channel enabled and the ATD input buffer is empty,
current input value on a pin will be converted and displayed in the ATD data conversion
register (Figure 6.9).
Figure 6.9 Chip View with ATD
Module Options
The PEMicro menu (Figure 6.10) includes the Full Chip Simulation options for the
modules that have specialty commands associated with them for a chosen device.
Figure 6.10 PEMicro Menu
456
Microcontrollers V10.x Targeting Manual
DRAFT
Connections — HCS08
P&E Full Chip Simulation
The options available are:
• Analog-to-Digital Converter Module
• 16-Bit Analog-to-Digital Converter Module
• Clock Generation Module
• Digital-to-Analog Converter Module
• EEPROM Module
• Fault Detection and Shutdown Module
• Flash Module
• Inter-Integrated Circuit Module
• Interrupt Priority Controller Module
• External Interrupt (IRQ) Module
• Keyboard Interrupt Module
• Modulo Timer Interrupt Module
• MSCAN Controller Module
• Programmable Delay Block Module
• Programmable Gain Amplifier Module
• Programmable Reference Analog Comparator Module
• Input/Output (I/O) Ports Module
• Serial Communications Interface Module
• Slave LIN Interface Controller (SLIC) Module
• Serial Peripheral Interface Module
• Timer Interface Module
• Time Of Day Module Option
• Universal Serial Bus (USB) Module
• Voltage Reference Module
Analog-to-Digital Converter Module
In Full Chip Simulation (FCS) mode, this module simulates all functionality of the
Analog-to-Digital Conversion (ADC) module, including data input on all ADC channels,
flag polling, interrupt operation, and the bus and CGMXCLK reference clock sources.
FCS mode uses the buffered input structure to simulate the ADC inputs. You can queue up
to 256 data values. To queue the ADC Input Data, use the ADDI command in the
command prompt. If the data parameter is given, the value is placed into the next slot in
the input buffer. Otherwise, if no parameter is provided, a window is displayed with the
Microcontrollers V10.x Targeting Manual
457
DRAFT
Connections — HCS08
P&E Full Chip Simulation
input buffer values. Input values can be entered while the window is open. An arrow
points to the next value to be used as input to the ADC. The conversion takes place after a
proper value is written to the ADC Status and Control register. Once the conversion
occurs, the arrow moves to the next value in the ADC Buffer.
Figure 6.11 ADC IN Buffer Display
The ADCLR command can be used at any point to flush the input buffer for the ADC
simulation.
After the conversion is complete, the first queued value is passed from the data buffer into
the ADC data register. It can be observed in the Memory window by displaying the
memory location corresponding to the ADC data register.
Figure 6.12 Memory Component Window
When the conversion is complete, FCS sets the appropriate flag. If interrupts are enabled,
the Program Counter changes flow to the interrupt routine (as defined in the vector space
of the MCU).
NOTE
458
For more information on ADC configuration, refer to the Freescale user
manual for your microprocessor.
Microcontrollers V10.x Targeting Manual
DRAFT
Connections — HCS08
P&E Full Chip Simulation
ADC Module Commands
The following commands are available for the HC08/HCS08 ADC Module.
ADDI Command
The ADDI command lets you input the data into the ADC converter. If a data parameter is
given, the value is placed into the next slot in the input buffer. Otherwise, if no parameter
is given, a window is displayed with the input buffer values. Input values can be entered
while the window is open. An arrow points to the next value to be used by the ADC. The
maximum number of input values is 256 bytes.
Syntax
>gdi ADDI [<n>]
Where:
<n> The value to be entered into the next location in the input buffer.
Example
>gdi ADDI $55
Set the next input value to the ADDI to $55
>gdi ADDI
Pull up the data window with all the input values.
ADCLR Command
Use the ADCLR command to flush the input buffer for ADC simulation. This resets the
input data buffer and clears out all values. Notice that if the ADC is currently using a
value, this command does not prevent the ADC from using it.
NOTE
See the ADDI command for information on how to access the input buffer of
the ADC interface.
Syntax
>gdi ADCLR
Example
>gdi ADCLR
Clear the input buffer for ADC simulation.
Microcontrollers V10.x Targeting Manual
459
DRAFT
Connections — HCS08
P&E Full Chip Simulation
16-Bit Analog-to-Digital Converter Module
In Full Chip Simulation (FCS) Mode, this module simulates all functionality of the 16-bit
Analog-to-Digital Converter (ADC16) module, including data input on all ADC16
channels, flag polling, interrupt operation, single-ended output mode, differential output
mode, as well as the bus and ICSERCLK reference clock sources. In single-ended output
mode the FCS uses the buffered input structure to simulate the ADC16 inputs. You can
queue up to 256 data values. To queue the ADC16 Input Data, use the ADDI command in
the command prompt. If the data parameter is given, the value is placed into the next slot
in the input buffer. If no data parameter is provided, a window is displayed with the input
buffer values. Input values can be entered while the window is open. An arrow points to
the next value that will be used as input to the ADC16. The conversion takes place after a
proper value is written to the ADC16 Status and Control register. Once the conversion
occurs, the arrow moves to the next value in the ADC16 Buffer. In differential output
mode, you can use the ADDID command in the command prompt to open a window where
you can specify the data inputs.
Clock Generation Module
In Full Chip Simulation (FCS) mode, this module simulates all functionality of the Clock
Generation Module (ICG), including:
• Phase Locked Loop (PLL) generation
• Automatic lock detection
• Interrupt
• Acquisition
• Tracking
• Flag polling
FCS mode uses a simulated External Oscillator Frequency change command (XTAL) tlets
you input the desired XTAL value. To check the current value of the External Oscillator,
Bus Frequency and CGMXCLK Frequency, open the HCS08FCS menu and select Clocks
Module > Show MCU Clocks.
460
Microcontrollers V10.x Targeting Manual
DRAFT
Connections — HCS08
P&E Full Chip Simulation
Figure 6.13 Clocks Module Extended Menu
Once you select the MCU Clocks menu, the Cycles window displays all of the
aforementioned Clock Frequencies, or you can select the Show Cycle Counter option
within the FCS menu to get the same window.
Figure 6.14 Frequency Display
Within the FCS menu, you can select the Run till Cycle option, which lets you begin code
execution and stop execution when the specified cycle count is reached. Note that the
parameter given is not the number of cycles that executed, but rather the total cycle-count
of the simulator (displayed in the Register Window).
Figure 6.15 Run till Cycle Command
Microcontrollers V10.x Targeting Manual
461
DRAFT
Connections — HCS08
P&E Full Chip Simulation
This command is extremely useful for verifying specific timings of a given event, running
until a given event is complete, or just before it completes to enable stepping through the
event or any application where cycle-timed execution is desired.
Figure 6.16 Run till a specific cycle Dialog Box
You can also select the Clear Cycle Counter option within the FCS menu, which clears the
cycle counter. If you select the Show Cycle Counter option within the FCS menu, you can
check to make sure that the cycle counter is zero.
Figure 6.17 Cycles Dialog Box with Cleared Counter
Once the ICG is properly configured, you can monitor the status of the PLL by polling the
corresponding flag. If PLL interrupt is enabled, FCS jumps to an appropriate subroutine,
as long as the interrupt vector is properly defined. To observe the flag going up as a result
of the corresponding CPU event, situate your Memory window on the memory location of
the ICG Status and Control register.
Figure 6.18 Memory Window
For more information on how to properly configure Clock Generation, refer to the
Freescale reference manual for your microprocessor.
462
Microcontrollers V10.x Targeting Manual
DRAFT
Connections — HCS08
P&E Full Chip Simulation
Clock Generation Module Commands
The following commands are available for the HC08/HCS08 Clock Generation Module.
XTAL Command
Use the XTAL command to change the value of the simulated external oscillator. This in
turn affects the input to the PLL/DCO, and therefore the bus frequency. The P&E
simulator is a cycle-based simulator, so changing the XTAL value does not affect the
speed of simulation. It does, however, affect the ratio in which peripherals receive cycles.
Certain peripherals that run directly from the XTAL will run at different speeds than those
that run from the bus clock.
Syntax
>gdi XTAL <n>
where, <n>, by default, is a hexadecimal number, representing the simulated frequency of
an external oscillator. Adding the suffix ‘t’ to the ’n’ parameter forces the input value
to be interpreted as base 10.
Example
>gdi XTAL
Brings up an input window. The default base for this input value is 10. However, this
value can be forced to a hexadecimal format through use of the suffix ‘h’.
Digital-to-Analog Converter Module
In Full Chip Simulation (FCS) Mode, this module lets you simulate all the functionality of
the 5-bit Digital-to-Analog Converter (DAC) module. This module provides 32 distinct
selectable voltage levels through the use of a 32-tap resistor ladder network and a 32-to-1
multiplexer. Each DAC module output can be routed to an HSCMP input.
EEPROM Module
In Full Chip Simulation (FCS) mode, this module simulates all functionality of EEPROM
module including sector erase abort, burst programming capability, security feature,
flexible block protection and vector redirection, and command interface for fast program
and erase operation.
EEPROM User Commands
The following EEPROM commands are available for the HCS08.
EEPROM<x> Command
Microcontrollers V10.x Targeting Manual
463
DRAFT
Connections — HCS08
P&E Full Chip Simulation
The EEPROM<x> command simulates changing of the EEPROM page for devices that
have paged EEPROM.
Syntax
>gdi EEPROM<x>
Where:
<x> is the letter representing corresponding EEPROM page number
Example
> gdi EEPROM1
Simulate change to EEPROM page 1.
Figure 6.19 Example of using EEPROM<x>Command
464
Microcontrollers V10.x Targeting Manual
DRAFT
Connections — HCS08
P&E Full Chip Simulation
Fault Detection and Shutdown Module
In Full Chip Simulation (FCS) Mode, this module lets you simulate all the functionality of
the Fault Detection and Shutdown (FDS) module. When a fault condition occurs, the
module provides a mechanism to immediately place port pins into a pre-defined state; the
output pin of FDS can be configured as output 0, output 1, high impedance, or bypass
during shutdown. The module can configure up to 8 fault input sources and control up to 8
port pins.
Flash Module
In Full Chip Simulation (FCS) mode, this module simulates all functionality of Flash
module including sector erase abort, burst programming capability, security feature,
flexible block protection and vector redirection, and command interface for fast program
and erase operation.
Flash User Commands
The following Flash commands are available for the HCS08.
PPAGE <x> Command
The PPAGE <x> command simulates changing of Flash PPAGE for devices that have
paged FLASH.
Syntax
>gdi PPAGE <x>
Where:
<x> is the letter representing corresponding PPAGE number
Example
>gdi PPAGE 1
Simulate change to PPAGE 1.
Microcontrollers V10.x Targeting Manual
465
DRAFT
Connections — HCS08
P&E Full Chip Simulation
Figure 6.20 Example of using PPAGE <x> command
Inter-Integrated Circuit Module
In Full Chip Simulation (FCS) mode, this module simulates all functionality of the InterIntegrated Circuit (IIC) module including:
• Flag polling
• Interrupt enabled mode
• Transmission and reception of external data
• Master and slave modes of operation
• START and STOP signal generation detection
• Acknowledge bit generation detection
466
Microcontrollers V10.x Targeting Manual
DRAFT
Connections — HCS08
P&E Full Chip Simulation
FCS mode uses the buffered input/output structure to simulate IIC inputs. You can queue
up to 256 data bytes into the input buffer. The output buffer of the USB module can also
hold 256 output bytes. To queue the IIC Input Packets, use the IICDI <...> command
in the command prompt. For a more detailed description of the command, refer to the IIC
Commands section. If the IIC packet parameters are properly defined, the packet is placed
into the next slot in the input buffer. Otherwise, if no parameters are provided, an IIC
Input Buffer window is displayed.
You can enter different IIC packet parameters while the window is open, including
START, STOP, ACK, NACK and data bytes. An arrow points to the next byte to be used
as input to the IIC. The data from the IIC input buffer is written to the IIC module registers
once the IIC module is turned on and properly configured for receiving data from an
external IIC device. Once simulation of the data transmission is over, the arrow moves to
the next value in the IIC Input Buffer.
Figure 6.21 IIC Input Buffer Display
The IIC data input/output log buffer simulation lets you gain access to the past 256 IIC
data bytes that have been shifted in and out of the module. To bring up the IIC IN/OUT
LOG buffer dialog box, use the IICDO command.
Microcontrollers V10.x Targeting Manual
467
DRAFT
Connections — HCS08
P&E Full Chip Simulation
Figure 6.22 IIC IN/OUT LOG Buffer Display
At any point, use the IICCLR command to flush the input as well as input/output log IIC
buffers. After the IIC simulated input is received, the first queued-in data byte is passed
from the data buffer into the corresponding IIC module registers. It can be observed in the
Memory Window by displaying the appropriate register location there.
Figure 6.23 Memory Component Window
You can also observe different IIC flags in the Memory window. If you run the module in
Flag Polling mode, poll the flag corresponding to the expected IIC event. If the IIC
interrupts are enabled, FCS jumps to an appropriate subroutine as long as the IIC interrupt
vectors are properly defined.
NOTE
For more information on how to configure IIC module for desired operation,
refer to the Freescale user manual for your microprocessor.
Inter-Integrated Circuit Module Commands
The following commands are available for the HCS08 Inter-Integrated Circuit (IIC)
module and the HC08 Multi-Master Inter-Integrated Circuit (MMIIC) module. Command
function is identical even though the module names differ.
IICDI Command
468
Microcontrollers V10.x Targeting Manual
DRAFT
Connections — HCS08
P&E Full Chip Simulation
The IICDI command lets you input data into a buffer of data to shift into the IIC module
when it receives data from an external device. If a data parameter is given, the value is
placed into the next slot in the input buffer. Otherwise, if no parameter is given, a window
is displayed with the input buffer values. Input values can be entered while the window is
open. The maximum number of input values is 256. This command is useful for either
inputting response data from a slave target or for inputting data packets from an external
master. Note that when the microprocessor attempts to read an acknowledge from an
external device, and the next value in the buffer is neither ACK nor NACK, the
microprocessor automatically receives an ACK signal (i.e. assumes ACK unless NACK is
specified).
Syntax
>gdi IICDI [<n>][START][STOP][ACK][NACK]
Where:
• <n> indicates the value to be entered into the next location in the input buffer
• START indicates the incoming START signal
• STOP indicates the incoming STOP signal
• ACK corresponds to ACK signal
• NACK corresponds to NACK signal
NOTE
For a detailed description of the IIC protocol and a proper way to configure the
IIC module, refer to the Freescale user manual for your microprocessor.
Example
>gdi IICDI
Pulls up the data window with all the input values
>gdi IICDI 22 33
This is an example of data being returned from a slave device. Once the MCU transmits a
start signal and the target address, it receives an ACK from the slave device. An ACK is
implied unless a NACK is specified via the IICDI command. The next two data bytes
read are 22 and 23. If the microprocessor attempts to read another byte, it gets an $FF
value followed by a NACK signal (NACK because nothing remains in the input buffer).
The receiving device then generates a STOP signal. A more exact input from a device
designed to return two bytes is:
>gdi IICDI ACK 22 ACK 23 NACK
IIC in master mode transmits to a slave:
Microcontrollers V10.x Targeting Manual
469
DRAFT
Connections — HCS08
P&E Full Chip Simulation
• If the slave device acknowledges all output bytes of the transmitting device, there is no
need to specify an input packet. If the master device is going to transmit an address and
two bytes, the following packet is equivalent to no packet:
>gdi IICDI ACK ACK ACK
• If, however, the slave receiver is designed to generate a NACK signal after the second
received data byte, the proper response packet is:
>gdi IICDI ACK ACK NACK
• The address result being the first ACK, the first data result being the second ACK, and
the second data byte being the NACK.
IIC in MASTER mode is not acknowledged by any Slave:
>gdi IICDI NACK
• If the NACK signal is entered before the master device transmits a START signal, then
the master device gets a NACK when it tries to read an acknowledge after the address is
output. The master device then generates a STOP signal and releases the BUS.
IIC in SLAVE mode receives a Write from an external Master:
This example is for an external master that is writing to the microprocessor configured to
simulate the slave mode operation. The packet contains both START and STOP signals
which puts the simulated device into the slave mode.
>gdi IICDI START 55 AA 22 STOP
This input adds five values to the input queue, which is a packet from an external master,
including the following procedure values:
• A start signal comes in
• The address $55 comes in specifying a write (slave receive). The Address Register in the
current simulated device has been previously set to $55
• The data byte $AA comes in
• The data byte $22 comes in
• A STOP signal comes in
IICDO Command
The IICDO command displays a window, which shows data both shifted in and shifted out
of the IIC peripheral. An arrow points to the last output value transmitted/received. The
maximum number of output values that the buffer can hold is 256.
Syntax
>gdi IICDO
Example
470
Microcontrollers V10.x Targeting Manual
DRAFT
Connections — HCS08
P&E Full Chip Simulation
>gdi IICDO
View data from the input/output log buffer for IIC simulation.
IICCLR Command
Use the IICCLR command to flush the input and output buffers for IIC simulation. This
resets the buffers and clears all values. Notice that if the IIC is currently shifting a value,
this command does not prevent the IIC from finishing the transfer.
Syntax
>gdi IICCLR
Example
>gdi IICCLR
Clear input and output buffers for IIC simulation.
Interrupt Priority Controller Module
In Full Chip Simulation (FCS) Mode, this module simulates all the functionality of the
Interrupt Priority Controller (IPC) module. This module provides a hardware-based,
nested-interrupt mechanism in HCS08 MCUs and allows all prioritized non-software
interrupts to interrupt. IPC features a four-level programmable interrupt priority for each
source, supports prioritized preemptive interrupt service routines, and the interrupt priority
mask can be modified during main flow or interrupt service execution. When the interrupt
vector is being fetched, the module can automatically update the interrupt priority mask
with its serviced interrupt source priority level and automatically store previous interrupt
mask levels.
External Interrupt (IRQ) Module
In Full Chip Simulation (FCS) mode, this module simulates the input, flag polling and
interrupt functionality of the External Interrupt (IRQ) module. FCS mode uses the
INPUTS command and let you monitor and change the simulated value of the IRQ input
pin state. Once you enter the INPUTS command into the command line prompt, the
Simulated Port Inputs window appears. See the INPUT<x> Command for more
information about the various forms of this command. In addition, the state of the IRQ pin
can be modified directly using the IRQ<n> command (documented below).
Microcontrollers V10.x Targeting Manual
471
DRAFT
Connections — HCS08
P&E Full Chip Simulation
Figure 6.24 Simulated Port Inputs Dialog Box
An IRQ event occurrence sets the appropriate flag in the corresponding IRQ register. You
can poll the IRQ flag if the Polling Mode is simulated. In the Interrupt Mode, the simulator
branches to an appropriate interrupt subroutine as long as the IRQ interrupt vector is
properly configured.
NOTE
For more information on IRQ configuration, refer to the Freescale user manual
for your microprocessor.
Following the IRQ event, you can observe the IRQ Flag being set in the IRQ Status and
Control register.
Figure 6.25 Memory Component Window
IRQ Commands
The following interrupt request command is available for the HC08/HCS08 processors.
INPUTS Command
In FCS and CPU-Only Simulation mode, the INPUTS command opens the Simulated Port
Inputs dialog box shown in Figure 6.26. You may then use this box to specify the input
states of port pins and IRQ.
472
Microcontrollers V10.x Targeting Manual
DRAFT
Connections — HCS08
P&E Full Chip Simulation
Figure 6.26 Simulated Port Inputs Dialog Box
When using In-Circuit Simulation mode, the INPUTS command shows the simulated
input values for any applicable port.
Syntax
>gdi INPUTS
Example
>gdi INPUTS
Show I/O port input values.
NOTE
The IRQ pin state can be directly manipulated with the IRQ command. For
example, IRQ 1 simulates a high state on the IRQ pin; likewise, IRQ 0
simulates a logic-low state on the IRQ pin.
Keyboard Interrupt Module
In Full Chip Simulation (FCS) mode, this module simulates all functionality of the
Keyboard Interrupt (KBI) module, including the edge-only, edge and level interrupt, and
flag polling modes of operation. FCS mode uses simulated port inputs to trigger the KBI
event from the proper I/O port pin.
To define an input state of the specific port, write the INPUT<x> <n> command in the
Command window. The <x> represents the corresponding I/O port, while <n> stands
for the input value to write to this port. At the same time, you can use the INPUTS
command to bring up the Simulated Port Inputs for all general I/O ports. It displays the
current simulated values to all applicable input ports. See the documentation for Timer
Module Commands for more information about the various forms of this command.
Microcontrollers V10.x Targeting Manual
473
DRAFT
Connections — HCS08
P&E Full Chip Simulation
Figure 6.27 Simulated Port Inputs Dialog Box
Use the Simulated Port Inputs dialog box to reconfigure the input value to any I/O port.
To trigger the event, manipulate the inputs to the port in the appropriate manner,
depending on whether the KBI is configured for edge-only or edge and level. Once the
KBI event takes place, you can observe the KEYF Flag bit, which is a part of the
Keyboard Status and Control register, in the Memory window.
Figure 6.28 Memory Component Window
You can poll the KBI Interrupt Pending flag if the Polling Mode is simulated. In Interrupt
Mode, the simulator branches to an appropriate interrupt subroutine as long as the KBI
interrupt vector is properly configured.
NOTE
For more information on KBI configuration, refer to the Freescale user manual
for your microprocessor.
Keyboard Interrupt Commands
Use the following commands for Keyboard Interrupt manipulation.
INPUT<x> Command
474
Microcontrollers V10.x Targeting Manual
DRAFT
Connections — HCS08
P&E Full Chip Simulation
The INPUT<x> command sets the simulated inputs to port <x>. The CPU reads this input
value when port <x> is set as an input port.
Syntax
>gdi INPUT<x> <n>
Where:
<x> is the letter representing corresponding port
<n> is an eight-bit simulated value for port <x>
Example
>gdi INPUTA AA
Simulate the input AA on port A.
INPUTS Command
In FCS and CPU-Only Simulation mode, the INPUTS command opens the Simulated Port
Inputs dialog box shown in Figure 6.29. You may then use this box to specify the input
states of port pins and IRQ.
Figure 6.29 Simulated Port Inputs Dialog Box
When using In-Circuit Simulation mode, the INPUTS command shows the simulated
input values to any applicable port.
Syntax
>gdi INPUTS
Example
Microcontrollers V10.x Targeting Manual
475
DRAFT
Connections — HCS08
P&E Full Chip Simulation
>gdi INPUTS
Show I/O port input values.
Modulo Timer Interrupt Module
In Full Chip Simulation (FCS) mode, this module simulates all functionality of the
Modulo Timer Interrupt (MTIM) Module, including:
• Programmable MTIM clock input
• Free running or modulo up count operation
• Flag polling
• Interrupt enabled mode of operation
Once the MTIM Status and Control register properly configures the operation of the
module, the MTIM Counter starts incrementing. If modulo up count operation is enabled,
you can observe the MTIM overflow flag in the MTIM Status and Control register in the
Memory window.
Figure 6.30 Memory Component Window
If the MTIM interrupt is enabled, the FCS jumps to an appropriate subroutine as long as
the MTIM interrupt vector is properly defined.
MSCAN Controller Module
The MSCAN Controller Module fully simulates the operation of the MSCAN08 Protocol
Version 2.0 based device, including:
• Flag polling
• Interrupt enabled mode
• 0-8 bytes data length
• Transmission and reception of external data
The MSCAN08 peripheral is a scalable Control Area Network (CAN) 2.0 compliant
device that allows microcontrollers to exchange data between themselves at high speeds.
This is done through a high-speed serial link that is deterministic and reliable. CAN
476
Microcontrollers V10.x Targeting Manual
DRAFT
Connections — HCS08
P&E Full Chip Simulation
devices are often utilized in automobiles, where multiple microcontrollers need to be
connected into a network. The CAN specification indicates that any unit on the bus can be
a master at any time, which sends a message to another unit at any time, provided the bus
is free to do so. All of these messages can be set up through the CAN I/O commands built
into the simulator. This section goes through an example which shows how the simulator
can be used to test out code that drives the CAN peripheral
Programmable Delay Block Module
In Full Chip Simulation (FCS) Mode, this module lets you simulate all the functionality of
the Programmable Delay Block (PDB) module. This module’s primary function is to
provide a controllable delay from FTM SYNC output to the sample trigger input of PGA
or ADC, or a controllable window synchronized with PWM pulses for ACMP to compare
the analog signals in a defined window. PDB can alternately generate PWM pulses that
are synchronized to FTM, CMPR output, and RTC.
Programmable Gain Amplifier Module
In Full Chip Simulation (FCS) Mode, this option lets you simulate all the functionality of
the Programmable Gain Amplifier (PGA) module, including data input on all PGA
channels, flag polling, and output connection to the ADC input channel. You can utilize
either the PGA Inputs display form or command-line commands to provide inputs to the
PGA module. The PGAINPUTS command shows the simulated PGA input/output values.
There are also three specific commands in the simulation for providing PGA inputs to
simulation via a command line.
Programmable Reference Analog Comparator
Module
In Full Chip Simulation (FCS) Mode, this option lets you simulate all the functionality of
the Programmable Reference Analog Comparator (PRACMP) module, including data
input on all PRACMP channels, flag polling, and interrupt operation. You can use either
the PRACMP Inputs display form or command-line commands to provide inputs to
PRACMP module.
Input/Output (I/O) Ports Module
In Full Chip Simulation (FCS) mode, this module simulates all input and output
functionality of the Input/Output (I/O) Ports module. FCS mode uses a set of designated
commands to simulate the input and output activity on corresponding I/O port pins. To
define an input state of a specific port, write the INPUT <x> <n> command in the
Command window. The <x> represents the corresponding I/O port, while the <n> stands
for the input value to write to this port. At the same time, you can use the INPUTS
Microcontrollers V10.x Targeting Manual
477
DRAFT
Connections — HCS08
P&E Full Chip Simulation
command to bring up the Simulated Port Inputs for all general I/O ports. It displays the
current simulated values to all applicable input ports.
NOTE
See the Input/Output Ports User Commands and IRQ Commands for more
information about the various forms of this command.
Figure 6.31 Simulated Port Inputs Dialog Box
Use the Simulated Port Inputs dialog box to reconfigure the input value to any I/O port.
Use the INPUTS command to reconfigure the output values on any relevant I/O port. You
can observe the manipulation of I/O port pins in the Memory window.
Figure 6.32 Memory Component Window
Note that if the regular I/O pins are multiplexed to be used by a different MCU Module,
they might not be available for general I/O functionality.
NOTE
478
For more information on how to properly configure I/O pins, refer to the
Freescale user manual for your microprocessor.
Microcontrollers V10.x Targeting Manual
DRAFT
Connections — HCS08
P&E Full Chip Simulation
Input/Output Ports User Commands
Use the following commands for general I/O ports manipulation.
INPUT<x> Command
The INPUT<x> command sets the simulated inputs to port <x>. The CPU reads this input
value when port <x> is set as an input port.
Syntax
>gdi INPUT<x> <n>
Where:
<x> is the letter representing corresponding port
<n> Eight-bit simulated value for port <x>
Example
>gdi INPUTA AA
Simulate the input AA on port A.
INPUTS Command
In FCS and CPU-Only Simulation mode, the INPUTS command opens the Simulated Port
Inputs dialog box shown in Figure 6.33. You may then use this box to specify the input
states of port pins and IRQ.
Figure 6.33 Simulated Port Inputs Dialog Box
When using In-Circuit Simulation mode, the INPUTS command shows the simulated
input values to any applicable port.
Microcontrollers V10.x Targeting Manual
479
DRAFT
Connections — HCS08
P&E Full Chip Simulation
Syntax
>gdi INPUTS
Example
>gdi INPUTS
Show I/O port input values.
Serial Communications Interface Module
In Full Chip Simulation (FCS) mode, this module simulates all functionality of the Serial
Peripheral Interface (SPI) module including:
• Flag polling
• Interrupt enabled mode
• 8- or 9-bit length data codes
• Odd and even parity modes
• Transmission and reception of external data
FCS mode uses the buffered input/output structure to simulate SCI inputs. You can queue
up to 256 data values into the input buffer. The output buffer of the SCI module can also
hold 256 output values. To queue the SCI Input Data, use the SCDI <n> command in the
command prompt. If <n> (the data parameter) is given, the value is placed into the next
slot in the input buffer.
Otherwise, if no parameter is provided, a window is displayed with the input buffer
values. You can enter input values while the window is open. An arrow points to the next
value to be used as input to the SCI. The data from the SCI input buffer is written to the
SCI data register once the SCI module has been turned on and is properly configured for
receiving data from an external serial device. Once the simulation of the data transmission
is over, the arrow moves to the next value in the SCI IN Buffer.
480
Microcontrollers V10.x Targeting Manual
DRAFT
Connections — HCS08
P&E Full Chip Simulation
Figure 6.34 SCI IN Buffer Display
SCI Data Output Buffer simulation lets you gain access to the past 256 SCI data values
transmitted out of the module. To bring up the SCI OUT buffer dialog box, use the SCDO
command.
Figure 6.35 SCI OUT Buffer Display
The SCCLR command may be used at any point to flush the input and output SCI buffers.
After the SCI simulated input is received, the first queued value is passed from the data
buffer into the SCI data register. It can be observed in the memory window by displaying
the memory location corresponding to the SCI data register.
Microcontrollers V10.x Targeting Manual
481
DRAFT
Connections — HCS08
P&E Full Chip Simulation
Figure 6.36 Memory Component Window
You can also observe different SCI flags in the Memory window. If the module is run in
Flag Polling mode, poll the flag corresponding to the expected SCI event. If the SCI
interrupts are enabled, the FCS jumps to an appropriate subroutine as long as the SCI
interrupt vectors are properly defined.
NOTE
For more information on how to configure the SCI module for desired
operation, refer to the Freescale user manual for your microprocessor.
SCI Commands
The following serial communication interface commands are available for the HC08/
HCS08.
SCCLR Command
Use the SCCLR command to flush the input and output buffers for SCI simulation. This
resets the buffers and clears out all values. Note that if the SCI is in the process of shifting
a value, this command allows the SCI to finish the transfer. See the SCDI and SCDO
commands for accessing the input and output buffers of the SCI interface.
Syntax
>gdi SCCLR
Example
>gdi SCCLR
Clear input and output buffer for SCI simulation
SCDI Command
The SCDI command lets you input data into the SCI. If a data parameter is given, the
value is placed into the next slot in the SCI input buffer. If no parameter is given, a
window displays the input buffer values. Input values can be entered while the window is
open. An arrow points to the next value to be used as input to the SCI. The maximum
number of input values is 256 bytes.
482
Microcontrollers V10.x Targeting Manual
DRAFT
Connections — HCS08
P&E Full Chip Simulation
Syntax
>gdi SCDI [<n>]
Where:
<n> The value to be entered into the next location in the input buffer
Example
>gdi SCDI $55
Set the next input value to the SCI to $55
>gdi SCDI
Pull up the data window with all the input values.
Figure 6.37 SCI IN Buffer Display
SCDO Command
The SCDO command displays the output buffer from the SCI. A window is opened that
shows all the data that the SCI has shifted out. An arrow points to the last output value
transmitted. The maximum number of output values that the buffer holds is 256 bytes.
Syntax
>gdi SCDO
Example
>gdi SCDO
View data from the output buffer for the SCI simulation.
Microcontrollers V10.x Targeting Manual
483
DRAFT
Connections — HCS08
P&E Full Chip Simulation
Figure 6.38 SCI OUT Buffer Display
Slave LIN Interface Controller (SLIC) Module
In Full Chip Simulation (FCS) mode, this option will simulate all functionality of the
Slave LIN Interface Controller (SLIC) Module, including:
• Flag polling
• Interrupt enabled mode
• Transmission and reception of external data
• Check sum generation and verification
• Different message lengths data modes
Full Chip Simulation (FCS) mode uses a buffered structure to simulate SLIC inputs and
outputs. You can queue up to 256 data bytes into the input buffer. The output buffer of the
SLIC module can also hold 256 output bytes. To queue the SLIC Input bytes use the
SLCIN instruction in the command prompt. For a more detailed description of the
command, please refer to the SLIC Commands section. The SLIC instruction brings up a
window, which displays a list of queued input data. Different SLIC packets can be entered
while the window is open. An arrow points to the byte that will be used next as input to the
SLIC. Once the SLIC module is turned on and properly configured for receiving data from
an external SLIC device, the data from the SLIC input buffer is written to the SLIC
module identifier or data registers. After the simulation of the data transmission is
complete, the arrow moves to the next value in the SLIC IN Buffer.
Serial Peripheral Interface Module
In Full Chip Simulation (FCS) mode, this module simulates all functionality of the Serial
Peripheral Interface (SPI) module including:
• Flag polling
484
Microcontrollers V10.x Targeting Manual
DRAFT
Connections — HCS08
P&E Full Chip Simulation
• Interrupt enabled mode
• Master and slave modes
• Slave input clock
• Transmission and reception of external data
FCS mode uses the buffered input/output structure to simulate SPI inputs. You can queue
up to 256 data values into the input buffer. The output buffer of the SPI module can also
hold 256 output values. To queue the SPI Input Data, use the SPDI <n> command at the
command prompt. If <n> (the data parameter) is given, the value is placed into the next
slot in the input buffer.
Otherwise a window is displayed with the input buffer values. You can enter input values
while the window is open. An arrow points to the next input value to the SPI. The data
from the SPI input buffer is written to the SPI data register once the SPI module is turned
on and is properly configured for receiving data from an external serial device. Once the
simulation of the data transmission is over, the arrow moves to the next value in the SPI
IN Buffer.
Figure 6.39 SPI IN Buffer Display
SPI data output buffer simulation lets you gain access to the past 256 SPI data values
transmitted out of the module. To bring up the SPI OUT buffer dialog box, use the SPDO
command.
Microcontrollers V10.x Targeting Manual
485
DRAFT
Connections — HCS08
P&E Full Chip Simulation
Figure 6.40 SPI OUT Buffer Display
The SPCLR command may be used at any point to flush the input and output SPI buffers.
After the SPI simulated input is received, the first queued value is passed from the data
buffer into the SPI data register. It can be observed in the Memory Window by displaying
the memory location corresponding to the SPI data register.
Figure 6.41 Memory Component Window
You can also observe different SPI flags in the Memory window. If the module is run in
Flag Polling mode, poll the flag corresponding to the expected SPI event. If the SPI
interrupts are enabled, the FCS jumps to an appropriate subroutine as long as the SPI
channel interrupt vectors are properly defined.
To simulate the frequency of the SPI slave input clock, use the SPFREQ <n> command. If
the SPI is configured for slave mode, this command let you enter the number of cycles
<n> in the period of the input clock. If the SPFREQ command is not used, then clocking is
set by the SPI control register.
NOTE
486
For more information on how to configure the SPI module for desired
operation, refer to the Freescale user manual for your microprocessor.
Microcontrollers V10.x Targeting Manual
DRAFT
Connections — HCS08
P&E Full Chip Simulation
SPI Commands
The following serial peripheral interface commands are available for the HCS08.
SPCLR Command
Use the SPCLR command to flush the input and output buffers for SPI simulation. This
resets the buffers and clears out all values. Notice that if the SPI is currently shifting a
value, this command allows the SPI to finish the transfer. See the SPDI and SPDO
commands for accessing the input and output buffers of the SPI interface.
Syntax
>gdi SPCLR
Example
>gdi SPCLR
Clear input and output buffer for SPI simulation
SPDI Command
The SPDI command lets you input data into the SPI. If a data parameter is given, the value
is placed into the next slot in the SPI input buffer. If no parameter is given, a window
displays the input buffer values. You can enter input values while the window is open. An
arrow points to the next input value to the SPI. The maximum number of input values is
256 bytes.
Syntax
>gdi SPDI [<n>]
Where:
<n> The value to be entered into the next location in the input buffer
Example
>gdi SPDI $55
Set the next input value to the SPI to $55
>gdi SPDI
Pull up the data window with all the input values.
Microcontrollers V10.x Targeting Manual
487
DRAFT
Connections — HCS08
P&E Full Chip Simulation
Figure 6.42 SPI IN Buffer Display
SPDO Command
The SPDO command displays the output buffer from the SPI. A window opens that shows
all the data that the SPI has shifted out. An arrow points to the last output value
transmitted. The maximum number of output values that the buffer holds is 256 bytes.
Syntax
>gdi SPDO
Example
>gdi SPDO
View data from the output buffer for the SPI simulation.
Figure 6.43 SPI OUT Buffer Display
488
Microcontrollers V10.x Targeting Manual
DRAFT
Connections — HCS08
P&E Full Chip Simulation
SPFREQ Command
The SPFREQ command lets you set the frequency of the SPI slave input clock. If the SPI
is configured for the slave mode, this command lets you enter the number of cycles <n>
per one input clock period. If no value is given, a window appears and you are prompted
for a value. If this command is not used, then the clocking is assumed to be set by the SPI
control register.
Syntax
>gdi SPFREQ [<n>]
Where:
<n> The number of cycles for the period of the input clock.
Example
>gdi SPFREQ 8
Set the period of the input slave clock to 8 cycles (total shift = 8*8 cycles per bit =
64 cycles)
Timer Interface Module
In Full Chip Simulation (FCS) mode, this module simulates all functionality of the Timer
Interface module, including:
• Input capture/output compare
• Pulse width modulation
• Internal or external clock input
• Free running or modulo up count operation
• Flag polling
• Interrupt enabled mode of operation.
FCS mode uses the simulated port inputs to trigger the input capture on a given timer
channel. To define an input state of the specific port, use the INPUT<x> <n> command in
the Command window. The <x> represents the corresponding I/O port, while <n> stands
for the input value to write to this port. At the same time, the INPUTS command can be
used to display the Simulated Port Inputs for all general I/O ports. It displays the current
simulated values to all applicable input ports. See the documentation for Timer Module
Commands for more information about the various forms of this command.
Microcontrollers V10.x Targeting Manual
489
DRAFT
Connections — HCS08
P&E Full Chip Simulation
Figure 6.44 Simulated Port Inputs Dialog Box
Use the Simulated Port Inputs dialog box to reconfigure the input value to any I/O port.
To trigger the event, first set the port inputs high or low and then invert them to an
opposite value, depending on whether the input capture is set for rising/falling edge. Once
the Input Capture event takes place you can observe the CHxF in the Channel Status and
Control register in the Memory window.
Figure 6.45 Memory Component Window
If the Timer module is configured for an Output Compare event, then once the event takes
place you can observe the same CHxF Flag via the Memory window. If the timer channel
interrupt is enabled, the FCS jumps to an appropriate subroutine as long as the Timer
channel interrupt vector is properly defined. To observe the Timer Overflow Flag (TOF)
flag being set as a result of the corresponding CPU event, situate your Memory window on
the memory location of the Timer Status and Control register.
To observe the Pulse Width Modulation (PWM) operation, properly configure the Timer
to operate in the Modulo up count mode, select the toggle-on-overflow or clear/set output
on compare events to create the desired duty cycle wave. Once a PWM event takes place,
you can observe pin toggle/clear/set behavior corresponding to the Timer configuration in
the Memory window displaying the I/O port associated with a given timer channel.
490
Microcontrollers V10.x Targeting Manual
DRAFT
Connections — HCS08
P&E Full Chip Simulation
To observe the accuracy of the Timer module operation, you can observe the number of
CPU cycles that it takes for the event to occur. The cycle counter is only incremented as
the you step through the code. To determine the exact amount of cycles over which the
event occurs, one can either observe the cycle display in the Register window or use the
built in simulation commands. To display the current number of cycles in the Command
window, use the CYCLES command. To change the number of cycles in the cycle
counter, use CYCLES <n>, where <n> is the new cycle value. If the event has a precalculated number of cycles, use CYCLE 00 to reset the number of cycles and
GOTOCYCLE <n> to run through the code until you reach the expected event.
Figure 6.46 Register Window With Cycles Display
Timer Module Commands
The following timer module commands are available for use with the HC08/HCS08
processors.
CYCLES Command
The CYCLES command changes the value of the cycles counter. The cycles counter
counts the number of the processor cycles that have passed during execution. The Cycles
window shows the cycle counter. The cycle count can be useful for timing procedures.
Syntax
>gdi CYCLES <n>
Where:
<n> Integer value for the cycles counter
Examples
>gdi CYCLES 0
Reset cycles counter
>gdi CYCLES 1000
Set cycle counter to 1000.
Microcontrollers V10.x Targeting Manual
491
DRAFT
Connections — HCS08
P&E Full Chip Simulation
GOTOCYCLE Command
The GOTOCYCLE command executes the program in the simulator beginning at the
address in the program counter (PC). Execution continues until the cycle counter is equal
to or greater than the specified value, until a key or the Stop button on the toolbar is
pressed, until it reaches a break point, or until an error occurs.
Syntax
>gdi GOTOCYCLE <n>
Where:
<n> Cycle-counter value at which the execution stops
Example
>gdi GOTOCYCLE 100
Execute the program until the cycle counter equals 100.
INPUT<x> Command
The INPUT<x> command sets the simulated inputs to port <x>. The CPU reads this input
value when port <x> is set as an input port.
Syntax
>gdi INPUT<x> <n>
Where:
<x> is the letter representing corresponding port
<n> Eight-bit simulated value for port <x>
Example
>gdi INPUTA AA
Simulate the input AA on port A.
INPUTS Command
In FCS and CPU-Only Simulation mode, the INPUTS command opens the Simulated Port
Inputs dialog box shown in Figure 6.47. You may then use this box to specify the input
states of port pins and IRQ.
492
Microcontrollers V10.x Targeting Manual
DRAFT
Connections — HCS08
P&E Full Chip Simulation
Figure 6.47 Simulated Port Inputs Dialog Box
When using In-Circuit Simulation mode, the INPUTS command shows the simulated
input values to any applicable port.
Syntax
>gdi INPUTS
Example
>gdi INPUTS
Show I/O port input values.
Time Of Day Module Option
In Full Chip Simulation (FCS) mode, this module lets you simulate all the functionality of
the Time Of Day (TOD) module. The module includes an 8-bit counter, a 6-bit match
register, several binary-based and decimal-based prescaler dividers, three clock source
options, and one interrupt that can be used for quarter second, one second and match
conditions. A 4 Hz signal is used as the reference clock for the TOD counter, where each
tick of the TOD counter is 0.25 seconds. This module can be used for time-of-day,
calendar, or any task scheduling functions. It can also serve as a cyclic wake up from lowpower modes without the need for external components.
Universal Serial Bus (USB) Module
In Full Chip Simulation (FCS) mode, this module simulates all functionality of the
Universal Serial Bus (USB) module including USB flags and interrupts, seven USB
endpoints, USB RAM and USB reset options. While all control transactions occur through
Microcontrollers V10.x Targeting Manual
493
DRAFT
Connections — HCS08
P&E HCS08 Multilink\Cyclone Pro
bi-directional endpoint 0, the other endpoints can be set up for data transfer in the input or
output direction.
Some of the microcontrollers in the HCS08 family contain USB compliant peripheral
devices. These can be low-speed or high-speed USB slave devices. This means that all
USB transfers are initiated by a host (i.e. a personal computer) and that the microcontroller
needs to be set up to respond with the appropriate acknowledgement messages. According
to the USB specification, there are a series of messages that go back and forth between the
host and the device in order to set up and describe the channel for data transfer. All of
these messages can be set up through the USB I/O commands built into the simulator. This
section goes through an example of this, showing how the simulator can be used to test out
code for driving the USB peripheral.
Voltage Reference Module
In Full Chip Simulation (FCS) mode, this module lets you simulate all the functionality of
the Voltage Reference (VREF) module. The module is a bandgap buffer system intended
to supply an accurate voltage output that is trimmable by an 8-bit register in 0.5 mV steps.
It can be used internally for the analog peripherals of an ADC channel or for an ACMP
input. VREF has three operating modes that provide different levels of load regulation and
power consumption.
P&E HCS08 Multilink\Cyclone Pro
This section describes the HCS08 P&E Multilink/Cyclone Pro Connection options, and
also Chip View, which is a time-saving ICD feature that makes the debugging process
much easier. The HCS08 P&E Multilink/Cyclone Pro Connection setting permits a
connection to HCS08 Freescale devices via P&E Multilink/Cyclone Pro hardware
interfaces. This connection mode lets you debug code, as the firmware is fully resident in
the Flash or RAM of the microprocessor.
Chip View
Chip View is an innovative feature designed to simplify Full Chip Simulation (FCS) and
In-Circuit Debugging (ICD) sessions. The Chip View grants you instantaneous access to
internal modules of the chip, and also lets you instantly change any of the features by
clicking them. Each pin features the current pin direction, input/output value, and the
name of signal that reflects the current module that controls it. These data features are
updated every 50ms throughout a running FCS or ICD session.
494
Microcontrollers V10.x Targeting Manual
DRAFT
Connections — HCS08
P&E HCS08 Multilink\Cyclone Pro
Figure 6.48 Chip View Window
To open Chip View, perform these steps.
1. From the IDE menu bar, select PEMicro > Device Package > Device Package:<
Pin>, where < Pin> is the pin package you would like to work with. (See Figure 6.49).
The Device Package can be changed before or after the Chip View window is invoked
within the CodeWarrior IDE.
Figure 6.49 Device Package Extended Menu
2. From the IDE menu bar, select Window > Show View > Others (Figure 6.50).
Microcontrollers V10.x Targeting Manual
495
DRAFT
Connections — HCS08
P&E HCS08 Multilink\Cyclone Pro
Figure 6.50 Show View Extended Menu
The Show View dialog box appears.
3. Expand Other and select Chip View (Figure 6.51).
Figure 6.51 Show View Menu
496
Microcontrollers V10.x Targeting Manual
DRAFT
Connections — HCS08
P&E HCS08 Multilink\Cyclone Pro
4. To change direction and values of the pin, double-click the corresponding arrow or the
number value. Details are listed below.
NOTE
If you close the Chip View window during debug session, you will not be able
to access to the Chip View.You must reopen the Chip View window and
restart the current debugging session to open the Chip View window again.
Closing Chip View should slightly improve performance during existing
debug session.
Chip GUI - Ports Module Support
You have the option of changing the pin’s direction and values by double-clicking on
the corresponding arrow or number value. Figure 6.52 is an example of what the Chip
View may look like before any changes are made. When the pin direction is input, the
pin will display the current pin input value. When the pin direction is output, you have
the option of double-clicking the number value to control the output value for the pin.
Figure 6.53 is an example of the PTA2 pin value being changed from 0 to 1 by doubleclicking on the number value.
Figure 6.52 Chip View Display Before Change
Microcontrollers V10.x Targeting Manual
497
DRAFT
Connections — HCS08
P&E HCS08 Multilink\Cyclone Pro
Figure 6.53 Chip View Display After Change
When you double-click the pin’s value or direction, a pin configuration dialog appears
underneath the Chip View diagram (Figure 6.54). In the pin configuration options, you
have the option of changing analog and digital I/O settings for a given pin.You can select
a pin from the pin-number drop-down list, select between analog and digital signals, and
switch pin directions. For the digital I/O signal, you can switch between high or low
signals (Figure 6.54).
Figure 6.54 Chip View with Digital Pin Configuration Options
498
Microcontrollers V10.x Targeting Manual
DRAFT
Connections — HCS08
P&E HCS08 Multilink\Cyclone Pro
Connection Options
This topic describes all P&E Multilink\Cyclone connection options, which are common to
all P&E USB BDM Multilink, P&E Cyclone Pro Serial, P&E Cyclone PRO USB, and
P&E Cyclone PRO TCP-IP connections.
The connection options include:
• Changing P&E Connections Settings
• Connection Assistant
• Launch Configuration Settings
• Active Mode Menu Options
• Advanced Programming/Debug Options
• View Register Files Option
• Socket Programming Options Button
• P&E HCS08 Multilink\Cyclone Pro Connection-Specific Options
Changing P&E Connections Settings
All connection settings for P&E hardware interfaces are configured in the Launch
Configurations dialog box.
Microcontrollers V10.x Targeting Manual
499
DRAFT
Connections — HCS08
P&E HCS08 Multilink\Cyclone Pro
Figure 6.55 P&E Multilink/Cyclone Pro
Table 6.1 describes the options for the Debugger tab page.
500
Microcontrollers V10.x Targeting Manual
DRAFT
Connections — HCS08
P&E HCS08 Multilink\Cyclone Pro
Table 6.1 Connection Parameter Options for P&E Multilink/Cyclone Pro
Option
Description
Interface
Use this option to select the interface type.
Select a supported interface from the list
box. The options are:
• BDM Multilink Parallel Port
• USBHCS08\HCS12\CFV1
Multilink - USB Port
• Cyclone PRO - Serial Port
• Cyclone PRO - USB Port
• Cyclone PRO - Ethernet Port
Port
This option selects the port over which
debug communications is conducted.
Select an available port from the list box.
Refresh
Click this button to have the workstation scan
for a valid interface and port. Valid interfaces
and ports appear in the Interface and
Port list boxes.
Socket Programming Options
The Socket Programming Options button
brings up a dialog that provides you with a
graphical representation of the signals that
must be connected from the BDM header to
the pins of the microprocessor, in order to
use Freescale socket adapters.
(Cyclone Pro only) Provide power to
target
This option determines whether the Cyclone
Pro (circuitry) provides power to the target
hardware via the probe.
Check this option to have the Cyclone Pro
(circuitry) supply power to the hardware
target
Uncheck this option to not provide power.
Microcontrollers V10.x Targeting Manual
501
DRAFT
Connections — HCS08
P&E HCS08 Multilink\Cyclone Pro
Table 6.1 Connection Parameter Options for P&E Multilink/Cyclone Pro (continued)
Option
Description
(Cyclone Pro only) Power off target
upon software exit
This option determines whether the Cyclone
PRO hardware interface provides power to
the target hardware via the VDD of the BDM
cable.
Check this option to turn off the power when
the program terminates.
Uncheck this option to leave the hardware
target powered continuously.
(Cyclone Pro only) Regulator Output
Voltage
This option adjusts the output voltage that
powers the hardware target.
Select a voltage value from this option’s list
box.
(Cyclone Pro only) Power down delay
This option specifies amount of time for
which the target will be turned off during a
RESET power cycling sequence.
Enter the delay interval (in milliseconds) in
this option’s text box.
(Cyclone Pro only) Power up delay
This option specifies amount of time for
which the target will remain powered prior to
a RESET power cycling sequence.
Enter the delay interval (in milliseconds) in
this option’s text box.
WARNING!
An improper voltage setting can damage the board.
To change P&E Connections settings, perform these steps:
1. In the CodeWarrior Projects view, select the project for which you want to change
the P&E Connections settings.
NOTE
It is assumed that you have created a project and built it.
2. Select Run > Debug Configurations from the main menu bar of the IDE.
The Debug Configurations dialog box appears.
3. Expand the CodeWarrior Download tree control in the left pane and select the launch
configuration you want to debug.
502
Microcontrollers V10.x Targeting Manual
DRAFT
Connections — HCS08
P&E HCS08 Multilink\Cyclone Pro
4. Click the Debugger tab.
The Debugger page appears in the area beneath the tabs.
5. Click the Connection tab in the Debugger Options group to show the connection
settings.
6. Ensure to select GDI from the Connection Protocol drop-down list.
7. In the Physical connection group, select P&E HCS08 Multilink\Cyclone
Pro from the Connection drop-down list.
8. Click Refresh to scan valid interface and port.
Valid interfaces and ports appear in the Interface and Port drop-down lists in the
Connection port and Interface Type group.
9. Select a supported interface from the Interface drop-down list.
10. Select a supported port from the Port drop-down list.
NOTE
The port displayed may vary depending on the interface. For example, if you
select interface as Cyclone PRO - Serial Port, the available port
option is COM1 : Serial Port 1.
11. Specify settings in the Cyclone Pro Power Control (Voltage --> Power -Out Jack)
group.
NOTE
This group will be enabled for Cyclone PRO interface only.
12. Check the Provide power to target checkbox to have the Cyclone PRO (circuitry)
provide power to the target else clear the checkbox if you do not want to provide
power to the target.
13. Check the Power off target upon software exit checkbox to turn off the power when
the program terminate else clear the checkbox to leave the hardware target powered
continuously.
14. Select a voltage value from the Regulator Output Voltage drop-down list.
This adjusts the output voltage that powers the hardware target.
WARNING!
An improper voltage setting can damage the board.
15. Enter the delay interval (in milliseconds) in the Power Down Delay text box.
This option specifies the time interval to wait before shutting off the power to the
hardware target.
Microcontrollers V10.x Targeting Manual
503
DRAFT
Connections — HCS08
P&E HCS08 Multilink\Cyclone Pro
16. Enter the delay interval (in milliseconds) in the Power Up Delay text box.
This option specifies the time interval to wait before turning on the power to the
hardware target.
17. Click Apply to save changes to the P&E Connections settings.
18. Click Close to close the Debug Configurations dialog box.
Connection Assistant
The P&E Connection Assistant is displayed when you attempt to debug and the program
cannot connect to the interface hardware specified in the Launch Configuration Dialog. To
select the P&E Multilink/Cyclone Pro as your debugger connection:
1. Select the P&E device that you are using from the first drop-down list and click
Refresh. See Figure 6.56.
2. Using the second drop-down list, select the port on which the interface is connected.
3. Click the Retry button
Figure 6.56 HCS08 Connection Assistant Interface Selected
Launch Configuration Settings
To set the launch configurations for the debugger:
1. Find the debugger icon and click the drop-down arrow to bring up the debugger menu.
See Figure 6.57.
2. Select Debug Configurations
3. In the left column, select the project download type you would like to set the launch
configurations. See Figure 6.58
4. In the right column, click the Debugger tab.
5. Set your configurations and click the Debug button to start the debugger.
504
Microcontrollers V10.x Targeting Manual
DRAFT
Connections — HCS08
P&E HCS08 Multilink\Cyclone Pro
Figure 6.57 Debugger drop-down list
Microcontrollers V10.x Targeting Manual
505
DRAFT
Connections — HCS08
P&E HCS08 Multilink\Cyclone Pro
Figure 6.58 Debug Configuration Dialog Box
Active Mode Menu Options
When the microprocessor is connected, the active mode menu shows the name of the
microprocessor and gives you the access to the Advanced Programming/Debug Options.
When the microprocessor is not connected, the menu is not available.
Figure 6.59 Additional Connection Menu Options
Advanced Programming/Debug Options
The Advanced Programming/Debug Options menu option takes you to the Advanced
Options dialog box, where you can configure the software settings for the flash
programming procedure.
506
Microcontrollers V10.x Targeting Manual
DRAFT
Connections — HCS08
P&E HCS08 Multilink\Cyclone Pro
Figure 6.60 Advanced Options Dialog Box
Prompt on Flash Program Checkbox
Setting the "Always Erase and Program flash without asking" checkbox in this dialog box
allows the software to transparently program the microprocessor every time the debugger
is started. Setting the "Enable Flash Programming Dialog" lets you view the steps taken by
the Flash Programmer.
Trim Options
The Calculate Trim and Program the Non-Volatile Trim Register checkbox enables
automatic calculation and programming of the trim value to a designated Non-Volatile
memory location.
Non-Volatile Memory Preservation
You have the option of preserving up to three independent ranges of non-volatile memory
(on devices with EEPROM, the entire EEPROM array may optionally be preserved as
well). Ranges that are designated as “preserved” are read before an erase, and re-
Microcontrollers V10.x Targeting Manual
507
DRAFT
Connections — HCS08
P&E HCS08 Multilink\Cyclone Pro
programmed immediately afterwards, thereby preserving the data in these ranges. Any
attempt to program data into a preserved range is ignored. When entering an address into
the preserved range field (hexadecimal input is expected), the values are masked
according to the row size of the device. This ensures that the reprogramming of preserved
data does not cause any conditions that disturb programming.
Sync to PLL Change Checkbox
The debugger requires that Sync to PLL Change be selected to synchronize the software/
hardware connection with the microprocessor during the Flash erasing/programming
procedure. This option is always enabled for M68HCS08 devices.
Trim Control
The Use custom trim reference frequency option lets you select a custom trim value for the
target device (valid only for devices with an Internal Clock). The allowable trim value is
limited only by the device itself; you can input any value within the valid internal clock
frequency range. Note that the valid internal clock frequency range and the default trim
value for the currently selected device/algorithm are displayed as well. For more
information about the specific functionality of the internal clock source, see the Freescale
Data Sheet for your specific device.
Alternative Algorithm Functionality
Once you create a project for a specific HCS08/RS08 microprocessor, the debugger
specifies a default algorithm to use during all Flash programming operations. The
debugger uses this algorithm for nearly all programming requirements. The default
algorithm can be found in the <CW_Install>/prog/P&E directory.
However, you can override the default algorithm via the Alternative Algorithm function,
located in the Advanced Programming/Debug Options menu. This feature can be used to
select a custom programming algorithm, or select another one of P&E’s many
programming algorithms for use with a specific project.
TIP
Selecting a wrong programming algorithm may damage you device, lead to under/
over programming situations, or simply not program portions of the project file.
Therefore it is recommended to use the default algorithm unless there is a
compelling reason to do otherwise.
Use these steps to override the default algorithm:
508
Microcontrollers V10.x Targeting Manual
DRAFT
Connections — HCS08
P&E HCS08 Multilink\Cyclone Pro
1. Select the Advanced Programming/Debug Options selection from the PEMicro menu.
Figure 6.61 Advanced Programming/Debug Options Menu Selection
2. Check the Use Alternative Algorithm checkbox.
Figure 6.62 Advanced Options - Alternative Algorithm Checkbox
3. Click the Choose Alternative Algorithm button, which lets you browse for an
alternative algorithm.
4. Once you select the alternative algorithm, the name of the algorithm along with its full
path appears in the text field below the Choose Alternative Algorithm button.
At this point, the current project performs all future Flash programming operations using
the alternative algorithm. You may revert to the default algorithm at any time by clearing
the Use Alternative Algorithm checkbox.
Microcontrollers V10.x Targeting Manual
509
DRAFT
Connections — HCS08
P&E HCS08 Multilink\Cyclone Pro
View Register Files Option
The Register Files tab in the debugger gives you the option of viewing and editing the
register files. If register files are available for the device that you have chosen, the
Registers tab in the debugger (see Figure 6.63) is populated.
Figure 6.63 Debug Register File Tab
To view the Register Files of the device that you have chosen:
1. Find the debugger icon and click it to enter debug mode and open the debugging
window
2. Select the “Registers” tab on the right side of the debugging window, or select the
Window menu -> Show View -> Registers to open the Register window.
3. Expand a module by clicking on the plus/minus button to view the registers within the
module
4. Select a desired register to view its bit fields and bit descriptions in the window below.
In the Registers tab, all of the available modules are listed, and under each module all of
its registers are displayed with their current values. Selecting a register brings up the Bit
field, Actions box, and Description box. In the Bit field, you can view the bits in binary
510
Microcontrollers V10.x Targeting Manual
DRAFT
Connections — HCS08
P&E HCS08 Multilink\Cyclone Pro
format. The Actions box is used when a bit needs to be modified. You can revert changes,
write a new value, reset all of the bits, and view a summary of the register. You can also
change the format of the value written in the bit field. The Description box displays the
values and significance of each bit in the register. When a bit is modified, the description
will change.
You can modify each bit by selecting it in the drop-down list under the Bit field, or by
clicking the bit on the Bit field. Note that bits that are read-only will not allow you to
modify the bit values. A new value can be written into the edit box, or you can click the
light bulb button next to the edit box to view all of the options, and then double-click the
changes.
Socket Programming Options Button
The Programming Adapter Connections dialog assistant is designed to facilitate the use of
an extensive set of Freescale programming socket adapters. This dialog can be used to get
a graphical representation of the signals that must be connected from the BDM header to
the pins of the microprocessor. Making these connections lets you establish
communication with a given device via a hardware debug interface.
The Socket Programming Options button in the BDM Launch Configuration dialog box
(see Figure 6.64) takes you to the Programming Adapter Connections dialog box (see
Figure 6.65), where you can look up pin connection settings for the selected package type
of the target processor. Only available package types for each target processor are listed
in the Package drop-down list. Once you have selected a package type, the Adapter
Information section provides the part number of the adapter board, the socket number
where the processor should be placed, and a pair of header numbers that indicate which
connections should be made between them. Immediately below the Adapter Information
section you will find a pin layout that displays the required connections between the
aforementioned pair of headers.
Microcontrollers V10.x Targeting Manual
511
DRAFT
Connections — HCS08
P&E HCS08 Multilink\Cyclone Pro
Figure 6.64 HCS08 BDM Launch Configuration Dialog Box
512
Microcontrollers V10.x Targeting Manual
DRAFT
Connections — HCS08
P&E HCS08 Multilink\Cyclone Pro
Figure 6.65 Programming Adapter Connections Dialog Box
P&E HCS08 Multilink\Cyclone Pro ConnectionSpecific Options
This topic describes the connection-specific options. The connections include:
• P&E USB BDM Multilink
• P&E Cyclone Pro Serial
• P&E Cyclone PRO USB
• P&E Cyclone PRO TCP-IP
P&E USB BDM Multilink
The P&E USB BDM Multilink Connection setting permits a connection to USB BDM
Multilink devices. P&E USB BDM Multilink mode lets you debug code, as the firmware
is fully resident in the Flash of the microprocessor. The operation of all modules fully
reflects the actual operation of the onboard resources.
To select P&E USB BDM Multilink as the debugger connection:
1. Select Project > Change Device/Connection from the IDE menu bar. The Device/
Connection Change wizard appears.
2. Type a name for the project, in the New Project Name text box. By default, it is the
existing project name.
Microcontrollers V10.x Targeting Manual
513
DRAFT
Connections — HCS08
P&E HCS08 Multilink\Cyclone Pro
NOTE
Clear the Use default location checkbox and click Browse to specify a different
location for the new project. By default, the Use default location checkbox is
checked.
3. Click Next. The Device and Connection page appears.
4. Expand the HCS08 tree control and select the derivative or board you would like to
use. For example, select HCS08 > HCS08D Family > 9S08DE32.
5. Click Next. The Connections page appears.
6. Check the P&E USB BDM Multilink checkbox. See Figure 6.66.
Figure 6.66 HCS08 P&E USB BDM Multilink Selected
7. Click Finish.
The wizard creates a project for the HCS08 architecture according to your specifications.
You can access the project from the CodeWarrior Projects view in the Workbench
window.
Connection Assistant
The P&E Connection Assistant is displayed when you attempt to debug and the program
cannot connect to the interface hardware specified in the Launch Configuration Dialog. To
select the P&E USB BDM Multilink as your debugger connection:
514
Microcontrollers V10.x Targeting Manual
DRAFT
Connections — HCS08
P&E HCS08 Multilink\Cyclone Pro
1. Select USB Multilink – USB Port from the first drop-down list and click Refresh. See
Figure 6.67.
2. Using the second drop-down list, select the port on which the interface is connected.
3. Click the Retry button
Figure 6.67 HCS08 Connection Assistant Interface Selected
P&E Cyclone Pro Serial
The P&E Cyclone Pro Serial Connection setting permits a connection to Cyclone Pro
Serial devices. P&E Cyclone Pro Serial mode lets you debug code, as the firmware is fully
resident in the Flash of the microprocessor. The operation of all modules fully reflects the
actual operation of the onboard resources.
To select P&E Cyclone Pro Serial as the debugger connection:
1. Select Project > Change Device/Connection from the IDE menu bar. The Device/
Connection Change wizard appears.
2. Type a name for the project, in the New Project Name text box. By default, it is the
existing project name.
NOTE
Clear the Use default location checkbox and click Browse to specify a
different location for the new project. By default, the Use default location
checkbox is checked.
3. Click Next. The Device and Connection page appears.
4. Expand the HCS08 tree control and select the derivative or board you would like to
use. For example, select HCS08 > HCS08D Family > 9S08DE32.
5. Click Next. The Connections page appears.
6. Check the P&E Cyclone Pro Serial checkbox. See Figure 6.68.
Microcontrollers V10.x Targeting Manual
515
DRAFT
Connections — HCS08
P&E HCS08 Multilink\Cyclone Pro
Figure 6.68 HCS08 P&E Cyclone Pro Serial Selected
7. Click Finish.
The wizard creates a project for the HCS08 architecture according to your specifications.
You can access the project from the CodeWarrior Projects view in the Workbench
window.
Connection Assistant
The P&E Connection Assistant is displayed when you attempt to debug and the program
cannot connect to the interface hardware specified in the Launch Configuration Dialog. To
select the P&E Cyclone Pro Serial as your debugger connection:
1. Select USB Multilink – USB Port from the first drop-down list and click Refresh. See
Figure 6.69.
2. Using the second drop-down list, select the port on which the interface is connected.
3. Click the Retry button
516
Microcontrollers V10.x Targeting Manual
DRAFT
Connections — HCS08
P&E HCS08 Multilink\Cyclone Pro
Figure 6.69 HCS08 Connection Assistant Interface Selected
P&E Cyclone PRO USB
The P&E Cyclone Pro USB Connection setting permits a connection to Cyclone Pro USB
devices. P&E Cyclone Pro USB mode lets you debug code, as the firmware is fully
resident in the Flash of the microprocessor. The operation of all modules fully reflects the
actual operation of the onboard resources.
To select P&E Cyclone Pro USB as the debugger connection:
1. Select Project > Change Device/Connection from the IDE menu bar. The Device/
Connection Change wizard appears.
2. Type a name for the project, in the New Project Name text box. By default, it is the
existing project name.
NOTE
Clear the Use default location checkbox and click Browse to specify a different
location for the new project. By default, the Use default location checkbox is
checked.
3. Click Next. The Device and Connection page appears.
4. Expand the HCS08 tree control and select the derivative or board you would like to
use. For example, select HCS08 > HCS08D Family > 9S08DE32.
5. Click Next. The Connections page appears.
6. Check the P&E Cyclone Pro USB checkbox. See Figure 6.70.
Microcontrollers V10.x Targeting Manual
517
DRAFT
Connections — HCS08
P&E HCS08 Multilink\Cyclone Pro
Figure 6.70 HCS08 P&E Cyclone Pro USB Selected
7. Click Finish.
The wizard creates a project for the HCS08 architecture according to your specifications.
You can access the project from the CodeWarrior Projects view in the Workbench
window.
Connection Assistant
The P&E Connection Assistant is displayed when you attempt to debug and the program
cannot connect to the interface hardware specified in the Launch Configuration Dialog. To
select the P&E Cyclone Pro USB as your debugger connection:
1. Select USB Multilink – USB Port from the first drop-down list and click Refresh. See
Figure 6.71.
2. Using the second drop-down list, select the port on which the interface is connected.
3. Click the Retry button
518
Microcontrollers V10.x Targeting Manual
DRAFT
Connections — HCS08
P&E HCS08 Multilink\Cyclone Pro
Figure 6.71 HCS08 Connection Assistant Interface Selected
P&E Cyclone PRO TCP-IP
The P&E Cyclone Pro TCP-IP Connection setting permits a connection to Cyclone Pro
TCP-IP devices. P&E Cyclone Pro TCP-IP mode lets you debug code, as the firmware is
fully resident in the Flash of the microprocessor. The operation of all modules fully
reflects the actual operation of the onboard resources.
To select P&E Cyclone Pro TCP-IP as the debugger connection:
1. Select Project > Change Device/Connection from the IDE menu bar. The Device/
Connection Change wizard appears.
2. Type a name for the project, in the New Project Name text box. By default, it is the
existing project name.
NOTE
Clear the Use default location checkbox and click Browse to specify a
different location for the new project. By default, the Use default location
checkbox is checked.
3. Click Next. The Device and Connection page appears.
4. Expand the HCS08 tree control and select the derivative or board you would like to
use. For example, select HCS08 > HCS08D Family > 9S08DE32.
5. Click Next. The Connections page appears.
6. Check the P&E Cyclone Pro TCP-IP checkbox. See Figure 6.72.
Microcontrollers V10.x Targeting Manual
519
DRAFT
Connections — HCS08
P&E HCS08 Multilink\Cyclone Pro
Figure 6.72 HCS08 P&E Cyclone Pro TCP-IP Selected
7. Click Finish.
The wizard creates a project for the HCS08 architecture according to your specifications.
You can access the project from the CodeWarrior Projects view in the Workbench
window.
Connection Assistant
The P&E Connection Assistant is displayed when you attempt to debug and the program
cannot connect to the interface hardware specified in the Launch Configuration Dialog. To
select the P&E Cyclone Pro TCP-IP as your debugger connection:
1. Select USB Multilink – USB Port from the first drop-down list and click Refresh. See
Figure 6.73.
2. Using the second drop-down list, select the port on which the interface is connected.
3. Click the Retry button
520
Microcontrollers V10.x Targeting Manual
DRAFT
Connections — HCS08
Softec
Figure 6.73 HCS08 Connection Assistant Interface Selected
Softec
This topic will contain information specific to Softec connection.
Open Source BDM
This topic will contain information specific to OSBDM connection.
Microcontrollers V10.x Targeting Manual
521
DRAFT
Connections — HCS08
Open Source BDM
522
Microcontrollers V10.x Targeting Manual
DRAFT
7
Connections — RS08
For the IDE to communicate with the target hardware, you must specify several key items:
the debugger protocol, a connection type, and any connection parameters. You enter the
first two items of information using options in the Connection tab. The Connection tab is
located in the Debugger tab of the Debug window. These options are:
• The Connection Protocol option determines what debugger protocol the debugger
uses to communicate with the target.
• The Physical Connection option specifies the hardware probe or connection type
that physically connects the workstation hosting CodeWarrior to the target board
under debug. After you make the option of physical connection, the view changes to
display configuration options specific for the hardware probe.
You use the options in the revised view to configure the third item, the connection
parameters.
The topics in this chapter discuss the features and settings of the connections that interface
the CodeWarrior debugger with the RS08-based bare board target.
The topics of this chapter are:
• Changing Connection in IDE
• P&E Full Chip Simulation
• P&E RS08 Multilink\Cyclone Pro
• Softec
• Open Source BDM
Changing Connection in IDE
Full Chip Simulation (FCS) connection runs a complete simulation of all processor
peripherals and I/O on your personal computer. Thus, when debugging an FCS project for
a selected derivative it is not necessary to connect your PC with a Microcontrollers
development or target board.
To select Full Chip Simulation as the debugger connection:
1. Select Project > Change Device/Connection from the IDE menu bar.
The Device/Connection Change wizard appears.
Microcontrollers V10.x Targeting Manual
523
DRAFT
Connections — RS08
P&E Full Chip Simulation
2. Type a name for the project, in the New Project Name text box. By default, it is the
existing project name.
NOTE
Clear the Use default location checkbox and click Browse to specify a
different location for the new project. By default, the Use default location
checkbox is checked.
3. Click Next.
The Device and Connection page appears.
4. Expand the RS08 tree control and select the derivative or board you would like to use.
For example, select RS08 > RS08KA Family > MC9RS08KA1.
5. Click Next.
The Connections page appears.
6. Check the P&E Full Chip Simulation checkbox.
NOTE
You can select multiple connections by checking appropriate checkboxes in the
Connections page.
7. Click Finish.
The wizard creates a simulator project for the HCS08 architecture according to your
specifications. You can access the project from the CodeWarrior Projects view in the
Workbench window.
8. Build the new project. For more information, refer to the topic Building Projects.
9. Debug the new project. For more information, refer to the topic Debugging Projects.
P&E Full Chip Simulation
This topic explains Chip View, which is a time-saving FCS feature, and also describes the
settings of the connections that interface the CodeWarrior debugger with the RS08
simulator.
Chip View
Chip View is an innovative feature designed to simplify Full Chip Simulation (FCS) and
In-Circuit Debugging (ICD) sessions. The Chip View provides instantaneous access to
internal modules of the chip and lets you instantly change any of the features by clicking
them. Each pin features the current pin direction, input/output value, and the name of the
signal that reflects the current module that controls it. These data features are updated
every 50ms throughout a running FCS or ICD session.
524
Microcontrollers V10.x Targeting Manual
DRAFT
Connections — RS08
P&E Full Chip Simulation
Figure 7.1 Chip View
To open Chip View, perform these steps.
1. From the IDE menu bar, select PEMicro > Device Package > Device Package:<
Pin>, where < Pin> is the pin package you would like to work with. (See Figure 7.2).
The Device Package can be changed before or after the Chip View window is invoked
within the CodeWarrior IDE.
Figure 7.2 Device Package Extended Menu
2. From the IDE menu bar, select Window > Show View > Others (Figure 7.3).
Microcontrollers V10.x Targeting Manual
525
DRAFT
Connections — RS08
P&E Full Chip Simulation
Figure 7.3 Show View Extended Menu
The Show View dialog box appears.
3. Expand Other and select Chip View (Figure 7.4).
Figure 7.4 Show View Menu
526
Microcontrollers V10.x Targeting Manual
DRAFT
Connections — RS08
P&E Full Chip Simulation
4. To change direction and values of the pin, double-click on the corresponding arrow or
the number value. Details are listed below.
NOTE
If you close the Chip View window during debug session, you will not be able
to access to the Chip View.You must reopen the Chip View window and
restart the current debugging session to open the Chip View window again.
Closing Chip View should slightly improve performance during existing
debug session.
Chip GUI - Ports Module Support
You have the option of changing the pin’s direction and values by double-clicking on
the corresponding arrow or number value. Figure 7.5 is an example of what the Chip
View may look like before any changes are made. When the pin direction is input, the
pin will display the current pin input value. When the pin direction is output, you have
the option of double-clicking the number value to control the output value for the pin.
Figure 7.6 is an example of the PTA2 pin value being changed from 0 to 1 by doubleclicking on the number value.
Figure 7.5 Chip View Display Before Change
Microcontrollers V10.x Targeting Manual
527
DRAFT
Connections — RS08
P&E Full Chip Simulation
Figure 7.6 Chip View Display After Change
When you double-click a pin’s value or direction, a pin configuration dialog appears
beneath the Chip View diagram (Figure 7.7). In the pin configuration options, you have
the option of changing analog and digital I/O settings for a given pin. You can select a pin
from the pin-number drop-down box, select between analog and digital signals, and switch
pin directions. For the digital I/O signal, you can switch between high or low signals
(Figure 7.7).
Figure 7.7 Chip View with Digital Pin Configuration Options
For the Analog input signal, you can use the slider to change the analog signal value
(Figure 7.8).
528
Microcontrollers V10.x Targeting Manual
DRAFT
Connections — RS08
P&E Full Chip Simulation
Figure 7.8 Chip View with Analog Pin Configuration Options
Chip GUI - Analog to Digital Module Support
The Analog to Digital (ATD) Module has a higher priority than the General Pin I/O
module. Therefore, if you have an ATD channel enabled and the ATD input buffer is
empty, current input value on a pin will be converted and displayed in the ATD data
conversion register (Figure 7.9).
Figure 7.9 Chip View with ATD
Microcontrollers V10.x Targeting Manual
529
DRAFT
Connections — RS08
P&E Full Chip Simulation
Module Options
The PEMicro menu (Figure 7.10) includes the Full Chip Simulation options for the
modules that have specialty commands associated with them for a chosen device.
Figure 7.10 PEMicro Menu
The options available are:
• ADC Module
• Internal Clock Source Module
• Inter-Integrated Circuit Module Option
• Keyboard Interrupt Module
• Liquid Crystal Display Driver Module Option
• Modulo Timer Interrupt Module
• Input/Output (I/O) Ports Module
• Serial Communications Interface Module
• Serial Peripheral Interface Module
• Timer Interface Module
ADC Module
In Full Chip Simulation (FCS) mode, this module simulates all functionality of the Analog
to Digital Conversion (ADC) module including data input on all ADC channels, flag
polling, interrupt operation, and the bus and CGMXCLK reference clock sources. FCS
mode uses the buffered input structure to simulate the ADC inputs. You can queue up to
256 data values. To queue the ADC Input Data, use the ADDI command in the command
prompt. If the data parameter is given, the value is placed into the next slot in the input
buffer. Otherwise, if no parameter is provided, a window is displayed with the input buffer
values. Input values can be entered while the window is open. An arrow points to the next
value to be used as input to the ADC. The conversion takes place after a proper value is
written to the ADC Status and Control register. Once the conversion occurs, the arrow
moves to the next value in the ADC Buffer.
530
Microcontrollers V10.x Targeting Manual
DRAFT
Connections — RS08
P&E Full Chip Simulation
Figure 7.11 ADC IN Buffer Display
The ADCLR command can be used at any point to flush the input buffer for the ADC
simulation.
After the conversion is complete, the first queued value is passed from the data buffer into
the ADC data register. It can be observed in the Memory window by displaying the
memory location corresponding to the ADC data register.
Figure 7.12 Memory Component Window
When the conversion is complete, FCS sets the appropriate flag. If interrupts are enabled,
the Program Counter changes flow to the interrupt routine (as defined in the vector space
of the MCU).
NOTE
For more information on ADC configuration, refer to the Freescale user
manual for your microprocessor.
ADC Module Commands
The following commands are available for the RS08/HCS08 ADC Module.
ADDI Command
Microcontrollers V10.x Targeting Manual
531
DRAFT
Connections — RS08
P&E Full Chip Simulation
The ADDI command lets you input the data into the ADC converter. If a data parameter is
given, the value is placed into the next slot in the input buffer. Otherwise, if no parameter
is given, a window is displayed with the input buffer values. Input values can be entered
while the window is open. An arrow points to the next value to be used by the ADC. The
maximum number of input values is 256 bytes.
Syntax
>gdi ADDI [<n>]
Where:
<n> The value to be entered into the next location in the input buffer.
Example
>gdi ADDI $55
Set the next input value to the ADDI to $55
>gdi ADDI
Pull up the data window with all the input values.
ADCLR Command
Use the ADCLR command to flush the input buffer for ADC simulation. This resets the
input data buffer and clears out all values. Notice that if the ADC is currently using a
value, this command does not prevent the ADC from using it. See ADDI command for
information on how to access the input buffer of the ADC interface.
Syntax
>gdi ADCLR
Example
>gdi ADCLR
Clear the input buffer for ADC simulation.
Internal Clock Source Module
In Full Chip Simulation (FCS) mode, this module simulates all functionality of the
Internal Clock Source (ICS) Module, including:
• Phase Locked Loop (PLL) generation
• Automatic lock detection
• Interrupt
• Acquisition
532
Microcontrollers V10.x Targeting Manual
DRAFT
Connections — RS08
P&E Full Chip Simulation
• Tracking
• Flag polling
FCS mode uses a simulated External Oscillator Frequency change command (XTAL) lets
you input the desired XTAL value. To check the current value of the External Oscillator,
Bus Frequency and ICSCLK Frequency, open the RS08FCS menu and select Clocks
Module > Show MCU Clocks.
Figure 7.13 Clocks Module Extended Menu
Once you select the MCU Clocks menu, the Cycles window displays all of the
aforementioned Clock Frequencies, or you can select the Show Cycle Counter option
within the FCS menu to get the same window.
Figure 7.14 Frequency Display
Within the FCS menu, you can select the Run till Cycle option, which lets you begin code
execution and stop execution when the specified cycle count is reached. Note that the
parameter given is not the number of cycles that executed, but rather the total cycle-count
of the simulator (displayed in the Register Window).
Microcontrollers V10.x Targeting Manual
533
DRAFT
Connections — RS08
P&E Full Chip Simulation
Figure 7.15 Run till Cycle command
This command is extremely useful for verifying specific timings of a given event, running
until a given event is complete, or just before it completes to enable stepping through the
event or any application where cycle-timed execution is desired.
Figure 7.16 Run till Cycle Dialog Box
You can also select the Clear Cycle Counter option within the FCS menu, which clears the
cycle counter. If you select the Show Cycle Counter option within the FCS menu, you can
check to make sure that the cycle counter is zero.
Figure 7.17 Cycle Counter Dialog Box with Cleared Counter
Once the ICG is properly configured, you can monitor the status of the PLL by polling the
corresponding flag. If PLL interrupt is enabled, FCS jumps to an appropriate subroutine,
as long as the interrupt vector is properly defined. To observe the flag going up as a result
of the corresponding CPU event, situate your Memory window on the memory location of
the ICG Status and Control register.
534
Microcontrollers V10.x Targeting Manual
DRAFT
Connections — RS08
P&E Full Chip Simulation
Figure 7.18 Memory Window
For more information on how to properly configure Clock Generation, refer to the
Freescale reference manual for your microprocessor.
Internal Clock Source Commands
The following commands are available for the RS08 Internal Clock Source Module.
XTAL Command
Use the XTAL command to change the value of the simulated external oscillator. This in
turn affects the input to the PLL/DCO, and therefore the bus frequency. The P&E
simulator is a cycle-based simulator, so changing the XTAL value does not affect the
speed of simulation. It does, however, affect the ratio in which peripherals receive cycles.
Certain peripherals that run directly from the XTAL will run at different speeds than those
that run from the bus clock.
Syntax
>gdi XTAL <n>
Where:
• <n>, by default, is a hexadecimal number, representing the simulated frequency of an
external oscillator. Adding the suffix ‘t’ to the ’n’ parameter forces the input value to
be interpreted as base 10.
Example
>gdi XTAL
Brings up an input window. The default base for this input value is 10. However, this
value can be forced to a hexadecimal format through use of the suffix ’h’.
Inter-Integrated Circuit Module Option
In Full Chip Simulation (FCS) mode, this module simulates all functionality of the InterIntegrated Circuit (IIC) module including:
Microcontrollers V10.x Targeting Manual
535
DRAFT
Connections — RS08
P&E Full Chip Simulation
• Flag polling
• Interrupt enabled mode
• Transmission and reception of external data
• Master and slave modes of operation
• START and STOP signal generation detection
• Acknowledge bit generation detection
FCS mode uses the buffered input/output structure to simulate IIC inputs. You can queue
up to 256 data bytes into the input buffer. The output buffer of the USB module can also
hold 256 output bytes. To queue the IIC Input Packets, use the IICDI <...> command in the
command prompt. For a more detailed description of the command, refer to the IIC
Commands section. If the IIC packet parameters are properly defined, the packet is placed
into the next slot in the input buffer. Otherwise, if no parameters are provided, an IIC
Input Buffer window is displayed.
You can enter different IIC packet parameters while the window is open, including
START, STOP, ACK, NACK and data bytes. An arrow points to the next byte to be used
as input to the IIC. The data from the IIC input buffer is written to the IIC module registers
once the IIC module is turned on and properly configured for receiving data from an
external IIC device. Once simulation of the data transmission is over, the arrow moves to
the next value in the IIC Input Buffer.
Figure 7.19 IIC Input Buffer Display
The IIC data input/output log buffer simulation lets you gain access to the past 256 IIC
data bytes that have been shifted in and out of the module. To bring up the IIC IN/OUT
LOG buffer dialog box, use the IICDO command.
536
Microcontrollers V10.x Targeting Manual
DRAFT
Connections — RS08
P&E Full Chip Simulation
Figure 7.20 IIC IN/OUT LOG Buffer Display
The IICCLR command may be used at any point to flush the input as well as input/output
log IIC buffers. After the IIC simulated input is received, the first queued-in data byte is
passed from the data buffer into the corresponding IIC module registers. It can be
observed in the Memory window by displaying the appropriate register location there.
Figure 7.21 Memory Component Window
You can also observe different IIC flags in the Memory window. If you run the module in
Flag Polling mode, poll the flag corresponding to the expected IIC event. If the IIC
interrupts are enabled, FCS jumps to an appropriate subroutine as long as the IIC interrupt
vectors are properly defined.
NOTE
For more information on how to configure IIC module for desired operation,
refer to the Freescale user manual for your microprocessor.
Inter-Integrated Circuit Module Commands
The following commands are available for the RS08 Inter-Integrated Circuit (IIC) module.
Command function is identical even though the module names differ.
IICDI Command
Microcontrollers V10.x Targeting Manual
537
DRAFT
Connections — RS08
P&E Full Chip Simulation
The IICDI command lets you input data into a buffer of data to shift into the IIC module
when it receives data from an external device. If a data parameter is given, the value is
placed into the next slot in the input buffer. Otherwise, if no parameter is given, a window
is displayed with the input buffer values. Input values can be entered while the window is
open. The maximum number of input values is 256. This command is useful for either
inputting response data from a slave target or for inputting data packets from an external
master. Note that when the microprocessor attempts to read an acknowledge from an
external device, and the next value in the buffer is neither ACK nor NACK, the
microprocessor automatically receives an ACK signal (i.e. assumes ACK unless NACK is
specified).
Syntax
>gdi IICDI [<n>][START][STOP][ACK][NACK]
Where:
• <n> indicates the value to be entered into the next location in the input buffer
• START indicates the incoming START signal
• STOP indicates the incoming STOP signal
• ACK corresponds to ACK signal
• NACK corresponds to NACK signal
NOTE
For a detailed description of the IIC protocol and a proper way to configure the
IIC module, refer to the Freescale user manual for your microprocessor.
Example
>gdi IICDI
Pulls up the data window with all the input values
>gdi IICDI 22 33
This is an example of data being returned from a slave device. Once the MCU transmits a
start signal and the target address, it receives an ACK from the slave device. An ACK is
implied unless a NACK is specified via the IICDI command. The next two data bytes read
are 22 and 23. If the microprocessor attempts to read another byte, it gets an $FF value
followed by a NACK signal (NACK because nothing remains in the input buffer). The
receiving device then generates a STOP signal. A more exact input from a device designed
to return two bytes is:
>gdi IICDI ACK 22 ACK 23 NACK
IIC in master mode transmits to a slave:
538
Microcontrollers V10.x Targeting Manual
DRAFT
Connections — RS08
P&E Full Chip Simulation
• If the slave device acknowledges all output bytes of the transmitting device, there is no
need to specify an input packet. If the master device is going to transmit an address and
two bytes, the following packet is equivalent to no packet:
>gdi IICDI ACK ACK ACK
• If, however, the slave receiver is designed to generate a NACK signal after the second
received data byte, the proper response packet is:
>gdi IICDI ACK ACK NACK
• The address result being the first ACK, the first data result being the second ACK, and
the second data byte being the NACK.
IIC in MASTER mode is not acknowledged by any Slave:
>gdi IICDI NACK
• If the NACK signal is entered before the master device transmits a START signal, then
the master device gets a NACK when it tries to read an acknowledge after the address is
output. The master device then generates a STOP signal and releases the BUS.
IIC in SLAVE mode receives a Write from an external Master:
This example is for an external master that is writing to the microprocessor configured to
simulate the slave mode operation. The packet contains both START and STOP signals
which puts the simulated device into the slave mode.
>gdi IICDI START 55 AA 22 STOP
This input adds five values to the input queue, which is a packet from an external master,
including the following procedure values:
• A start signal comes in
• The address $55 comes in, specifying a write (slave receive). The Address Register in the
current simulated device has been previously set to $55
• The data byte $AA comes in
• The data byte $22 comes in
• A STOP signal comes in
IICDO Command
The IICDO command displays a window, which shows data shifted in as well as shifted
out of the IIC peripheral. An arrow points to the last output value transmitted/received.
The maximum number of output values that the buffer can hold is 256.
Syntax
>gdi IICDO
Example
Microcontrollers V10.x Targeting Manual
539
DRAFT
Connections — RS08
P&E Full Chip Simulation
>gdi IICDO
View data from the input/output log buffer for IIC simulation.
IICCLR Command
Use the IICCLR command to flush the input and output buffers for IIC simulation. This
resets the buffers and clears all values. Notice that if the IIC is currently shifting a value,
this command does not prevent the IIC from finishing the transfer.
Syntax
>gdi IICCLR
Example
>gdi IICCLR
Clear input and output buffers for IIC simulation.
Keyboard Interrupt Module
In Full Chip Simulation (FCS) mode, this module simulates all functionality of the
Keyboard Interrupt (KBI) module, including the edge-only, edge and level interrupt, and
flag polling modes of operation. FCS mode uses simulated port inputs to trigger the KBI
event from the proper I/O port pin.
To define an input state of the specific port, enter the INPUT<x> <n> command in the
Command window. The <x> represents the corresponding I/O port, while <n> stands for
the input value to write to this port. At the same time, you can use the INPUTS command
to bring up the Simulated Port Inputs for all general I/O ports. It displays the current
simulated values to all applicable input ports. See the documentation for Timer Module
Commands for more information about the various forms of this command.
Figure 7.22 Simulated Port Inputs Dialog Box
Use the Simulated Port Inputs dialog box to reconfigure the input value to any I/O port. To
trigger the event, manipulate the inputs to the port in the appropriate manner, depending
on whether the KBI is configured for edge-only or edge and level. Once the KBI event
540
Microcontrollers V10.x Targeting Manual
DRAFT
Connections — RS08
P&E Full Chip Simulation
takes place, you can observe the KEYF Flag bit, which is a part of the Keyboard Status
and Control register, in the Memory window.
Figure 7.23 Memory Component Window
You can poll the KBI Interrupt Pending flag if the Polling Mode is simulated. In Interrupt
Mode, the simulator branches to an appropriate interrupt subroutine as long as the KBI
interrupt vector is properly configured.
NOTE
For more information on KBI configuration, refer to the Freescale user manual
for your microprocessor.
Keyboard Interrupt Commands
Use the following commands for Keyboard interrupt manipulation.
INPUT<x> Command
The INPUT<x> command sets the simulated inputs to port <x>. The CPU reads this input
value when port <x> is set as an input port.
Syntax
>gdi INPUT<x> <n>
Where:
<x> is the letter representing corresponding port
<n> is an eight-bit simulated value for port <x>
Example
>gdi INPUTA AA
Simulate the input AA on port A.
INPUTS Command
Microcontrollers V10.x Targeting Manual
541
DRAFT
Connections — RS08
P&E Full Chip Simulation
In FCS and CPU-Only Simulation mode, the INPUTS command opens the Simulated Port
Inputs dialog box shown in Figure 7.24. You may then use this box to specify the input
states of port pins and IRQ.
Figure 7.24 Simulated Port Inputs Dialog Box
When using In-Circuit Simulation mode, the INPUTS command shows the simulated
input values to any applicable port.
Syntax
>gdi INPUTS
Example
>gdi INPUTS
Show I/O port input values.
Liquid Crystal Display Driver Module Option
In Full Chip Simulation (FCS) Mode, this option lets you simulate all the functionality of
the Liquid Crystal Display (LCD) module, including programmable LCD frame
frequency, front plane pin configuration, back plane pin configuration, programmable
blink frequency, and LCD interrupt flag generation. By default LCD front and back plane
pins are mapped to match device use on the corresponding Freescale DEMO9RS08xx
device board. These settings can be changed by you through modification of the
LCDRS08V<x>_<DEVICE>.INI file, where <x> indicates the version number. This file
is located in the “<CW_Install>\prog\P&E” folder.
Modulo Timer Interrupt Module
In Full Chip Simulation (FCS) mode, this module simulates all functionality of the
Modulo Timer Interrupt (MTIM) Module, including:
• Programmable MTIM clock input
• Free running or modulo up count operation
• Flag polling
542
Microcontrollers V10.x Targeting Manual
DRAFT
Connections — RS08
P&E Full Chip Simulation
• Interrupt enabled mode of operation
Once the MTIM Status and Control register properly configures the operation of the
module, the MTIM Counter starts incrementing. If modulo up count operation is enabled,
you can observe the MTIM overflow flag in the MTIM Status and Control register in the
Memory window.
Figure 7.25 Memory Component Window
If the MTIM interrupt is enabled, the FCS jumps to an appropriate subroutine as long as
the MTIM interrupt vector is properly defined.
Modify MTIM TCLK
Figure 7.26 shows the TCLK frequency dialog box.
Figure 7.26 TCLK Frequency Dialog Box
This dialog box lets you set the frequency of the TCLK signal for the MTIM peripheral. In
order for this value to have any effect, the TCLK must be selected as the clock source for
the MTIM.
Input/Output (I/O) Ports Module
In Full Chip Simulation (FCS) mode, this module simulates all input and output
functionality of the Input/Output (I/O) Ports module. FCS mode uses a set of designated
commands to simulate the input and output activity on corresponding I/O port pins. To
define an input state of the specific port, write the INPUT <x> <n> command in the
Command window. The <x> represents the corresponding I/O port, while the <n> stands
for the input value to write to this port. At the same time, you can use the INPUTS
command to bring up the Simulated Port Inputs for all general I/O ports. It displays the
current simulated values to all applicable input ports.
Microcontrollers V10.x Targeting Manual
543
DRAFT
Connections — RS08
P&E Full Chip Simulation
NOTE
See Input/Output Ports User Commands and IRQ Commands for more
information about the various forms of this command.
Figure 7.27 Simulated Port Inputs Dialog Box
Use the Simulated Port Inputs dialog box to reconfigure the input value to any I/O port.
Use the INPUTS command to reconfigure the output values on any relevant I/O port. You
can observe the manipulation of I/O port pins in the Memory window.
Figure 7.28 Memory Component Window
Note that if the regular I/O pins are multiplexed to be used by a different MCU Module,
they might not be available for general I/O functionality.
NOTE
For more information on how to properly configure I/O pins, refer to the
Freescale user manual for your microprocessor.
Input/Output Ports User Commands
Use the following commands for general I/O ports manipulation.
INPUT<x> Command
The INPUT<x> command sets the simulated inputs to port <x>. The CPU reads this input
value when port <x> is set as an input port.
Syntax
>gdi INPUT<x> <n>
544
Microcontrollers V10.x Targeting Manual
DRAFT
Connections — RS08
P&E Full Chip Simulation
Where:
<x> is the letter representing corresponding port
<n> Eight-bit simulated value for port <x>
Example
>gdi INPUTA AA
Simulate the input AA on port A.
INPUTS Command
In FCS and CPU-Only Simulation modes, the INPUTS command opens the Simulated
Port Inputs dialog box shown in Figure 7.29. You may then use this box to specify the
input states of port pins and IRQ.
Figure 7.29 Simulated Port Inputs Dialog Box
When using In-Circuit Simulation mode, the INPUTS command shows the simulated
input values to any applicable port.
Syntax
>gdi INPUTS
Example
>gdi INPUTS
Show I/O port input values.
Serial Communications Interface Module
In Full Chip Simulation (FCS) mode, this module simulates all functionality of the Serial
Peripheral Interface (SPI) module including:
• Flag polling
• Interrupt enabled mode
• 8- or 9-bit length data codes
Microcontrollers V10.x Targeting Manual
545
DRAFT
Connections — RS08
P&E Full Chip Simulation
• Odd and even parity modes
• Transmission and reception of external data
FCS mode uses the buffered input/output structure to simulate SCI inputs. You can queue
up to 256 data values into the input buffer. The output buffer of the SCI module can also
hold 256 output values. To queue the SCI Input Data, use the SCDI <n> command in the
command prompt. If <n> (the data parameter) is given, the value is placed into the next
slot in the input buffer.
Otherwise, if no parameter is provided, a window is displayed with the input buffer
values. You can enter input values while the window is open. An arrow points to the next
value to be used as input to the SCI. The data from the SCI input buffer is written to the
SCI data register once the SCI module has been turned on and is properly configured for
receiving data from an external serial device. Once the simulation of the data transmission
is over, the arrow moves to the next value in the SCI IN Buffer.
Figure 7.30 SCI IN Buffer Display
SCI Data Output Buffer simulation lets you gain access to the past 256 SCI data values
transmitted out of the module. To bring up the SCI OUT buffer dialog box, use the SCDO
command.
546
Microcontrollers V10.x Targeting Manual
DRAFT
Connections — RS08
P&E Full Chip Simulation
Figure 7.31 SCI OUT Buffer Display
At any point, the SCCLR command may be used to flush the input and output SCI buffers.
After the SCI simulated input is received, the first queued value is passed from the data
buffer into the SCI data register. It can be observed in the memory window by displaying
the memory location corresponding to the SCI data register.
Figure 7.32 Memory Component Window
You can also observe different SCI flags in the Memory window. If the module is run in
Flag Polling mode, poll the flag corresponding to the expected SCI event. If the SCI
interrupts are enabled, the FCS jumps to an appropriate subroutine as long as the SCI
interrupt vectors are properly defined.
NOTE
For more information on how to configure the SCI module for desired
operation, refer to the Freescale user manual for your microprocessor.
SCI Commands
Use the following commands for serial communication interface manipulation.
SCCLR Command
Use the SCCLR command to flush the input and output buffers for SCI simulation. This
resets the buffers and clears out all values. Note that if the SCI is in the process of shifting
Microcontrollers V10.x Targeting Manual
547
DRAFT
Connections — RS08
P&E Full Chip Simulation
a value, this command allows the SCI to finish the transfer. See the SCDI and SCDO
commands for accessing the input and output buffers of the SCI interface.
Syntax
>gdi SCCLR
Example
>gdi SCCLR
Clear input and output buffer for SCI simulation
SCDI Command
The SCDI command lets you input data into the SCI. If a data parameter is given, the
value is placed into the next slot in the SCI input buffer. If no parameter is given, a
window displays the input buffer values. Input values can be entered while the window is
open. An arrow points to the next value to be used as input to the SCI. The maximum
number of input values is 256 bytes.
Syntax
>gdi SCDI [<n>]
Where:
<n> The value to be entered into the next location in the input buffer
Example
>gdi SCDI $55
Set the next input value to the SCI to $55
>gdi SCDI
Pull up the data window with all the input values.
548
Microcontrollers V10.x Targeting Manual
DRAFT
Connections — RS08
P&E Full Chip Simulation
Figure 7.33 SCI IN buffer display
SCDO Command
The SCDO command displays the output buffer from the SCI. A window is opened that
shows all the data that the SCI has shifted out. An arrow points to the last output value
transmitted. The maximum number of output values that the buffer holds is 256 bytes.
Syntax
>gdi SCDO
Example
>gdi SCDO
View data from the output buffer for the SCI simulation.
Figure 7.34 SCI OUT Buffer Display
Microcontrollers V10.x Targeting Manual
549
DRAFT
Connections — RS08
P&E Full Chip Simulation
Serial Peripheral Interface Module
In Full Chip Simulation (FCS) mode, this module simulates all functionality of the Serial
Peripheral Interface (SPI) module including:
• Flag polling
• Interrupt enabled mode
• Master and slave modes
• Slave input clock
• Transmission and reception of external data
FCS mode uses the buffered input/output structure to simulate SPI inputs. You can queue
up to 256 data values into the input buffer. The output buffer of the SPI module can also
hold 256 output values. To queue the SPI Input Data, use the SPDI <n> command at the
command prompt. If <n> (the data parameter) is given, the value is placed into the next
slot in the input buffer.
Otherwise a window is displayed with the input buffer values. You can enter input values
while the window is open. An arrow points to the next input value to the SPI. The data
from the SPI input buffer is written to the SPI data register once the SPI module is turned
on and is properly configured for receiving data from an external serial device. Once the
simulation of the data transmission is over, the arrow moves to the next value in the SPI
IN Buffer.
Figure 7.35 SPI IN Buffer Display
SPI data output buffer simulation lets you gain access to the past 256 SPI data values
transmitted out of the module. To bring up the SPI OUT buffer dialog box, use the SPDO
command.
550
Microcontrollers V10.x Targeting Manual
DRAFT
Connections — RS08
P&E Full Chip Simulation
Figure 7.36 SPI OUT Buffer Display
The SPCLR command may be used at any point to flush the input and output SPI buffers.
After the SPI simulated input is received, the first queued value is passed from the data
buffer into the SPI data register. It can be observed in the Memory window by displaying
the memory location corresponding to the SPI data register.
Figure 7.37 Memory Component Window
You can also observe different SPI flags in the Memory window. If the module is run in
Flag Polling mode, poll the flag corresponding to the expected SPI event. If the SPI
interrupts are enabled, the FCS jumps to an appropriate subroutine as long as the SPI
channel interrupt vectors are properly defined.
To simulate the frequency of the SPI slave input clock, use the SPFREQ <n> command. If
the SPI is configured for slave mode, this command lets you enter the number of cycles
<n> in the period of the input clock. If the SPFREQ command is not used, then clocking is
set by the SPI control register.
NOTE
For more information on how to configure the SPI module for desired
operation, refer to the Freescale user manual for your microprocessor.
SPI Commands
The following serial peripheral interface commands are available for the RS08.
Microcontrollers V10.x Targeting Manual
551
DRAFT
Connections — RS08
P&E Full Chip Simulation
SPCLR Command
Use the SPCLR command to flush the input and output buffers for SPI simulation. This
resets the buffers and clears out all values. Notice that if the SPI is currently shifting a
value, this command allows the SPI to finish the transfer. See the SPDI and SPDO
commands for accessing the input and output buffers of the SPI interface.
Syntax
>gdi SPCLR
Example
>gdi SPCLR
Clear input and output buffer for SPI simulation
SPDI Command
The SPDI command lets you input data into the SPI. If a data parameter is given, the value
is placed into the next slot in the SPI input buffer. If no parameter is given, a window
displays the input buffer values. You can enter input values while the window is open. An
arrow points to the next input value to the SPI. The maximum number of input values is
256 bytes.
Syntax
>gdi SPDI [<n>]
Where:
<n> The value to be entered into the next location in the input buffer
Example
>gdi SPDI $55
Set the next input value to the SPI to $55
>gdi SPDI
Pull up the data window with all the input values.
552
Microcontrollers V10.x Targeting Manual
DRAFT
Connections — RS08
P&E Full Chip Simulation
Figure 7.38 SPI IN Buffer Display
SPDO Command
The SPDO command displays the output buffer from the SPI. A window opens that shows
all the data that the SPI has shifted out. An arrow points to the last output value
transmitted. The maximum number of output values that the buffer holds is 256 bytes.
Syntax
>gdi SPDO
Example
>gdi SPDO
View data from the output buffer for the SPI simulation.
Figure 7.39 SPI OUT Buffer Display
SPFREQ Command
Microcontrollers V10.x Targeting Manual
553
DRAFT
Connections — RS08
P&E Full Chip Simulation
The SPFREQ command lets you set the frequency of the SPI slave input clock. If the SPI
is configured for the slave mode, this command lets you enter the number of cycles <n>
per one input clock period. If no value is given, a window appears and you are prompted
for a value. If this command is not used, then the clocking is assumed to be set by the SPI
control register.
Syntax
>gdi SPFREQ [<n>]
Where:
<n> The number of cycles for the period of the input clock.
Example
>gdi SPFREQ 8
Set the period of the input slave clock to 8 cycles (total shift = 8*8 cycles per bit =
64 cycles)
Timer Interface Module
In Full Chip Simulation (FCS) mode, this module simulates all functionality of the Timer
Interface module, including:
• Input capture/output compare
• Pulse width modulation
• Internal or external clock input
• Free running or modulo up count operation
• Flag polling
• Interrupt enabled mode of operation
FCS mode uses the simulated port inputs to trigger the input capture on a given timer
channel. To define an input state of the specific port, use the INPUT<x> <n> command in
the Command window. The <x> represents the corresponding I/O port, while <n> stands
for the input value to write to this port. At the same time, you can use the INPUTS
command to display the Simulated Port Inputs for all general I/O ports. It displays the
current simulated values to all applicable input ports. See the documentation for Timer
Module Commands for more information about the various forms of this command.
554
Microcontrollers V10.x Targeting Manual
DRAFT
Connections — RS08
P&E Full Chip Simulation
Figure 7.40 Simulated Port Inputs Dialog Box
Use the Simulated Port Inputs dialog box to reconfigure the input value to any I/O port. To
trigger the event, first set the port inputs high or low and then invert them to an opposite
value, depending on whether the input capture is set for rising/falling edge. Once the Input
Capture event takes place, you can observe the CHxF in the Channel Status and Control
register in the Memory window.
Figure 7.41 Memory Component Window
If the Timer module is configured for an Output Compare event, then once the event takes
place you can observe the same CHxF Flag via the Memory window. If the timer channel
interrupt is enabled, the FCS jumps to an appropriate subroutine as long as the Timer
channel interrupt vector is properly defined. To observe the Timer Overflow Flag (TOF)
flag being set as a result of the corresponding CPU event, situate your Memory window on
the memory location of the Timer Status and Control register.
To observe the Pulse Width Modulation (PWM) operation, properly configure the Timer
to operate in the Modulo up count mode, then select the toggle-on-overflow or clear/set
output on compare events to create the desired duty cycle wave. Once a PWM event takes
place, you can observe pin toggle/clear/set behavior corresponding to the Timer
configuration in the Memory window that is displaying the I/O port associated with a
given timer channel.
To observe the accuracy of the Timer module operation, you can observe the number of
CPU cycles that it takes for the event to occur. The cycle counter is only incremented as
you step through the code. To determine the exact amount of cycles over which the event
occurs, one can either observe the cycle display in the Register window or use the built in
simulation commands. To display the current number of cycles in the Command window,
use the CYCLES command. To change the number of cycles in the cycle counter, use
Microcontrollers V10.x Targeting Manual
555
DRAFT
Connections — RS08
P&E Full Chip Simulation
CYCLES <n>, where <n> is the new cycle value. If the event has a pre-calculated number
of cycles, use CYCLE 00 to reset the number of cycles and GOTOCYCLE <n> to run
through the code until you reach the expected event.
Figure 7.42 Register Window With Cycles Display
Timer Module Commands
The following timer module commands are available for use with the HC08/HCS08
processors.
CYCLES Command
The CYCLES command changes the value of the cycles counter. The cycles counter
counts the number of the processor cycles that have passed during execution. The Cycles
Window shows the cycle counter. The cycle count can be useful for timing procedures.
Syntax
>gdi CYCLES <n>
Where:
<n> Integer value for the cycles counter
Examples
>gdi CYCLES 0
Reset cycles counter
>gdi CYCLES 1000
Set cycle counter to 1000.
GOTOCYCLE Command
The GOTOCYCLE command executes the program in the simulator beginning at the
address in the program counter (PC). Execution continues until the cycle counter is equal
to or greater than the specified value, until a key or the Stop button on the toolbar is
pressed, until it reaches a break point, or until an error occurs.
556
Microcontrollers V10.x Targeting Manual
DRAFT
Connections — RS08
P&E Full Chip Simulation
Syntax
>gdi GOTOCYCLE <n>
Where:
<n> Cycle-counter value at which the execution stops
Example
>gdi GOTOCYCLE 100
Execute the program until the cycle counter equals 100.
INPUT<x> Command
The INPUT<x> command sets the simulated inputs to port <x>. The CPU reads this input
value when port <x> is set as an input port.
Syntax
>gdi INPUT<x> <n>
Where:
<x> is the letter representing corresponding port
<n> Eight-bit simulated value for port <x>
Example
>gdi INPUTA AA
Simulate the input AA on port A.
INPUTS Command
In FCS and CPU-Only Simulation modes, the INPUTS command opens the Simulated
Port Inputs dialog box shown in Figure 7.43. You may then use this box to specify the
input states of port pins and IRQ.
Figure 7.43 Simulated Port Inputs Dialog Box
Microcontrollers V10.x Targeting Manual
557
DRAFT
Connections — RS08
P&E RS08 Multilink\Cyclone Pro
When using In-Circuit Simulation mode, the INPUTS command shows the simulated
input values to any applicable port.
Syntax
>gdi INPUTS
Example
>gdi INPUTS
Show I/O port input values.
P&E RS08 Multilink\Cyclone Pro
This section describes the RS08 P&E Multilink/Cyclone Pro Connection options, and also
Chip View, which is a time-saving ICD feature that makes the debugging process much
easier. The RS08 P&E Multilink/Cyclone Pro Connection setting permits a connection to
RS08 Freescale devices via P&E Multilink/Cyclone Pro hardware interfaces. This
connection mode lets you debug code, as the firmware is fully resident in the Flash or
RAM of the microprocessor.
Chip View
Chip View is an innovative feature designed to simplify Full Chip Simulation (FCS) and
In-Circuit Debugging (ICD) sessions. The Chip View provides instantaneous access to
internal modules of the chip and lets you instantly change any of the features by clicking
them. Each pin features the current pin direction, input/output value, and the name of the
signal that reflects the current module that controls it. These data features are updated
every 50ms throughout a running FCS or ICD session.
558
Microcontrollers V10.x Targeting Manual
DRAFT
Connections — RS08
P&E RS08 Multilink\Cyclone Pro
Figure 7.44 Chip View
To open Chip View, perform these steps.
1. From the IDE menu bar, select PEMicro > Device Package > Device Package:<
Pin>, where < Pin> is the pin package you would like to work with. (See Figure 7.45).
The Device Package can be changed before or after the Chip View window is invoked
within the CodeWarrior IDE.
Figure 7.45 Device Package Extended Menu
2. From the IDE menu bar, select Window > Show View > Others (Figure 7.46).
Microcontrollers V10.x Targeting Manual
559
DRAFT
Connections — RS08
P&E RS08 Multilink\Cyclone Pro
Figure 7.46 Show View Extended Menu
The Show View dialog box appears.
3. Expand Other and select Chip View (Figure 7.47).
Figure 7.47 Show View Menu
560
Microcontrollers V10.x Targeting Manual
DRAFT
Connections — RS08
P&E RS08 Multilink\Cyclone Pro
4. To change direction and values of the pin, double-click on the corresponding arrow or
the number value. Details are listed below.
NOTE
If you close the Chip View Window during debug session, the Chip View will
not be accessible. You must reopen the Chip View window and restart the
current debugging session and to open the Chip View window again. Closing
Chip View should slightly improve the performance during existing debug
session.
Chip GUI - Ports Module Support
You have the option of changing the pin’s direction and values by double-clicking on
the corresponding arrow or number value. Figure 7.48 is an example of what the Chip
View may look like before any changes are made. When the pin direction is input, the
pin will display the current pin input value. When the pin direction is output, you have
the option to double-click the number value to control the output value for the pin.
Figure 7.49 is an example of the PTA2 pin value being changed from 0 to 1 by doubleclicking on the number value.
Figure 7.48 Chip View Display Before Change
Microcontrollers V10.x Targeting Manual
561
DRAFT
Connections — RS08
P&E RS08 Multilink\Cyclone Pro
Figure 7.49 Chip View Display After Change
When you double-click the pin’s value or the direction, a pin configuration dialog appears
underneath the Chip View diagram (Figure 7.50). In the pin configuration options, you
have the option of changing analog and digital I/O settings for a given pin. You can select
a pin from the pin-number drop-down box, select between analog and digital signals, and
switch pin directions. For the digital I/O signal, you can switch between high or low
signals (Figure 7.50).
Figure 7.50 Chip View with Digital Pin Configuration Options
562
Microcontrollers V10.x Targeting Manual
DRAFT
Connections — RS08
P&E RS08 Multilink\Cyclone Pro
Connection Options
This topic describes all P&E Multilink\Cyclone connection options, which are common to
all P&E USB BDM Multilink, P&E Cyclone Pro Serial, P&E Cyclone PRO USB, and
P&E Cyclone PRO TCP-IP connections.
The options include:
• Changing P&E Connection Settings
• Connection Assistant
• Launch Configuration Settings
• Active Mode Menu Options
• Advanced Programming/Debug Options
• View Register Files Option
• P&E RS08 Multilink\Cyclone Pro Connection-Specific Options
Changing P&E Connection Settings
All connection settings for P&E hardware interfaces are configured in the Launch
Configurations dialog box.
Microcontrollers V10.x Targeting Manual
563
DRAFT
Connections — RS08
P&E RS08 Multilink\Cyclone Pro
Figure 7.51 P&E RS08 BDM Launch Configuration Dialog Box
Table 7.1 describes the options for this view.
564
Microcontrollers V10.x Targeting Manual
DRAFT
Connections — RS08
P&E RS08 Multilink\Cyclone Pro
WARNING!
An improper voltage setting can damage the board.
Table 7.1 Connection Parameter Options for P&E RS08 Multilink/Cyclone Pro
Option
Description
Interface
Use this option to select the interface type.
Select a supported interface from the list
box. The options are:
• USBHCS08\HCS12\CFV1
Multilink - USB Port
• Cyclone PRO - Serial Port
• Cyclone PRO - USB Port
• Cyclone PRO - Ethernet Port
Port
This option selects the port over which
debug communications is conducted.
Select an available port from the list box.
Refresh
Click this button to have the workstation scan
for a valid interface and port. Valid interfaces
and ports appear in the Interface and
Port list boxes.
Socket Programming Options
The Socket Programming Options button
brings up a dialog that provides you with a
graphical representation of the signals that
must be connected from the BDM header to
the pins of the microprocessor, in order to
use Freescale socket adapters.
(Cyclone Pro only) Provide power to
target
This option determines whether the Cyclone
Pro (circuitry) provides power to the target
hardware via the probe.
Check this option to have the Cyclone Pro
(circuitry) supply power to the hardware
target
Uncheck this option to not provide power.
Microcontrollers V10.x Targeting Manual
565
DRAFT
Connections — RS08
P&E RS08 Multilink\Cyclone Pro
Table 7.1 Connection Parameter Options for P&E RS08 Multilink/Cyclone Pro
Option
Description
(Cyclone Pro only) Power off target
upon software exit
This option determines whether Cyclone Pro
hardware interface provides power to the
target hardware via VDD of the BDM cable.
Check this option to turn off the power when
the program terminates.
Uncheck this option to leave the hardware
target powered continuously.
(Cyclone Pro only) Regulator Output
Voltage
This option adjusts the output voltage that
powers the hardware target.
Select a voltage value from this option’s list
box.
(Cyclone Pro only) Power down delay
This option specifies amount of time for
which the target will be turned off during a
RESET power cycling sequence.
Enter the delay interval (in milliseconds) in
this option’s text box.
(Cyclone Pro only) Power up delay
This option specifies amount of time for
which the target will remain powered prior to
a RESET power cycling sequence.
Enter the delay interval (in milliseconds) in
this option’s text box.
Connection Assistant
The P&E Connection Assistant is displayed when you attempt to debug and the program
cannot connect to the interface hardware specified in the Launch Configuration Dialog. To
select the P&E Multilink/Cyclone Pro as your debugger connection:
1. Select the P&E device that you are using from the first drop-down menu and click
Refresh. See Figure 7.52.
2. Using the second drop-down menu, select the port on which the interface is connected.
3. Click the Retry button
566
Microcontrollers V10.x Targeting Manual
DRAFT
Connections — RS08
P&E RS08 Multilink\Cyclone Pro
Figure 7.52 RS08 Connection Assistant Interface Selected
Launch Configuration Settings
To set the launch configurations for the debugger:
1. Find the debugger icon and click on the drop-down arrow to bring up the debugger
menu. See Figure 7.53.
2. Select Debug Configurations
3. On the left column, select the project download type you would like to set the launch
configurations. See Figure 7.54
4. On the right column, click on the Debugger tab.
5. Set your configurations and click Debug to start the debugger.
Microcontrollers V10.x Targeting Manual
567
DRAFT
Connections — RS08
P&E RS08 Multilink\Cyclone Pro
Figure 7.53 Debugger Drop-down Menu
Figure 7.54 Debugger Configuration Settings Dialog
568
Microcontrollers V10.x Targeting Manual
DRAFT
Connections — RS08
P&E RS08 Multilink\Cyclone Pro
Active Mode Menu Options
When the microprocessor is connected, the active mode menu shows the name of the
microprocessor and gives you the access to the Advanced Programming/Debug Options.
When the microprocessor is not connected, the menu is not available.
Figure 7.55 Additional Connection Menu Options
Advanced Programming/Debug Options
The Advanced Programming/Debug Options menu option takes you to the Advanced
Options dialog box, where you can configure the software settings for the Flash
programming procedure.
Figure 7.56 Advanced Options Dialog Box
Microcontrollers V10.x Targeting Manual
569
DRAFT
Connections — RS08
P&E RS08 Multilink\Cyclone Pro
Prompt on Flash Program Checkbox
Setting the "Always Erase and Program flash without asking" checkbox in this dialog box
allows the software to transparently program the microprocessor every time the debugger
is started. Setting the “Enable Flash Programming Dialog" lets you view the steps taken by
the Flash Programmer.
Trim Options
The Calculate Trim and Program the Non-Volatile Trim Register checkbox enables
automatic calculation and programming of the trim value to a designated Non-Volatile
memory location.
Non-Volatile Memory Preservation
You have the option of preserving up to three independent ranges of non-volatile memory
(on devices with EEPROM, the entire EEPROM array may optionally be preserved as
well). Ranges that are designated as “preserved” are read before an erase and reprogrammed immediately afterwards, thereby preserving the data in these ranges. Any
attempts to program data into a preserved range is ignored. When entering an address into
the preserved range field (hexadecimal input is expected), the values are masked
according to the row size of the device. This ensures that the reprogramming of preserved
data does not cause any conditions that disturb programming.
Sync to PLL Change Checkbox
The debugger requires the Sync to PLL Change to synchronize the software/hardware
connection with the microprocessor during the Flash erasing/programming procedure.
Trim Control
The Use custom trim reference frequency option lets you select a custom trim value for the
target device (valid only for devices with an Internal Clock). You can input any value
within the valid internal clock frequency range; the allowable trim value is limited only by
the device itself.
570
NOTE
The valid internal clock frequency range and the default trim value for the
currently selected device/algorithm are displayed as well.
NOTE
For more information about the specific functionality of the internal clock
source, see the Freescale Data Sheet for your specific device.
Microcontrollers V10.x Targeting Manual
DRAFT
Connections — RS08
P&E RS08 Multilink\Cyclone Pro
Alternative Algorithm Functionality
Once you create a project for a specific HCS08/RS08 microprocessor, the debugger
specifies a default algorithm to use during all Flash programming operations. The
debugger uses this algorithm for nearly all programming requirements. The default
algorithm can be found in the <CW_Install>/prog/P&E directory.
However, the default algorithm may be overridden via the Alternative Algorithm function,
located in the Advanced Programming/Debug Options menu. You can use this feature to
select a custom programming algorithm, or simply select another one of P&E’s many
programming algorithms for use with a specific project.
CAUTION
Selecting the wrong programming algorithm may damage their device,
lead to under/over programming situations, or simply not program
portions of the project file. You are recommended to use the default
algorithm unless there is a compelling reason to do otherwise.
Use these steps to override the default algorithm:
1. Select the Advanced Programming/Debug Options selection from the PEMicro menu.
Figure 7.57 Advanced Programming/Debug Options Menu Selection
2. Check the Use Alternative Algorithm checkbox.
Microcontrollers V10.x Targeting Manual
571
DRAFT
Connections — RS08
P&E RS08 Multilink\Cyclone Pro
Figure 7.58 Advanced Options - Alternative Algorithm Checkbox
3. Click the Choose Alternative Algorithm button, which lets you browse for an
alternative algorithm.
4. Once you select the alternative algorithm, the name of the algorithm along with its full
path appears in the text field below the Choose Alternative Algorithm button.
At this point, the current project performs all future Flash programming operations using
the alternative algorithm. You may revert to the default algorithm at any time by clearing
the Use Alternative Algorithm checkbox.
View Register Files Option
The Register Files tab in the debugger gives you the option of viewing and editing the
register files. If register files are available for the device that you have chosen, the
Registers tab in the debugger (see Figure 7.59) is populated.
572
Microcontrollers V10.x Targeting Manual
DRAFT
Connections — RS08
P&E RS08 Multilink\Cyclone Pro
Figure 7.59 Debug Register File Tab
To view the Register Files of the device that you have chosen:
1. Find the debugger icon and click it to enter debug mode and open the debugging
window
2. Select the “Registers” tab on the right side of the debugging window, or select the
Window menu -> Show View -> Registers to open the Register window.
3. Expand a module by clicking on the plus/minus button to view the registers within the
module
4. Select a desired register to view its bit fields and bit descriptions in the window below.
In the Registers tab, all of the available modules are listed, and under each module all of
its registers are displayed with their current values. Selecting a register brings up the Bit
Microcontrollers V10.x Targeting Manual
573
DRAFT
Connections — RS08
P&E RS08 Multilink\Cyclone Pro
field, Actions box, and Description box. In the Bit field, you can view the bits in binary
format. The Actions box is used when a bit needs to be modified. You can revert changes,
write a new value, reset all of the bits, and view a summary of the register. You can also
change the format of the value written in the bit field. The Description box displays the
values and significance of each bit in the register. When a bit is modified, the description
will change.
You can modify each bit by selecting it in the drop-down box under the Bit field, or by
clicking the bit on the Bit field. Note that bits that are read-only will not allow you to
modify the bit values. A new value can be written into the edit box, or you can click the
light bulb button next to the edit box to view all of the options, and then double-click the
changes.
Socket Programming Options Button
The Programming Adapter Connections dialog assistant is designed to facilitate the use of
an extensive set of Freescale programming socket adapters. This dialog can be used to get
a graphical representation of the signals that must be connected from the BDM header to
the pins of the microprocessor. Making these connections lets you establish
communication with a given device via a hardware debug interface.
The Socket Programming Options button in the BDM Launch Configuration dialog box
(see Figure 7.51) takes you to the Programming Adapter Connections dialog box (see
Figure 7.60), where you can look up pin connection settings for the selected package type
of the target processor. Only available package types for each target processor are listed
in the Package drop-down menu. Once you have selected a package type, the Adapter
Information section provides the part number of the adapter board, the socket number
where the processor should be placed, and a pair of header numbers that indicate which
connections should be made between them. Immediately below the Adapter Information
section you will find a pin layout that displays the required connections between the
aforementioned pair of headers.
574
Microcontrollers V10.x Targeting Manual
DRAFT
Connections — RS08
P&E RS08 Multilink\Cyclone Pro
Figure 7.60 Programming Adapter Connections Dialog Box
P&E RS08 Multilink\Cyclone Pro ConnectionSpecific Options
This topic describes the connection-specific options. The connections include:
• P&E USB BDM Multilink
• P&E Cyclone Pro Serial
• P&E Cyclone PRO USB
• P&E Cyclone PRO TCP-IP
P&E USB BDM Multilink
The P&E USB BDM Multilink Connection setting permits a connection to USB BDM
Multilink devices. P&E USB BDM Multilink mode lets you debug code, as the firmware
is fully resident in the Flash of the microprocessor. The operation of all modules fully
reflects the actual operation of the onboard resources.
To select P&E USB BDM Multilink as the debugger connection:
Microcontrollers V10.x Targeting Manual
575
DRAFT
Connections — RS08
P&E RS08 Multilink\Cyclone Pro
1. Select Project > Change Device/Connection from the IDE menu bar. The Device/
Connection Change wizard appears.
2. Type a name for the project, in the New Project Name text box. By default, it is the
existing project name.
NOTE
Clear the Use default location checkbox and click Browse to specify a
different location for the new project. By default, the Use default location
checkbox is checked.
3. Click Next. The Device and Connection page appears.
4. Expand the RS08 tree control and select the derivative or board you would like to use.
For example, select RS08 > RS08KA Family > RS08KA2.
5. Click Next.
The Connections page appears.
6. Check the P&E USB BDM Multilink checkbox. See Figure Figure 7.61.
Figure 7.61 RS08 P&E USB BDM Multilink Selected
7. Click Finish.
The wizard creates a project for the RS08 architecture according to your specifications.
You can access the project from the CodeWarrior Projects view in the Workbench
window.
576
Microcontrollers V10.x Targeting Manual
DRAFT
Connections — RS08
P&E RS08 Multilink\Cyclone Pro
Connection Assistant
The P&E Connection Assistant is displayed when you attempt to debug and the program
cannot connect to the interface hardware specified in the Launch Configuration Dialog. To
select the P&E USB BDM Multilink as your debugger connection:
1. Select USB Multilink – USB Port from the first drop-down menu and click Refresh.
See Figure 7.62.
2. Using the second drop-down menu, select the port on which the interface is connected.
3. Click the Retry button
Figure 7.62 RS08 Connection Assistant Interface Selected
P&E Cyclone Pro Serial
The P&E Cyclone Pro Serial Connection setting permits a connection to Cyclone Pro
Serial devices. P&E Cyclone Pro Serial mode lets you debug code, as the firmware is fully
resident in the Flash of the microprocessor. The operation of all modules fully reflects the
actual operation of the onboard resources.
To select P&E Cyclone Pro Serial as the debugger connection:
1. Select Project > Change Device/Connection from the IDE menu bar. The Device/
Connection Change wizard appears.
2. Type a name for the project, in the New Project Name text box. By default, it is the
existing project name.
NOTE
Clear the Use default location checkbox and click Browse to specify a
different location for the new project. By default, the Use default location
checkbox is checked.
3. Click Next.
The Device and Connection page appears.
4. Expand the RS08 tree control and select the derivative or board you would like to use.
For example, select RS08 > RS08KA Family > RS08KA2.
Microcontrollers V10.x Targeting Manual
577
DRAFT
Connections — RS08
P&E RS08 Multilink\Cyclone Pro
5. Click Next.
The Connections page appears.
6. Check the P&E Cyclone Pro Serial checkbox. See Figure 7.63.
Figure 7.63 RS08 P&E Cyclone Pro Serial Selected
7. Click Finish.
The wizard creates a project for the RS08 architecture according to your specifications.
You can access the project from the CodeWarrior Projects view in the Workbench
window.
Connection Assistant
The P&E Connection Assistant is displayed when you attempt to debug and the program
cannot connect to the interface hardware specified in the Launch Configuration Dialog. To
select the P&E Cyclone Pro Serial as your debugger connection:
1. Select USB Multilink – USB Port from the first drop-down menu and click Refresh.
See Figure 7.64.
2. Using the second drop-down menu, select the port on which the interface is connected.
3. Click the Retry button
578
Microcontrollers V10.x Targeting Manual
DRAFT
Connections — RS08
P&E RS08 Multilink\Cyclone Pro
Figure 7.64 RS08 Connection Assistant Interface Selected
P&E Cyclone PRO USB
The P&E Cyclone Pro USB Connection setting permits a connection to Cyclone Pro USB
devices. P&E Cyclone Pro USB mode lets you debug code, as the firmware is fully
resident in the Flash of the microprocessor. The operation of all modules fully reflects the
actual operation of the onboard resources.
To select P&E Cyclone Pro USB as the debugger connection:
1. Select Project > Change Device/Connection from the IDE menu bar. The Device/
Connection Change wizard appears.
2. Type a name for the project, in the New Project Name text box. By default, it is the
existing project name.
NOTE
Clear the Use default location checkbox and click Browse to specify a
different location for the new project. By default, the Use default location
checkbox is checked.
3. Click Next.
The Device and Connection page appears.
4. Expand the RS08 tree control and select the derivative or board you would like to use.
For example, select RS08 > RS08KA Family > RS08KA2.
5. Click Next.
The Connections page appears.
6. Check the P&E Cyclone Pro USB checkbox. See Figure 7.65.
Microcontrollers V10.x Targeting Manual
579
DRAFT
Connections — RS08
P&E RS08 Multilink\Cyclone Pro
Figure 7.65 RS08 P&E Cyclone Pro USB Selected
7. Click Finish.
The wizard creates a project for the RS08 architecture according to your specifications.
You can access the project from the CodeWarrior Projects view in the Workbench
window.
Connection Assistant
The P&E Connection Assistant is displayed when you attempt to debug and the program
cannot connect to the interface hardware specified in the Launch Configuration Dialog. To
select the P&E Cyclone Pro USB as your debugger connection:
1. Select USB Multilink – USB Port from the first drop-down menu and click Refresh.
See Figure 7.66.
2. Using the second drop-down menu, select the port on which the interface is connected.
3. Click the Retry button.
580
Microcontrollers V10.x Targeting Manual
DRAFT
Connections — RS08
P&E RS08 Multilink\Cyclone Pro
Figure 7.66 RS08 Connection Assistant Interface Selected
P&E Cyclone PRO TCP-IP
The P&E Cyclone Pro TCP-IP Connection setting permits a connection to Cyclone Pro
TCP-IP devices. P&E Cyclone Pro TCP-IP mode lets you debug code, as the firmware is
fully resident in the Flash of the microprocessor. The operation of all modules fully
reflects the actual operation of the onboard resources.
To select P&E Cyclone Pro TCP-IP as the debugger connection:
1. Select Project > Change Device/Connection from the IDE menu bar. The Device/
Connection Change wizard appears.
2. Type a name for the project, in the New Project Name text box. By default, it is the
existing project name.
NOTE
Clear the Use default location checkbox and click Browse to specify a
different location for the new project. By default, the Use default location
checkbox is checked.
3. Click Next. The Device and Connection page appears.
4. Expand the RS08 tree control and select the derivative or board you would like to use.
For example, select RS08 > RS08KA Family > RS08KA2.
5. Click Next.
The Connections page appears.
6. Check the P&E Cyclone Pro TCP-IP checkbox. See Figure 7.67.
Microcontrollers V10.x Targeting Manual
581
DRAFT
Connections — RS08
P&E RS08 Multilink\Cyclone Pro
Figure 7.67 RS08 P&E Cyclone Pro TCP-IP Selected
7. Click Finish.
The wizard creates a project for the RS08 architecture according to your specifications.
You can access the project from the CodeWarrior Projects view in the Workbench
window.
Connection Assistant
The P&E Connection Assistant is displayed when you attempt to debug and the program
cannot connect to the interface hardware specified in the Launch Configuration Dialog. To
select the P&E Cyclone Pro TCP-IP as your debugger connection:
1. Select USB Multilink – USB Port from the first drop-down menu and click Refresh.
See Figure 7.68.
2. Using the second drop-down menu, select the port on which the interface is connected.
3. Click the Retry button
582
Microcontrollers V10.x Targeting Manual
DRAFT
Connections — RS08
Softec
Figure 7.68 Connection Assistant Interface Selected
Softec
This topic will contain information specific to Softec connection.
Open Source BDM
This topic will contain information specific to OSBDM connection.
Microcontrollers V10.x Targeting Manual
583
DRAFT
Connections — RS08
Open Source BDM
584
Microcontrollers V10.x Targeting Manual
DRAFT
8
Connections — ColdFire V1
This chapter describes the features and settings of the connections that interface the
CodeWarrior debugger with the ColdFire V1-based bare board target.
For the IDE to communicate with the target hardware, you must specify several key items:
the debugger protocol, a connection type, and any connection parameters. You enter the
first two items of information using options in the Connection tab view of the Debug
window. These options are:
• The Connection Protocol option determines what debugger protocol the debugger
uses to communicate with the target.
• The Physical Connection option specifies the hardware probe or connection type
that physically connects the workstation hosting CodeWarrior to the target board
under debug. After you make the option of physical connection, the view changes to
display configuration options specific for the hardware probe.
The topics in this chapter discuss the features and settings of the connections that interface
the CodeWarrior debugger with the ColdFire V1-based bare board target.
The topics of this chapter are:
• Changing Connection in IDE
• P&E USB BDM Multilink/Cyclone Pro
– Connection Assistant
– Active Mode Menu Options
– Advanced Programming/Debug Options
– View Register Files Options
– P&E USB BDM Multilink\Cyclone Pro Connection-Specific Options
• Abatron
– TCP/IP
– Serial
• CCS
– USB TAP
– Ethernet
Microcontrollers V10.x Targeting Manual
585
DRAFT
Connections — ColdFire V1
Changing Connection in IDE
Changing Connection in IDE
To change connection in the IDE, perform these steps.
1. Select Project > Change Device/Connection from the IDE menu bar.
The Device/Connection Change wizard appears.
2. Type a name for the project, in the New Project Name text box. By default, it is the
existing project name.
NOTE
Clear the Use default location checkbox and click Browse to specify a
different location for the new project. By default, the Use default location
checkbox is checked.
3. Click Next.
The Device and Connection page appears.
4. Expand the tree control and select the derivative or board you would like to use.
5. Click Next.
The Connections page appears.
6. Select the desired connection.
NOTE
You can select multiple connections by checking appropriate checkboxes in the
Connections page.
7. Click Finish.
The wizard creates a simulator project according to your specifications. You can
access the project from the CodeWarrior Projects view in the Workbench window.
8. Build the new project. For more information, refer to the topic Building Projects.
9. Debug the new project. For more information, refer to the topic Debugging Projects.
P&E USB BDM Multilink/Cyclone Pro
This option specifies that the hardware connection is either a P&E Microsystems
Multilink or a P&E Multisystems Cyclone Pro. The Connection tab displays options that
can be used to specify the connection parameters, such as the probe interface type and the
port that it uses (Figure 8.1).
586
Microcontrollers V10.x Targeting Manual
DRAFT
Connections — ColdFire V1
P&E USB BDM Multilink/Cyclone Pro
Figure 8.1 GDI — P&E Multilink/Cyclone Pro Connection
Table 8.1 describes the options for this view.
Table 8.1 Connection Parameter Options for P&E Multilink/Cyclone Pro
Option
Description
Interface
Use this option to select the interface type.
Select a supported interface from the list
box.
Port
This option selects the port over which
debug communications is conducted.
Select an available port from the list box.
Refresh
Click this button to have the workstation scan
for a valid interface and port. Valid interfaces
and ports appear in the Interface and
Port list boxes.
Socket Programming Options
The Socket Programming Options button
brings up a dialog that provides you a
graphical representation of the signals that
must be connected from the BDM header to
the pins of the microprocessor, in order to
use Freescale socket adapters.
Microcontrollers V10.x Targeting Manual
587
DRAFT
Connections — ColdFire V1
P&E USB BDM Multilink/Cyclone Pro
Table 8.1 Connection Parameter Options for P&E Multilink/Cyclone Pro (continued)
Option
Description
(Cyclone Pro only) Provide power to
target
This option determines whether the Cyclone
Pro (circuitry) provides power to the target
hardware via the probe.
Check this option to have the Cyclone Pro
(circuitry) supply power to the hardware
target
Uncheck this option to not provide power.
(Cyclone Pro only) Power off target
upon software exit
This option determines whether Cyclone Pro
hardware interface provides power to the
target hardware via VDD of the BDM cable.
Check this option to turn off the power when
the program terminates.
Uncheck this option to leave the hardware
target powered continuously.
(Cyclone Pro only) Regulator Output
Voltage
This option adjusts the output voltage that
powers the hardware target.
Select a voltage value from this option’s list
box.
Note: An improper voltage setting can
damage the board.
(Cyclone Pro only) Power down delay
This option specifies amount of time for
which the target will be turned off during a
RESET power cycling sequence.
Enter the delay interval (in milliseconds) in
this option’s text box.
(Cyclone Pro only) Power up delay
This option specifies amount of time for
which the target will remain powered prior to
a RESET power cycling sequence.
Enter the delay interval (in milliseconds) in
this option’s text box.
Connection Assistant
The P&E Connection Assistant is displayed when you attempt to debug but the program
cannot connect to the interface hardware specified in the Launch Configuration Dialog. To
select the P&E Multilink/Cyclone Pro as your debugger connection:
588
Microcontrollers V10.x Targeting Manual
DRAFT
Connections — ColdFire V1
P&E USB BDM Multilink/Cyclone Pro
1. Select the P&E device that you are using from the first drop-down menu and click
Refresh. See Figure 8.2.
2. Using the second drop-down menu, select the port on which the interface is connected.
3. Click the Retry button
Figure 8.2 CFV1 Connection Assistant Interface Selected
Launch Configuration Settings
To set the launch configurations for the debugger:
1. Find the debugger icon and click on the drop-down arrow to bring up the debugger
menu. See Figure 8.2.
2. Select Debug Configurations
3. In the left column, select the project download type for which you would like to set the
launch configurations. See Figure 8.3
4. In the right column, click on the Debugger tab.
5. Set your configurations and click Debug to start the debugger.
Microcontrollers V10.x Targeting Manual
589
DRAFT
Connections — ColdFire V1
P&E USB BDM Multilink/Cyclone Pro
Figure 8.3 Debugger Drop-down Menu
590
Microcontrollers V10.x Targeting Manual
DRAFT
Connections — ColdFire V1
P&E USB BDM Multilink/Cyclone Pro
Figure 8.4 Debugger Configuration Settings Dialog Box
Active Mode Menu Options
When the microprocessor is connected, the active mode menu shows the name of the
microprocessor and gives you access to the Advanced Programming/Debug Options.
When the microprocessor is not connected, the menu is not available.
Figure 8.5 Additional Connection Menu Options
Advanced Programming/Debug Options
The Advanced Programming/Debug Options menu option takes you to the Advanced
Options dialog box, where you can configure the software settings for the Flash
programming procedure.
Microcontrollers V10.x Targeting Manual
591
DRAFT
Connections — ColdFire V1
P&E USB BDM Multilink/Cyclone Pro
Figure 8.6 Advanced Options Dialog Box
Prompt on Flash Program Checkbox
Setting the "Always Erase and Program flash without asking" checkbox in this dialog box
allows the software to transparently program the microprocessor every time the debugger
is started. Setting the "Enable Flash Programming Dialog" lets you view the steps taken by
the Flash Programmer.
Trim Options
The Calculate Trim and Program the Non-Volatile Trim Register checkbox enables
automatic calculation and programming of the trim value to a designated Non-Volatile
memory location.
Non-Volatile Memory Preservation
You have the option of preserving up to three independent ranges of non-volatile memory
(on devices with EEPROM, the entire EEPROM array may optionally be preserved as
592
Microcontrollers V10.x Targeting Manual
DRAFT
Connections — ColdFire V1
P&E USB BDM Multilink/Cyclone Pro
well). Ranges that are designated as “preserved” are read before an erase and reprogrammed immediately afterwards, thereby preserving the data in these ranges. Any
attempts to program data into a preserved range are ignored. When entering an address
into the preserved range field (hexadecimal input is required), the values are masked
according to the row size of the device. This ensures that the reprogramming of preserved
data does not cause any conditions that disturb programming.
Sync to PLL Change Checkbox
The debugger requires the Sync to PLL Change to synchronize the software/hardware
connection with the microprocessor during the Flash erase/program procedure.
Trim Control
The Use custom trim reference frequency option lets you select a custom trim value for the
target device (valid only for devices with an Internal Clock). You can input any value
within the valid internal clock frequency range; the allowable trim value is limited only by
the device itself. Note that the valid internal clock frequency range and the default trim
value for the currently selected device/algorithm are displayed as well. For more
information about the specific functionality of the internal clock source, see the Freescale
Data Sheet for your specific device.
Alternative Algorithm Functionality
Once you create a project for a specific HCS08/RS08 microprocessor, the debugger
specifies a default algorithm to use during all Flash programming operations. The
debugger uses this algorithm for nearly all programming requirements. The default
algorithm can be found in the <CW_Install>/prog/P&E directory.
However, the default algorithm may be overridden via the Alternative Algorithm function,
located in the Advanced Programming/Debug Options menu. You can use this feature to
select a custom programming algorithm, or simply select another one of P&E’s many
programming algorithms for use with a specific project.
CAUTION
Selecting the wrong programming algorithm may damage their device,
lead to under/over programming situations, or simply not program
portions of the project file. It is therefore recommended using the default
algorithm unless there is a compelling reason to do otherwise.
Use these steps to override the default algorithm:
Microcontrollers V10.x Targeting Manual
593
DRAFT
Connections — ColdFire V1
P&E USB BDM Multilink/Cyclone Pro
1. Select the Advanced Programming/Debug Options selection from the PEMicro menu.
Figure 8.7 Advanced Programming/Debug Options Menu Selection
2. Check the Use Alternative Algorithm checkbox.
Figure 8.8 Advanced Options - Alternative Algorithm Checkbox
3. Click the Choose Alternative Algorithm button, which lets you browse for an
alternative algorithm.
4. Once you select the alternative algorithm, the name of the algorithm along with its full
path appears in the text field below the Choose Alternative Algorithm button.
At this point, the current project performs all future Flash programming operations using
the alternative algorithm. You may revert to the default algorithm at any time by clearing
the Use Alternative Algorithm checkbox.
594
Microcontrollers V10.x Targeting Manual
DRAFT
Connections — ColdFire V1
P&E USB BDM Multilink/Cyclone Pro
View Register Files Options
The Register Files tab in the debugger gives you the option of viewing and editing the
register files. If register files are available for the device that you have chosen, the
Registers tab in the debugger (see Figure 8.9) is populated.
Figure 8.9 Debug Register File Tab
To view the Register Files of the device that you have chosen:
1. Find the debugger icon and click it to enter debug mode and open the debugging
window
2. Select the “Registers” tab on the right side of the debugging window, or select the
Window menu -> Show View -> Registers to open the Register window.
3. Expand a module by clicking on the plus/minus button to view the registers within the
module
4. Select a desired register to view its bit fields and bit descriptions in the window below.
Microcontrollers V10.x Targeting Manual
595
DRAFT
Connections — ColdFire V1
P&E USB BDM Multilink/Cyclone Pro
In the Registers tab, all of the available modules are listed, and under each module all of
its registers are displayed with their current values. Selecting a register brings up the Bit
field, Actions box, and Description box. In the Bit field, you can view the bits in binary
format. The Actions box is used when a bit needs to be modified. You can revert changes,
write a new value, reset all of the bits, and view a summary of the register. You can also
change the format of the value written in the bit field. The Description box displays the
values and significance of each bit in the register. When a bit is modified, the description
will change.
You can modify each bit by selecting it in the drop-down box under the Bit field, or by
clicking the bit on the Bit field. Note that bits that are read-only will not allow you to
modify the bit values. A new value can be written into the edit box, or you can click the
light bulb button next to the edit box to view all of the options, and then double-click the
changes.
P&E USB BDM Multilink\Cyclone Pro
Connection-Specific Options
This topic describes the connection-specific options. The connections include:
• P&E USB BDM Multilink
• P&E Cyclone Pro Serial
• P&E Cyclone Pro USB
• P&E Cyclone Pro TCP-IP
P&E USB BDM Multilink
The P&E USB BDM Multilink Connection setting permits a connection to USB BDM
Multilink devices. P&E USB BDM Multilink mode lets you debug code, as the firmware
is fully resident in the Flash of the microprocessor. The operation of all modules fully
reflects the actual operation of the onboard resources.
To select P&E USB BDM Multilink as the debugger connection:
1. Select Project > Change Device/Connection from the IDE menu bar. The Device/
Connection Change wizard appears.
2. Type a name for the project, in the New Project Name text box. By default, it is the
existing project name.
NOTE
Clear the Use default location checkbox and click Browse to specify a different
location for the new project. By default, the Use default location checkbox is
checked.
3. Click Next. The Device and Connection page appears.
596
Microcontrollers V10.x Targeting Manual
DRAFT
Connections — ColdFire V1
P&E USB BDM Multilink/Cyclone Pro
4. Expand the RS08 tree control and select the derivative or board you would like to use.
For example, select ColdFire V1 > MCF51QE Family > MCF51QE128.
5. Click Next. The Connections page appears.
6. Check the P&E USB BDM Multilink checkbox. See Figure 8.10.
Figure 8.10 ColdFire V1 P&E USB BDM Multilink Selected
7. Click Finish.
The wizard creates a project for the ColdFire V1 architecture according to your
specifications. You can access the project from the CodeWarrior Projects view in the
Workbench window.
Connection Assistant
The P&E Connection Assistant is displayed when you attempt to debug and the program
cannot connect to the interface hardware specified in the Launch Configuration Dialog. To
select the P&E USB BDM Multilink as your debugger connection:
1. Select USB Multilink – USB Port from the first drop-down menu and click Refresh.
See Figure 8.11.
2. Using the second drop-down menu, select the port on which the interface is connected.
3. Click the Retry button
Microcontrollers V10.x Targeting Manual
597
DRAFT
Connections — ColdFire V1
P&E USB BDM Multilink/Cyclone Pro
Figure 8.11 ColdFire V1 Connection Assistant Interface Selected
P&E Cyclone Pro Serial
The P&E Cyclone Pro Serial Connection setting permits a connection to Cyclone Pro
Serial devices. P&E Cyclone Pro Serial mode lets you debug code, as the firmware is fully
resident in the Flash of themicroprocessor. The operation of all modules fully reflects the
actual operation of the onboard resources.
To select P&E Cyclone Pro Serial as the debugger connection:
1. Select Project > Change Device/Connection from the IDE menu bar. The Device/
Connection Change wizard appears.
2. Type a name for the project, in the New Project Name text box. By default, it is the
existing project name.
NOTE
Clear the Use default location checkbox and click Browse to specify a different
location for the new project. By default, the Use default location checkbox is
checked.
3. Click Next. The Device and Connection page appears.
4. Expand the ColdFire V1 tree control and select the derivative or board you would like
to use. For example, select ColdFire V1 >MCF51QE Family > MCF51QE128.
5. Click Next. The Connections page appears.
6. Check the P&E Cyclone Pro Serial checkbox. See Figure 8.12.
598
Microcontrollers V10.x Targeting Manual
DRAFT
Connections — ColdFire V1
P&E USB BDM Multilink/Cyclone Pro
Figure 8.12 ColdFire V1 P&E Cyclone Pro Serial Selected
7. Click Finish.
The wizard creates a project for the ColdFire V1 architecture according to your
specifications. You can access the project from the CodeWarrior Projects view in the
Workbench window.
Connection Assistant
The P&E Connection Assistant is displayed when you attempt to debug and the program
cannot connect to the interface hardware specified in the Launch Configuration Dialog. To
select the P&E Cyclone Pro Serial as your debugger connection:
1. Select USB Multilink – USB Port from the first drop-down menu and click Refresh.
See Figure 8.13.
2. Using the second drop-down menu, select the port on which the interface is connected.
3. Click the Retry button
Microcontrollers V10.x Targeting Manual
599
DRAFT
Connections — ColdFire V1
P&E USB BDM Multilink/Cyclone Pro
Figure 8.13 ColdFire V1 Connection Assistant Interface Selected
P&E Cyclone Pro USB
The P&E Cyclone Pro USB Connection setting permits a connection to Cyclone Pro USB
devices. P&E Cyclone Pro USB mode lets you debug code, as the firmware is fully
resident in the Flash of the microprocessor. The operation of all modules fully reflects the
actual operation of the onboard resources.
To select P&E Cyclone Pro USB as the debugger connection:
1. Select Project > Change Device/Connection from the IDE menu bar. The Device/
Connection Change wizard appears.
2. Type a name for the project, in the New Project Name text box. By default, it is the
existing project name.
NOTE
Clear the Use default location checkbox and click Browse to specify a different
location for the new project. By default, the Use default location checkbox is
checked.
3. Click Next. The Device and Connection page appears.
4. Expand the ColdFire V1 tree control and select the derivative or board you would like
to use. For example, select ColdFire V1 > MCF51QE Family > MCF51QE128.
5. Click Next. The Connections page appears.
6. Check the P&E Cyclone Pro USB checkbox. See Figure 8.14.
600
Microcontrollers V10.x Targeting Manual
DRAFT
Connections — ColdFire V1
P&E USB BDM Multilink/Cyclone Pro
Figure 8.14 ColdFire V1 P&E Cyclone Pro USB Selected
7. Click Finish.
The wizard creates a project for the ColdFire V1 architecture according to your
specifications. You can access the project from the CodeWarrior Projects view in the
Workbench window.
Connection Assistant
The P&E Connection Assistant is displayed when you attempt to debug and the program
cannot connect to the interface hardware specified in the Launch Configuration Dialog. To
select the P&E Cyclone Pro USB as your debugger connection:
1. Select USB Multilink – USB Port from the first drop-down menu and click Refresh.
See Figure 8.15.
2. Using the second drop-down menu, select the port on which the interface is connected.
3. Click the Retry button
Microcontrollers V10.x Targeting Manual
601
DRAFT
Connections — ColdFire V1
P&E USB BDM Multilink/Cyclone Pro
Figure 8.15 ColdFire V1 Connection Assistant Interface Selected
P&E Cyclone Pro TCP-IP
The P&E Cyclone Pro TCP-IP Connection setting permits a connection to Cyclone Pro
TCP-IP devices. P&E Cyclone Pro TCP-IP mode lets you debug code, as the firmware is
fully resident in the Flash of the microprocessor. The operation of all modules fully
reflects the actual operation of the onboard resources.
To select P&E Cyclone Pro TCP-IP as the debugger connection:
1. Select Project > Change Device/Connection from the IDE menu bar. The Device/
Connection Change wizard appears.
2. Type a name for the project, in the New Project Name text box. By default, it is the
existing project name.
NOTE
Clear the Use default location checkbox and click Browse to specify a different
location for the new project. By default, the Use default location checkbox is
checked.
3. Click Next. The Device and Connection page appears.
4. Expand the ColdFire V1 tree control and select the derivative or board you would like
to use. For example, select ColdFire V1 > MCF51QE Family > MCF51QE128.
5. Click Next. The Connections page appears.
6. Check the P&E Cyclone Pro TCP-IP checkbox. See Figure 8.16.
602
Microcontrollers V10.x Targeting Manual
DRAFT
Connections — ColdFire V1
P&E USB BDM Multilink/Cyclone Pro
Figure 8.16 ColdFire V1 P&E Cyclone Pro TCP-IP Selected
7. Click Finish.
The wizard creates a project for the ColdFire V1 architecture according to your
specifications. You can access the project from the CodeWarrior Projects view in the
Workbench window.
Connection Assistant
The P&E Connection Assistant is displayed when you attempt to debug and the program
cannot connect to the interface hardware specified in the Launch Configuration Dialog. To
select the P&E Cyclone Pro TCP-IP as your debugger connection:
1. Select USB Multilink – USB Port from the first drop-down menu and click Refresh.
See Figure 8.17.
2. Using the second drop-down menu, select the port on which the interface is connected.
3. Click the Retry button
Microcontrollers V10.x Targeting Manual
603
DRAFT
Connections — ColdFire V1
Abatron
Figure 8.17 ColdFire V1 Connection Assistant Interface Selected
Abatron
This section discusses the option of different hardware probes supported by the Abatron
BDI debugger protocol and their settings options. The supported hardware connections
are:
• TCP/IP
• Serial
TCP/IP
This option specifies that the physical connection uses TCP/IP as the interface for
debugging communications. The tab view displays the connection parameters this
connection type uses (Figure 8.18).
604
Microcontrollers V10.x Targeting Manual
DRAFT
Connections — ColdFire V1
Abatron
Figure 8.18 Abatron — TCP/IP Connection
Table 8.2 describes the options displayed by this page.
Table 8.2 Connection Parameter Options for Abatron TCP/IP Connection
Option
Description
Hostname/IP Address
This option specifies the IP address used to
communicate with the hardware target. Enter
the IP address into the Hostname/IP
address text box.
Port #
This option specifies the IP port number
used to communicate with the hardware
target. Enter the value for the port number
into Port # text box.
Serial
This option specifies that the physical connection uses a serial connection as the interface
for debugging communications. The tab view displays the connection parameters this
connection type uses (Figure 8.19).
Microcontrollers V10.x Targeting Manual
605
DRAFT
Connections — ColdFire V1
Abatron
Figure 8.19 Abatron — Serial Connection
Table 8.3 explains the various settings used to configure the serial connection. Adjust
these to match the configuration of the serial port on the hardware target.
606
Microcontrollers V10.x Targeting Manual
DRAFT
Connections — ColdFire V1
Abatron
Table 8.3 Connection Parameters Option for Abatron Serial Connection
Option
Description
Port
Specifies the serial port the host system
uses. Options are:
• COM1
• COM2
• COM3
• COM4
Rate
Specifies the bit-rate of the serial interface.
Options are:
• 300
• 1200
• 2400
• 4800
• 9600
• 19200
• 34800
• 57600
• 115200
• 230400
Data Bits
Specifies the bit size of the characters sent
through the serial interface. Options are:
• 4
• 5
• 6
• 7
• 8
Parity
Specifies if a parity bit is included with the
character for error-correction. Options are:
• None
• Odd
• Even
Microcontrollers V10.x Targeting Manual
607
DRAFT
Connections — ColdFire V1
CCS
Table 8.3 Connection Parameters Option for Abatron Serial Connection (continued)
Option
Description
Stop Bits
Specifies if a termination bit is appended to
the character. Options are:
•
• 1.5
• 2
Flow Control
Specifies how the serial transfer of
characters is controlled to prevent data overruns. Options are:
• None
• Hardware (RTS/CTS)
• Software (XON/XOFF)
CCS
This section discusses the option of different hardware probes supported by the CCS
debugger protocol and their settings options. The supported hardware connections are:
• Generic
• USB TAP
• Ethernet
NOTE
The Generic connection is not supported for this release.
USB TAP
This option specifies that the physical connection uses USB TAP run control as the
interface for debugging communications. The tab view displays the connection parameters
this connection type uses (Figure 8.20).
608
Microcontrollers V10.x Targeting Manual
DRAFT
Connections — ColdFire V1
CCS
Figure 8.20 CCS — USB Connection
You use the option USB TAP Serial Number (hex) to enter an optional serial number for
the USB hardware probe. Enter the serial number into the text box as a hexadecimal value.
NOTE
For more information on the Advanced option presented on these views,
consult the section Connection Tab — ColdFire in the Working with the
Debugger chapter,
Ethernet
This option specifies that the physical connection uses Ethernet run control as the interface
for debugging communications. The tab view displays the connection parameters this
connection type uses ().
Microcontrollers V10.x Targeting Manual
609
DRAFT
Connections — ColdFire V1
CCS
Figure 8.21 CCS — Ethernet TAP Connection
Enter the IP address of the Ethernet TAP into the Hostname/IP Address text box. Enter
this value as a dotted decimal number, such as 127.0.0.1.
NOTE
610
For more information on the Advanced option presented on these views,
consult the section Connection Tab — ColdFire in the Working with the
Debugger chapter,
Microcontrollers V10.x Targeting Manual
DRAFT
9
Connections — ColdFire V2/
3/4
This chapter describes the features and settings of the connections that interface the
CodeWarrior debugger with the ColdFire V2/3/4-based bare board target.
For the IDE to communicate with the target hardware, you must specify several key items:
the debugger protocol, a connection type, and any connection parameters. You enter the
first two items of information using options in the Connection tab view of the Debug
window. These options are:
• The Connection Protocol option determines what debugger protocol the debugger
uses to communicate with the target.
• The Physical Connection option specifies the hardware probe or connection type
that physically connects the workstation hosting CodeWarrior to the target board
under debug. After you make the option of physical connection, the view changes to
display configuration options specific for the hardware probe.
The topics in this chapter discuss the features and settings of the connections that interface
the CodeWarrior debugger with the ColdFire V2/3/4-based bare board target.
The topics of this chapter are:
• Changing Connection in IDE
• P&E ColdFire Multilink/Cyclone MAX
– Connection Assistant
• Abatron
– TCP/IP
– Serial
• CCS
– USB TAP
– Ethernet
Changing Connection in IDE
To change connection in the IDE, perform these steps.
Microcontrollers V10.x Targeting Manual
611
DRAFT
Connections — ColdFire V2/3/4
P&E ColdFire Multilink/Cyclone MAX
1. Select Project > Change Device/Connection from the IDE menu bar.
The Device/Connection Change wizard appears.
2. Type a name for the project, in the New Project Name text box. By default, it is the
existing project name.
NOTE
Clear the Use default location checkbox and click Browse to specify a
different location for the new project. By default, the Use default location
checkbox is checked.
3. Click Next.
The Device and Connection page appears.
4. Expand the tree control and select the derivative or board you would like to use.
5. Click Next.
The Connections page appears.
6. Select the desired connection.
NOTE
You can select multiple connections by checking appropriate checkboxes in the
Connections page.
7. Click Finish.
The wizard creates a simulator project according to your specifications. You can
access the project from the CodeWarrior Projects view in the Workbench window.
8. Build the new project. For more information, refer to the topic Building Projects.
9. Debug the new project. For more information, refer to the topic Debugging Projects.
P&E ColdFire Multilink/Cyclone MAX
This option specifies that the hardware connection is either a P&E Microcomputer
Systems Multilink or a P&E Microcomputer Systems Cyclone MAX. The Connection tab
displays options that can be used to specify the connection parameters, such as the probe
interface type and the port that it uses (Figure 9.1).
612
Microcontrollers V10.x Targeting Manual
DRAFT
Connections — ColdFire V2/3/4
P&E ColdFire Multilink/Cyclone MAX
Figure 9.1 GDI — P&E Multilink/Cyclone MAX Connection
Table 9.1 describes the options for this view.
Table 9.1 Connection Parameter Options for P&E Multilink/Cyclone MAX
Option
Description
Interface
Use this option to select the interface type.
Select a supported interface from the list
box.
Port
This option selects the port over which
debug communications is conducted.
Select an available port from the list box.
Refresh
Microcontrollers V10.x Targeting Manual
Click this button to have the workstation scan
for a valid interface and port. Valid interfaces
and ports appear in the Interface and
Port list boxes.
613
DRAFT
Connections — ColdFire V2/3/4
P&E ColdFire Multilink/Cyclone MAX
Table 9.1 Connection Parameter Options for P&E Multilink/Cyclone MAX (continued)
Option
Description
BDM Debug Shift Freq.
This option lets you to set the BDM shift
clock speed of P&E's BDM interfaces. This
integer value may be used to determine the
speed of communications according to the
following equations:
Cyclone Max : (50000000/(2*N+5)) Hz
USB-ML-CF :
( 1000000/(N+1)) Hz
The value n should be between 0 and 31.
This shift clock takes effect after the
commands in the top of the programming
algorithm are executed so that these
commands can increase the target
frequency and allow a faster shift clock. This
clock can't generally exceed a div 4 of the
processor bus frequency.
Delay After Reset
Specifies a delay after the programmer
resets the target that we check to see if the
part has properly gone into background
debug mode. This is useful if the target has a
reset driver which hold the MCU in reset after
the programmer releases the reset line. The
n value is a delay in milliseconds.
Use PST Signals
When the checkbox is set, the software will
use the PST pins to determine if the part is
running in user mode or halted in debug
mode. When the checkbox is cleared, the
software will use the BDM communications
pins to determine the processor status.
Using the BDM communications pins to
determine the status results in a slight
slowdown in communication and download
rates. The advantage is that the target board
no longer has to wire the PST signals to the
debug connectors.
Connection Assistant
The P&E Connection Assistant is displayed when you attempt to debug but the program
cannot connect to the interface hardware specified in the Launch Configuration Dialog. To
select the P&E Multilink/Cyclone Pro as your debugger connection:
614
Microcontrollers V10.x Targeting Manual
DRAFT
Connections — ColdFire V2/3/4
P&E ColdFire Multilink/Cyclone MAX
1. Choose the P&E device that you are using from the first drop-down menu and click
Refresh. See Figure 9.2.
2. Using the second drop-down menu, select the port on which the interface is connected.
3. Click the Retry button
Figure 9.2 CFV2/3/4 Connection Assistant Interface Selected
Launch Configuration Settings
To set the launch configurations for the debugger:
1. Find the debugger icon and click on the drop-down arrow to bring up the debugger
menu. See Figure 9.2.
2. Select Debug Configurations
3. In the left column, select the project download type for which you would like to set the
launch configurations. See Figure 9.3
4. In the right column, click on the Debugger tab.
5. Set your configurations and click Debug to start the debugger.
Microcontrollers V10.x Targeting Manual
615
DRAFT
Connections — ColdFire V2/3/4
P&E ColdFire Multilink/Cyclone MAX
Figure 9.3 Debugger Drop-down Menu
616
Microcontrollers V10.x Targeting Manual
DRAFT
Connections — ColdFire V2/3/4
P&E ColdFire Multilink/Cyclone MAX
Figure 9.4 Debugger Configuration Settings Dialog Box
View Register Files Options
The Register Files tab in the debugger gives you option of viewing and editing the register
files. If register files are available for the device that you have chosen, the Registers tab in
the debugger (see Figure 9.5) is populated.
Microcontrollers V10.x Targeting Manual
617
DRAFT
Connections — ColdFire V2/3/4
P&E ColdFire Multilink/Cyclone MAX
Figure 9.5 Debug Register File Tab
To view the Register Files of the device that you have chosen:
1. Find the debugger icon and click it to enter debug mode and open the debugging
window
2. Select the “Registers” tab on the right side of the debugging window, or select the
Window menu -> Show View -> Registers to open the Register window.
3. Expand a module by clicking on the plus/minus button to view the registers within the
module
4. Select a desired register to view its bit fields and bit descriptions in the window below.
In the Registers tab, all of the available modules are listed, and under each module all of
its registers are displayed with their current values. Selecting a register brings up the Bit
618
Microcontrollers V10.x Targeting Manual
DRAFT
Connections — ColdFire V2/3/4
Abatron
field, Actions box, and Description box. In the Bit field, you can view the bits in binary
format. The Actions box is used when a bit needs to be modified. You can revert changes,
write a new value, reset all of the bits, and view a summary of the register. You can also
change the format of the value written in the bit field. The Description box displays the
values and significance of each bit in the register. When a bit is modified, the description
will change.
You can modify each bit by selecting it in the drop-down box under the Bit field, or by
clicking the bit on the Bit field. Note that bits that are read-only will not allow you to
modify the bit values. A new value can be written into the edit box, or you can click the
light bulb button next to the edit box to view all of the options, and then double-click the
changes.
Abatron
This section discusses the option of different hardware probes supported by the Abatron
BDI debugger protocol and their settings options. The supported hardware connections
are:
• TCP/IP
• Serial
TCP/IP
This option specifies that the physical connection uses TCP/IP as the interface for
debugging communications. The tab view displays the connection parameters this
connection type uses (Figure 9.6).
Microcontrollers V10.x Targeting Manual
619
DRAFT
Connections — ColdFire V2/3/4
Abatron
Figure 9.6 Abatron — TCP/IP Connection
Table 9.2 describes the options displayed by this page.
Table 9.2 Connection Parameter Options for Abatron TCP/IP Connection
Option
Description
Hostname/IP Address
This option specifies the IP address used to
communicate with the hardware target. Enter
the IP address into the Hostname/IP
address text box.
Port #
This option specifies the IP port number
used to communicate with the hardware
target. Enter the value for the port number
into Port # text box.
Serial
This option specifies that the physical connection uses a serial connection as the interface
for debugging communications. The tab view displays the connection parameters this
connection type uses (Figure 9.7).
620
Microcontrollers V10.x Targeting Manual
DRAFT
Connections — ColdFire V2/3/4
Abatron
Figure 9.7 Abatron — Serial Connection
Table 9.3 explains the various settings used to configure the serial connection. Adjust
these to match the configuration of the serial port on the hardware target.
Microcontrollers V10.x Targeting Manual
621
DRAFT
Connections — ColdFire V2/3/4
Abatron
Table 9.3 Connection Parameters Option for Abatron Serial Connection
Option
Description
Port
Specifies the serial port the host system
uses. Options are:
• COM1
• COM2
• COM3
• COM4
Rate
Specifies the bit-rate of the serial interface.
Options are:
• 300
• 1200
• 2400
• 4800
• 9600
• 19200
• 34800
• 57600
• 115200
• 230400
Data Bits
Specifies the bit size of the characters sent
through the serial interface. Options are:
• 4
• 5
• 6
• 7
• 8
Parity
Specifies if a parity bit is included with the
character for error-correction. Options are:
• None
• Odd
• Even
622
Microcontrollers V10.x Targeting Manual
DRAFT
Connections — ColdFire V2/3/4
CCS
Table 9.3 Connection Parameters Option for Abatron Serial Connection (continued)
Option
Description
Stop Bits
Specifies if a termination bit is appended to
the character. Options are:
•
• 1.5
• 2
Flow Control
Specifies how the serial transfer of
characters is controlled to prevent data overruns. Options are:
• None
• Hardware (RTS/CTS)
• Software (XON/XOFF)
CCS
This section discusses the option of different hardware probes supported by the CCS
debugger protocol and their settings options. The supported hardware connections are:
• Generic
• USB TAP
• Ethernet
NOTE
The Generic connection is not supported for this release.
USB TAP
This option specifies that the physical connection uses USB TAP run control as the
interface for debugging communications. The tab view displays the connection parameters
this connection type uses (Figure 9.8).
Microcontrollers V10.x Targeting Manual
623
DRAFT
Connections — ColdFire V2/3/4
CCS
Figure 9.8 CCS — USB Connection
You use the option USB TAP Serial Number (hex) to enter an optional serial number for
the USB hardware probe. Enter the serial number into the text box as a hexadecimal value.
NOTE
For more information on the Advanced option presented on these views,
consult the section Connection Tab — ColdFire in the Working with the
Debugger chapter,
Ethernet
This option specifies that the physical connection uses Ethernet run control as the interface
for debugging communications. The tab view displays the connection parameters this
connection type uses ().
624
Microcontrollers V10.x Targeting Manual
DRAFT
Connections — ColdFire V2/3/4
CCS
Figure 9.9 CCS — Ethernet TAP Connection
Enter the IP address of the Ethernet TAP into the Hostname/IP Address text box. Enter
this value as a dotted decimal number, such as 127.0.0.1.
NOTE
For more information on the Advanced option presented on these views,
consult the section Connection Tab — ColdFire in the Working with the
Debugger chapter,
Microcontrollers V10.x Targeting Manual
625
DRAFT
Connections — ColdFire V2/3/4
CCS
626
Microcontrollers V10.x Targeting Manual
DRAFT
10
Common Connection
Features
This chapter explains how to use the CodeWarrior hardware tools. Use these tools for
board bring-up, test, and analysis.
The topics in this chapter are:
• Working with Flash Programmer
• Quick Access to Target Tasks
• Flash Programmer Tutorials
• Working with Hardware Diagnostics Window
• Manipulating Target Memory
Working with Flash Programmer
The CodeWarrior Flash Programmer can program the flash memory of the target board
with code from any CodeWarrior IDE project or any individual files. The Flash
Programmer (FP) feature is a target task that lets you run a series of actions on a flash:
internal or present on a board (NOR, NAND, etc). The supported operations are:
• Program — Program an image in flash (address restrictions may apply).
• Erase — Erase the flash at a sector/block level, and all flash if possible.
• Blank Check — At sector level and when possible, all flash.
• Verify — Verify the programmed image (address restrictions may apply).
• Checksum — Checksum of a written image (file on target, file on host, memory
range on target, and all flash).
The CodeWarrior Flash Programmer lets you program the flash memory of any of the
supported target boards, from within the IDE. You can do this using either the pre-defined
tasks provided with the CodeWarrior installation, or create your own specialized tasks.
Each of these options is described in the following topics:
• Use Pre-Defined Programming Task
• Create Flash Programmer Task
Microcontrollers V10.x Targeting Manual
627
DRAFT
Common Connection Features
Working with Flash Programmer
Use Pre-Defined Programming Task
To use a pre-defined flash programming task, you first import its *.xml file into the
Target Tasks view. CodeWarrior for Microcontrollers provides default flash
configuration files for a wide variety of supported target boards. The pre-defined task files
are in the following directories:
CWInstallDir/MCU_version/bin/plugins/support/TargetTask/
Flash_Programmer/HC08
CWInstallDir/MCU_version/bin/plugins/support/TargetTask/
Flash_Programmer/ColdFire
After you have imported the task, it appears in the Target Tasks view, where you can
execute it.
To import a pre-defined Flash Programmer task, perform these steps.
1. From the CodeWarrior menu bar, select Window > Show View > Other.
The Show View dialog box appears.
2. Expand the Debug tree control and select Target Tasks. See Figure 10.1.
Figure 10.1 Show View Dialog Box
3. Click OK.
The Target Tasks view appears. See Figure 10.2.
628
Microcontrollers V10.x Targeting Manual
DRAFT
Common Connection Features
Working with Flash Programmer
Figure 10.2 Target Tasks View
4. Right-click in the Target Tasks view and select Import. Alternatively, click the
icon on the Target Tasks view toolbar.
The Open dialog box appears.
5. Navigate to the pre-defined tasks folder at <CW MCU
install>\MCU_10.0\bin\plugins\support\TargetTask\Flash_Pr
ogrammer\ and select the desired .xml file for your hardware target. For example,
select MCF5213_INTFLASH.xml
6. Click Open.
The selected task appears in the Target Tasks view (Figure 10.3).
Figure 10.3 Pre-defined Task in Target Tasks View
7. Right-click on the task’s name and select Execute.
The task’s Flash Programmer actions execute in sequence. First, they erase the
hardware target’s flash memory.
NOTE
When a predefined flash programmer task is imported, its Run Configuration
is set as Active Debug Context. If the task is imported without any
active debug session, then the
icon will be disabled as in Figure 10.3.
Associate the selected target task to a different Run Configuration to enable the
icon.
8. Double-click on the task’s name, to examine the task’s stored Flash Programmer
actions.
The <target> Flash Programmer Task editor window appears, and displays the
actions in the Flash Programmer Actions group (Figure 10.4).
Microcontrollers V10.x Targeting Manual
629
DRAFT
Common Connection Features
Working with Flash Programmer
Figure 10.4 <target> Flash Programmer Task Editor Window Displaying Stored Actions
If you are working with special hardware that require a different sequence of Flash
Programmer actions, you can create your own target tasks.
NOTE
For more information on creating Flash Programmer target tasks, refer to the
Create Flash Programmer Task topic.
For more information on the various options available in the <target> Flash
Programmer Task editor window, refer to the Freescale Eclipse Extensions
Guide.
Create Flash Programmer Task
In the Eclipse IDE, the Flash Programmer runs like a target task.
To create a Flash Programmer target task, perform these steps.
1. From the CodeWarrior main menu bar, select Window > Show View > Other.
The Show View dialog box appears.
2. Expand the Debug tree control and select Target Tasks. See Figure 10.5.
630
Microcontrollers V10.x Targeting Manual
DRAFT
Common Connection Features
Working with Flash Programmer
Figure 10.5 Show View Dialog Box
3. Click OK.
The Target Tasks view appears. See Figure 10.6.
Figure 10.6 Target Tasks View
4. Click
from the Target Tasks view toolbar to create a new target task.
The Create New Target Task wizard appears.
5. In the Task Name text box, enter the name of the target task.
6. From the Run Configuration drop-down list, select a configuration.
NOTE
Select Active Debug Context from the Run Configuration drop-down list, if
you want to use Flash Programmer over an active debug session, else select
any of the specified debug context from the list.
Microcontrollers V10.x Targeting Manual
631
DRAFT
Common Connection Features
Working with Flash Programmer
7. From the Task Type drop-down list, select the appropriate Flash Programmer. See
Figure 10.7. If necessary, select Flash Programmer for HCS08/ColdFire
V1 from the drop-down list.
Figure 10.7 Create New Target Task Wizard
8. Click Finish.
The <target> Flash Programmer Task editor window appears as seen in Figure 10.8.
NOTE
632
The <target> Flash Programmer Task editor window has groups to define
flash devices, Flash Programmer actions, and target RAM settings.
Microcontrollers V10.x Targeting Manual
DRAFT
Common Connection Features
Working with Flash Programmer
Figure 10.8 <target> Flash Programmer Task Editor Window
9. Click Add Device from the Flash Devices group to add a new hardware device.
The Add Device dialog box appears with a list of supported devices.
a. Select the specific device from the list.
b. Change the device’s memory organization (if required).
NOTE
To change the device memory organization, click the adjacent value in the
Organization column. Click the
icon, and select the required
organization.
c. Click Add Device.
You get a popup with a status that the device is added.
Microcontrollers V10.x Targeting Manual
633
DRAFT
Common Connection Features
Working with Flash Programmer
Figure 10.9 Add Device Dialog Box - Popup with Status
d. You can select other devices, if required.
e. Click Done.
The Add Device dialog box closes. The devices appear in the Flash Devices group
of the <target> Flash Programmer Task editor window.
10. Enter the first address from target memory used by the flash algorithm (running on the
target) in the Address text box of the Target RAM group.
a. Enter the size of the memory that the flash algorithm is allowed to use in the Size
text box.
b. Check the Verify Target Memory Writes checkbox to verify all write operations
to the hardware RAM during Flash programming.
11. From the Flash Programmer Actions group, you can use any of the buttons listed in
Table 10.1 to add various Flash Programmer actions.
634
Microcontrollers V10.x Targeting Manual
DRAFT
Common Connection Features
Quick Access to Target Tasks
Table 10.1 Task Actions and Sequence Organization
Button
Usage
Add Erase / Blank Check Action
Lets you add erase or blank check actions
for flash devices
Add Program / Verify Action
Lets you add program or verify flash actions
for flash devices
Add Checksum Action
Lets you add checksum actions for flash
devices
Add Diagnostics Action
Lets you add a diagnostics action to the
actions table.
Add Dump Flash Action
Lets you dump a portion of the flash or the
entire flash.
Add Protect/Unprotect Action
Lets you modify the protection of a sector.
Remove Action
Lets you remove a sector, a group of sector,
or an entire device from the Flash
Programmer Actions table, depending on
the flash capabilities.
Move Up
Lets you move a selected flash action up in
the Flash Programmer Actions table, so
that it executes before other actions beneath
it in the table.
Move Down
Lets you move a selected flash action down
in the Flash Programmer Actions table, so
that the action executes after other actions
above of it in the table execute.
NOTE
See the Freescale Eclipse Extension Guide for detailed documentation on the
various options available in the Flash Programmer window.
Quick Access to Target Tasks
The Target Task toolbar helps quickly access the Flash Programmer, Hardware
Diagnostics , or Import/Export Memory target tasks. The toolbar is populated with the
last executed target tasks corresponding to the related provider and will give the
possibility to faster execute any of the last executed target tasks.
Microcontrollers V10.x Targeting Manual
635
DRAFT
Common Connection Features
Quick Access to Target Tasks
Target Task Toolbar
Figure 10.10 shows the Target Task toolbar.
Figure 10.10 Target Task Toolbar
Table 10.2 lists the icons available on the Target Task toolbar.
NOTE
The icons provide fast access to the view, import predefined tasks, and execute
recently executed tasks.
Table 10.2 Target Task Toolbar Icons
Option
Description
Enables fast access to the Flash
Programmer target task. It also lets you
access Simple Flash programmer to load
files on target. Refer Fast Access to Flash
Programmer and Tutorial J: Programming
with Simple Flash.
Enables fast access to the Hardware
Diagnostics target task. Refer Fast Access
to Hardware Diagnostics.
Enables fast access to the Import/Export
Memory target task. Refer Fast Access to
Import/Export Memory.
Fast Access to Flash Programmer
The quickly access the Flash Programmer target task, click the
icon.
Table 10.3 lists the available Flash Programmer ptions.
636
Microcontrollers V10.x Targeting Manual
DRAFT
Common Connection Features
Quick Access to Target Tasks
Table 10.3 Flash Programmer Options
Option
Description
Open Flash Programmer
Select to open the Target Tasks view.
Import Flash Task
Select to import a Flash task using the Open
dialog box.
Flash File to Target
Select to flash file using the Simple Flash
dialog box.
Fast Access to Hardware Diagnostics
The quickly access the Hardware Diagnostics target task, click the
icon.
Table 10.4 lists the available Hardware Diagnostics options.
Table 10.4 Hardware Diagnostics Options
Option
Description
Open HW Diagnostic
Select to open the Target Tasks view.
Import HW Diagnostic Task
Select to import a hardware diagnostics task
using the Open dialog box.
Fast Access to Import/Export Memory
The quickly access the Import/Export Memory target task, click the
icon.
Table 10.4 lists the available Import/Export Memory options.
Table 10.5 Import/Export Memory Options
Option
Description
Open Import Export Memory
Select to open the Target Tasks view.
Import IEM Task
Select to import a import/export memory task
using the Open dialog box.
Microcontrollers V10.x Targeting Manual
637
DRAFT
Common Connection Features
Flash Programmer Tutorials
Flash Programmer Tutorials
This topic consists of two tutorials that demonstrate how to import and execute predefined target tasks. Additionally, there are tutorials on how use the <target> Flash
Programmer Task editor window to create tasks, such as erasing on-chip memory, or
downloading a file, and writing it into flash memory.
NOTE
The Flash Programmer for RS08 works only if OSBDM connection is used.
The tutorials include:
• Tutorial A: Import and Execute HCS08 Flash Task
• Tutorial B: Import and Execute ColdFire Flash Task
• Tutorial C: Create Erase Memory Task for HCS08
• Tutorial D: Create Erase Flash Memory Task for ColdFire
• Tutorial E: Create Download Program Task for ColdFire
• Tutorial F: Create and Execute Diagnostics Action Task
• Tutorial G: Dump Entire Flash
• Tutorial H: Change Protection of Sector
• Tutorial I: Fast Access to Target Tasks Editors
• Tutorial J: Programming with Simple Flash
Tutorial A: Import and Execute HCS08
Flash Task
The goal of this tutorial is to select and import a pre-defined task that erases and programs
the flash memory in a DEMOS908QG8, an evaluation board based on a Freescale
MC9S08QG8 microcontroller.
Import HCS08 Program Flash Task
NOTE
TIP
638
This procedure assumes that you have already created a project named
DEMO9S08QG8_test. It also assumes that you have created other tasks,
such that the Target Tasks view is visible.
If it is not visible, perform the steps in the Working with Flash Programmer topic
to open the Target Tasks view.
Microcontrollers V10.x Targeting Manual
DRAFT
Common Connection Features
Flash Programmer Tutorials
After you have launched CodeWarrior and connected the DEMOS908QG8 board to the
workstation using a USB cable, perform these steps.
1. Go to the Target Tasks view in either the C/C++ or Debug perspective.
2. Right-click on this view and select Import. Alternatively, click the
Target Tasks view toolbar.
icon on the
The Open dialog box appears.
3. Navigate to CWInstallDir/MCU_version/bin/plugins/support/
TargetTask/Flash_Programmer/HC08 and select the XML file for the
board’s microcontroller. For this tutorial, select MC9S08QG8.xml.
4. Click Open.
The MC9S08QG8 task appears in the Target Tasks view.
5. Double-click on the MC9S08QG8 task to examine its contents.
The <target> Flash Programmer Task editor window appears, and displays the
memory settings and actions for the task (Figure 10.11). Notice the actions to erase,
program, and verify the contents of flash memory in the Flash Programmer Actions
group. These actions execute in the order as they are displayed in the table, from top to
bottom.
Figure 10.11 Memory Settings and Actions for MC9S08QG8 Task
Microcontrollers V10.x Targeting Manual
639
DRAFT
Common Connection Features
Flash Programmer Tutorials
Execute MC9S08QG8 Task
To execute the task, perform these steps.
1. Right-click on the MC9S08QG8 task.
2. Select Execute. Alternatively, select the MC9S08QG8 task and click the Execute icon
on the Target Tasks view toolbar.
CodeWarrior establishes contact with the DEMOS908QG8 board, erases the
microcontroller’s flash memory, downloads the code, and verifies that the contents of
flash match those of the file.
Congratulations! You have selected and used a target task that erased and programmed the
flash memory on the MC9S08QG8 microcontroller.
Tutorial B: Import and Execute ColdFire
Flash Task
The goal of this tutorial is to to select and import a pre-defined task that erases and then
programs the flash memory in a board based on the ColdFire MCF5213 microcontroller.
Import MCF5213 Program Flash Task
NOTE
This tutorial assumes that you have already built a ColdFire project with the
name ColdFire_test. It also assumes that you have previously created
other tasks, so that the Target Tasks view is visible. If it is not visible, perform
the steps in the Working with Flash Programmer topic to open the Target
Tasks view.
After you have connected an MCF5213-based evaluation board to the workstation with a
USB cable, perform these steps.
1. Go to the Target Tasks view in either the C/C++ or Debug perspective.
2. Right-click on this view and select Import. Alternatively, click the
Target Tasks view toolbar.
icon on the
The Open dialog box appears.
3. Navigate to CWInstallDir/MCU_version/bin/plugins/support/
TargetTask/Flash_Programmer/ColdFire and select the XML file for the
board’s microcontroller. For this tutorial, select MCF5213_INTFLASH.xml.
4. Click Open.
The MCF5213_INTFLASH task appears in the Target Tasks view.
640
Microcontrollers V10.x Targeting Manual
DRAFT
Common Connection Features
Flash Programmer Tutorials
5. Double-click on the MCF5213_INTFLASH task to examine its contents.
The <target> Flash Programmer Task editor window appears, and displays the
memory settings and actions for the task (Figure 10.12). Notice the actions to erase,
program, and verify the contents of flash memory in the Flash Programmer Actions
group. These actions execute in the order as they are displayed in the table, from top to
bottom.
Figure 10.12 Memory Settings and Actions for the MCF5213_INTFLASH Task
Execute MCF5213_INTFLASH Task
To execute the task, perform these steps.
1. Right-click on the MCF5213_INTFLASH task.
2. Select Execute. Alternatively, select the MCF5213_INTFLASH task and click the
Execute icon
on the Target Tasks view toolbar.
CodeWarrior establishes contact with the MCF5213-based board board, erases the
microcontroller’s flash memory, downloads the code, and verifies that the contents of
flash match those of the file.
Microcontrollers V10.x Targeting Manual
641
DRAFT
Common Connection Features
Flash Programmer Tutorials
Congratulations! You have selected and used a target task that erased and programmed the
flash memory on the MCF5213 microcontroller.
Tutorial C: Create Erase Memory Task for
HCS08
The goal of this tutorial is to demonstrate how to create a task that erases the flash memory
in a DEMOS908QG8, an evaluation board based on a Freescale MC9S08QG8
microcontroller.
Set Up HCS08 Erase Task
NOTE
This procedure assumes that you have already created a project named
DEMO9S08QG8_test. It also assumes that you have previously created other
tasks, so that the Target Tasks view is visible. If it is not visible, perform the
steps in the Working with Flash Programmer topic to open the Target Tasks
view.
After you have launched CodeWarrior and connected the DEMOS908QG8 board to the
host system using a USB cable, perform these steps.
1. Go to the Target Tasks view in either the C/C++ or Debug perspective.
2. Right-click on this view and select New Task.
The Create New Target Task wizard appears.
3. In the Task Name text box, enter the name of the target task. For example, enter
Erase Flash DEMO9S08QG8.
4. From the Run Configuration drop-down list, select a run configuration. For example,
select DEMO9S08QG8_test - HCS08 - MC9S08AC128 - PnE
Multilink_Cyclone PRO TCP-IP .
5. From the Task Type drop-down list, select Flash Programmer for HCS08/
ColdFire V1 from the listbox.
The dialog box should appear as in Figure 10.13.
642
Microcontrollers V10.x Targeting Manual
DRAFT
Common Connection Features
Flash Programmer Tutorials
Figure 10.13 Task Settings for Erasing Flash on MC9S08QG8
6. Click Finish to create the task.
The <target> Flash Programmer Task editor window appears, as shown in Figure
10.14.
Microcontrollers V10.x Targeting Manual
643
DRAFT
Common Connection Features
Flash Programmer Tutorials
Figure 10.14 <target> Flash Programmer Task Editor Window to Erase HCS08 Flash
7. Click Add Device.
The Add Device dialog box appears (Figure 10.15).
644
Microcontrollers V10.x Targeting Manual
DRAFT
Common Connection Features
Flash Programmer Tutorials
Figure 10.15 Add Device for HCS08 Derivative
8. Scroll through the list of microcontroller derivatives and select MC9S08QG8_FLASH.
You can also type the filter text in the given text box.
9. Click Add Device.
10. Click Done.
You return to the <target> Flash Programmer Task editor window, with the selected
device appearing in the Flash Devices group. The Target RAM group displays the
start address of RAM memory, and its size.
11. Click Add Erase / Blank Check Action.
The Add Erase / Blank Check Action dialog box appears. It displays the flash
devices added in the task and their base addresses.
12. Click Add Erase Action.
13. Click Done.
You return to the <target> Flash Programmer Task editor window, and the action
appears in the Flash Programmer Actions group (Figure 10.15).
Microcontrollers V10.x Targeting Manual
645
DRAFT
Common Connection Features
Flash Programmer Tutorials
Figure 10.16 <target> Flash Programmer Task Editor Window Settings for
DEMO9S08QG8
14. Click the
icon to save the settings and close the <target> Flash Programmer Task
editor window.
You can access the newly-made Erase Flash DEMO9S08QG8 task from the
Target Tasks view.
Execute HCS08 Erase Task
To erase the Flash memory on the MC9S08QG8, you use the Erase Flash
DEMO9S08QG8 task that you made in the previous topic.
To execute the task and erase the memory, perform these steps.
1. Go the Target Tasks view and right-click on the Erase Flash DEMO9S08QG8
task.
2. Select Execute. Alternatively, select the Erase Flash DEMO9S08QG8 task and
click the Execute icon
on the Target Tasks view toolbar.
3. In the Console view, status messages appear as the IDE connects to the board and
erases the memory.
646
Microcontrollers V10.x Targeting Manual
DRAFT
Common Connection Features
Flash Programmer Tutorials
Congratulations! You have erased the on-chip Flash memory in the DEMO9S08QG8
board’s microcontroller.
Tutorial D: Create Erase Flash Memory
Task for ColdFire
The goal of this tutorial is to demonstrate how to use the <target> Flash Programmer
Task editor window to create a task that erases specific topics of Flash memory in a
ColdFire MCF5213.
Set Up ColdFire Erase Task
NOTE
This tutorial assumes that you have already built a ColdFire project with the
name ColdFire_test. It also assumes that you have previously created
other tasks, so that the Target Tasks view is visible. If it is not visible, perform
the steps in the Working with Flash Programmer topic to open the Target
Tasks view.
After you have connected an MCF5213-based evaluation board to the workstation with a
USB cable, perform these steps.
1. Go to theTarget Tasks view in either the C/C++ or Debug perspective.
2. Right-click on this view and select New Task.
The Create New Target Task wizard appears.
3. In the Task Name text box, enter the name of the target task. For example, enter
Erase portion of Flash.
4. From the Run Configuration drop-down list, select a run configuration. For example,
select ColdFire_test - MCF52213 Internal Flash - Freescale
USB-TAP BDM.
5. From the Task Type drop-down list, select Flash Programmer for ColdFire
V234 from the listbox.
The Create New Target Task wizard should appear as in Figure 10.17.
Microcontrollers V10.x Targeting Manual
647
DRAFT
Common Connection Features
Flash Programmer Tutorials
Figure 10.17 Task Settings for Erasing Flash on MCF5213
6. Click Finish to create the task.
The <target> Flash Programmer Task editor window appears, as shown in Figure 10.18.
648
Microcontrollers V10.x Targeting Manual
DRAFT
Common Connection Features
Flash Programmer Tutorials
Figure 10.18 <target> Flash Programmer Task Editor Window
7. Click Add Device.
The Add Device dialog box appears (Figure 10.19).
Microcontrollers V10.x Targeting Manual
649
DRAFT
Common Connection Features
Flash Programmer Tutorials
Figure 10.19 Add Device for ColdFire Derivative
8. Scroll through the list of microcontroller derivatives and select CFM_MCF5213.
9. Click Add Device.
10. Click Done.
You return to the <target> Flash Programmer Task editor window, with the selected
device appearing in the Flash Devices group.
11. Click Add Erase / Blank Check Action.
The Add Erase / Blank Check Action dialog box appears. It displays the the flash
devices and their addresses.
12. In the Sectors group, click on the desired start address of the flash memory, then shiftclick on the end address to select all of the sectors of Flash memory you want erased
(Figure 10.20).
650
Microcontrollers V10.x Targeting Manual
DRAFT
Common Connection Features
Flash Programmer Tutorials
Figure 10.20 Add Erase / Blank Action Dialog Box for ColdFire
13. Click Add Erase Action.
14. Click Done.
NOTE
To erase of all Flash memory at the same time, check Erase All Sectors Using
Chip Erase Command.
You return to the <target> Flash Programmer Target editor window, and the action
appears in the Flash Programmer Actions group.
15. To allocate a buffer of RAM to hold the erasure algorithm.
a. Enter the start address of the RAM buffer in Address text box of the Target RAM
group.
b. In the Size option, enter the amount of RAM that makes up the buffer.
c. Check the Verify Target Memory Writes checkbox. For this example, the start
address of the buffer was 0X20000000, and its size was 0X00008000.
The Target RAM group displays the start address of the RAM memory buffer, and
its size (Figure 10.21).
Microcontrollers V10.x Targeting Manual
651
DRAFT
Common Connection Features
Flash Programmer Tutorials
Figure 10.21 Flash Programmer Task Editor Window with ColdFire Erase Settings
16. Click the
icon to save the settings and close the <target> Flash Programmer Task
editor window.
You can access the newly-made Erase portion of Flash task from the Target
Tasks view.
Execute ColdFire Erase Task
To erase the Flash memory on the MCF5213, you use the task that you made in the
previous topic.
To execute the task, perform these steps.
1. Go the Target Tasks view.
2. Right-click on the Erase portion of Flash task.
652
Microcontrollers V10.x Targeting Manual
DRAFT
Common Connection Features
Flash Programmer Tutorials
3. Select Execute. Alternatively, click the Execute icon
toolbar.
on the Target Tasks view
In the Console view, status messages appear as the IDE connects to the board and
erases the flash memory.
You have erased the selected on-chip Flash memory sectors in the MCF5123
microcontroller.
Tutorial E: Create Download Program Task
for ColdFire
The goal of this tutorial is to demonstrate how to create a task that downloads a program
into the ColdFire microcontroller’s flash memory before being debugged.
Set Up Download Task
NOTE
This tutorial assumes that you have already built a ColdFire project with the
name ColdFire_test. It also assumes that you have created the Erase
portion of Flash task from the previous tutorial.
WARNING!
To avoid the microcontroller getting caught in an indeterminant state, it
is important that its flash memory be erased before attempting to
program it. The erase memory action of this task will erase the
microcontroller’s flash memory before the second action, created in this
topic, downloads a program into it. Do not attempt to program flash
memory without erasing it first.
After you have connected an MCF5213-based evaluation board to the workstation with a
USB cable, perform these steps.
1. Go to the Target Tasks view in either the C/C++ or Debug perspective.
2. Right-click on this view and double-click on the task Erase portion of Flash
that you made in the previous topic.
The ColdFire V234 Flash Programmer Task editor window appears (Figure 10.22).
Microcontrollers V10.x Targeting Manual
653
DRAFT
Common Connection Features
Flash Programmer Tutorials
Figure 10.22 Task Settings for Erasing Memory on MCF5213
3. Allocate a buffer of RAM that holds the programming algorithm, along with any
program code as it is written into flash.
a. Enter the start address of the RAM buffer in Address text box of the Target RAM
group.
b. In the Size text box, enter the amount of RAM that makes up the buffer.
c. Check the Verify Target Memory Writes option. For this example, the start
address of the buffer was 0X20000000, and its size was 0X00008000.
NOTE
Since this configuration was taken care of when the Erase action was set up,
you do not have to enter anything for this step. However, it is described here
for the sake of completeness.
The Target RAM group displays the start address of the RAM memory buffer, and its
size.
654
Microcontrollers V10.x Targeting Manual
DRAFT
Common Connection Features
Flash Programmer Tutorials
4. Click Add Program / Verify Action.
The Add Program / Verify Action dialog box appears, with the ColdFire device
selected.
5. Check Use File from Launch Configuration to use the default .elf file made by the
project (Figure 10.23).
Figure 10.23 Adding File to Add Program / Verify Action Dialog Box
6. Click Add Program Action.
7. Click Done.
You return to the <target> Flash Programmer Target editor window, with the
program action appearing in the Flash Programmer Actions group (Figure 10.24).
NOTE
If you want to download a file other than the launch configuration’s default
file, click on the Workspace, File System, or Variables button and navigate to
the file.
Microcontrollers V10.x Targeting Manual
655
DRAFT
Common Connection Features
Flash Programmer Tutorials
Figure 10.24 Settings for Downloading Program to ColdFire Microcontroller
8. Click the
icon to save the settings and close the <target> Flash Programmer Task
editor window.
The revised Erase portion of Flash task is available from the Target Tasks
view.
Execute ColdFire Program Task
To execute this task, perform these steps.
1. Go the Target Tasks view and right-click on the MCF5213_INTFLASH task.
2. Select Execute. Alternatively, select the MCF5213_INTFLASH task and click the
Execute icon
on the Target Tasks view toolbar.
3. In the Console view, status messages appear as the IDE connects to the board and
erases the memory.
Congratulations! You have erased the on-chip Flash memory in the DEMO9S08QG8
board’s microcontroller.
656
Microcontrollers V10.x Targeting Manual
DRAFT
Common Connection Features
Flash Programmer Tutorials
Tutorial F: Create and Execute Diagnostics
Action Task
The goal of this tutorial is to demonstrate the steps to create and execute the diagnostics
action using the flash programmer.
Set Up Diagnostics ActionTask
NOTE
This procedure assumes that you have imported a pre-defined Flash
Programmer task in the Target Tasks view. It also assumes that you have
previously created other tasks, so that the Target Tasks view is visible. If it is
not visible, perform the steps in the Working with Flash Programmer topic to
open the Target Tasks view.
After you have launched CodeWarrior and connected the M52277EVB_SPI board to the
host system using a USB cable, perform these steps.
1. Go to the Target Tasks view in either the C/C++ or Debug perspective.
2. Right-click in the Target Tasks view and select Import. Alternatively, click the
icon on the Target Tasks view toolbar.
The Open dialog box appears.
3. Navigate to the pre-defined tasks folder at <CW MCU
install>\MCU_10.0\bin\plugins\support\TargetTask\Flash_Pr
ogrammer\ and select the desired .xml file for your hardware target. For example,
select M52277EVB_SPI.xml.
4. Click Open.
The selected task appears in the Target Tasks view (Figure 10.25).
Figure 10.25 Pre-defined Task in Target Tasks View
NOTE
The predefined erase/program tasks are not mandatory for diagnostics.
Microcontrollers V10.x Targeting Manual
657
DRAFT
Common Connection Features
Flash Programmer Tutorials
5. Right-click on the task’s name and select Execute.
The task’s Flash Programmer actions execute in sequence. First, they erase the
hardware target’s flash memory. Next, they check whether the flash is correctly
erased. If true, they program the file’s code into the flash and check if it programmed
without errors.
NOTE
When a predefined flash programmer task is imported, its Run Configuration
is set as Active Debug Context. If the task is imported without any active
debug session, then the
icon will be disabled as in Figure 10.25. Associate
the selected target task to a different Run Configuration to enable the
icon.
6. Double-click on the task name, to examine the task stored Flash Programmer actions.
The <target> Flash Programmer Task editor window appears, as shown in Figure
10.26.
Figure 10.26 <target> Flash Programmer Task Editor Window
7. Click Add Diagnostics Action.
The Add Diagnostics Action dialog box appears (Figure 10.27). It displays the the
flash devices and the base addresses.
658
Microcontrollers V10.x Targeting Manual
DRAFT
Common Connection Features
Flash Programmer Tutorials
NOTE
The full diagnostics does the same thing as diagnostics but also prints the blank
status for sectors. It can take significantly longer to complete.
NOTE
If more than one flash is available in Flash Devices table, the Add Diagnostics
Action table lets you select the flash where you want to run the diagnostics.
Figure 10.27 Add Diagnostics Action Dialog Box
8. Check the Perform Full Diagnostics checkbox if you want to perform complete
diagnostics on the selected flash device.
9. Click the Add Diagnostics Actions button (Figure 10.27).
You get a popup with a status that the device is added (Figure 10.28).
Figure 10.28 Add Diagnostics Actions Dialog Box — Popup with Status
Microcontrollers V10.x Targeting Manual
659
DRAFT
Common Connection Features
Flash Programmer Tutorials
10. Click Done.
The Add Diagnostics Action dialog box closes. The action appears in the Flash
Programmer Actions table of the <target> Flash Programmer Task editor window
(Figure 10.29).
Figure 10.29 Flash Programmer Actions Table
Execute Diagnostics Action Task
To execute the task, perform these steps.
1. Right-click on the M52277EVB_SPI task.
2. Select Execute. Alternatively, select the M52277EVB_SPI task and click the
Execute icon
on the Target Tasks view toolbar.
CodeWarrior establishes contact with the M52277EVB_SPI board, erases the
microcontroller’s flash memory, downloads the code, verifies, and diagnoses the
contents on M52277EVB_SPI.
You have created and executed a diagnostic action task on the M52277EVB_SPI
microcontroller.
Tutorial G: Dump Entire Flash
The goal of this tutorial is to demonstrate how to dump selected sectors of a flash device or
the entire flash device.
To add a dump flash action:
1. Click the Dump Flash Action button.
The Add Dump Flash Action dialog box (Figure 10.30) appears.
660
Microcontrollers V10.x Targeting Manual
DRAFT
Common Connection Features
Flash Programmer Tutorials
Figure 10.30 Add Dump Flash Action Dialog Box
2. Specify the file name in the File text box. The flash is dumped in this selected file.
3. Select the file type from the File Type drop-down list. You can select any one of the
following file types:
• Srec — Saves files in Motorola S-record format.
• Binary — Saves files in binary file format.
4. Specify the memory range for which you want to add dump flash action.
• Type the start address of the range in the Start text box.
• Type the end address of the range in the End text box.
5. Click Add Dump Flash Action.
6. Click Done.
The Add Dump Flash Action dialog box closes and the added dump flash action
appear in the Flash Programmer Actions table in the Flash Programmer Task
editor window (Figure 10.31).
Figure 10.31 Added Dump Flash Actions
Tutorial H: Change Protection of Sector
The goal of this tutorial is to demonstrate how to protect / unprotect actions enable you to
change the protection of a sector in the flash device.
To add a protect / unprotect action:
Microcontrollers V10.x Targeting Manual
661
DRAFT
Common Connection Features
Flash Programmer Tutorials
1. Click the Add Protect/Unprotect Action button.
The Add Protect/Unprotect Action dialog box (Figure 10.32) appears.
Figure 10.32 Add Protect / Unprotect Action Dialog Box
2. Select a sector from the Sectors table and click the Add Protect Action button to add
a protect operation on the selected sector.
NOTE
Press CTRL or SHIFT keys for selecting multiple sectors from the Sectors
table.
3. Click the Add Unprotect Action button to add an unprotect action on the selected
sector.
NOTE
Check the All Device checkbox to add action on full device.
4. Click Done.
The Add Protect/ Unprotect Action dialog box closes and the added protect or
unprotect actions appear in the Flash Programmer Actions table in the Flash
Programmer Task editor window (Figure 10.33).
662
Microcontrollers V10.x Targeting Manual
DRAFT
Common Connection Features
Flash Programmer Tutorials
Figure 10.33 Protect / Unprotect Action
Tutorial I: Fast Access to Target Tasks
Editors
The goal of this tutorial is to demonstrate managing and fast accessing of the target tasks'
editors used by the Target Task framework.
You can access target tasks by:
• Editing tasks in a project. Refer Editing Tasks in Project.
• Editing tasks imported in aprevious session. Refer Editing Tasks Imported in
Previous Session.
• Storing task to a file. Refer Storing Task to File.
Editing Tasks in Project
NOTE
Before editing ensure that the target task has been added to the project by a
wizard or another method and has an extension recognized by the feature (.ttf).
To edit tasks in a project:
1. Double-click on the file in the project.
2. The appropriate task editor appears.
3. The task is imported in the Target Task Framework.
Editing Tasks Imported in Previous Session
NOTE
Before editing ensure that a target task has been imported and the previous
Eclipse session has been closed.
To edit tasks imported in a previous session:
Microcontrollers V10.x Targeting Manual
663
DRAFT
Common Connection Features
Flash Programmer Tutorials
1. Open the Target Tasks view.
2. Double-click to open the desired task.
The target task editor appears.
3. Make the appropriate changes and close the target task editor.
NOTE
Changing the task will also save changes to the file in the project. The save is
done to the file in project only if the task has been imported from a project
(with double click). Otherwise, it will prompt to save the file.
Storing Task to File
NOTE
Before storing the task ensure that the target task has been imported or created
and appropriate changes have been made.
To store task to a file:
1. Open the Target Tasks view.
2. Double-click to open the desired task.
The target task editor appears.
3. Make the appropriate changes and save the target task.
The Store Task dialog box appears (Figure 10.34) .
Figure 10.34 Store Task Dialog Box
4. Select the Save to File option.
664
Microcontrollers V10.x Targeting Manual
DRAFT
Common Connection Features
Flash Programmer Tutorials
5. In the Task Path text box, specify the path where you want to store the task. You can
use the Workspace, File System, or Variables buttons to navigate to the desired
location.
6. From the Project drop-down list select the project where you want to store you target
task.
NOTE
Check the Do not ask me again for this task checkbox to save these settings
for the current target task.
7. Click OK.
The dialog box closes and associates the file to the specified project and saves in target
task framework and not necessarily in the project.
NOTE
The above mentionde feature has a preference that will not display the save as
dialog and always save in target task framework. The settings are located in
Windows > Preferences > C/C++ >Debug > CodeWarrior Debugger >
Show "Save As" dialog when saving a new task.
Tutorial J: Programming with Simple Flash
The goal of this tutorial is to demonstrate the use of CodeWarrior Simple Flash
Programmer. This feature enables you to perform these basic flash operations:
• Erasing Flash Device
• Programming a File
To open the Simple Flash dialog box:
1. Click the Flash Programmer icon on the IDE toolbar (Figure 10.36).
Figure 10.35 Flash Programmer Icon
2. Select Flash File to Target.
The Simple Flash dialog box appears (Figure 10.36).
Microcontrollers V10.x Targeting Manual
665
DRAFT
Common Connection Features
Flash Programmer Tutorials
Figure 10.36 Simple Flash Dialog Box
• Run Configuration drop-down list — Lists all run configurations defined in
Eclipse. If a connection to the target has already been made the control becomes
inactive and contains the text Active Debug Configuration.
• Flash Configuration drop-down list — Lists predefined target tasks for the
processor selected in the Launch Configuration and tasks added by user with the
Browse button. The values in this drop-down list are updated based on the processor
selected in the launch configuration. For more information on launch configurations,
see <product> targeting manual.
• File Options group — Allows selecting the file to be programmed on the flash
device and the location.
– File text box — Enables you to specify the filename. You can use the
Workspace, File System, or Variables buttons to select the desired file.
– Offset text box — Enables you to specify offset location for a file. If no offset is
specified the default value of zero is used. The offset is always added to the start
address of the file. If the file doesn't contain address information then zero is
considered as start address.
• Erase Device button — Erases the flash device. In case you have multiple flash
blocks on the device, all blocks are erased. If you want to selectively erase or
program blocks, use the Flash Programmer feature.
• Program with Erase button — Erases the sectors that are occupied with data and
then programs the file. If the flash device can not be accessed at sector level then the
flash device is completely erased.
Erasing Flash Device
To erase a flash device, follow these steps:
666
Microcontrollers V10.x Targeting Manual
DRAFT
Common Connection Features
Flash Programmer Tutorials
1. Click the Flash Programmer icon on the IDE toolbar (Figure 10.37).
Figure 10.37 Flash Programmer Icon
2. Select Flash File to Target.
3. The Simple Flash dialog box appears (Figure 10.37).
4. Select a run configuration from the Run Configuration drop-down list.
NOTE
If a connection is already established with the target, this control is disabled.
The Flash Configuration drop-down list is updated with the supported configurations
for the processor from the launch configuration.
5. Select a flash configuration from the Flash Configuration drop-down list.
6. Click the Erase Device button.
Programming a File
1. Click the Flash Programmer icon on the IDE toolbar (Figure 10.38).
Figure 10.38 Flash Programmer Icon
2. Select Flash File to Target.
3. The Simple Flash dialog box appears (Figure 10.36).
4. Select a run configuration from the Run Configuration drop-down list.
NOTE
If a connection is already established with the target, this control is disabled.
The Flash Configuration drop-down list is updated with the supported configurations
for the processor from the launch configuration.
5. Select a flash configuration from the Flash Configuration drop-down list.
Microcontrollers V10.x Targeting Manual
667
DRAFT
Common Connection Features
Working with Hardware Diagnostics Window
6. Type the file name in the File text box. You can use the Workspace, File System, or
Variables buttons to select the desired file.
7. Type the offset location in the Offset text box.
8. Click the Program with Erase button.
Tutorial K: Exporting Target Tasks
The goal of this tutorial is to demonstrate how to export a target task to an external file.
To export a target task:
1. Select the target task in the Target Task view.
2. Click the Export button from the Target Task view toolbar. Alternatively, right-click
the target task and select Export from the context menu.
The Save As dialog box appears.
3. Type a file name in the File name drop-down list.
4. Click Save.
The exported task is stored in XML format.
Working with Hardware Diagnostics
Window
The Hardware Diagnostics window lets you run a series of diagnostic tests that
determine if the basic hardware is functional.
These tests include:
• Memory read/write — Makes a read / write access to memory in order to read or
write a byte, word (2 bytes), and long word (4 bytes) to / from memory.
• Scope loop — Makes read and write accesses to memory in a loop at target address.
The the loop speed settings determine the time between accesses. The loop can only
be stopped by cancelling the test.
• Memory tests — Requires you to set the access size and target address from the
access settings group and the settings present in the Memory Tests group.
On the Eclipse IDE, the hardware diagnostics feature runs like a target task.
To create a hardware diagnostic target task:
1. Click Window > Show View > Other.
The Show View dialog box appears.
2. Expand the Debug group and select Target Tasks.
668
Microcontrollers V10.x Targeting Manual
DRAFT
Common Connection Features
Working with Hardware Diagnostics Window
3. Click OK.
4. Click
from the Target Tasks view toolbar to create a new target task.
The Create New Target Task wizard appears.
5. In the Task Name text box, enter the name of the target task.
6. From the Run Configuration drop-down list, select a configuration.
NOTE
Select Active Debug Context from the Run Configuration drop-down list, if
you want to use hardware diagnostics over an active debugger session, else
select any of the specified debug context from the list.
7. From the Task Type drop-down list, select Hardware Diagnostic.
8. Click Finish.
The Hardware Diagnostics Action window appears as seen in Figure 10.39.
Figure 10.39 Hardware Diagnostics Action Window
The Hardware Diagnostics Action window includes the following groups:
• Action Type — Used to set various action types. The options you select in this group
enables the options in the other groups of the window.
Microcontrollers V10.x Targeting Manual
669
DRAFT
Common Connection Features
Manipulating Target Memory
• Memory Access — Configures diagnostic tests for performing memory reads and
writes over the remote connection interface.
• Loop Speed — Configures diagnostic tests for performing repeated memory reads
and writes over the remote connection interface.
• Memory Tests — Configures the memory tests that you can run on the target.
NOTE
The Use Target CPU group appears grayed-out and is not applicable for the
HCS08 and RS08 Target Tasks.
NOTE
See the Freescale Eclipse Extensions Guide for detailed documentation of the
various options available in the Hardware Diagnostics Action window.
Manipulating Target Memory
You can manipulate the target's memory in these ways:
• Import — Read encoded data from a specified file, decode that data into a specific
format, and copy the decoded data into a specified memory range. For information,
refer Creating Target Task to Import Memory.
• Export — Read data from a specified memory range, encode that data in a specific
format, and store the encoded data in an output file. For information, refer Creating
Target Task to Export Memory.
• Fill — Fill a specified memory range with a specific data pattern. For information,
refer Fill Memory with Data Pattern.
Creating Target Task to Import Memory
Perform these steps to create a target task to import memory:
1. Select Window > Show View > Other.
The Show View dialog box appears.
2. From the Debug group, select Target Tasks.
The Target Tasks view appears (Figure 10.40)
670
Microcontrollers V10.x Targeting Manual
DRAFT
Common Connection Features
Manipulating Target Memory
Figure 10.40 Target Tasks View
3. Right-click in the Target Tasks view and select New Task from the context menu.
The Create New Target Task wizard appears (Figure 10.41).
4. In the Task Name text box, enter a name for the new task. For example,
Importing_Memory.
5. Use the Run Configuration list box to specify the configuration that the task launches
and uses to connect the target. For example, select Active Debug Context.
NOTE
If the task does not successfully launch the configuration that you specify, the
Execute button of the Target Tasks view toolbar stays disabled.
6. From the Task Type list box, select Import/Export/Fill Memory.
Figure 10.41 Create New Target Task Wizard
Microcontrollers V10.x Targeting Manual
671
DRAFT
Common Connection Features
Manipulating Target Memory
7. Click Next.
The Select the task type page (Figure 10.42) of the Configure Import/Export
Memory task dialog box appears.
8. Select Import data from a file into memory task type option.
Figure 10.42 Create New Target Task Wizard — Select Task Type
9. Click Next.
The Import data from a file into memory page (Figure 10.43) of the Configure
Import/Export Memory task dialog box appears. This page lets you read encoded
data from a user specified file, decode it, and copy it into a user specified memory
range.
672
Microcontrollers V10.x Targeting Manual
DRAFT
Common Connection Features
Manipulating Target Memory
Figure 10.43 Import data from a file into memory Page
10. Specify options as explained in Table 10.6.
NOTE
CodeWarrior IDE validates information as you enter it. If there are errors, a
message appears near the page title.
Table 10.6 Import Data from a File into memory Page Options
Item
Description
Memory space and
address
Enter the literal address and memory space on which the data
transfer is performed.
The Literal address field allows only decimal and hexadecimal
values.
Expression
Enter the memory address or expression at which the data
transfer starts.
Offset
Enter an value to offset addresses contained in Motorola SRecord and Annotated Hex Text data formats.
The field remains disabled for all other data formats.
Number of Elements
Enter the total number of elements to be transferred.
Microcontrollers V10.x Targeting Manual
673
DRAFT
Common Connection Features
Manipulating Target Memory
Table 10.6 Import Data from a File into memory Page Options (continued)
Item
Description
Access size
Denotes the number of addressable units of memory that the
debugger accesses in transferring one data element.
The default values shown are 1, 2, 4, and 8 units. When target
information is available, this list shall be filtered to display the
access sizes that are supported by the target.
File type
Defines the format in which the wizard encodes the data it
imports. By default, the following file types are supported:
• Annotated Hex Text
• Hex Text
• Motorola S-Record
• Raw Binary
• Signed Decimal Text
• Unsigned decimal Text
Input File
Enter the path to the file that contains the data to be imported.
Click the Browse button to select the import file through the
standard File Open dialog box.
Verify Memory Writes
Check the option to verify success of each data write to the
memory.
11. Click Finish.
CodeWarrior IDE saves your changes, closes the Configure Import/Export Memory
task wizard, and displays the newly created import task in the Tasks list of the Target
Tasks view.
NOTE
Alternatively, click Finish and Execute to save your changes and execute the
newly created import task immediately.
Creating Target Task to Export Memory
Perform these steps to create a target task to export memory:
1. Select Window > Show View > Other.
The Show View dialog box appears.
674
Microcontrollers V10.x Targeting Manual
DRAFT
Common Connection Features
Manipulating Target Memory
2. From the Debug group, select Target Tasks.
The Target Tasks view appears (Figure 10.44)
Figure 10.44 Target Tasks View
3. Right-click in the Target Tasks view and select New Task from the context menu.
The Create New Target Task wizard appears (Figure 10.45).
4. In the Task Name text box, enter a name for the new task. For example,
Exporting_Memory.
5. Use the Run Configuration list box to specify the configuration that the task launches
and uses to connect the target. For example, Active Debug Context.
NOTE
If the task does not successfully launch the configuration that you specify, the
Execute button of the Target Tasks view toolbar stays disabled.
6. From the Task Type list box, select Import/Export/Fill Memory.
Microcontrollers V10.x Targeting Manual
675
DRAFT
Common Connection Features
Manipulating Target Memory
Figure 10.45 Create New Target Task Wizard
7. Click Next.
The Select the task type page (Figure 10.46) appears.
8. Select Export data from memory into a file task type option.
Figure 10.46 Create New Target Task Wizard — Select Task Type
676
Microcontrollers V10.x Targeting Manual
DRAFT
Common Connection Features
Manipulating Target Memory
9. Click Next.
The Export data from memory into a file page (Figure 10.47) appears. This page lets
you read data from a user specified memory range, encode it in a user specified format,
and store this encoded data in a user specified output file.
Figure 10.47 Export data from memory into a file Page
10. Specify options as explained in Table 10.7.
NOTE
CodeWarrior IDE validates information as you enter it. If there are errors, a
message appears near the page title.
Table 10.7 Export Data from Memory into a File Options
Item
Description
Memory space and
address
Enter the literal address and memory space on which the data
transfer is performed.
The Literal address field allows only decimal and hexadecimal
values.
Expression
Enter the memory address or expression at which the data
transfer starts.
Microcontrollers V10.x Targeting Manual
677
DRAFT
Common Connection Features
Manipulating Target Memory
Table 10.7 Export Data from Memory into a File Options
Item
Description
Offset
Enter a value to offset addresses contained in Motorola SRecord and Annotated Hex Text data formats.
The field remains disabled for all other data formats.
Number of Elements
Enter the total number of elements to be transferred.
Access Size
Denotes the number of addressable units of memory that the
debugger accesses in transferring one data element.
The default values shown are 1, 2, 4, and 8 units. When target
information is available, this list shall be filtered to display the
access sizes that are supported by the target.
File Type
Defines the format in which the wizard encodes the data it
imports. By default, the following file types are supported:
• Annotated Hex Text
• Hex Text
• Motorola S-Record
• Raw Binary
• Signed Decimal Text
• Unsigned decimal Text
Output File
Enter the path of the file to which the wizard will write data.
Click the Browse button to save the export file through the
standard File Save As dialog box.
11. Click Finish.
CodeWarrior IDE saves your changes, closes the Configure Import/Export Memory
task wizard, and displays the newly created export task in the Tasks list of the Target
Tasks view.
NOTE
Alternatively, click Finish and Execute to save your changes and execute the
newly created export task immediately.
Fill Memory with Data Pattern
To fill memory with a specified data pattern, perform these steps.
678
Microcontrollers V10.x Targeting Manual
DRAFT
Common Connection Features
Manipulating Target Memory
1. Select Window > Show View > Other.
The Show View dialog box appears.
2. From the Debug group, select Target Tasks.
The Target Tasks view appears (Figure 10.48)
Figure 10.48 Target Tasks View
3. Right-click in the Target Tasks view and select New Task from the context menu.
The Create New Target Task wizard appears as shown in Figure 10.49.
4. In the Task Name text box, enter a name for the new task. For example, Fill Memory.
5. Use the Run Configuration list box to specify the configuration that the task launches
and uses to connect the target. For example, Active Debug Context.
NOTE
If the task does not successfully launch the configuration that you specify, the
Execute button of the Target Tasks view toolbar stays disabled.
6. From the Task Type list box, select Import/Export/Fill Memory.
Microcontrollers V10.x Targeting Manual
679
DRAFT
Common Connection Features
Manipulating Target Memory
Figure 10.49 Create New Target Task Wizard
7. Click Next.
The Select the task type page (Figure 10.50) appears.
8. Select Fill memory with a data pattern task type option.
Figure 10.50 Create New Target Task Wizard — Select Task Type
680
Microcontrollers V10.x Targeting Manual
DRAFT
Common Connection Features
Manipulating Target Memory
9. Click Next.
The Fill memory with a data pattern page (Figure 10.51) appears. This page lets you
fill a user specified memory range with a user specified data pattern.
Figure 10.51 Fill memory with a data pattern Page
10. Specify options as explained in Table 10.8.
NOTE
CodeWarrior IDE validates information as you enter it. If there are errors, a
message appears near the page title.
Table 10.8 Fill memory with a data pattern Page Options
Item
Description
Memory space and
address
Enter the literal address and memory space on which the fill
operation is performed.
The Literal address field allows only decimal and hexadecimal
values.
Expression
Enter the memory address or expression at which the fill
operation starts.
Microcontrollers V10.x Targeting Manual
681
DRAFT
Common Connection Features
Manipulating Target Memory
Table 10.8 Fill memory with a data pattern Page Options
Item
Description
Offset
Enter a value to offset addresses contained in Motorola SRecord and Annotated Hex Text data formats.
The field remains disabled for all other data formats.
Number of Elements
Enter the total number of elements to be modified.
Access Size
Denotes the number of addressable units of memory that the
debugger accesses in modifying one data element.
The default values shown are 1, 2, 4, and 8 units. When target
information is available, this list shall be filtered to display the
access sizes that are supported by the target.
Fill Pattern
Denotes the sequence of bytes, ordered from low to high
memory, the wizard mirrors in the target.
The field accept only hexadecimal values. If the width of the
pattern exceeds the access size, the wizard displays an error
message.
Verify Memory Writes
Check the option to verify success of each data write to the
memory.
11. Click Finish.
CodeWarrior IDE saves your changes, closes the Configure Import/Export Memory
task wizard, and displays the newly created fill task in the Tasks list of the Target
Tasks view.
NOTE
682
Alternatively, click Finish and Execute to save your changes and execute the
newly created fill task immediately.
Microcontrollers V10.x Targeting Manual
DRAFT
Index
Numerics
16-Bit Analog-to-Digital Converter Module 460
A
Abatron Serial 37
Abatron TCP-IP 36
ABI 18
About this Manual 11, 12
Absolute Assembly 28, 51, 60
Access Size 678, 682
Access size 674
Action Type 669
Actions 639
actions 634
Active Debug Contex 679
Active Debug Context 631
active debug session 631
ADC 457
ADC Module Commands 459
ADCLR 458, 459
Add Checksum Action 635
Add Device 633
Add Device f 633
Add Diagnostics Action 635
Add Dump Flash Action 635
Add Erase / Blank Check Action 635
Add Program / Verify Action 635, 655
Add Protect/Unprotect Action 635
ADDI 459, 460
ADDI Command 459
ADDID 460
Additional Include Files (-AddInd) 173, 228
Address 634
algorithm 654
All options 153, 156, 167, 169, 207, 210, 222,
224, 264, 266, 272, 296, 299
Allocate CONST objects in ROM 191, 245
Always Search User Paths (-nosyspath) 273
Microcontrollers V10.x Targeting Manual
Analog-to-Digital Converter Module 457
analysis 627
ANSI startup code 30
Application 270
Apply 90
B
Banked 30
bare board debugging 352
basic 668
Bigraph and trigraph support 177, 233
BlankCheck 627
board 48, 57, 66, 74, 81, 387, 450, 524, 586, 612,
627, 639
bug 11
Build All 87
Build and Launch Configurations 23
Build Automatically 88
Build Project 87
Build Properties 145
HCS08 148, 202
Build Properties for HCS08 146
Build Properties for RS08 146, 257
Building Project 23, 86
Burner 166, 221, 263
C
C 28
C++ comments in ANSI-C 177, 233
C/C++ Build property 146
C/C++ Options 28, 29
change direction 453
Changing Build Properties 146
Checksum 627
Chip View 450, 451
Chip View Display After Change 454
Chip View Display Before Change 454
Clock Generation Module 460, 463
683
DRAFT
Code Generation 168, 181, 194, 223, 237, 249,
265
CodeWarrior 13
CodeWarrior Debugger 19
CodeWarrior documentation 11
CodeWarrior Download configuration 88, 389
CodeWarrior IDE 11
compared to command-line tools 20
standard debugging features 301
CodeWarrior Project View 55, 64, 72, 79
CodeWarrior Projects 54, 63, 71, 78, 450, 524,
586, 612
CodeWarrior Projects View 55, 64, 72, 79
ColdFire 640, 656
ColdFire Build Options 31, 33
ColdFire CPU 258, 259
ColdFire Debug 257
ColdFire derivative 31, 32
ColdFire Linker 262, 265, 266
ColdFire Program 656
Command 153, 156, 167, 169, 207, 210, 222, 224,
264, 266, 272, 296, 299
Command line pattern 153, 156, 167, 169, 207,
210, 222, 224, 264, 266, 272, 296, 299
command-line tools and CodeWarrior IDE
compared 20
Common Connection Features 627
Compile only, So Nt Link (-c) 273
Compiler 271, 272
Configure 672
Configure Import/Export Memory 678, 682
Configure Import/Export Memory task 672
Connections 34, 36, 53, 70, 78, 383
Connections Page 51, 53, 60, 78
Counter 462
Create an MCU 48, 57, 66, 74, 81, 82
Create an MCU Project Page 24
Create Flash Programmer Task 627
Create New Target Task 631, 675, 679
Create New Target Task Wizard 632
Creating C++ Project 46
Creating Project 45
CWInstallDir 13
Cycles Dialog Box with Cleared Counter 462
684
D
Debug 90, 670, 675, 679
debug 11
Debug Configurations Dialog Box
Debugger Page 90
Debug Configurations dialog box 89
Debug group 628, 630
Debugger 90
Debugger Page 90
Debugger tab 89
Debugging 260
debugging
bare board software 352
setting breakpoint types 368
setting watchpoint types 365
standard debugging features 301
Debugging Project 23, 88
Debugging Projects 88
default workspace 46, 55, 64, 72, 79, 384
Define preprocessor macros 170, 225
DEMOS908QG8 639
derivative 48, 57, 66, 74, 81, 387, 450, 524, 586,
612
development process 11
Development Tools 17
development tools 11
Device and Connection 25, 49, 58, 59
Device and Connection Page 58, 59
Device Intialization 38
Device Package 451
Device/Connection Change 450, 586, 612
devices 634
diagnostic 668
Diagnostics 668
directories 628
Disassembler 152, 153, 206, 207
Do not use MWCIncludes variable (nostdinc) 273
Documentation 13
documentation 11
Download 638, 640
downloading 638
DSP 18
Microcontrollers V10.x Targeting Manual
DRAFT
E
Easy Debug 32, 34
EEPROM 463, 464
Emit #pragmas (-ppopt pragma) 297
Emit file change (-ppopt break) 297
Empty Declarations 278
Enable C++ Support 32, 33
Enable Porting Support 32
EOL Character 271
Erase 627
erase 638
erasing on-chip memory 638
ETSI 18
Execute 638, 640, 660, 675
execute 629, 658
Execute icon 640, 660
Expert Settings 153, 156, 167, 169, 207, 210, 222,
224, 264, 266, 272, 296, 299
Export 670, 674
Export data 676
Export Data from Memory 677
Export data from memory into a file 676
Export Memory 674
Expression 673, 677, 681
Expression Has No Side Effect 277
Extended Error Checking 276
Extended Menu 452
Extra Commas 278
Flash Programmer Actions - Move Down 635
Flash Programmer Actions - Move Up 635
Flash Programmer Actions group 629
Flash Programmer Actions -Remove Actions 635
Flash Programmer target task 630
Flash Programmer Task editor window 629
Flash Programmer Window 627
Flash Task 640
Float is IEEE32, double is IEEE32 30
Float is IEEE64, double is IEEE64 32, 34
Frequency Display 461
Full Optimizations 32, 34
functional 668
G
General 268
Generate Binary Image 271
Generate Elf Symbol Table 271
Generate Link Map 270
Generate Link Map - Generate S-Record File 270
Generate Link Map - List Inused Objects 270
Generate Link Map -Always Keep Map 270
Generate Link Map -Show Transitive
Closure 270
Generate Listing File 271
Generate Symbolic Info 260
Generate Warning Messages 271
H
F
features 11
File Type 678
File type 674
Fill 670
Fill Memory 679
Fill memory with a data pattern 680
Fill Memory with Data Pattern 678
Fill Pattern 682
Finish 669
fixes 11
flash memory 627, 638
Flash Programmer 627, 632
Flash Programmer Actions 639
Microcontrollers V10.x Targeting Manual
hardware 627, 630, 668
Hardware Diagnosti 669
Hardware Diagnostics 668
Hardware Diagnostics Action 669
hardware tools
flash programmer 627–635
HCS08 638
HCS08 Compiler 168, 224
Help 13
Hidden virtual functions 277
I
IDE 11
IDE project 627
685
DRAFT
IICCLR 468, 471
IICDI 467, 469
IICDO 467
Illegal Pragmas 276
Implicit Arithmentic Conversions 277
Implicit Float to integer Conversions 277
Implicit Integer to Float Conversions 277
Implict Signed/Unsigned Conversion 277
Import 629, 638, 640, 657, 670
import 628, 638
Import Memory 670
Import pre-defined task 628
Import/Export 672
Import/Export/Fill Memory 675, 679
Include File Capitalization 278
Include files only once 173, 228
incompatibilities 11
Inconsistent ‘class’ / ‘struct’ Usage 278
Information 13
INPUT 471, 473, 475
Input 171, 196, 227, 251, 273, 292
Input File 674
INPUTS 471, 472, 473, 475
Introduction 11
IRQ 471, 473
K
Keep comment (-ppopt comment) 297
Keep whitespace (-ppopt nospace) 298
L
Language 175, 197, 230, 252
Language Page 27
LCF 19
Library Files ?(-l +file) 268
Linker 155, 209
Linker > Libraries 156, 210, 269, 271
loat is IEEE32, double is IEEE64 30
Location 25, 380
Loop Speed 670
M
Manipulating 670
686
Max Bin Record 271
Max S-Record Length 271
Maximum Number of Errors 150, 204, 262
Maximum Number of Warnings 150, 204, 262
MC9S08QG8 640
Memory 670
memory 627, 633, 638
Memory Access 670
Memory into File 677
Memory Model 152, 206
Memory read/write 668
Memory Settings 639
Memory space and address 673, 677, 681
Memory Tests 670
Memory tests 668
Message Style 261
Messages 149, 260
Microcontroller 656
Minimal startup code 30
Missing ‘return’ Statement 277
Module Options 456
Move Down 635
Move Up 635
N
New Bareboard Project 45, 46, 47, 48, 49, 51, 52,
53, 55, 57, 58, 59, 60, 61, 62, 64, 66, 67, 69, 70,
72, 73, 74, 75, 79, 80, 81, 82
New Bareboard Project Wizard 23
Connections Page 53, 78
Device and Connection Page 58, 59
New Linux/uClinux Application Project 45
New Target Task 671, 680
No Optimizations 32, 34
No Porting Support 32
None 38
Number of Elements 673, 678, 682
O
Offset 673, 678, 682
on-chip memory 638
Open 639
Other 628, 630
Other Flags 269
Microcontrollers V10.x Targeting Manual
DRAFT
Output 153, 182, 183, 190, 191, 199, 207, 238,
239, 245, 254, 269
Output File 678
overview 11
P
P&E Full Chip Simulation 450
P&E Serial Cyclone Max 37
P&E TCP-IP Cyclone Max 37
P&E USB Cyclone Max 37
Pointer/Integral Conversions 277
Popup 634
Possible Errors 276
PPAGE 465
Pre-defined 628
pre-defined tasks 629, 657
Preprocessor 169, 173, 224, 228, 297
process 11
Processor Expert 38
Processor Family (-proc) 259
Program 627
program 627, 638
Programming 628
Programming Task 627
Project name 25, 380
Propagate const and colatile qualifiers for
structs 177, 233
Properties 146
R
RAD options 38
rapid 37, 690
Rapid Application Development 37, 63, 71
Rapid Application Development Page 37
references 11
related 13
Related Documentation 11
Release Notes 11
release notes 13
Relocatable Assembly 28, 51, 60
Remove Action 635
Restoring Build Properties 147
Revert 90
Run Configuration 631, 669, 671, 675
Microcontrollers V10.x Targeting Manual
Run till a specific cycle 462
Run till Cycle 461
S
Scope loop 668
select 638
Select Task Type 672, 680
Select the task type 672
sequence 630
Settings. 146
Show full path (-ppopt full) 297
Show View 628, 630, 670, 674, 679
Show View window 628, 630
Small 30
SofTec 36
Sources 13
special 630
specific device 633
steps 11
Stored Actions 630
Strict ANSI 176, 232
Strip path information 193, 248
System Path 273, 292
T
Target 670
target board 627
target board debugging 352
Target RAM 634
Target Task 670
target task 630
Target Task Wizard 676
Target Tasks 628, 630, 639, 679
target tasks 630
Target Tasks View 629, 631, 671
Target Tasks view 628, 631
Task 628, 638, 640
Task Name 631
Task Type 632, 669
test 627
tests 668
third-party 11
toolbar 631
Treat All Warnings 276
687
DRAFT
Tutorial 638
Tutorial A
Import and Execute HCS08 Download
Task 638
Tutorial B
Import and Execute ColdFire Download
Task 640
Tutorial C
Create Erase Memory Task for HCS08 642,
665
Tutorial D
Create Erase Flash Memory Task for
ColdFire 647
Tutorial E
Create Download Program Task for
ColdFire 653
tutorials 92, 638
XTAL 460, 463
U
Unused Arguments 277
Unused Variables 277
USB cable 639
Use #include line (-ppopt line) 298
Use default location 25, 380
User Path (-i) 273, 292
V
value 453
Verify 627
Verify Memory Writes 674, 682
W
Warnings 275
Workbench window 54, 63, 71, 78, 450, 524, 586,
612
Working with Projects 23
WorkSpace Launcher 46, 55, 64, 72, 79, 384
write 11
writing 638
writing to flash memory 638
X
xml file 629, 657
688
Microcontrollers V10.x Targeting Manual