1
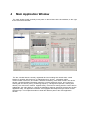
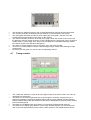
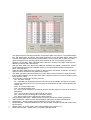
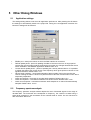
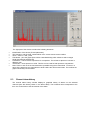
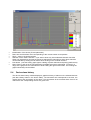
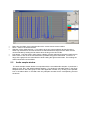
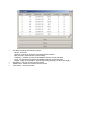
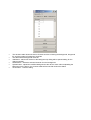
Version 1.0
QMaster User Manual
Contents
1
2
3
4
5
1
Introduction
User Interface
First Steps
Main Application Window
Other Dialog Windows
Introduction
QMaster is a windows based application suitable for remote control and monitoring of
counter-surveillance devices. QMaster is part of the QM-4000 system which consists of a PC, QMI-1
interface, RS-485 bus with additional audio line. QM-4000 allows to connect up to 128 devices on a
single bus. Currently it is possible to connect up to 32 MRA-3Q memory radio analyzers. The
possibility for connecting other devices such as detector of mobile communication DMC-2Q or
wide-band RF detectors RFD-2Q is under development
2
User Interface
2.1
Basic concept
QMaster is designed in a way that allows most frequently used functions to be accessible quickly
and easily by pressing a button or activating other control element. Besides efficiency of control
activation the priority lies in a transparent display of actual state of the controlled devices including
detailed information about the currently selected device.
The main window is split vertically in two parts: on the left there is the bus window, on the right there
is the device window. The bus window lists the currently registered devices including their actual
state, control buttons for working with the bus (e.g. adding/removing device), information about
communication on the bus, and control elements for working with audio records. The device window
contains detailed information about the currently selected device and controls for working with the
device (tuning, measuring frequency, background inspection, working with alarms). The main menu
contains supplementary functions for working with the current device. Additionally the main allows
to change the application settings, save/load projects and invoke application help. All application
elements are equipped with tooltips that give online context sensitive help.
2.2
Using mouse on graphical elements
QMaster contains several graphical windows depicting channels of radio background, results of
frequency spectrum analysis and the alarm history. You can use mouse to control these windows as
follows:
·
right button: select a region to zoom-in
·
left button, double click: activate the corresponding frequency/channel (only frequency based
windows)
·
mouse wheel: zoom +/-
3
First Steps
1. Setting up serial port - main menu File | Preferences
Check the serial port setting: the selected port has to match the port to the QMI bus interface
is connected. At the first start of the application we suggest to check the setting of other
parameters in the preferences dialog (see chapter 5.1).
2. Scan the bus - Scan button button in the bus window
After the first execution of QMaster you should scan the bus to find all currently active devices.
The devices found we be shown in the device list inside the bus window.
3. Adding a device manually - Add button in the bus window
Adding a device manually is useful when you want to add a device that is currently inactive or
it is currently in a mode that does not allow remote communication. After pressing the button
you will be asked for device ID, it's type, and the placement (name) of the device.
4. Working with selected device - controls in the device window
In the bus window select arbitrary active device (shown in green or red). Using the controls in
the device window you can then check the current background, use manual tuning, or measure
signal frequencies. If there have been some alarms reported by the device, you can tune the
corresponding signal channels (double click in the alarms window), view the alarm channel
history, or delete selected alarms from the device memory. Details about working with the
device will be described in the next chapter.
4
Main Application Window
The main window is split vertically in two parts: on the left there is the bus window, on the right
there is the device window:
The bus window lists the currently registered devices including their actual state, control
buttons for working with the bus (e.g. adding/removing device), information about
communication on the bus, and control elements for working with audio records. The device
window contains detailed information about the currently selected device and controls for
working with the device (tuning, measuring frequency, background inspection, working with
alarms). The main menu contains supplementary functions for working with the current device.
Additionally the main allows to change the application settings, save/load projects and invoke
application help. All application elements are equipped with tooltips that give online context
sensitive help. This chapter describes in detail the different parts of the main application
window.
4.1 Device list
·
·
·
·
·
·
·
·
The device list contains all registered devices, the state of which is periodically refreshed (see
refresh period in the Settings dialog).
Add button - manually add a device with a selected ID
Scan button - search for all active devices on the bus
Remove button - remove selected devices from the device list (selection of multiple devices is
possible using mouse and the Ctrl button)
History button - show the alarm history of all selected devices. The history will show the maximal
alarm level for each device for every moment the device was active. For showing a more
detailed history information including the alarm levels for different channels use the Channel
History button in the device window (see chapter 4.10).
Delete History button - delete history for all selected devices
Delete Audio button - delete all audio samples for all selected devices
Hide device controls button - hides the right part of the main window containing the device
controls
4.2
Communication log window
The communication window contains messages about communication on the bus. In an
errorless operation every data exchange on the bus ends with an OK message. When ID FAIL
appears the device with the particular ID is probably switched off or it is currently in a mode that
does not support communication. When there are only FAIL messages very likely the problem is
in a wrong setting of the communication port (see chapter 5.1), interruption of the bus cable, or
communication with non exiting device(s).
4.3
·
·
·
·
Audio controls
Speaker slider - setting the volume of playing the audio samples
Microphone slider - setting the microphone gain for audio recording
Record button - manual activation of audio sample recording. Record of selected length will be
added to the record for the current device. The length of the sample is given by the choice in the
settings dialog (see chapter 5.1).
Show samples button - show a dialog with a list of all audio samples (see chapter 5.5). The
dialog allows to play and delete the samples.
4.4
Information about the device
·
The first line contains: device type, firmware version, device ID, and the communication ID.
·
The second line contains the name/placement of the device - the device name can be changed
by typing the new name into the line and pressing ENTER
4.5
·
·
·
The device mode
On the left the current mode of the device is depicted
Scan button - set the device to the scan mode
Automatic tuning - set the device to the automatic tuning mode
4.6
The background and alarm channels
·
·
·
·
·
·
·
The window is a graphical picture of the occupied background channels and the new signals
The occupied channels are depicted using a black bar in the lower part of the window
The new signals are shown as red bars in the upper part of the graph - the size of the bar
corresponds to the percentage of the alarm on the channel
The channel numbers are shown at the top of the graph. When the mouse cursor moves over
the graph the channel number under the cursor is displayed in the upper right corner. Under this
number there is a percentage of the alarm on this channel and a checkbox depicting whether
this channel is part of the spectrum background.
The slider on the left allows to zoom in and zoom out in the channel graph.
To zoom in it is also possible to select a desired range using a mouse while pressing the right
mouse button.
By clicking into the graph you can tune the corresponding channel
4.7
·
·
·
·
Tuning controls
The s-meter bar shows the current level of the signal tuned on the device. Note: This value is
refreshed only while tuning.
The buttons in the Channel group allow to cycle through the channels. A direct tuning of a
channel is possible by entering the desired channel nuber into the editable field and pressing
ENTER. Buttons Add to BG and Delete from BG allow to add/delete the currently tuned channel
to/from the background.
The buttons in the Background group allow to cycle through the background channels.
The buttons in the Signal group allow to cycle through different signals. The device tunes the
next or previous signal similarly to the common radio receivers. The middle button tunes the
·
·
maximum of the signal.
The buttons in the Manual tuning group can be used for manual tuning across the whole
frequency range of the device. The double arrows serve for fast tuning, the single arrows serve
for fine tuning.
The Frequency group allows to measure the frequency of a signal or to tune a selected
frequency. For measuring frequency tune the signal maximum and presss the Measure button.
For tuning to a desired frequency enter the frequency in MHz to the editable field and press
ENTER or the Tune button. Note: The measured frequency need not correspond to exact values
for spread spectrum and channel hopping signals like DECT, GSM, or WiFi.
4.8
·
·
·
Store BG button - execute the store background instruction in the device. The device will scan
the current frequency spectrum and stores it in its background memory (with gain G+3.5dB).
Note: all backgrounds are archived and so it is possible to recall any background in the future.
Update BG button - execute the Update BG instruction in the device. The current background is
added to the background already stored in the device (with gain G+7dB).
Analyze Spectrum button - execute a detailed frequency spectrum analysis. The device will scan
the frequency range from 30-3600 MHz. The result is presented as a frequency spectrum graph.
This graph can be observed using zoom in/out tools, printed out, saved to a file, or compared to
an already saved reference spectrum. The last frequency spectrum is automatically saved to a
file named freq.fsg. It is possible to show this spectrum without performing the analysis itself
using the main menu (Device | Show spectrum). Note: the analysis takes about 5 minutes.
4.9
·
·
Commands for entering the background and spectrum analysis
Information about the background and editing the background
ID of the current background - hexadecimal code of the current background. This code is
generated randomly at every change of the background (storing BG, updating BG or editing BG,
adding or removing a channel). The code allows to check whether there was no unauthorized
manipulation with the background.
Show/Edit button - open the background edit window (see chapter 9.1).
4.10 The new signal table
This table show detailed information about new signals (alarms), that is suspicious signals that
are not part of the spectrum background at the time of the evaluation. The table is a basic tool
for long time analysis of the frequency spectrum for a particular device. There are two main
modes of alarm listing: the "device" mode and the "history" mode. In the device mode the table
shows alarms that are currently present in the device. In the history mode the table also shows
historical alarms, that is alarms that are not currently present in the device, but are present in
the global history for the device (e.g. alarms deleted from the device by the user).
·
·
·
·
-
·
·
·
·
·
·
The upper left part of the table shows the current alarm state of the device. The possible states
are: OK, New signals, and Alarm. OK indicates that there is no active alarm signal. New signals
is shown when there are some alarm signals present, which however did not reach the 100%
alarm level (the time for reaching 100% alarm depends on the device setting and varies
between 1-20 minutes). Alarm indicates that the device is currently in the alarm state (there is
atleast one channel with 100% alarm).
After the alarm state of the device two additional messages can appear: +GSM and/or +DECT.
These messages show that the probable source of the current alarm signals is GSM and/or
DECT communication.
Under the alarm state there is the number of active alarms, the number of alarms in the device
and the number of alarms in the global device history.
The upper right part of the table shows the current alarm level for the device. Under this value
there is a time elapsed from the last 100% alarm (negative value) or the time of duration of the
alarm (positive value).
The list header contains the following columns:
chn - the alarm channel
rec - a speaker icon indicates that there is at least one audio sample recorder for this alarm
channel. By clicking on the icon you can open the window with the list of audio samples (see
chapter 5.5).
alarm - the current alarm level
max - the maximal alarm level
D - '*' the channel is present in the device as alarm, BG the channel is currently in the device
background
sum - sum of the time when the alarm signal was active
first - first occurrence of the signal on the alarm channel
last - last occurrence of the signal on the alarm channel
Device/History radio button - siwtch between the device and history modes (see above)
Add to BG button - add the current selected alarm channels to the device background
Delete button - delete currently selected alarms from the device memory
Delete All button - deleted all alarms from the device. Note: the alarm records will remain in the
device history.
History button - show the history of the selected alarms (see chapter 5.3)
Delete History button - delete history of currently selected alarms
·
·
·
Delete Audio button - delete audio records of currently selected alarms
Sync button - immediately synchronize the table with the device. Note: the table is refreshed
incrementally depending on the refresh period setting. Additionally a full synchronization takes
place automatically every 5 minutes.
Select button - select channels corresponding to various communication standards. Note: this
selection is only informative; the same channels can be shared by different communication
standards.
4.11 The main menu
File
-
Device
-
Help
-
Open project ...
Open previously saved settings
Save project as ...
Save all settings to a named file
Preferences ...
Open the preferences dialog
Quit
Quit the application. All settings will be reloaded during the next execution of the program.
The recorded data will also be available (the device list, the device/channel history, audio
samples).
Load spectrum
Load and show a previously analyzed spectrum from a file. Note: loading a reference
spectrum can be done directly from the spectrum analysis window (see chapter 5.2).
Show spectrum
Show the last analyzed spectrum
Contents
The main application help
About
Brief information about the application
5 Other Dialog Windows
5.1
Application settings
The settings dialog allows to set the main application preferences. After pressing the OK button
the settings is automatically saved to the project file. During the next application execution the
last active settings will be restored.
·
·
ElbiBus port - serial port number on which the QMI interface is connected.
Default update period - period of updating the state of devices on the bus. A longer period
reduces the communication load but prolongs the time when the changes detected the device
will be available in the QMaster application. Default value: 30 s.
Current device update period - period of updating the currently selected device. It is possible
to refresh the state of the current device more frequently which gives quicker overview of new
signals and alarms. Default value: 10 s.
Record audio checkbox - record audio samples of alarm signals. During the recording the
channel causing the alarm is tuned on a particular device and the communication on the bus is
temporarily suspended.
Audio record length - the length of recorded audio samples. Default value: 10 s.
Audio record period - a minimal time between two audio records. Default value: 2 min.
Audio re-record period - minimal time between audio samples on a channel that was already
sampled. Default value: 10 min.
·
·
·
·
·
5.2
Frequency spectrum analysis
The frequency spectrum analysis window depicts the level of detected signals in the range of
30-3600 MHz. The horizontal axis corresponds to frequency, the vertical is marked using a
signal level measured in the percantage of the maximal level (0-100%). On the right there is
also informative dBm level.
The right part of the window contains the following elements:
·
·
·
·
·
·
·
Identification of the device (ID and placement).
The frequency and the level corresponding to the current mouse cursor position
Zoom - zoom in x and y axes
Print button - print the graph (there will be a standard dialog which allows to select a target
printer and printing preferences)
Load button - load a reference spectrum for comparison. The reference spectrum is shown in
different color.
Save button - save spectrum to a file. This file can be used for later spectrum comparisons.
Note: Zoom in and out in the horizontal axis is possible using the mouse wheel. To zoom in a
range of the graph use a mouse selection while holding the right mouse button. For scrolling the
graph horizontally use the sliders.
5.3
Channel alarm history
The channel alarm history window displays a graphical history of alarms on the selected
channels (see also History button in the alarm table). The horizontal axis corresponds to the
time, the vertical axis to the percentage of the alarm.
·
·
·
·
·
·
Identification of the device (ID and placement)
Date, time and the alarm level corresponding to the current mouse cursor position
Zoom - zoom in the horizontal axis
Selection of the visible channels - if you want to show only some selected channels check the
Show only selected box and use the mouse to selected the channel(s) to show. More channels
can be selected by holding the Ctlr button while clicking on the channel numbers.
Print button - print the history graph (opens a dialog of printer selection and printing preferences)
Note: Zoom in and out in the horizontal axis is possible using the mouse wheel. To zoom in a
range of the graph use a mouse selection while holding the right mouse button. For scrolling the
graph horizontally use the sliders.
5.4
Device alarm history
The device alarm history window displays a graphical history of alarms on the selected devices
(see also History button in the device table). The horizontal axis corresponds to the time, the
vertical axis to the percentage of the alarm. This percentage is the maximal alarm level of all
channels for the corresponding device at a given time.
·
·
·
·
·
Date, time and alarm level corresponding to the current mouse cursor position
Zoom - zoom in the horizontal axis
Selection of the visible devices - if you want to show only some selected devices check the
Show only selected box and use the mouse to selected the devices(s) to show. More devices
can be selected by holding the Ctlr button while clicking on the device IDs.
Print button - print the history graph (opens a dialog of printer selection and printing preferences)
Note: Zoom in and out in the horizontal axis is possible using the mouse wheel. To zoom in a
range of the graph use a mouse selection while holding the right mouse button. For scrolling the
graph horizontally use the sliders.
5.5
Audio sample window
The audio sample window allows to manipulate with the recorded audio samples. In particular it
allows to view, play, and delete selected samples. The window is activated either by the Show
samples button in the audio group of the main application window or by clicking on the speaker
icon in the alarm table. In the latter case only samples recorded for the corresponding channel
are shown.
·
·
·
·
-
The table consists of the following columns:
Device - device ID
Channel - channel on which the audio sample was recorded
Date and time / date and time of the recording
Frequency - frequency measured immediately after the record was taken
Level - the signal level measured immediately after the record was taken
Length - length of the sample in seconds (see dialog Settings | Audio record length)
Play button - play the currently selected record
Delete button - delete the currently selected record
Close button - close the window
5.6
Device background history
The window shows all former backgrounds for the given device and allows their viewing and
editing.
·
·
·
·
The table consists of the following columns:
Device - device ID
Date and time - date and time of the background entry
ID - automatically generated background ID
channels - the number of occupied background channels
View/Edit button - open the window for viewing/editing the background (see below)
Delete button - delete the selected record of the background history
Close button - close the window
9.1
Editing the background
The background dialog window lists all channels of the given spectrum background. It allows to
manually add or delete channels and to write the modified background to the device.
·
·
·
·
·
·
The window header shows the device ID, date and time of storing the background, bacground
ID, and the number of background channels
The table lists all background channels
Add button - add a new channel to the background (a dialog will be opened asking for the
channel number)
Delete button - delete the selected channel from the background
Upload button - upload the modified background to the device. Note: without uploading the
background to the device, the changes made will be lost after closing the dialog.
Close button - close the dialog