1
18
EVOLVE Manual
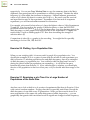
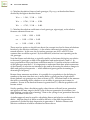
The starting frequency of the • allele will be the same as in Exercise 1.
☛ Now click on the Genetic Drift button to show maximum and post-crash
population sizes. Change the post-crash size to 100 and the maximum
population to 80.
All of this is important because we will be comparing the results of our second run with
those of the first run — the first run will be our experimental “control.” If the only
difference between the two experiments is size of population, then we can more easily
draw valid conclusions. If there were other differences, for example, if the post-crash
size was not eight-tenths of the maximum, we could not be sure that differences in
results were due to differences in population size. The ratio of post-crash size to
maximum population might have an effect.
☛ Check to make sure the other parameters are the same as those in Figure 2-2
and fix any that are not. Click on the Done button, then the Start button to
start the experiment. As the lines march across the graph, try to predict what
will happen next.
☛ When the experiment is finished, compare the allele frequency graphs from the
two exercises.
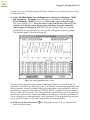
Notice that while the trace of the small population (in black) is more jagged than the
gray lines of the large population, it generally follows the same pattern of relatively
gradual change, then rapid change. Your own graph may differ significantly from that
of the 1st trial.
☛ Compare plots of genotype frequency for both experiments.
Again, the two graphs are quite similar in overall shape, although the small
population’s curves fluctuate a good deal more. We should note that there are more
sophisticated ways to compare these curves quantitatively, and if you are an advanced
student your instructor may have you make such comparisons. However, our purpose
here is to accustom you to comparing different runs, not statistical curve fitting, so we
will make only qualitative comparisons.
☛ Plot total population size.
Compare the two populations. You will need to zoom in or change the front-most trial
in the Trial popup to see the second one.
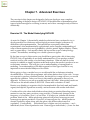
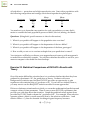
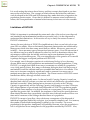
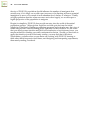
☛ Plot number of •• homozygotes and number of
◊◊
homozygotes
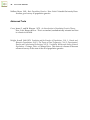
Notice that there are periods early in the experiment when the •• genotype did not
occur in the population. Not until later did the •• genotype return for keeps. Similarly,
the ◊◊ homozygotes often decline to zero, then reappear before disappearing for good.
Homozygotes, after all, may be generated by matings between heterozygotes, even
when the rare allele is too rare for significant numbers of homozygotes to mate with
each other and reproduce.