1
Podium Plus Data Analysis Software
User Manual
12.5.1 Current Lap Graph
The colour used to display graphs, histograms and X-Y plots for the Current Lap is
changed in the following way:
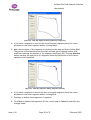
1. Choose Setup ¨ Graph Colours ¨ Current Lap from the main menu. The Standard
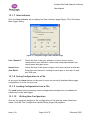
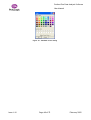
Colour Dialog (Figure 44) appears.
2. Select the new colour for Current Lap graphs and click OK or click Cancel to leave
the colour unchanged.
Alternatively, the colour for the Current Lap can be changed by activating the context
menu attached to a graph, histogram or X-Y plot and selecting the Graph Colours ¨
Current Lap option.
12.5.2 Reference Lap Graph
The colour used to display graphs, histograms and X-Y plots for the Reference Lap is
changed in the following way:
1. Choose Setup ¨ Graph Colours ¨ Reference Lap from the main menu. The
Standard Colour Dialog (Figure 44) appears.
2. Select the new colour for Reference Lap graphs and click OK or click Cancel to
leave the colour unchanged.
Alternatively, the colour for the Reference Lap can be changed by activating the context
menu attached to a graph, histogram or X-Y plot and selecting the Graph Colours ¨
Reference Lap option.
12.5.3 Circuit Map Outline
The colour used to display the track outline for the circuit map is changed in the
following way:
1. Choose Setup ¨ Map Colours ¨ Track from the main menu. The Standard Colour
Dialog (Figure 44) appears.
2. Select the new colour for the track outline and click OK or click Cancel to leave
the colour unchanged.
Alternatively, the colour for the track outline can be changed by activating the context
menu attached to the circuit map and selecting the Map Colours ¨ Track option.
Issue 1.10
Page 69 of 72
February 2005