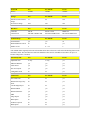
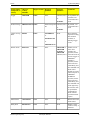
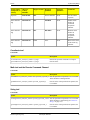
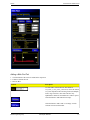
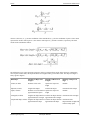
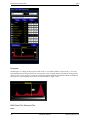
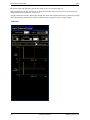
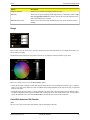
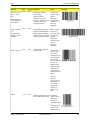
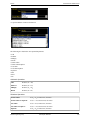
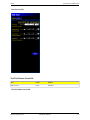
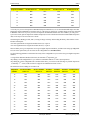
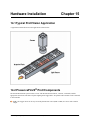
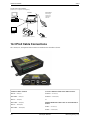
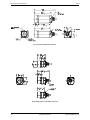
1
PresencePLUS® Pro/ProII/ProII
1.3/ProII Color
User's Manual
P/N 68367 rev. D — 2010R1
Contents
Chapter 1: Product Support and Maintenance..........................................7
1.1 Warnings and Cautions.............................................................................................7
Safety Warnings.......................................................................................................7
Electrostatic Discharge Warnings............................................................................7
User Service Caution...............................................................................................7
1.1.4 Environmental Requirements..........................................................................8
1.2 Product Support........................................................................................................8
1.3 Maintenance..............................................................................................................9
1.4 PresencePLUS Pro Models.......................................................................................9
1.4.1 Comparison Table...........................................................................................9
Chapter 2: System Description ................................................................11
2.1 ProII Vision Sensors................................................................................................11
2.1.1 Typical ProII Vision Application......................................................................11
2.1.2 PresencePLUS® ProII Components.............................................................12
2.1.3 PresencePLUS® ProII Controller Terminal Block..........................................13
2.1.4 ProII Cable Connections...............................................................................14
2.2 Software Overview..................................................................................................14
2.2.1 Main Menu Toolbar .......................................................................................15
2.2.2 Image Window...............................................................................................16
2.2.3 Navigation/Results Window...........................................................................16
2.2.4 Configuration Window...................................................................................18
2.2.5 Status Window..............................................................................................19
Chapter 3: Getting Started.........................................................................21
3.1 Installing the PresencePLUS Software...................................................................21
3.1.1 Installing the Software...................................................................................21
3.1.2 Starting Up the Software...............................................................................21
3.2 Typical Setup and Startup Sequence......................................................................25
3.3 Startup and Troubleshooting....................................................................................25
3.3.1 General Troubleshooting...............................................................................26
3.4 Setting Up Hardware Parameters............................................................................27
3.5 Building an Inspection.............................................................................................27
Chapter 4: Setup.........................................................................................29
4.1 Setup Screen...........................................................................................................29
4.2 Capturing a Reference Image.................................................................................29
4.3 Focus Tab................................................................................................................29
4.3.1 Reference Image Source..............................................................................30
4.3.2 Focus Value...................................................................................................31
4.3.3 Auto Exposure...............................................................................................31
4.4 Trigger Tab...............................................................................................................32
4.4.1 Trigger Settings.............................................................................................33
4.4.2 Resolution.....................................................................................................33
4.5 Advanced Tab..........................................................................................................34
4.6 Considerations When Setting up Color Inspections................................................35
4.6.1 Primary Colors..............................................................................................35
4.6.2 Setting up a Color Inspection........................................................................36
Chapter 5: Tools Screen ...........................................................................41
5.1 Overview.................................................................................................................41
5.2 Typical Build/Modify Procedure...............................................................................41
5.2.1 Choosing a Tool.............................................................................................41
5.2.2 Adding a Tool.................................................................................................42
Banner Engineering Corp.
Minneapolis, MN USA
iii
PresencePLUS® Pro/ProII/ProII 1.3/ProII Color
2/2010
5.2.3 Adding a Test Tool.........................................................................................42
5.2.4 Renaming Tools.............................................................................................42
5.2.5 Removing a Tool............................................................................................42
5.3 Quick Teach.............................................................................................................42
5.4 Load Tab..................................................................................................................43
5.4.1 Flexible Inspection Loading...........................................................................44
5.4.2 Inspection Storage Capacity.........................................................................45
5.4.3 Opening an Inspection from the Sensor or a Library....................................45
Chapter 6: System Setup Dialog...............................................................47
6.1 Sensor Select Tab...................................................................................................47
6.1.1 Change Sensor IP Address...........................................................................48
6.1.2 PC (GUI) to Sensor Connection Setup.........................................................49
6.1.3 IP Address History........................................................................................50
6.2 Communication Tab.................................................................................................51
6.2.1 Communication Setup...................................................................................52
6.2.2 Remote Command Channel Configuration ..................................................56
6.2.3 PresencePLUS/Kawasaki Vision Guidance and Inspection..........................63
6.2.4 Using Custom_ASCII to Communicate with an External Device Over Ethernet.77
6.3 Input/Output Tab......................................................................................................78
6.3.1 ProII Input/Output Tab...................................................................................80
6.4 Product Change / Select Tab...................................................................................82
6.5 Strobe Tab...............................................................................................................83
6.5.1 Strobe Width..................................................................................................84
6.5.2 Level..............................................................................................................85
6.6 Trigger Tab...............................................................................................................85
6.7 Units Tab..................................................................................................................86
6.7.1 Select Conversion Units................................................................................87
6.7.2 Configure with Known Distance....................................................................88
6.8 Reset Tab................................................................................................................90
6.9 Start-Up Inspection Tab...........................................................................................91
6.10 NTSC Tab..............................................................................................................92
6.11 Language Tab........................................................................................................93
6.12 Tools Configuration................................................................................................94
6.12.1 Standard Mode............................................................................................95
6.12.2 Enhanced Mode..........................................................................................95
6.12.3 Custom Mode..............................................................................................95
6.12.4 Tool Licensing..............................................................................................96
Chapter 7: PresencePLUS Software Tools...............................................97
7.1 ROI Types................................................................................................................97
7.1.1 Linear ROI.....................................................................................................97
7.1.2 Area ROI.......................................................................................................97
7.1.3 Search ROI...................................................................................................97
7.2 Location Tools..........................................................................................................98
7.2.1 Locate Tool....................................................................................................98
7.2.2 Geometric Find Tool....................................................................................105
7.2.3 Pattern Find Tool.........................................................................................112
7.2.4 Blob Find Tool..............................................................................................115
7.3 Vision Gray Scale Tools.........................................................................................126
7.3.1 Average Gray Scale Tool.............................................................................126
7.3.2 Blob Detect Tool..........................................................................................129
7.3.3 Circle Detect Tool........................................................................................141
7.3.4 Edge Tool....................................................................................................146
7.3.5 Geometric Count Tool .................................................................................153
7.3.6 Line Detect Tool...........................................................................................159
7.3.7 Object Tool..................................................................................................162
7.3.8 Pattern Count Tool.......................................................................................171
7.4 Vision Color Tools..................................................................................................174
7.4.1 Average Color Tool......................................................................................174
7.4.2 Color Blob Tool............................................................................................178
7.4.3 Color Match Tool.........................................................................................191
7.5 Premium Vision Tools............................................................................................194
7.5.1 Barcode Tool...............................................................................................194
7.5.2 Barcode Tool Advanced Tab........................................................................197
iv
Minneapolis, MN USA
Banner Engineering Corp.
PresencePLUS® Pro/ProII/ProII 1.3/ProII Color
2/2010
7.5.3 Barcodes Read by Banner BCR.................................................................200
7.5.4 Bead Tool....................................................................................................204
7.5.5 Optical Character Recognition (OCR) Tool.................................................210
7.5.6 Trainer.........................................................................................................212
7.5.7 Advanced Tab..............................................................................................227
7.5.8 Optical Character Verification (OCV) Tool...................................................228
7.5.9 Trainer.........................................................................................................231
7.5.10 Advanced Tab............................................................................................246
7.5.11 OCV Tool and the Remote Command Channel........................................247
7.6 Analysis Tools........................................................................................................248
7.6.1 Communication Tool....................................................................................248
7.6.2 Coordinate Tool...........................................................................................263
7.6.3 Math Tool.....................................................................................................267
7.6.4 Measure Tool...............................................................................................272
7.6.5 String Tool...................................................................................................294
7.6.6 Test Tool......................................................................................................301
Chapter 8: Communication Tool Setup...................................................321
8.1 Ethernet Connection.............................................................................................321
8.2 Serial Connection..................................................................................................322
8.3 Overview of Testing the Communication Tool........................................................323
8.4 Detailed Steps for Testing the Communication Tool..............................................323
8.4.1 Testing Ethernet Communications...............................................................323
8.4.2 Testing Serial Communications...................................................................324
8.5 Troubleshooting Ethernet Connections..................................................................324
8.6 Troubleshooting Serial Connections......................................................................325
8.7 Remote Command Channel Configuration ..........................................................325
8.7.1 Remote Command Set ...............................................................................325
8.7.2 RCC Return Values.....................................................................................328
8.7.3 Frame Tag Numbers ...................................................................................329
8.7.4 Command Processing ................................................................................329
8.7.5 RCC Log ....................................................................................................330
8.7.6 Frame and Field Delimiters.........................................................................330
Chapter 9: Teach......................................................................................333
9.1 Quick Teach...........................................................................................................333
9.2 Teach.....................................................................................................................333
9.3 Teach Screen.........................................................................................................333
9.3.1 Teaching an Inspection................................................................................334
9.4 Remote Teach.......................................................................................................336
9.4.1 Understanding Remote Teach.....................................................................336
9.4.2 Remotely Teaching a Tool...........................................................................336
9.4.3 Timing Sequence........................................................................................336
9.4.4 Remote Teach Results................................................................................337
Chapter 10: Run Screen...........................................................................339
10.1 Selected Inspection.............................................................................................340
10.2 Display.................................................................................................................340
10.3 Capture Control...................................................................................................340
10.4 Results................................................................................................................341
10.5 Inputs...................................................................................................................341
10.6 Outputs................................................................................................................341
10.7 Product Select.....................................................................................................342
10.8 System................................................................................................................342
10.9 Start/Stop............................................................................................................342
10.10 Select Tab..........................................................................................................342
10.11 Log Tab..............................................................................................................343
10.12 Run Results.......................................................................................................345
10.13 Run Player/Recorder.........................................................................................347
10.13.1 Record.....................................................................................................349
10.13.2 Playback..................................................................................................351
Chapter 11: Product Change...................................................................353
11.1 Product Change Specifications...........................................................................353
11.2 Product Select Input Specifications.....................................................................353
Banner Engineering Corp.
Minneapolis, MN USA
v
11.3 ProII Product Select............................................................................................353
Chapter 13: Saving Inspections..............................................................357
12.1 Saving Inspections to a Vision Sensor................................................................358
12.2 Saving Inspections to a PC or Network Drive.....................................................359
Chapter 14: Backing Up and Restoring Vision Sensor Data................361
13.1 Backing up Vision Sensor Data...........................................................................361
13.2 Restoring Vision Sensor Data.............................................................................365
Chapter 15: Hardware Installation..........................................................369
14.1 Typical ProII Vision Application............................................................................369
14.2 PresencePLUS® ProII Components....................................................................369
14.3 ProII Cable Connections.....................................................................................370
14.4 Mounting the Controller.......................................................................................371
14.5 Mounting the Camera..........................................................................................371
14.6 Mounting the Light Source..................................................................................372
14.7 Installing the Camera Lens..................................................................................372
14.8 Installing Lens Filters...........................................................................................372
Chapter 16: Dimensions and Specifications.........................................373
15.1 Controller Dimensions.........................................................................................373
15.2 Camera Dimensions ...........................................................................................373
15.2.1 Camera Mounting Bracket Dimensions ....................................................375
15.3 Sensor Specifications..........................................................................................376
15.4 Camera Specifications .......................................................................................377
15.5 Monitor Specifications - 9" CRT..........................................................................378
15.6 Monitor Specifications - Flat Panel 8" LCD Color................................................379
15.7 Ethernet Communication Specifications..............................................................380
15.8 Serial Port Communication Specifications..........................................................380
...................................................................................................................383
Product Support and Maintenance
Chapter 1
This section provides general Banner resources and specific documentation for installers and operators of this
PresencePLUS Vision Sensor.
Attention: Not to be Used for Personal Protection.
Never use these products as sensing devices for personel protection. Doing so could lead to serious injury or
death.
These sensors do NOT include the self-checking redundant circuitry necessary to allow their use in personnel safety
applications. A sensor failure or malfunction can cause either an energized or de-energized sensor output condition.
Consult your current Banner Safety Products catalog for safety products which meet OSHA,ANSI, and IEC standards
for personnel protection.
1.1 Warnings and Cautions
1.1.1 Safety Warnings
To avoid personal injury:
• Never use PresencePLUS Pro as a sensing device for personnel protection. Such use could create an unsafe condition
that could lead to serious bodily injury or death.
• Before connecting or disconnecting any cables, be sure the power supply is OFF.
• Never connect PresencePLUS Pro to a power source other than 10-30V dc.
• Keep components at least 250 mm (10") away from power cables.
• Keep components away from high-voltage power sources and motors.
1.1.2 Electrostatic Discharge Caution
Avoid the damage that electrostatic discharge (ESD) can cause to the camera or controller.
Always use a proven method for preventing electrostatic discharge when installing a lens or attaching a cable.
1.1.3 User Service Caution
Banner Engineering Corp.
Minneapolis, MN USA
7
Product Support and Maintenance
2/2010
The PresencePLUS Pro system has no field-replaceable or user-serviceable components.
To avoid invalidating the Banner warranty, do not disassemble or make electrical or mechanical modifications to any
components.
1.1.4 Environmental Requirements
For reliable operation, the installation location must meet the following criteria:
• Stable ambient temperature: 0° C to + 50° C (+32 F to 122°F)
• Ambient relative humidity: 35% to 90%, non-condensing
• Stable ambient lighting: no large, quick changes in light level; no direct or reflected sunlight
• No excessive vibration or mechanical shock
• No liquid splash
• Minimal dust or dirtø
1.2 Product Support
Banner provides the following resources for quickly setting up and operating the sensor.
Documentation
Online Help
The PresencePLUS online help is available from the from the Help menu item within the PresencePLUS software.
You can also get targeted help while on any system tab or dialog by pressing the <F1> key.
PDF Documentation
The PresencePLUS Sensor documentation is available in a convenient printable format (PDF) on the installation CD
or on the Banner Web site
Banner Website
The most current PresencePLUS information, documentation, and software updates are available at the following
Banner website page:
www.bannerengineering.com
Warranty Service
The PresencePLUS Vision Sensor is designed for reliability. Do not open the housing; it contains no field-replaceable
components. If repair is necessary, do not attempt to repair the sensor yourself; return the unit to the factory. Should
it become necessary to return a sensor to the factory, please do the following:
1. Contact the Banner Factory Application Engineering group at the address or numbers listed below. They will
attempt to trouble shoot the system from your description of the problem. If they conclude that a component is
defective, they will issue an RMA (Return Merchandise Authorization) number for your paperwork and give you
the proper shipping address.
2. Pack the sensor carefully. Damage which occurs during return shipping is not covered by warranty.
Factory Support
Call, e-mail, fax, or write your local Banner representative or a Banner Applications Engineer for support. Applications
Engineers are available from 8:00 A.M. to 5:00 P.M. Central Time, Monday through Friday, excluding holidays.
Phone
Local: 763.544.3164
Toll Free: 1.888.3.SENSOR (1.888.373.6767)
8
Minneapolis, MN USA
Banner Engineering Corp.
2/2010
Product Support and Maintenance
Fax
763.544.3213
E-mail
[email protected]
Address
Banner Engineering Corp.
9714 10th Avenue North, Minneapolis, MN 55441 USA
To help Banner better assist you, be ready to provide the following information:
• PresencePLUS software version (to find version number, click Help in the Main Menu toolbar and choose About)
• Operating system of your PC
• Sensor Model Number and Date Code. Model Number is on top of Sensor, Date Code is either on the bottom or the
side
• Exact wording of any messages that appeared on your screen
• A description of what you were doing and what happened
• A description of how you tried to solve the problem
See Maintenance on page 9
1.3 Maintenance
Maintenance tasks include keeping the hardware free of dust and dirt and possibly updating the PresencePLUS softw
are
as new versions become available.
Cleaning the Sensor
Regularly remove any dust or dirt from the Sensor using a soft cloth. If needed, slightly dampen the cloth with a weak
solution of neutral detergent. Avoid getting dirt on the imager (the area behind the lens). If the imager is dirty, use
anti-static compressed air to blow off the dust.
Cleaning the Lens
Regularly remove dust, dirt, or fingerprints from the lens. Use anti-static compressed air to blow off dust. If necessary,
use a lens cloth and lens cleaner or window cleaner to wipe off remaining debris.
Do not use any other chemicals for cleaning.
Updating the PresencePLUS Software
The current version of PresencePLUS software is available for download from the Banner website. See BannerWebsite
for the software downloads link.
1.4 PresencePLUS Pro Models
Informally, the name "PresencePLUS Pro" refers to one of three possbile vision sensors: the original Pro (also called
the P3), the special extra inspection (XINSP) Pro, or the new Pro II.
Functionally, the Pro II has replaced the original PresencePLUS Pro and the XINSP. The new Pro II has newer
electronics and more memory, allowing it to do more than its predecessors. However, because of these differences,
you can't upgrade one of the original Pro or an XINSP to a Pro II. New installations should use the Pro II.
1.4.1 Comparison Table
Sensor ID
Pro
Pro XINSP
Pro II
Firmware
2.1.2
2.1.2
2.2.0
GUI
3.2.0
3.2.0
3.2.0
Banner Engineering Corp.
Minneapolis, MN USA
9
Sensor ID
Pro
Pro XINSP
Pro II
Release
2008R2
2008R2
2008R2
Storage
Pro
Pro XINSP
Pro II
INS Files (with reference
image)
12
89
188
No reference image
600+
999
999
Hardware
Pro
Pro XINSP
Pro II
Controller
PPCTL
PPCTL-73628
PPROCTL
Camera head
PPCAM or PPROCAM
PPCAM or PPROCAM
PPCAM or PPROCAM
Terminal Strip
Pro
Pro XINSP
Pro II
2nd Serial Port
yes
yes
no
Dedicated Remote Teach
no
no
yes
Number of I/O
6
4 --> 6*
6
*The XINSP model originally had 4 I/O and 6 Product Select lines. This state is reflected in the labeling found on the
controller's sticker. The latest firmware makes the XINSP Pro have the new standard I/O (and allows for up to 10
Product Change lines, if needed).
GUI and System
Pro
Pro XINSP
Pro II
Adjustable FOV
V only
V only
yes
Industrial Ethernet
yes
yes
yes
Units feature
yes
yes
yes
New Tool Layout
yes
yes
yes
Configurable Tools
no
no
yes
Vision Tools
Pro
Pro XINSP
Pro II
Geo Find/Count
no
no
yes
Enhanced Average Gray
Scale
no
no
yes
Circular Edge/Object
no
no
yes
Enhanced Blob
yes
yes
yes
Enhanced Measure
yes
yes
yes
Math
yes
yes
yes
Image Export
yes
yes
yes
BCR Option
no
no
yes
OCR/OCV Option
no
no
yes
Bead Option
no
no
yes
System Description
Chapter 2
The PresencePLUS ProII and P4 sensor families are easy-to-use camera systems with advanced visual inspection
capability. With minimal knowledge of vision systems, a user can quickly set up a PresencePLUS ProII or P4 and run
an inspection that tests products accurately, rejecting bad products on a production line.
Inspections are set up using a personal computer (PC). A digital camera inside the Vision sensor captures images, and
the sensor software analyzes the images using one or more Vision tools to pass or fail the product. The PC is not
required for running inspections after the inspection files have been stored in the sensor’s memory.
Inspection setup involves focusing the camera and selecting the appropriate Location, Vision, and Analysis tools. The
full range of inspection tolerances can be established either automatically or manually. The automatic Teach function
eliminates the iterative process of determining correct tolerances.
The PresencePLUS ProII and P4 Sensor families accommodate both translational and rotational variation. Parts moving
down a production line or web need not be oriented in exactly the same way.
The Sensor is easy to operate, with both basic and advanced options. New users can follow the guided Setup sequence.
Advanced users can override automatic settings and create highly customized inspections.
2.1 ProII Vision Sensors
2.1.1 Typical ProII Vision Application
A typical PresencePLUS Pro II sensor application is shown below.
Banner Engineering Corp.
Minneapolis, MN USA
11
System Description
2/2010
2.1.2 PresencePLUS® ProII Components
The PresencePLUS ProII system consists of a PC with PresencePLUS software, a camera, a controller, and the
appropriate connections. The Sensor requires lighting and a trigger device. An optional video monitor can be connected
to the controller.
Note: The trigger device can be any 10-30V dc photoelectric sensor (PNP or NPN) or a device with a similar
output.
12
Minneapolis, MN USA
Banner Engineering Corp.
2/2010
System Description
PC with PresencePLUS Software
(Required only for configuration and diagnostics)
Controller
Terminal Block
-Power Supply
-Trigger Input
-Light Source
-Other I/O
Light Source
Video Monitor
(optional)
Camera
(Mounting Bracket is optional)
Trigger Device
2.1.3 PresencePLUS® ProII Controller Terminal Block
The controller provides a pluggable 20-pin terminal block. In addition to the trigger input and po
wer supply, the terminal
block accomodates a variety of I/O configurations including a strobe output, product select lines, and general-purpose
I/O.
The table below describes the controller terminal block connections
Terminal Block
Banner Engineering Corp.
Pin #
Description
Direction
1
10 - 30V dc (V+)
Input
2
dc Common (V-)
Input
3
Trigger Device
Input
4
Strobe
Output
5
N/A
N/A
6
Remote Teach
Input
7
N/A
N/A
8
N/A
N/A
9
Discrete I/O #1
Input/Output
10
Discrete I/O #2
Input/Output
11
Discrete I/O #3
Input/Output
12
Discrete I/O #4
Input/Output
13
Discrete I/O #5
Input/Output
14
Discrete I/O #6
Input/Output
15
Product Change
Input
16
Product Select 3
Input
17
Product Select 2
Input
18
Product Select 1
Input
19
Product Select 0
Input
Minneapolis, MN USA
13
System Description
Terminal Block
2/2010
Pin #
Description
Direction
20
Chassis Ground
Input
2.1.4 ProII Cable Connections
The camera, PC, and optional video monitor are attached to the controller as shown.
Camera Cable to Camera
Crossover Ethernet Cable to PC Ethernet Port*
PPC06 -- 2 m (6')
STPX07 -- 2.1 m (7')
PPC06RA -- 2 m (6')
STPX25 -- 7.6 m (25')
PPC23 -- 7m (23')
or
PPC23RA -- 7m (23')
Standard Ethernet Cable to PC via Network Hub or
Switch
PPC32 -- 10 m (32')
STP07 -- 2.1 m (7')
PPC32RA -- 10 m (32')
STP25 -- 7.6 m (25')
Monitor Cable to Video Monitor (optional)
Serial Cable to PC Serial Port*
BNC06 -- 2 m (6')
DB906 -- 2 m (6')
BNC15 -- 5 m (15')
DB915 -- 5 m (15')
BNC30 -- 9 m (30')
DB930 -- 9 m (30')
2.2 Software Overview
The PresencePLUS application window is shown below.
14
Minneapolis, MN USA
Banner Engineering Corp.
2/2010
System Description
2.2.1 Main Menu Toolbar
Use the Main Menu toolbar to navigate between the Sensor options. Proceeding from left to right, the buttons in the
Main Menu toolbar step through the process of creating and controlling an inspection. Each button is explained in the
illustration below and in the table that follows.
The following table describes the screen associated with each button in the Main Menu.
Inspection-Specific Screens
Setup
Set up the camera, lens, trigger, and lighting to acquire images. Create a reference image to be
used later.
Tools
Add tools to an inspection. Build the inspection from scratch, or load tools from a previous
inspection file saved on the controller or a PC.
Teach
Teach the Sensor good products. This screen automatically configures the parameters chosen in
the Tools screen.
Run
Choose which inspection file the Sensor will run, and view the results of the inspection
System-Wide Screens
System
Set up the discrete inputs and outputs and communication configuration. This screen also has the
Sensor diagnostic tools.
Save
Name the current inspection files and save them to the controller or a PC for future use.
Help
Call the Help window or the About window.
Banner Engineering Corp.
Minneapolis, MN USA
15
System Description
2/2010
2.2.2 Image Window
The Image window, on the left side of the screen, displays images acquired from the camera or the reference image
that is set for the current inspection. The toolbar buttons in the Image window are explained below.
Note: The reference image is used as a template for developing an inspection; it establishes the initial values for
the Vision tools. The reference image also is used by Quick Teach.
Icon
Description
Zoom -- toggles zoom control. When enabled, click on the image window to zoom in and
right-click to zoom out. This button is active when an image is displayed in the Image
window.
Expand Image -- toggles the size of the Image window between maximum and minimum.
Selected ROI / ALL ROIs -- toggles between the currently S elected Region of Interest
(ROI) and A ll ROIs.
2.2.3 Navigation/Results Window
The Navigation/Results window, at the bottom of the screen, displays tool navigation buttons or inspection results
files.
16
Minneapolis, MN USA
Banner Engineering Corp.
2/2010
System Description
Navigation Buttons
Clicking on the Tools button in the Main Menu toolbar brings up the tool navigation buttons in the Navigation/Results
window. When setting up or using tools, click on any tool navigation button to get the corresponding tab in the
Configuration window.
LOCATE_1 (or BLOB_1)
Tool name
A
Absolute
R
Relative
Locate (or Blob)
Tool type
Absolute and Relative Tools
An absolute tool’s Region of Interest (ROI) does not move in the image window. A relative tool shifts the ROI from
the previous tool, relative to the position of the part.
The Location tools (for example, Locate) track parts in the Image window, and the Vision tools that follow (for example,
Average Gray Scale and Blob Detect) are relative. A Vision tool that precedes all Location tools will be absolute. Rules
governing whether a tool is absolute or relative are as follows:
• The first Location tool is always absolute.
• All tools following a Location tool are relative to that tool unless they are made absolute themselves, in which case
the chain is broken, and a new chain is started.
• For a Vision tool to be absolute, it must be placed before any Location tools.
Navigation/Results Toolbar Buttons
Using the Navigation/Results toolbar buttons, the Navigation/Results window size can be set, and tools can be deleted.
Icon
Description
Expand Results -- toggles the size of the Navigation/Results window between
maximum and minimum.
Delete Selected Tool -- deletes the selected tool from the current inspection.
Delete Selected Tools -- deletes the selected tool and all the tools to the right of
the selected tool.
Banner Engineering Corp.
Minneapolis, MN USA
17
System Description
Icon
2/2010
Description
Copy Selected Tool -- clones the selected tool.
Expand Button
Clicking on the Expand button (
) toggles the size of the Navigation/Results window to accommodate an expanded
list of inspection results files, as shown below.
2.2.4 Configuration Window
The Configuration window, on the right side of the screen, displays the currently selected options with multiple tabs.
Clicking the Setup, Tools, Teach, Run, System, Save, or Help buttons on the Main Menu toolbar changes the contents
of the Configuration window accordingly.
18
Minneapolis, MN USA
Banner Engineering Corp.
2/2010
System Description
2.2.5 Status Window
The Status window, shown below, provides the following Sensor feedback.
The following table provides descriptions of each region in the Status window:
Region
Description
Connection info -- current sensor to which the PC is
connected.
Image update completion -- progress bar shows relative
image update completion when an image is being
transferred from the camera to the PC (this flickers, and
is next to Connection: Sensor 192.168.0.1).
Current zoom value - works with the Zoom icon
(magnifying glass).
Current grayscale value -- the 0-255 gray scale value of
the pixel under the cursor.
Banner Engineering Corp.
Minneapolis, MN USA
19
Region
Description
Cursor position -- displays the x, y coordinates of the
pixel under the cursor relative to the upper-left corner
(origin, which is 0,0) of the field of view. Note that you
must have the mouse pointer hovering over the image to
get this information, otherwise, it displays
(-1,-1).
Current image display resolution -- displays the
user-specified value, which can be from 1:1 to 64:1. Note
that this does not affect how the sensor operates; it only
affects sensor-to-GUI image communication speed, and
is more useful when using Serial communication.
Getting Started
Chapter 3
This section begins with some Vision basics, then provides a brief overview of how to install the software, and the
general steps to creating an inspection.
3.1 Installing the PresencePLUS Software
The PresencePLUS software CD includes the sensor software and this documentation.
3.1.1 Installing the Software
To install the PresencePLUS software:
1. Close all active programs.
2. Make sure that no previous installations of PresencePLUS are installed.
3. Insert the PresencePLUS CD into the CD ROM drive of the personal computer. If you have auto-start enabled, the
CD should automatically start. If it doesn't start -a. Double-click on the My Computer icon on the desktop.
b. Double-click on the CD Drive in the list that appears.
c. Double-click on the PresencePLUS autorun file.
4. When the Install screen appears, click PresencePLUS PC Software.
5. Follow the instructions on the screen.
6. When the installation completes, reboot the PC.
3.1.2 Starting Up the Software
1. Power up the PC.
2. Install the software if it has not been installed. The installation screen of the PresencePLUS Pro software CD is
shown below.
Banner Engineering Corp.
Minneapolis, MN USA
21
Getting Started
2/2010
Note: The following instructions assume you are installing the software on Windows XP.
3. If using an Ethernet communication cable, configure the IP address as follows:
a. Open Network Properties on the PC (right-click on the Network Neighborhood icon).
22
Minneapolis, MN USA
Banner Engineering Corp.
2/2010
Getting Started
b. On the Local Area Connection, right-click on Properties.
Note: The PC in the example above has a second network card which is used to connect to the camera so
it is using Local Area Connection 2.
c. In the dialog, click on Internet Protocol (TCP/IP) and click the Properties button.
4. In the Internet Protocol (TCP/IP) Properties dialog, select Use the following IP address and make sure that the
the IP address is 192.168.0.2, and the subnet mask is 255.255.255.0.
Banner Engineering Corp.
Minneapolis, MN USA
23
Getting Started
2/2010
5. Start the sofware.
6. Upon initial startup, the software communication is not configured, and the following error message is displayed.
7. Click Yes to open the Communication screen.
8. Establish communications as follows:
Ethernet
Connection 1. When the software is started for the first time, the IP address is "Localhost." Choose Ethernet
(RJ 45).
2. Change the IP address to 192.168.0.1 (default IP address of the sensor).
3. Click OK.
24
Minneapolis, MN USA
Banner Engineering Corp.
2/2010
Getting Started
3.2 Typical Setup and Startup Sequence
The following subsections proceed through a typical Sensor setup and startup sequence
1.
2.
3.
4.
Connect and power up the hardware.
Start up the software.
Set up hardware parameters.
Build and run an inspection.
3.3 Startup and Troubleshooting
The following explains how to verify connections and start the PresencePLUS software.
1. Check the following essential components.
• Camera
• C-mount lens
• Camera cable
• Controller
• Communication cable (Ethernet or serial)
• Windows PC running NT, 2000, ME, or XP
• 10-30V dc with 1.5A power supply
• Light source. Every application requires a light source; however, the Sensor can be used without a dedicated light
source.
• Trigger source (for example, Banner WORLD-BEAM QS18VN6D™ sensor)
2.
3.
4.
5.
Thread the lens onto the camera.
Connect the camera cable between the camera and the controller.
Connect the communication cable between the PC and controller.
Verify the trigger source is connected to the controller terminal block as follows:
• +V (brown) to pin 1.
• -V (blue) to pin 2.
• Trigger (black) to pin 3.
6. Verify the power supply is connected to the controller terminal block as follows:
• Connect +V to pin 1.
• Connect -V to pin 2.
7. Verify PC configuration.
• Ethernet connection: IP address of PC is 192.168.0.2.
• Serial connection: A dial-up network has been established, and the network is a point-to-point protocol (PPP).
8. Power up the hardware and verify that the Error LED turns off.
Banner Engineering Corp.
Minneapolis, MN USA
25
Getting Started
2/2010
• During powerup, all the controller LEDs illuminate for 15 to 20 seconds.
• After the Red Error LED turns OFF, verify that the Green power LED is flashing.
9. Launch the Software.
• Click Start > PresencePLUS to start the program.
• If the sensor has a different IP address than the default address (192.168.0.1), or if it is connected through a serial
connection, the following error message will display:
Sensor not found on specified IP address 192.168.0.1.
Do you want to try another IP address?
• Click Yes to access the System Setup window.
• Click on the Sensor select tab, and change the conection setup as follows:
Ethernet Connection -1. Select Ethernet (RJ45) in the drop-down menu.
2. Change the IP address to the address of the sensor to which the PC is connected.
3. Click OK.
Serial Connection -1. Select PC Serial in the drop-down menu.
2. Click OK.
3.3.1 General Troubleshooting
The following table describes solutions to the most common problems in using thePresencePLUS software. For further
assistance, contact Banner Engineering.
Problem
Cause/Solution
• Green Power LED on sensor is not ON.
• Interface cannot connect to the sensor.
• No image on the monitor.
Sensor not getting enough power.
• No image on PC or monitor.
• Green Ready LED on sensor is OFF.
• The software seems to be working correctly, but the
image is missing.
Run display set to "None"
• Error message "Failed to capture a full-resolution image.
Please try again."
• Image is frozen on the PC and monitor.
• Green Ready LED on sensor is OFF
Software restart needed or there are loose connections.
• Error message "Failed to capture a full-resolution image.
Please try again."
• Image is frozen on PC, but image on monitor updates
properly.Image is frozen on PC, but image on monitor
updates properly.
Ethernet connection lost.
26
• Check the connection to the power supply.
• Ensure that the sensor is receiving trigger signals.
Sensor not receiving triggers
• If the connections are secure, call a BannerApplications
Engineer.
• Restart the PresencePLUS software.
• Check all connections.
• If a software restart does not correct the problem and the
connections are secure, call a Banner Applications
Engineer.
• Reconnect the cable.
• Check the cable for breaks, then power down and back
up.
• Replace the cable.
Minneapolis, MN USA
Banner Engineering Corp.
2/2010
Getting Started
Problem
Cause/Solution
• Indicator lights on RJ-45 port are OFF.
• Attempt to close and reopen PresencePLUS software.
• If none of these actions fix the problem, call a Banner
Applications Engineer.
• Focus number does not update.
• QuickStart fails.
• Errors when saving inspections to the sensor.
FTP communications is blocked.
• Error code is displayed on PC.
• A list of error codes and potential causes and solutions
are available in the main help.
• Disable TCP/IP Firewall software on the PC.
3.4 Setting Up Hardware Parameters
If the Sensor is being run for the first time, or if changes have been made to the hardware, then you may need to set
or modify hardware parameters.
1. Click on System in the Main Menu toolbar.
2. Configure the Trigger parameter according to the trigger device being used. For example, if using the QS18V6ND
as the trigger device, then select NPN.
3. Configure the six discrete inputs/outputs.
4. If the controller triggers a strobe light source, set the strobe trigger options.
5. If using the product select, configure the product select and product change lines to be NPN or PNP as required.
6. Click on Setup in the Main Menu toolbar, select Trigger tab, and configure the remaining parameters:
• Polarity
• Minimum Trigger Width
• Trigger delay
• Trigger Divide
3.5 Building an Inspection
The automatic screen sequence starts with the Setup screen, hich results from thefirst button (Setup) in the Main Menu
toolbar. Subsequent screens are shown below in the Main Menu toolbar layout.
1. Setup screen:
a. Set up the camera, lens, and lighting.
b. Choose trigger option Continuous for a live image.
Banner Engineering Corp.
Minneapolis, MN USA
27
c. Click Auto-exposure to adjust the image brightness.
d. Focus the lens by turning the lens focusing ring until the focus value is maximized.
e. When the desired image is shown, click Next to proceed to the Tools screen.
2. Tools screen:
a. Add Location tool(s) to find the target to adjust the Regions of Interest (ROI) for translational and rotational
changes.
b. Required: Add Vision tool(s) to inspect the part.
c. Add Measure tools(s) to create distance measurements from points found.
d. Required: Add Test tool(s) to set the Pass/Fail criteria (Vision and Measure tools are inputs to the Test tool).
e. Click Quick Teach to automatically set all the selected parameters in the Test tool and to proceed to the Run
screen, or click Next to proceed to the Teach screen and to teach a sample set of good products.
Note: To keep specific, user-defined parameters in a Test tool, skip Teach and go directly to Run.
3. Teach screen:
The Teach screen automatically configures the parameters chosen in the Tools screen.
a.
b.
c.
d.
Chooose the sample size.
Click Start.
Trigger the controller with the external trigger device.
Click Stop.
Note: Before entering Run, save inspection file to one of the memory locations on the controller.
e. Click Next to proceed to the Run screen.
Note: Save a backup copy of the inspection to the host PC.
4. Run screen:
Select an inspection fo run, and review the results of the inspection.
• To select an inspection (in the Select tab), enable Software Override, and select the inspection file from the list
of stored inspections on the camera.
• An alternate method is to use Hardware input to select an inspection via discrete inputs to the controller.
5. Begin inspection:
To begin inspecting, click the Start button in the Run screen.
Setup
Chapter 4
4.1 Setup Screen
The Vision sensor has two modes: running and idle. If the sensor is idle when you start up thePresencePLUS software
while your PC is connected, the software starts in the Setup screen. If the sensor is running, then the software starts in
the Run screen.
4.2 Capturing a Reference Image
The reference image is used as a template for developing an inspection. The Vision tools use this image to acquire the
critical information needed for the inspection.
Acquiring a quality image is crucial for a successful inspection. A quality image shows a measurable and repeatable
difference between good products (which pass inspection) and bad products (which fail inspection). Most commonly,
what determines the quality of the image is the illumination.
4.3 Focus Tab
The Focus tab on the Setup screen is used to:
• Reference Image Source on page 30
• Focus Value on page 31
• Auto Exposure on page 31
Focus tab
Banner Engineering Corp.
Minneapolis, MN USA
29
Setup
2/2010
4.3.1 Reference Image Source
Before capturing an image, you need to determine what will trigger the Sensor to capture and image.
The Sensor can be triggered to capture an image in one of the following ways.
Trigger Option
Description
Continuous
The sensor will update continuously in Setup mode.
30
Minneapolis, MN USA
Banner Engineering Corp.
2/2010
Setup
Trigger Option
Description
External
Images are acquired only in reponse to a signal from an external source as configured on the
Trigger tab. Choose External if the part will be moving during the inspection to capture an
image with the same conditions as the inspection conditions.
Manual
Images are acquired only then the Trigger button is clicked. The Trigger button is grayed
out when any trigger option other than Manual is selected.
From Disk
If you check this option, the a Trigger button allows you to browse for an image to load
from disk.
Note: The trigger options described above are used only in the Setup routine. Note, though, that Run mode does
require an external trigger.
4.3.2 Focus Value
The Focus value on the Focus tab is a number between 1 and 255.
To focus the lens, place the target object so that the area to be focused appears
on the center of the displayed image. You can use the image on the PC to
determine when the image is sharp enough, or you can use this Focus value
as a guide. Turn the focus ring on the lens until the Focus value is at the highest
possible number between 1 and 255. Note there is no optimal value for this
number, but it can be used as a guide if setting up more than one camera
focused on the same target.
4.3.3 Auto Exposure
When you click Start in Auto Exposure, the exposure time and gain are optimized for the current inspection and the
Status field provides feedback.
Field
Description
Status
The following are status possibilities:
• Not running -- Auto exposure has not been activated since entering this screen.
• Running -- Auto exposure is currently running.
• Finished -- Auto exposure has run and is complete.
• Image too dark -- Auto exposure could not brighten the image enough.Add more light
to the inspection, or increase the exposure manually.
Banner Engineering Corp.
Minneapolis, MN USA
31
Setup
Field
2/2010
Description
• Image too bright -- Auto exposure could not darken the image enough. Remove light
to the inspection, or decrease the exposure manually.
Exposure Time
Exposure time is the amount of time the camera allows light to energize the image chip.
Increasing the exposure time (that is, moving the slider to the right) allows more light to
energize the image chip, which brightens the image.
Gain
Gain is an electronic boost to the image signal. Increasing gain (that is, moving the slider
to the right) increases image brightness without increasing exposure time.
Note: Gain brightens both the light pixels and dark pixels. High gain values will
make the image appear grainy.
4.4 Trigger Tab
An external trigger is used to tell the Sensor when to capture an image. You can modify the validity and timing of the
trigger by setting the parameters on the Trigger tab.
Note: Parameters set in the Trigger tab are stored in the inspection file and can be different for each inspection.
Trigger tab
32
Minneapolis, MN USA
Banner Engineering Corp.
2/2010
Setup
4.4.1 Trigger Settings
Field
Description
Trigger Divide (range:
1-10,000 triggers)
Sets the sequence of valid triggers. If set to 1, an image is captured in response to every
valid trigger; if set to 2, and image is captured in response to every second valid trigger,
and so on.
Trigger Delay (range:
0-8,000 ms)
Fixed time (ms) from the instant the Sensor receives a valid trigger to the instant the
Sensor captures the image.
Minimum Trigger Width
(range: 1-8,000 ms)
Eliminates unwanted triggers by accepting triggers only if they are above a specified
duration.
Polarity
Choose Leading Edge to capture images at the leading edge of a trigger signal. Choose
Trailing Edge to capture images at the trailing edge of the trigger signal.
4.4.2 Resolution
Increases or decreases the resolution on the displayed image. A lower resolution will have a faster PC update. The
resolution does not change the inspection. Resolution options are 1:1, 4:1, 16:1, and 64:1.
Banner Engineering Corp.
Minneapolis, MN USA
33
Setup
2/2010
4.5 Advanced Tab
The Advanced tab on the Setup screen allows you to adjust the field of view (FOV). The FOV is the image area at the
focal plane of a camera.
You can use the maximum FOV or adjust the FOV to improve performance. The FOV dimensions are shown in the
Advanced tab.
Default Mode
The Default Mode determines whether to use the Current FOV or Maximum FOV
by default.
Maximum and adjusted FOV
The FOV is denoted by the green box surrounding the image in the Setup screen. The maximum FOV is shown
below.
To improve performance, reduce the size of the FOV either vertically, horizontally, or both, as shown below.
34
Minneapolis, MN USA
Banner Engineering Corp.
2/2010
Setup
4.6 Considerations When Setting up Color Inspections
4.6.1 Primary Colors
A color Vision sensor has a color imaging chip that, rather than providing just a gray scale value along with the grid
location, actually provides a color intensity value for each of the primary colors of light: red, green, and blue.
Variations
of color intensity for each of these primary colors provides all other shades of colors.
Banner Engineering Corp.
Minneapolis, MN USA
35
Setup
2/2010
Red, Green, Blue (RGB)
Red, Green, and Blue (RGB) is a representation of additive color space where red, green and blue are combined to
create other colors. This is the primary method for showing color on monitors and televisions.
The RGB color space is represented as a cube with the three primary colors whose ax
es are perpendicular to each other.
Black is the absence of all primary colors; that is, the intensity of all three primary colors is zero [0,0,0]. White is the
presence of of all primary colors; that is the intensity of all three primary colors is 255 -- [255,255,255].
A color value is specified with three numbers between 0 - 255, each representing Red, Green and Blue. For example,
the particular green shown above is [80,200,130].
Note: Typically, with a Color Vision sensor, none of the primary colors will be specified at either end of the
Intensity range (0 or 255). The sensor has an optimum Intensity range and the predominant primary color will
typically be around 200, and the other primary colors will be adjusted accordingly so that they do not fall out of
this optimum Intensity range.
Hue, Saturation, and Intensity (HSI)
One way to look at color is not in terms of red, green, and blue, ut
b as hue, saturation, and intensity (HSI).We generally
do not see things as quantities of primary colors mixed in certain proportions. Rather, we see things as colors, or hues,
that either are " washed-out" or vivid. This means having low or high saturation, respectively.
Hue, saturation, and intensity, then, are three dimensions that provide a representation of color space that is closer to
human perception of color dynamics. "Colors" are defined as H, S, and I ratios are represented as a cone. The cone
shape has one central axis representing intensity. Along this axis are all the gray values, with black at the pointed end
of the cone and white at its base. The greater the distance along this line from the pointed end, or origin, the brighter
or higher the intensity.
4.6.2 Setting up a Color Inspection
To set up a color inspection, you need to calibrate the color imager for existing lighting conditions.
Auto Exposure
In order to ensure that the image is bright enough to perform accurate color sensing when setting up a color inspection,
the ROI should be placed over the color of interest:
1. Draw an ROI over the color in which you are interested.
2. Click the Start button.
36
Minneapolis, MN USA
Banner Engineering Corp.
2/2010
Setup
Practically speaking, auto-exposing in this way ensures that the camera is kept in the optimum range of the R-G-B
scale.
White Balance
White balancing is the process by which a color imager is calibrated for existing lighting conditions. Due to the large
variation in light sources and the fact that the R, G, and B channels on the imager are analyzed independently, a color
sensor just out of the box may not have a true color image initially. The White Balance routine is found on theAdvanced
tab of the Setup menu.
1. Draw a ROI over a region on the image that is known to be white.
Banner Engineering Corp.
Minneapolis, MN USA
37
Setup
2/2010
Draw the WB ROI on a region of the image known to be white. This routine will automatically adjust the gain for
each of the R, G, and B channels in an effort to make the area in the WB ROI appear white. Strange effects can
occur if the area in the WB ROI is not in fact white as shown below when white balancing on blue. This effects
will carry over to the gray scale version of the image too.
38
Minneapolis, MN USA
Banner Engineering Corp.
2/2010
Setup
2. Click Start to calibrate the color settings.
3. Click Next to go to the Tools tab.
Banner Engineering Corp.
Minneapolis, MN USA
39
Setup
40
2/2010
Minneapolis, MN USA
Banner Engineering Corp.
Tools Screen
Chapter 5
5.1 Overview
Using the Tools screen, the user establishes the inspections that the Sensor will execute. Three sources of inspections
are available:
1. Building an inspection from scratch is the typical method of establishing an inspection. The Tools screen is
designed to aid the user in building an inspection. A typical inspection consists of Location Tools, followed by
Vision Tools, Analysis Tools, and finally (if required) the Communication Tool. The Tools screen, shown below,
supports this inspection organization.
2. Existing inspections can be obtained from the sensor (with or without the reference image) for execution or
modification. This method is very useful if the user has an existing inspection on the controller and needs to make
modifications to establish a new inspection.
3. Existing inspections also can be obtained from host resources using the Library. In this case, the sources of the
inspections are the host’s hard drive or network resources. This method provides access to an unlimited number of
existing inspections (with or without the reference image) for execution or modification.
5.2 Typical Build/Modify Procedure
5.2.1 Choosing a Tool
To choose the right tools for an inspection, consider the tool's parameters and result options:
• Parameters are selected inputs for each tool (for example, relative threshold).
• Results are the information returned from the tool after it has executed.
Some tools perform evaluations, while others provide positional data for the tools that follow. Test tools evaluate,
combine, or compare the results of other tools and determine a Pass-or-Fail judgment.
Banner Engineering Corp.
Minneapolis, MN USA
41
Tools Screen
2/2010
Note: Test tool must be chosen to evaluate the results of each tool or set of tools.
5.2.2 Adding a Tool
The following steps provide an overview for setting up tools in an inspection. Steps not available for some of the
Location or Analysis tools are noted.
1.
2.
3.
4.
5.
6.
7.
Click the button of the tool to be added to the inspection.
Rename the tool.
Draw the ROI (not available for Analysis tools).
Set Input options to indicate the expected results (not available for the Test tool).
Add a Test tool.
Configure the Test tool inputs and, if desired, configure the desired results.
Set the judgment tolerances in one of three ways:
• Use Quick Teach.
• Use Teach.
• Manually set the judgment tolerances.
5.2.3 Adding a Test Tool
The following steps provide an overview for adding a Test tool to an inspection.
1. Add a Test tool.
2. Configure the Test tool inputs.
3. Set the judgment tolerances.
5.2.4 Renaming Tools
The default name of each tool can be edited or replaced (examples: GS_1, TT_2). Each name must be unique.
To edit the tool name, click on the Name field (double-click to select the entire name), and type to change or replace
the name.
• Enter up to 49 characters; only alphanumeric characters and underscores are valid.
• The button in the Navigation/Results window that appears will show the first nine characters after exiting the tool.
5.2.5 Removing a Tool
To remove a tool:
1. Choose the tool to be removed in the Navigation/Results window.
2. Click the Delete button in the lower-left corner of the screen.
5.3 Quick Teach
Quick Teach provides the fastest and easiest method of establishing an inspection. Quick Teach will use the reference
image to establish Pass/Fail parameters of the Test tools.
Quick Teach does the following:
• Executes the inspection on the reference image.
• “Learns” the results of the Vision tools.
• Applies the applicable tolerances (user-determined, but default is 10%) to the selected parameters in the Test tool
(these parameters determine the Pass/Fail criteria for each Test tool within the inspection).
42
Minneapolis, MN USA
Banner Engineering Corp.
2/2010
Tools Screen
Note: Quick Teach discards any manually-entered values in the Test tool. Manually-entered values must be
entered after Quick Teach has been performed, or they will be lost.
Click Quick Teach to:
• Run all the tools.
• Calculate the measurements.
• Add a percentage of tolerance around taught values.
• Save the inspection to the controller.
• Go to Run.
5.4 Load Tab
The Load provides a way to load a saved inspection and a reference image.
Load Tab
Banner Engineering Corp.
Minneapolis, MN USA
43
Tools Screen
2/2010
5.4.1 Flexible Inspection Loading
Release 2009R1B introduces a more flexible inspection loading capability that allows most inspections created by any
PresencePLUS vision sensor to be loaded through the PresencePLUS software even if connected to a different type
of PresencePLUS vision sensor. This means that you can now load, for example, an inspection created by an OMNI
1.3 into PresencePLUS software connected to a standard OMNI. Prior to Release 2009R1B, inspections could only
be loaded into PresencePLUS software that was connected to the same type of PresencePLUS vision sensor that had
created the inspection. In other words, a ProII camera could only load inspections created by another ProII camera,
and an OMNI could only load an inspection saved from another OMNI, etc.
Note: The one limitation that still exists occurs when trying to load an inspection that uses a tool that is una
vailable
(or unlicensed) for the currently connected sensor (for example, attempting to load to an inspection that uses a
Geometric Count tool to a PresencePLUS AREA sensor will not work because the Geometric Count tool is not
supported on the AREA sensor).
Inspection Source Inspection Destination Result
Possible Inspection Modifications
Color sensor (for
example, a Color
OMNI)
Standard grayscale
sensor (for example, a
standard OMNI)
A dialog indicates that the image None required
color has changed and the
inspection loads
Grayscale sensor
(for example, a
standard OMNI)
Color sensor (for
A dialog indicates that the image None required
example, a Color OMNI) color has changed and the
inspection loads
High Resolution Standard VGA sensor
(1.3) sensor (for
(for example, a standard
example, an
AREA sensor)
AREA 1.3 sensor
)
A dialog indicates that the
Reposition image, adjust ROIs and
image/FOV has been adjusted tools in the FOV, and possibly
and the image loads the image acquire a new reference image
into the upper-left of the FOV.
Note that the image may be
cropped at the right and/or
bottom and ROIs may be outside
the image area
Standard VGA
sensor (for
example, a
standard AREA
sensor)
A dialog indicates that the FOV Possibly acquire a new reference
has been adjusted and the
image
inspection loads with the image
centered in the FOV
High Resolution (1.3)
sensor (for example, an
AREA 1.3 sensor)
Sensor with 6 I/O Sensor with 4 I/O (for
(for example, a
example, an OMNI)
ProII)
A dialog indicates that the
inspection uses I/Os not
available on the sensor and the
inspection loads
Sensor that
supports a larger
maximum trigger
delay, trigger
width, NTSC
fail/hold time, or
exposure time (for
example, a ProII
maximum trigger
delay set to 10000
ms)
A dialog indicates that the timing Retest and modify timings as
was adjusted and the inspection appropriate, and possibly acquire a
loads with the timing(s) adjusted new reference image
to the maximum time allowed on
that sensor
44
Sensor that supports a
smaller maximum trigger
delay, trigger width,
NTSC fail/hold time, or
exposure time (for
example, a standard
OMNI maximum trigger
delay set to 8000 ms)
Minneapolis, MN USA
Adjust I/O as appropriate
Banner Engineering Corp.
2/2010
Tools Screen
5.4.2 Inspection Storage Capacity
The INS file format allows for the storage of inspection files onboard every sensor. The table below shows the storage
capacity for the various Vision sensors. Stored inspections can be modified, run, or deleted on the sensor.
Sensor Type
INS Storage Memory
Number of INS Files
Number of INS files
without Reference Images*
Pro II
64MB
188
999
Pro II Color
64MB
160
999
Area/GEO/Edge
8MB
150
500+
OMNI
32MB
85
999
OMNI Color
32MB
72
999
Pro II 1.3
64MB
44
999
OMNI 1.3
64MB
44
999
8
400+
20
999
BCR
GEO/Edge/Area/BCR 1.3
32
*Not saving a reference image with the inspection frees up a lot of room onboard the sensor. However, inspections
that include any of the following tools require a reference image to be saved:
• Geometric Find
• Geometric Count
• Pattern Find
• Pattern Count
• Color Match
• Color BLOB
5.4.3 Opening an Inspection from the Sensor or a Library
Inspections can be stored on the sensor or to a libary of inspections stored on a PC or network drive. To select and
open an inspection from the sensor or a library:
1.
2.
3.
4.
Click the Load tab.
From the Load from drop-down list, select the Sensor or a location on a PC or Network.
Select the desired inspection.
Click the Load button.
The tools from the selected inspection populate the Navigation/Results window. At this point, all tools in the inspection
can be modified. If new tools are to be added, simply select the tool in theTool screen. If tools are to be deleted, select
the tool and click the Delete icon.
Note: If you want to see the the image stored with the inspection, check the Load reference image box.
Banner Engineering Corp.
Minneapolis, MN USA
45
System Setup Dialog
Chapter 6
This section describes how to configure the sensor and diagnose system errors in the System Setup window.
6.1 Sensor Select Tab
Use the Sensor Select tab to establish the Sensor connection with the PC.
Note: An option box to open the Sensor Select tab is automatically displayed if the Sensor either is not connected
or is connected but with the wrong IP Address selected.
Sensor Neighborhood Fields
The Sensor Neighborhood will list sensors in your environment. The following describes the fields in the Sensor
Neighborhood.
Field
Description
Available
If the Icon is green (Yes), the sensor is available; if yellow, a connection can't be established
for some reason; if red (No), the sensor is not available.
Note: The sensor to which you are currently connected will sho up as unavailable (red
icon).
Name
The name of the sensor.
IP Address
The IP address assigned to the sensor.
Product ID
The sensor model and type.
Sensor Version
The sensor version.
Running Inspection Indicates whether the sensor is running or not.
Error
Indicates whether there is an error condition associated with the sensor.
MAC
The MAC address of the sensor.
PC (GUI) to Sensor Connection Setup
This selection is used to configure the communication link between the GUI (Graphical User Interface) and the sensor.
There are two possible selections, Ethernet (RJ45) and Serial:
• Ethernet (RJ45)
This selection will configure the GUI to communicate with the sensor using the Ethernet (RJ45) connection. To
establish communication you must enter the IP address of the sensor you would like to communicate with into the
"Connection IP Address" edit box or select the desired Sensor from the Sensor Neighborhood results. Then, click on
the "OK" button to connect.
• Serial
This selection will configure the GUI to communicate with a sensor via the Serial connection. To establish
communication you must first start Dial-Up Networking (DUN) on the PC.Then, click on the "OK" button to connect.
Banner Engineering Corp.
Minneapolis, MN USA
47
System Setup Dialog
2/2010
Sensor Select Tab
6.1.1 Change Sensor IP Address
To change a sensor's IP address:
1. Select the sensor in the Sensor Neighborhood
2. Click the Change Sensor IP Address button.
48
Minneapolis, MN USA
Banner Engineering Corp.
2/2010
System Setup Dialog
3. Click Next
4. Enter an appropriate sensor name in the New Sensor Name field.
5. Click Finish.
6.1.2 PC (GUI) to Sensor Connection Setup
Use this field to select whether the Sensor will communicate via the Ethernet port or a serial connection.
Banner Engineering Corp.
Minneapolis, MN USA
49
System Setup Dialog
2/2010
• If you select Ethernet (RJ 45), the Connection IP Address shows the IP address for which the software is looking.
Initially, the IP address should be 192.168.0.1, the default IP address of the sensor.
• If you select Serial, the IP address is not applicable.
6.1.3 IP Address History
Use this button to view previous IP Addresses and Subnet Masks.
50
Minneapolis, MN USA
Banner Engineering Corp.
2/2010
System Setup Dialog
6.2 Communication Tab
The Communication tab is used to configure:
• General Communication Setup
• Remote Command Configuration (RCC)
Communication Tab
Banner Engineering Corp.
Minneapolis, MN USA
51
System Setup Dialog
2/2010
6.2.1 Communication Setup
Banner Vision sensors support the following communication options:
• Ethernet Sockets 1-10
• Serial 1
• Industrial Ethernet
Ethernet Connection
In order to establish an Ethernet connection , the external device must be directed to the correct IP address and the
correct TCP port. In TCP/IP protocol, a TCP port number is used with the IP address to identify a specific path or
socket. The sensor has sockets 1 to 10, and can send out unique sets of data to 10 different devices.
Valid user TCP/IP port numbers are in the range of 1024 through 65535. The PresencePLUS GUI provides automatic
notification if you attempt to use a reserved port.
To view an Ethernet connection:
1. Click on the System button in the Main Menu toolbar to bring up the System Setup window.
52
Minneapolis, MN USA
Banner Engineering Corp.
2/2010
System Setup Dialog
2. Click on the Communication tab.
3. Choose a connection from the fixed Connection drop-down list of the Communication Tool Setup field.
Each Ethernet socket has a unique TCP port number as shown below
Note: The following addresses are defaults.
Socket
Default IP Address
Port
1
192.168.0.1
20000
2
192.168.0.1
20001
3
192.168.0.1
20002
4
192.168.0.1
20003
5
192.168.0.1
20004
6
192.168.0.1
20005
7
192.168.0.1
20006
8
192.168.0.1
20007
9
192.168.0.1
20008
10
192.168.0.1
20009
Banner Engineering Corp.
Minneapolis, MN USA
53
System Setup Dialog
2/2010
Serial Connection
The sensor has a single serial connection that you can configure, Serial 1:
• Serial 1 is the DB-9 connector.
Note: The Pro has 2 serial connections. Serial 2 in the dropdown list is to support those sensors.
Attribute
Default Setting
Baud Rate
115200
Data Bits
8
Parity
None
Stop Bit
1
Flow Control
None
To setup a serial connection:
1. Click on the System button in the Main Menu toolbar to bring up the System Setup window.
2. Click on the Communication tab.
3. Choose Serial 1 from the Connection drop-down list of the Communication Tool Setup field.
Note:
Because there is no flow control for the serial connections, the sensor wil not detect or log a lost or broken
connection
54
Minneapolis, MN USA
Banner Engineering Corp.
2/2010
System Setup Dialog
Industrial Ethernet
Protocol
Protocol selects which Industrial Ethernet protocol is being used. This changes the string format and the word/register
values reported in the PLC Map.
32 bit Format
32 bit Format determines how 32 bit integers and floating point values are stored in sequential 16 bit registers (words)
- least significant word first (LSW-MSW) or most significant word first (MSW-LSW).
Character String Order
For Modbus/TCP and PCCC protocols, characters in the string can be packed into registers according to either the
Standard String format or the ControlLogix Format1:
• Standard String Format is used when the Character String Order option is set to “High Byte – Low Byte” selection.
Please note that the length of the string is stored in one 16-bit register:
• ControlLogix packing format is used to store characters into registers when the Character String Order option is set
to “Low Byte – High Byte” selection.
Please note that in this particular case, the length of the string is still stored in one 16-bit register, and only
the order of characters in each 16-bit register follows the ControlLogix format:
Banner Engineering Corp.
Minneapolis, MN USA
55
System Setup Dialog
2/2010
6.2.2 Remote Command Channel Configuration
This section describes the commands that are supported to communicate with a Vision sensor. All commands are
case-insensitive
Remote Command Set
All RCC commands are case-insensitive. Valid characters for commands are 7-bit ASCII alphabetic or numeric
characters (A-Z, a-z, 0-9), dash (-) and underscore (_).
All commands have the following structure:
ACTiON OBJECT_IDENTIFIER QUALIFIER(S)
ACTION is an operation the user intends to perform on the OBJECT_IDENTIFIER. There are three possible actions
available:
• GET — used to retrieve information associated with the named object. This information can be a Boolean value, and
unsigned or signed number, a string or, for complex objects like the Communications tool, a field-delimited record
that includes other data types.
• SET — used to assign a value to a named object.
• EXEC — used to execute a pre-defined functional object or activity in the sensor. Activities may take object identifiers
as parameter qualifiers.
The table below identifies objects that are supported in the current RCC release, their identi
fiers, and the corresponding
actions that they will support. Items highlighted in bold are command keywords. Flag objects are appended with the
FLG suffix, status objects are appended with the STS suffix, and counters are appended with the CNT suffix.
56
Minneapolis, MN USA
Banner Engineering Corp.
2/2010
System Setup Dialog
System Object,
Component, or
Activity
Object or
Activity
Identifier
Support Actions Required
Qualifiers
Trigger
TRIGGER
EXEC
None
Optional
Qualifiers
Comments
Timeout (msec)
If no qualifiers are
specified, a 30
second timeout is
used.
or
NOWAIT
Product Change
PRODCHANGE EXEC
Numeric Inspection Timeout (msec)
ID
or
By default, a 30
second timeout is
used.
NOWAIT
Counter or Flag
Reset
RESET
EXEC
SYSERRFLG
None
Reset either the
System Error Flag,
Pass and Fail
counters, or
Missing Trigger
count.
or
PASSFAILCNT
or
MISSTRIGCNT
Remote Teach
RTEACH
EXEC
None
TRIGGER or
TRIGGER
NOWAIT or
TRIGGER
Timeout (msec)
Enables remote
teach. If no
qualifiers are
specified, remote
teach will occur on
the next trigger. If
TRIGGER
qualifier is
specified, remote
teach will occur
immediately, and
the command will
block until a
default 30-second
timeout expires. If
TRIGGER
NOWAIT is
specified, remote
teach will occur
immediately, and
the command will
return right away.
If a timeout value
is specified, the
command will
block until the
specified timeout
expires.
Online Status
ONLINESTS
GET
None
None
Retrieve the sensor
online status.
Ready State
READYFLG
GET
None
None
Returns 1 if the
camera is ready, 0
otherwise
Banner Engineering Corp.
Minneapolis, MN USA
57
System Setup Dialog
2/2010
System Object,
Component, or
Activity
Object or
Activity
Identifier
Support Actions Required
Qualifiers
Optional
Qualifiers
Comments
Current
Inspection
Number
INSPNUM
GET
None
None
Retrieve currently
running inspection
GET
None
CommTool
Numberor
CommTool
Name
Retrieve comm
tool results, either
by specifying its
sequential number
in the inspection
(1,2,..,n) or by
specifying its
name. By default,
data for the first
comm tool will be
retrieved.
Pass/Fail flag
PASSFAILFLG GET
None
None
Retrieve the value
of the Pass/Fail
flag - 1 if pass, 0 if
fail
System Error
SYSERRFLG
GET
None
None
Retrieve the value
of the System
Error - either 0 or
1
Frame Number
FRAMENUM
GET
None
None
Retrieve the
current frame
number
Pass Count
PASSCNT
GET
None
None
Retrieve the pass
count
Fail Count
FAILCNT
GET
None
None
Retreive the failed
count
Iteration Count
ITERCNT
GET
None
None
Retrieve the
Iteration Count
System Error
Count
SYSERRCNT
GET
None
None
Retrieve the
system error count
Missed Trigger
Count
MISSTRIGCNT GET
None
None
Retrieve the
missed trigger
count
I/O Line Status
IOSTS
GET
I/O line id,
numeric, either 1
through 4 or 1
through 6
None
Retrieve the
cached status of
the I/O line
Gain
GAIN
GET
None
Retrieve the gain
Gain
GAIN
SET
None
Set the gain
Exposure
EXPOSURE
GET
None
Retrieve the
camera exposure
Communications COMMTOOL
Tool Results
58
Positive Integer
Minneapolis, MN USA
Banner Engineering Corp.
2/2010
System Setup Dialog
System Object,
Component, or
Activity
Object or
Activity
Identifier
Support Actions Required
Qualifiers
Optional
Qualifiers
Comments
Exposure
EXPOSURE
SET
Positive Number
None
Get the camera
exposure
Frame Number
Tag
FRAMETAG
SET
ENABLE
None
Enables frame
number as
command
acceptance
indicator
Frame Number
Tag
FRAMETAG
SET
DISABLE
None
Disables frame
number as
command
acceptance
indicator
Frame Number
Tag
FRAMETAG
GET
None
None
Retrieve the status
of the frame tag
indicator
Coordinate tool
Commands
Syntax
Description
set coordtool tool_name|tool_number x\y|angle
Returns the specified Coordinate tool output.
get coordtool tool_name|tool_number x\y|angle
Gets the value
Math tool and the Remote Command Channel
Commands
Syntax
Description
set mathtool tool_name|tool_number value operand_1|operand_2 Sets the specified tool operand, if it is a constant.
Value should be a floating number.
get mathtool tool_name|tool_number operand_1|operand_2
Gets the value of the specified tool operand, if it
is a constant.
String tool
Commands
Syntax
Description
set stringtool tool_name|tool_number operand_1|operand_2 value Sets the specified tool operand, if it is a constant.
Value should be a quoted string (see Character
Strings on page 331).
get stringtool tool_name|tool_number operand_1|operand_2
Banner Engineering Corp.
Gets the value of the specified tool operand, if it
is a constant.
Minneapolis, MN USA
59
System Setup Dialog
2/2010
OCV Tool and the Remote Command Channel
Commands
Syntax
Description
set ocvtool tool_name|tool_number exp_string value
Sets the expected string, if it is a constant. The
Value should be a quoted string containing
printable ASCII characters (see Character Strings
on page 331).
get ocvtool tool_name|tool_number exp_string
Gets the value of the exptected string.
Examples
Set Command Example Assuming that you have two OCV tools, my_ocv_tool_1 and my_ocv_tool_2, each with
their first operand configured as a constant. To set the constant of the second ocvtool to
foobar, issue the following command:
set ocvtool my_ocv_tool_2 "foobar"
or
set ocvtool 2 "foobar"
Get Command Example
To get the constant of the second ocvtool, issue the following command:
get ocvtool my_ocv_tool_2
or
get ocvtool 2
RCC Return Values
RCC return values are numeric, and are listed below:
• 0 - command accepted. This return code is generated when a valid SET, GET, and EXEC command has been completely
handled by the sensor. It may be followed by a command-specific return value or a completion code.
If the frame tag is enabled, the current frame number will be returned instead of 0 as command acceptance indicator.
• -100 - Invalid command entered by the user.
• Trigger and Product Change error codes:
• -201 - Product change command attempted in the middle of the inspection
• -202 – Trigger command attempted in the middle of product change
• -203 – Trigger command is attempted when the inspection is not executing (sensor is idle)
• -204 – Specified inspection slot is out of range
• -205 – Trigger command attempted in the middle of the inspection
• -206 – Product change command attempted in the middle of a product change
• -207 – Product change command attempted while the sensor is in the Teach mode
• -208 – Product change attempted when the GUI is connected, and the inspection is not executing
• Comm tool error codes
• -301 – get/set tool command attempted while the inspection is not executing
• -302 – get command issued before inspection is triggered for the first time – tool results unavailable
60
Minneapolis, MN USA
Banner Engineering Corp.
2/2010
System Setup Dialog
• -303 – get/set tool command attempted in the middle of the inspection
• -304 – get/set tool command attempted in the middle of the product change
• -305 – Tool specified in get/set command not found in the inspection
• -306 – Requested comm tool is not configured for RCC
• -307 - Tool executed with an error or did not execute
• -308 - Specified tool operand is not a constant, and cannot be modified
• Reset command error codes
• -401 – Reset command attempted in the middle of the inspection
• -402 – Reset command attempted in the middle of the product change
• -500 – RCC commands are not accepted because the sensor is in the Playback mode
• Timeout error codes
• -600 – Product change timeout occurred
• -601 – Trigger timeout occurred
• -700 – Specified value is out of range
• -701 – Set Gain command attempted when the GUI is connected and the inspection is not executing
• -702 – Set Exposure command attempted when the GUI is connected and the inspection is not executing
• -800 – Product Change, Trigger or Get Commtool command attempted when either Product Change or Trigger
Command timeout occurred, but the operation has not yet completed.
Frame Tag Numbers
RCC provides user with a debug facility that allows users to correlate command completion with current frame numbers.
This facility is enabled by issuing a SET FRAMETAG ENABLE command. This command will cause RCC to send
the current frame number as the command acceptance code. This will allow users to track when each command was
issued, and which frame it applies to.
For EXEC TRIGGER command, returned number will be the frame number at the completion of the inspection
execution.
For EXEC TRIGGER command, returned number will be the frame number at the completion of the inspection
execution.
For all other commands, the returned number is the current frame number.
Command Processing
RCC commands are interpreted in the context of the running PPVS system. Due to the constantly changing system
state caused either by external action or by previous RCC commands, certain rules are imposed on RCC command
acceptance and processing. Please note that command acceptance does not constitute successful completion of the
command.
1. EXEC TRIGGER command can be successfully accepted under the following conditions:
• Inspection is Executing and is Ready
2. EXEC PRODCHANGE command can be successfully accepted under the following conditions:
• Sensor is idle (inspection is not loaded), and the GUI is not connected
• Inspection is Executing and is Ready
• Sensor was previously product changed to an invalid slot
3. EXEC RESET command can be successfully accepted under the following conditions:
• Sensor is idle (inspection is not loaded)
• Inspection is Executing and is Ready
4. SET GAIN or SET EXPOSURE commands can be successfully accepted under the following conditions:
Banner Engineering Corp.
Minneapolis, MN USA
61
System Setup Dialog
2/2010
• Inspection is Executing and is Ready
5. GET status, counter or flag commands can be accepted at any time. If issued when inspection is Executing but is
not Ready, these values may change as the inspection is executing.
6. GET COMMTOOL command can be successfully accepted if the inspection has been loaded. However, RCC may
not have valid data until the inspection has been triggered (executed) at least once.
Commands with timeouts, such as EXEC TRIGGER and EXEC PRODCHANGE, will block processing of additional
commands while they are executing if they are invoked without the NOWAIT option. Additional commands that are
issued while processing is blocked will be queued, and will be processed in the order that they were received when the
blocking command finishes its execution.
When blocking commands, such as EXEC TRIGGER and EXEC PRODCHANGE, are invoked with the NOWAIT
option, GET commands that retrieve flags and status are accepted for processing. All other commands are rejected
with an appropriate error code.
RCC Log
RCC Log allows users to monitor and troubleshoot communication inputs and outputs.
Log consists of a circular buffer with up to 400 entries. These entries can be one of three types:
• IN – characters received in the input stream
• CMD – commands that were extracted after the frame start and frame end delimiters have been received
• OUT – formatted command output, with frame delimiters already included.
Log entries are time stamped with system time and sorted in the order they were received.
Non-displayable ASCII characters are shown in the ASCII Hex string form. The ASCII Hex strings are preceded by
character sequence “\x” (backslash-lower-case-x). The ASCII Hex string will always be two characters long. For
example, NULL will be converted to “\x00”, and carriage return will be converted to “\x0D”. To represent ASCII Hex
digits, only upper case letters, A-F, are used.
Sample RCC log is given below:
0000000118.116
0000000118.116
0000000118.116
0000000118.116
0000000118.116
0000000118.116
0000000118.116
0000000118.116
0000000118.116
0000000118.116
0000000118.116
0000000118.116
0000000118.116
0000000118.116
0000000118.116
0000000118.483
IN
IN
IN
IN
IN
IN
IN
IN
IN
IN
IN
IN
IN
IN
CMD
OUT
e
x
e
c
t
r
i
g
g
e
r
\x0D
\x0A
exec trigger
0\x0D\x0A
In this example, command exec trigger was sent to RCC interface. The interface was configured to use no start frame
delimiter, and carriage return (\x0D) and line feed (\x0A) as frame delimiters. As soon as valid frame delimiters were
received, the command exec trigger was sent for processing, and the command response was sent back after inspection
finished executing.
Frame and Field Delimiters
The PresencePLUS GUI includes a drop-down list of Frame delimiters as follows:
• <none> for no delimiter
62
Minneapolis, MN USA
Banner Engineering Corp.
2/2010
System Setup Dialog
• \r for carriage return (<CR>)
• \n for line feed (LF)
• \r\n for carriage return followed by a line feed (CR-LF)
• \n\r for line feed followed by a carriage return (LF-CR)
In addition to the above field delimiters, you can enter other delimiter types keeping in mind the following:
• ASCII hex format can be used as a delimiter
• a NULL character can be used as a delimiter (specified in ASCII hex format)
• Frame delimiters can be multi-character sequences up to 20 characters long
The PresencePLUS GUI includes a drop-down list of Field delimiters as follows:
• <none> for no delimiter
• , for comma
• ; for semi-colon
• : for colon
• <SPC> for space
• \t for tab
In addition to the above field delimiters, you can enter other delimiter types keeping in mind the following:
• ASCII hex format can be used as a delimiter
• a NULL character can be used as a delimiter (specified in ASCII hex format)
• Field delimiters can be multi-character sequences up to 10 characters long
Character Strings
Communications Tool configured for Barcode or String Tool output may produce strings that contain non-printable
ASCII characters, such as carriage returns, line feeds, and characters in the upper ASCII range.
To output these strings, the following encoding rules are used:
• Tool output strings will be enclosed in double quote characters, “.
• Any non-printable ASCII character, including NULL, will be converted to its ASCII Hex equivalent. The ASCII Hex
string will be preceded by character sequence “\x” (backslash-lower-case-x). The ASCII Hex string will always be
two characters long. For example, NULL will be converted to “\x00”, and carriage return will be converted to “\x0D”.
To represent ASCII Hex digits, only upper case letters, A-F, will be used.
• Any backslash encountered in the Barcode or StringTool data will be converted to its ASCII Hex equivalent, “\x5C”.
• Any double quote encountered in the Barcode or String Tool will be converted to its ASCII Hex equivalent, “\x22”.
For RCC input strings, the formatting rules are expanded to accommodate readability as follows:
• Carriage return can be specified as character sequence "\r" (backslash-r).
• Line feed can be specified as character sequence "\n" (backslash-n).
• Double quote can be specified as character sequence "\"" (backslash-doublequote).
• Backslah can be specified as character sequence "\\" (backslash-backslash).
• tab can be specified as character sequence "\t" (backslash-t).
• Embedded NULLL characters are not allowed.
6.2.3 PresencePLUS/Kawasaki Vision Guidance and Inspection
Integrating Banner Vision Sensors with Kawasaki Robot Controllers
Quick Start
This document describes how to integrate a Banner PresencePLUS sensor with Kawasaki Robot Controllers, and:
• includes instructions for establishing communications between the PresencePLUS sensor and a Kawasaki Robot
Controller
Banner Engineering Corp.
Minneapolis, MN USA
63
System Setup Dialog
2/2010
• describes how to set up a sample PresencePLUS vision inspection
• provides a sample Kawasaki AS Language program
Below is a quick overview of the procedure for integrating PresencePLUS sensors with Kawasaki Robot Controllers
and, where noted, more details are provided in the document subsections.
Main Steps
Tasks to Complete
Establish communication between the
PresencePLUS sensor and the Kawasaki 1. Install and physically connect a Banner PresencePLUS Vision Sensor
to a Kawasaki controller.
Robot Controller. See Establishing
2.
Configure
PresencePLUS and Kawasaki controller IP addresses.
Sensor/Robot Communication on page
3.
Configure
the
PresencePLUS Remote Command Channel.
65
Create and save a PresencePLUS
Inspection. See Creating the
PresencePLUS Inspection on page 67
for more details.
1. Create a new inspection and configure Vision tools to produce the
desired part location data that outputs it to the RCC interface. The sample
inspection described in this document:
• Locates a part
• Tests for presence of the part
• Outputs X, Y, and Rotation about the Z-axis offsets
2. Save and then start the inspection.
Program the Kawasaki controller to
1. Load the sample AS Language program onto robot controller.
connect and issue commands to the
PresencePLUS sensor . A Kawasaki AS
The sample program implements the following actions:
Language Sample on page 72 is provided
• Connects to the RCC.
to get you started.
• Triggers vision sensor and wait for inspection to complete.
• Determines pass/fail condition of the inspection.
• Gets the X, Y, and Rotation about Z-axis offsets.
• Closes the connection to the RCC.
2. Run program.
Note: The IP address and port number within the sampleAS Language
program must be modified to match the IP address and port number
of the PresencePLUS sensor.
Overview
The PresencePLUS ProII and P4 sensor families are cost-effective, easy-to-use camera systems with advanced visual
inspection capability. Where other vision systems can be difficult to configure, the PresencePLUS software is
straight-forward. This enables users with minimal experience with vision systems to quickly set an inspection that
inspects and accurately determines product position, and to integrate the PresencePLUS system into their environment.
To facilitate the implementation of Presence PLUS Vision Sensors with robots to provide vision guidance and/or
product quality tests on a production line, Presence PLUS supports a user-configurable, ASCII-based, TCP /IP
communications interface called the Remote Command Channel. The RCC supports a Kawasaki protocol specifically
designed to communicate with Kawasaki C/D/D+ robot controllers.
Summary of Remote Command Channel Features
The RCC within the Banner PresencePLUS Sensor is configured as a Server device. This means that it does not initiate
connections on its own, but instead waits for a client (robot controller) to connect to it. The PresencePLUS Remote
Command Channel (RCC) supports the following features:
64
Minneapolis, MN USA
Banner Engineering Corp.
2/2010
System Setup Dialog
• Triggering the sensor and performing product changes
• Checking sensor status, such as pass, fail, and I/O line state
• Retrieving tool results, and sensor counters including pass/fail
• User-defined frame (command) delimiters and output field separators
• Logging input and output data to assist with RCC/MMI debugging
Prerequisites — Kawasaki Robot
This procedure assumes that you are using an Ethernet-enabled Kawasaki robot controller configuration such as:
• Kawasaki C Series Controller with a 1HA Ethernet board option
• Kawasaki D Series Controller with a 1KN or 1QN Ethernet board option
• Kawasaki D+ Series Controller with an integrated 1RA Ethernet board
Related Documentation
For more information relating to Banner's Vision Sensors and Kawasaki Robot Controllers, refer to the following
sources:
• Kawasaki Robot TCP/IP Function Instruction Manual
• Kawasaki D Series Controller AS Language Reference Manual
• PresencePLUS electronic Help
Establishing Sensor/Robot Communication
Step 1
Main Tasks to Complete
Install and connect a
1. Install Banner PresencePLUS Vision Sensor version 2009R1B or later.
PresencePLUS Vision
2.
Connect the Vision Sensor using one of the following approaches:
Sensor
• connect to an existing Ethernet network via a switch or hub using a straight-through
Ethernet cable with RJ45 connectors
• connect directly to the Kawasaki controller using a cross-over Ethernet cable with RJ45
connectors.
3. Configure both the PresencePLUS sensor and the Kawasaki controller with static IP
addresses.
Step 2
Main Tasks to Complete
Configure
PresencePLUS
Ethernet ports: The
1. Start the PresencePLUS software.
2. Connect to the sensor.
Banner Engineering Corp.
Minneapolis, MN USA
65
System Setup Dialog
Step 2
2/2010
Main Tasks to Complete
PresencePLUS Sensor 3. Click on the System button in the upper right corner of thePresencePLUS GUI to display
supports
the System Setup screen.
user-assignable TCP 4. Click on the Communication tab to display the Communication configuration dialog.
/IP ports. This
assignment is
performed from the
System Setup Dialog,
Communications tab
The default Ethernet port assignments are from 20000 to 20009.
Note: Valid user TCP/IP port numbers for PresencePLUS sensors are in the range of 1024 through 65535. The
PresencePLUS GUI will provide automatic notification if an attempt to use a reserved port is made. Any changes
to the port assignment must be reflected in the AS Language program included in this document .
Step 3
Main Tasks to Complete
Configure the
PresencePLUS
Remote Command
Channel (RCC)
1. Click on the RCC Protocol drop-down menu, and select "Kawasaki" from the menu.
The default protocol configuration for Kawasaki robot is displayed.
66
Minneapolis, MN USA
Banner Engineering Corp.
2/2010
Step 3
System Setup Dialog
Main Tasks to Complete
2. Click the OK button to accept the configuration.
Kawasaki Protocol Defaults
The default Kawasaki protocol configuration parameters are:
• Ethernet Socket 1 configured for TCP/IP Port 20000 as the communications channel
• No Frame Start (Command Start) delimiter
• Carriage Return/Line Feed as Frame End (Command End) delimiter
• Space as the input command field separator
• Comma as the output field separator.
Note: You can adjust each of these parameters as necessary, but corresponding
adjustments will have to be made to the sample AS Language program provided to
enable successful communication.
Creating the PresencePLUS Inspection
Step 1
Main Tasks to Complete
Enable the Coordinate
1. Click the System button in the upper-right corner of the PresencePLUS GUI.
Tool in the Tool
2. Select the Tools Configuration tab.
Configuration dialog.
Banner Engineering Corp.
Minneapolis, MN USA
67
System Setup Dialog
Step 1
2/2010
Main Tasks to Complete
3. Scroll down to the Coordinate Tool, and then select the checkbox next to it, as shown
below.
4. Click the OK button to close the Tool Configuration dialog.
Step 2
Main Tasks to Complete
Create a New
Inspection using Setup. 1. In the PresencePLUS GUI, create a new inspection by pressing the Setup button in the
upper-left corner of the GUI.
2. Capture an image of the part to locate.
3. Press the Goto Tools button in the lower-right corner of the Setup tab.
Step 3
Main Tasks to Complete
Add a Geometric
Find tool to locate the 1. In the PresencePLUS GUI, click the Location Tools tab.
part within the
field-of-view.
68
Minneapolis, MN USA
Banner Engineering Corp.
2/2010
Step 3
System Setup Dialog
Main Tasks to Complete
2. Click the Geomtric Find button.
3. Draw the tool ROI (Region of Interest) to select the image feature of interest as shown
below.
4. Click the Apply button to accept the ROI.
5. Click the Next button to return to the Tools menu.
Step 4
Main Tasks to Complete
Add a Coordinate
1. In the PresencePLUS GUI, click the Analysis Tools tab.
tool to provide
locational data for the 2. Click the Coordinate tool button to create a Coordinate tool.
Robot.
Banner Engineering Corp.
Minneapolis, MN USA
69
System Setup Dialog
Step 4
2/2010
Main Tasks to Complete
3. Select Offset Only from the Tool List Filter drop-down menu.
4. Click the Next button to return to the Tools menu.
Note: The X, Y and Rotation selections will default to GF_1.
Step 5
Add a Test tool to
receive a positive
confirmation that the
70
Main Tasks to Complete
1. In the PresencePLUS GUI, click the Analysis Tools tab.
2. Click the Test tool button.
3. Select Coordinate Tool (COORD_1) from the Input 1 drop-down list.
Minneapolis, MN USA
Banner Engineering Corp.
2/2010
Step 5
System Setup Dialog
Main Tasks to Complete
inspection ran
successfully; that is, the
part was found.
4. Click on the Coordinate Tool (COORD_1) tab and make sure that the checkmark next
to the X-Coordinate value checked. Enter 0 (zero) in the Min column and a large number
(e.g., 1000) in the Max column.
Note: These settings will cause the Test tool to pass all resulting X values, but fail
if the X value is invalid (that is, if the part is not found).
5. Uncheck other values.
6. Click the Back button.
7. Cleck the Next button to exit the Test Tool configuration.
Step 6
Main Tasks to Complete
Save and Start Inspection
In the PresencePLUS GUI, click the Go To Run button. When prompted to save the
inspection:
1. Enter a name in the Inspection Name field.
Banner Engineering Corp.
Minneapolis, MN USA
71
System Setup Dialog
Step 6
2/2010
Main Tasks to Complete
2. Click on the Save button.
3. Once the inspection is saved, click the Start button to start the inspection.
Kawasaki AS Language Sample
This sample AS Language code snippet will assist with the integration of a Banner PresencePLUS Vision Sensor and
a Kawasaki C/D/D+ Series Robot Controller.
In this example, the Banner Remote Command Channel (RCC) has been configured to use the Kawasaki RCC Protocol
with Ethernet Socket 1, all other settings are default (TCP port 20000, command and response frame start delimiter is
empty string (<none>) with an end delimiter of carriage return-linefeed (\r\n), and thefield output delimiter is comma
(,).
72
Minneapolis, MN USA
Banner Engineering Corp.
2/2010
System Setup Dialog
This example assumes that a Banner PresencePLUS inspection that produces X, Y and Angle offsets has been loaded
into the PresencePLUS Vision Sensor and has been started with the PresencePLUS GUI. These offsets will then be
obtained and stored in the following variables:
• X_offset is the offset (in units set in camera) along the horizontal axis of the image, increases to the right
• Y_offset is the offset (in units set in camera) along the vertical axis of the image, increases downward
• Rz_offset is the angular offset (in degrees) about the Z-axis, increases clockwise
This program implements the following actions:
1.
2.
3.
4.
5.
Connect to the RCC.
Issue EXEC TRIGGER and wait for inspection to complete.
Determine pass/fail condition of the inspection.
Get the X, Y, and Rotation about Z-axis offsets.
Close the connection to the RCC.
If any failure occurs, such as a TCP communications failure or a RCC command error, then the connection to the RCC
will be severed within this example program.
.PROGRAM banner_vision()
; Global variables
$cmd_del = $CHR(13)+$CHR(10)
$coord_del = ","
tcp_sock_id = -1
; TCP/IP socket id for the camera
; Local variables
.ret_val = -1
.$cmd_str = ""
.$rcv_str = ""
.$rsp_str = ""
; Used for commands to camera
; Used for incoming data from camera
; Used for response parsing from camera
;
; Open TCP socket and connect to RCC
;
CALL tcp_open(.ret_val, 20000)
IF .ret_val < 0 THEN
PRINT "Unable to connect to RCC"
RETURN
END
;
; Trigger the camera and wait for the inspection to complete
;
; Send Trigger to camera and wait for the inspection to complete
.$cmd_str = "EXEC TRIGGER"+$cmd_del
CALL tcp_send(.ret_val, .$cmd_str)
IF .ret_val < 0 GOTO tcp_error
; Read command response from camera
.$rcv_str = ""
CALL tcp_recv(.ret_val, .$rcv_str)
IF .ret_val < 0 GOTO tcp_error
; Decode command response - a response of zero indicates that
; the command was accepted for processing, a negative value
; indicates that an error has occurred.
.$rsp_str = $DECODE(.$rcv_str, $cmd_del, 0)
.ret_val = VAL(.$rsp_str)
IF .ret_val < 0 GOTO cmd_error
; Trigger failed
;
Banner Engineering Corp.
Minneapolis, MN USA
73
System Setup Dialog
2/2010
; Determine whether the inspection passed or failed
;
; Send command to camera to determine if the inspection passed
; the inspection and found the desired part
.$cmd_str = "GET PASSFAILFLG"+$cmd_del
CALL tcp_send(.ret_val,.$cmd_str)
IF .ret_val < 0 GOTO tcp_error
; Read command response from camera
.$rcv_str = ""
CALL tcp_recv(.ret_val, .$rcv_str)
IF .ret_val < 0 GOTO tcp_error
; Get command failed
; Decode command response
.$rsp_str = $DECODE(.$rcv_str, $cmd_del, 0)
.ret_val = VAL(.$rsp_str)
IF .ret_val < 0 GOTO cmd_error
; Get Pass/Fail failed
$temp = $DECODE(.$rcv_str, $cmd_del, 1) ; Remove frame delimiter
; Decode the Pass/Fail status data returned by the Get command
.$rsp_str = $DECODE(.$rcv_str, $coord_del, 0)
.passfail = VAL(.$rsp_str)
IF .passfail <> 1 GOTO notfnd_error
;
; Obtain the X, Y, and Rz offset data
;
; Send command to camera to acquire the Communication Tool
; result data
.$cmd_str = "GET COORDTOOL"+$cmd_del
CALL tcp_send(.ret_val,.$cmd_str)
IF .ret_val < 0 GOTO tcp_error
; Read command response from camera
.$rcv_str = ""
CALL tcp_recv(.ret_val, .$rcv_str)
IF .ret_val < 0 GOTO tcp_error
; Decode command response
.$rsp_str = $DECODE(.$rcv_str, $cmd_del, 0)
.ret_val = VAL(.$rsp_str)
IF .ret_val < 0 GOTO cmd_error
; Get Commtool failed
$temp = $DECODE(.$rcv_str, $cmd_del, 1) ; Remove frame delimiter
; Decode the X offset data
.$rsp_str = $DECODE(.$rcv_str, $coord_del, 0)
X_offset = VAL(.$rsp_str)
$temp = $DECODE(.$rcv_str, $coord_del, 1) ; Remove field delimiter
; Decode the Y offset data
.$rsp_str = $DECODE(.$rcv_str, $coord_del, 0)
Y_offset = VAL(.$rsp_str)
$temp = $DECODE(.$rcv_str, $coord_del, 1) ; Remove field delimiter
;Decode the Rz offset data -- rotation about the Z axis
.$rsp_str = $DECODE(.$rcv_str, $coord_del, 0)
O_offset = VAL(.$rsp_str)
$temp = $DECODE(.$rcv_str, $coord_del, 1) ; Remove field delimiter
74
Minneapolis, MN USA
Banner Engineering Corp.
2/2010
System Setup Dialog
;
; Handle new coordinate offsets
;
PRINT X_offset, Y_offset, Rz_offset
POINT pick = frame1+TRANS(X_offset, Y_offset, ,Rz_offset)
HOME
LAPPRO pick,100
LMOVE pick
CLAMP 1
LDEPART 100
HOME
; Part not found error
notfnd_error:
PRINT "The part was not found"
GOTO all_done
; TCP error
tcp_error:
PRINT "Error during send or receive via TCP:", .ret_val
GOTO all_done
; RCC Command error
cmd_error:
PRINT "Error during command to camera:", .ret_val
GOTO all_done
; Done with program
all_done:
CALL tcp_close
.END
;
; Open a TCP connection to the RCC using specified TCP port number
;
.PROGRAM tcp_open(.ret_val, .port)
.ret_val = 0
.retry_count = 0
; Set
ip[1]
ip[2]
ip[3]
ip[4]
; Initialize the return value
; Initialize the retry count
the IP address to 192.168.0.1
= 192
= 168
= 0
= 1
connect:
; Connect to the RCC port
TCP_CONNECT tcp_sock_id, .port, ip[1]
; Check whether connection was established
IF tcp_sock_id < 0 THEN
IF .retry_count >= 5 THEN
; Number of retries exceeds 5, exit with error
PRINT "Unable to establish connection with camera"
.ret_val = -1
GOTO connect_error
ELSE
; Increment the retry count and try again
Banner Engineering Corp.
Minneapolis, MN USA
75
System Setup Dialog
2/2010
.retry_count = .retry_count + 1
PRINT "TCP_CONNECT error – attempt #", .retry_count
GOTO connect
END
ELSE
PRINT "Established connection, socket id = ", tcp_sock_id
END
; Error occurred during connection attempt(s)
connect_error:
RETURN
.END
;
; Close the TCP connection
;
.PROGRAM tcp_close()
.ret_val = 0
; Initialize the return value
TCP_CLOSE .ret_val, tcp_sock_id
; Check for errors
IF (.ret_val < 0) THEN
PRINT "Unable to close TCP connection, error id = ", .ret_val
ELSE
PRINT "TCP Connection has been closed"
END
.END
;
; Receive data over TCP connection
;
.PROGRAM tcp_recv(.ret_val, .$receive)
.ret_val = 0
; Initialize the return value
.error_return = -99
; Return value from TCP_RECV
.timeout_recv = 60
; Timeout of 60 seconds
.max_recv_len = 255
; Maximum length of single string element
.$receive = ""
; Empty the return string
.num_elem_recv = 0
; Number of elements received
; Read the TCP socket
TCP_RECV .error_return, tcp_sock_id, .$recv_buf[1], .num_elem_recv,
.timeout_recv, .max_recv_len
; Process data
IF .error_return < 0 THEN
PRINT "Error receiving data, TCP_RECV error #", .error_return
.ret_val = -1
ELSE
IF .num_elem_recv > 0 THEN
; Ensure the combined return string element lengths do
; not exceed 255 (maximum allowed length of string) – the
; multiplication allows .max_recv_len to be less than 255
IF .num_elem_recv * .max_recv_len <= 255 THEN
; Copy all of the received elements into output buffer
FOR .j = 1 TO .num_elem_recv
.$receive = .$receive+.$recv_buf[.j]
END
76
Minneapolis, MN USA
Banner Engineering Corp.
2/2010
System Setup Dialog
ELSE
PRINT "Received string too long"
.ret_val = -1
END
ELSE
PRINT "Invalid number of elements received"
.ret_val = -1
END
END
.END
;
; Send data over the TCP connection
;
.PROGRAM tcp_send(.ret_val, .$data)
.ret_val = 0
.$send_buf[1] = .$data
.buf_num = 1
.send_timeout = 60
.error_return = 0
;
;
;
;
;
Initialize function return code
Data to send
Number of array elements
send timeout
send error return code
TCP_SEND .error_return, tcp_sock_id, .$send_buf[1], .buf_num, send_timeout
IF .error_return < 0 THEN
.ret_val = -1
PRINT "TCP SEND error in SEND, error = ", .error_return
END
.END
PresencePLUS Communication Testing
The RCC interface is not a true Telnet interface, although you can use Telnet to test it. Some of the control keys, such
as Back Space and Delete will not cause mistyped characters to be erased. Instead, the
y will be passed on and consumed
by the RCC interface. Other control characters will also be consumed by the interface without the usual Telnet actions.
However, you can test the RCC connection by using a Telnet application to connect to the sensor using the port that
you configured for the RCC (20000 by default). To function correctly, you must set the Newline transmit value within
the Telnet application to be the same as the Command Line End delimiter that you selected in the RCC configuration
menu (Carriage Return/Line Feed by default).
After you have successfully connected to the RCC, you can enter RCC commands and observ
e responses. For example,
you can enter get onlinests to retrieve the online status of the sensor. Another example is you can type in the command
exec trigger , this will result in the sensor to be triggered, the inspection will be executed, and you should see the
inspection output in the GUI. For a complete list of RCC commands and return codes, please refer to thePresencePLUS
electronic documentation - accessible through the PresencePLUS GUI.
6.2.4 Using Custom_ASCII to Communicate with an External Device
Over Ethernet
To select Custom_ASCII, click on the RCC Protocol pull-down menu, and select Custom_ASCII from the menu.
The protocol configuration for Custom_ASCII is displayed as shown below. The default protocol configuration
parameters are:
• Ethernet Socket 1 configured for TCP/IP 20000 as the communications channel
• No Frame Start (Command Start) Delimiter — <none>
• Carriage Return/Line Feed as Frame End (Command End) Delimiter — \r\n
• Comma as the Output Delimiter for the Field Definition — ,
• Space as the Input Delimiter for the Field Definition — <SPC>
Banner Engineering Corp.
Minneapolis, MN USA
77
System Setup Dialog
2/2010
6.3 Input/Output Tab
Use this tab to set t he functionality of the six programmable I/O connections.
I/O, Pin #,
Function
I/O 1 through 6 in the I/O column correspond to Pins 9 through 14 in the Pin # column.
Options from the drop-down list are:
• General Input: Input to the sensor.
• General Ouput: Output from the sensor that can be selected in a Test tool.
• Pass: Active when the entire nspection passes.
• Fail: Active when the inspection fails.
• System Error: Active when a system error occurs.
• Ready: Active when the sensor is ready to accept another trigger.
Electrical
Each programmable I/O can be set for the following operations:
• Current sinking (PNP) input
• Current sinking (NPN) input
• Current sinking (PNP) output
78
Minneapolis, MN USA
Banner Engineering Corp.
2/2010
System Setup Dialog
• Current sinking (NPN) output
Normally Open/Closed Select the state (open or closed) that the output will take when not active.
• Normally Open: The output becomes active when the logic condition controlling the
output becomes True.
• Normally Closed: The output becomes inactive when the logic condition controlling
the output becomes True.
Output Delay
Output Delay is the time from a trigger to start an inspection until the Sensor output turns ON.
It is available only for general outputs.
Note: If processing time is longer than the output delay, the output will become active
immediately after the processing is finished.
Output
Duration
This option is available only for the general outputs; the other outputs (Pass, Fail, System Error, and
Ready) are latched only.
• Latched: Active until the condition changes.
• Time: Active for a specific length of time.
ON
OFF
ON
Trigger
Output
OFF
Processing Time
Delay
Output Duration
Latched
Input/Ouput Tab
ProII Input/Output Tab
Banner Engineering Corp.
Minneapolis, MN USA
79
System Setup Dialog
2/2010
6.3.1 ProII Input/Output Tab
Use this tab to set t he functionality of the six programmable I/O connections.
I/O, Pin #,
Function
I/O 1 through 6 in the I/O column correspond to Pins 9 through 14 in the Pin # column.
Options from the drop-down list are:
• General Input: Input to the sensor.
• General Ouput: Output from the sensor that can be selected in a Test tool.
• Pass: Active when the entire nspection passes.
• Fail: Active when the inspection fails.
• System Error: Active when a system error occurs.
• Ready: Active when the sensor is ready to accept another trigger.
Electrical
Each programmable I/O can be set for the following operations:
• Current sinking (PNP) input
• Current sinking (NPN) input
80
Minneapolis, MN USA
Banner Engineering Corp.
2/2010
System Setup Dialog
• Current sinking (PNP) output
• Current sinking (NPN) output
Normally Open/Closed Select the state (open or closed) that the output will take when not active.
• Normally Open: The output becomes active when the logic condition controlling the
output becomes True.
• Normally Closed: The output becomes inactive when the logic condition controlling
the output becomes True.
Output Delay
Output Delay is the time from a trigger to start an inspection until the Sensor output turns ON.
It is available only for general outputs.
Note: If processing time is longer than the output delay, the output will become active
immediately after the processing is finished.
Output
Duration
This option is available only for the general outputs; the other outputs (Pass, Fail, System Error, and
Ready) are latched only.
• Latched: Active until the condition changes.
• Time: Active for a specific length of time.
ON
OFF
ON
Trigger
Output
OFF
Processing Time
Delay
Output Duration
Latched
Input/Ouput Tab
ProII Input/Output Tab
Banner Engineering Corp.
Minneapolis, MN USA
81
System Setup Dialog
2/2010
6.4 Product Change / Select Tab
Use this tab to set the Product/Select inputs to NPN or PNP. This setting is global for the sensor.
82
Minneapolis, MN USA
Banner Engineering Corp.
2/2010
System Setup Dialog
6.5 Strobe Tab
Use the Strobe tab to set the strobe signal(On the ProII, Pin 4 on the external light connector) for a strobed light source.
The strobe signal is a +5V dc TTL signal.
Fields in the System Setup window's Strobe tab are described below:
Strobe Tab
Banner Engineering Corp.
Minneapolis, MN USA
83
System Setup Dialog
2/2010
6.5.1 Strobe Width
Strobe Width Option
Description
Off
The strobe output never becomes active (light off).
84
Minneapolis, MN USA
Banner Engineering Corp.
2/2010
System Setup Dialog
Strobe Width Option
Description
On
The strobe output remains active (light on).
Exposure Duration
The strobe output is active only while the sensor is
acquiring an image. This is the default.
Time Duration
Sets the duration for active strobe output from the initial
valid trigger (minimum pulse width has been satisfied) to
the end of the duration. The range is from 0 to 4,000 ms.
6.5.2 Level
• Active Low -- When given a 0V dc signal, it turns on. This is the default.
• Active High -- When given a +5V dc signal, it turns on.
6.6 Trigger Tab
In the Trigger tab, the trigger must be set for current sourcing (NPN) or for current sinking (PNP). Select NPN or PNP
.
The default is NPN.
Banner Engineering Corp.
Minneapolis, MN USA
85
System Setup Dialog
2/2010
Note: Adjust trigger divide, delay, and width in the Trigger tab on the Setup screen.
6.7 Units Tab
By default, the sensor expresses all distance calculations as pixels:
• Configure a scale value based on a known distance in user-selected units (for example, inches, millimeters, or
centimeters) See Configure with Known Distance on page 88 for more information.
Units Tab
86
Minneapolis, MN USA
Banner Engineering Corp.
2/2010
System Setup Dialog
6.7.1 Select Conversion Units
From the Units drop-down list, select the units to in which to convert pixels. The options are:
• pixels (px)
• inches (in)
• feet (ft)
• yards (yd)
• millimeters (mm)
• centimeters (cm)
• meters (m)
• microns (u)
• mils (mil)
Additionally, select the decimal place precision using the arrow keys to select a value from 0 to 6.
Banner Engineering Corp.
Minneapolis, MN USA
87
System Setup Dialog
2/2010
6.7.2 Configure with Known Distance
To configure how to scale pixel units for the PresencePLUS software, do the following:
1. Go to the Setup screen and capture an image of an object with known dimensions.
2. Go to the Tools screen and use a Location orVision tool (for example, a Locate, Edge, or Object tool) and a Measure
tool to measure the distance of the known dimension in pixels. The example below uses two Locate tools and a
measure tool to determine the number of pixels in an inch.
88
Minneapolis, MN USA
Banner Engineering Corp.
2/2010
System Setup Dialog
3. In the Units tab, select the desired units and enter the pixel value in the Measurement in pixels field.
4. From the Apply to drop-down list, select either Distances only (default for backward compatibility), or Distances
offsets, and locations.
Banner Engineering Corp.
Minneapolis, MN USA
89
System Setup Dialog
2/2010
5. Click Apply.
6.8 Reset Tab
Use the Reset tab to read sensor error codes, clear system errors and reestablish Sensor communications.
Option
Description
Reset Error Flag
Click to clear the sensor's Red Error LED.
Reset Error Log
Click to clear the error log.
System Reset
Click to reboot the Sensor. (This is a system reboot and
will take several seconds).
Get Error Log
Click to display the System Log icon in the
Navigation/Results window. The System Log records
information about all system failures (such as
communication errors between the PC and the Sensor).
Reset Tab
90
Minneapolis, MN USA
Banner Engineering Corp.
2/2010
System Setup Dialog
6.9 Start-Up Inspection Tab
The options on the Start-Up Inspection tab:
• Click on Setup Mode if you want the camera to start in Setup Mode after it is powered down.
• Click on Inspection Name, and select an inspection from the drop-down list to have the sensor start up to run.
• Product Select lines (ProII Only)
Start-Up Inspection Tab
P4 Start-Up Inspection Tab
ProII Start-Up Inspection Tab
Banner Engineering Corp.
Minneapolis, MN USA
91
System Setup Dialog
2/2010
6.10 NTSC Tab
The Zoom Level adjustment on the NTSC tab is availalble only for single function, low-resolution sensors such as
the Area and Geo. From the drop-down list, select the desired zoom level as it will appear on the optional NTSC video
monitor that you can attach to the sensor. The default is 4:1.
NTSC Tab
92
Minneapolis, MN USA
Banner Engineering Corp.
2/2010
System Setup Dialog
6.11 Language Tab
In the Languages tab, click on the down arrow for a drop-down list of the languages installed from the PresencePLUS
software CD.
Click on the desired language, then click Apply. At the next start-up, the PresencePLUS software will use the selected
language.
To save changes and exit the System Setup window, click OK. To exit the System Setup window without making any
changes, click the X in the upper-right hand corner of the window.
Language Tab
Banner Engineering Corp.
Minneapolis, MN USA
93
System Setup Dialog
2/2010
6.12 Tools Configuration
Tool Configuration provides the ability to customize the Tools page within the PresencePLUS software. Entire tools,
or their enhanced features, can optionally be displayed or hidden. This provides the ability to configure the system to
better support your application, thus further simplifying the creation and modification of inspections.
To assist with the customization, the list of tools for the connected sensor is displayed in a tree view. In this tree view,
all tools which have a check mark are available for use in the inspection, and all tools that are unchecked are hidden.
Similarly, a tool's enhanced feature will be available if checked, and unavailable if unchecked.
Tools Configuration
94
Minneapolis, MN USA
Banner Engineering Corp.
2/2010
System Setup Dialog
6.12.1 Standard Mode
Choose this option to reset all tool configuration settings for the connected sensor to the factory defaults.
6.12.2 Enhanced Mode
Choose this option to enable all tools and all tool's enhanced features for the connected sensor.
6.12.3 Custom Mode
Choose this mode to customize the tools configuration settings within the tree view. This mode is automatically selected
when changes are made to the tree view.
The Tool Configuration settings will only affect the sensor that the PresencePLUS software is connected - these settings
are stored with the sensor. Therefore, if the PresencePLUS software connects to a different sensor, then that sensor's
tool configuration will be reflected within the PresencePLUS software.
This feature is available when connected to sensors with 2008R1 or newer versions of firmware.
Banner Engineering Corp.
Minneapolis, MN USA
95
6.12.4 Tool Licensing
Some tools (e.g., barcode and OCR/OCV) require a license to be registered within the sensor before they can be
activated. To purchase a license key, contact Banner with the following information:
- MAC address of the sensor you wish to license
- Product Type of the sensor
- The tool(s) you wish to purchase licenses
- Your company information
- An e-mail address to receive the Key
Please use caution when providing this information, as a license issued for one sensor cannot be re
gistered on a different
sensor.
After receiving a license key, you may register the license key using two different methods:
Method 1 - Use the Firmware Updater (recommended)
- Run the Firmware Updater - version 2.0.4 (2008R1) or newer
- Select the 'Licensing' tab
- Connect to the sensor with the MAC address used for key
- Enter the license key received for the sensor - or browse for the license file
- Click on the 'Register' button
- If necessary, select the 'Update' tab and update the firmware to the latest version
Method 2 - Use the PresencePLUS GUI software
(Use this method if sensor has latest version of firmware)
- Start the PresencePLUS software - version 3.2.0 (2008R1) or newer
- Connect to the sensor with the MAC address used for key
- Click 'System' on the title bar and then select the 'Tool Configuration' tab
- Select the tool to activate
- Enter the license key received for the sensor
- Click on the 'Register' button
To view licenses currently registered within the sensor, click the 'Help' button on the title bar and select 'About' from
the menu. The licenses are also displayed next to the product name in the title bar.
PresencePLUS Software Tools Chapter 7
7.1 ROI Types
ROI types include Area, Search, and Linear.
7.1.1 Linear ROI
Linear ROIs are used by tools that scan along a defined line in a defined direction. Data are averaged along a linear
ROI wider than 1 pixel to provide accurate test results. You can adjust the ROI width in increments of 4; that is, 1, 5,
9, 13, and so on. The ROI is widened symmetrically.
Note: Widening an ROI provides an average value/location, which results in improved repeatability.
7.1.2 Area ROI
An Area ROI can be rectangular, elliptical, or circular. Click on Draw ROI in the input tab to expand the list of ROI
shapes from which to select. The shapes are shown below.
Note: An Area ROI can be as large as the entire Field of View (FOV).
7.1.3 Search ROI
Geometric Find, Geometric Count, Pattern Find, and Pattern Count ROIs, like Area ROIs, can be rectangular, elliptical,
or circular; however, these ROIs are also bounded by a Search ROI. The Search ROI is indicated by a yellow box that
is always rectanagular and, by default, is 20% to 30% larger than the Area ROI, which is red.
Banner Engineering Corp.
Minneapolis, MN USA
97
PresencePLUS Software Tools
2/2010
7.2 Location Tools
Location tools are used as a reference point to adjust the location of subsequent Re
gions of Interest (ROI) for translational
and rotational variations of the target.
7.2.1 Locate Tool
The Locate tool locates the position of a target in a field of view. This tool finds and marks position of the first edge
along the ROI line. Typically, tools, including additional Locate tools that follow, are relative to this point.Additionally,
the software can calculate the angle at which the Locate tool intersects the feature's edge and rotates following tools
Regions of Interest (ROIs) accordingly.
Usage
The Locate tool is used to align and position Vision tools consistently over the feature of interest.
Fields
The following are fields on the Locate tool Input tab:
• Threshold Type on page 100
• Filters on page 102
• Results on page 103
• Select on page 103
Supported Platforms
ProII Color ProII/ProII OMNI
1.3
Color
OMNI/OMNI AREA/AREA1.3 EDGE/EDGE GEO/GEO
1.3
1.3
1.3
BCR/BCR
1.3
Yes
Yes
Yes
Yes
Yes
Yes
Yes
Yes
Locate Tool Tabs
98
Minneapolis, MN USA
Banner Engineering Corp.
2/2010
PresencePLUS Software Tools
Adding a Locate Tool
To add a Locate tool to an inspection:
1. Click the button of the tool to be added to the inspection.
2. If desired, rename the tool.
3. Draw an ROI.
Field/Button
Description
Use this field to rename the tool. The default is tool_name_1, tool_name_2, and
so on, where the default tool_name depends on the tool being created (for example,
locate, edge or the like). The name can have only alphanumeric characters and
underscores with no spaces.
Click this button to add an ROI to an image.
Click this button to remove an ROI from an image.
Banner Engineering Corp.
Minneapolis, MN USA
99
PresencePLUS Software Tools
2/2010
Threshold Type
The threshold is used to mark the gray scale transition point. The tool marks the edge when the pixel intensity crosses
the threshold level. From the dropdown list, select one of the following:
• Relative
• Absolute
• Edge Strength
Relative Threshold
Relative threshold is the default, and it finds an edge at a relative pixel intensity. The brightest gray scale level is 100%
and the darkest is 0%. While Relative threshold is more tolerant of light fluctuations between inspections than other
transition types, it may find false edges.
Field/Graph
Description
Percent
Percent is displayed when the Type is Relative. Choose the percentage value at which
the edge should be marked.
Polarity
• Bright to Dark finds edges that start above the threshold value and cross below the
threshold value.
• Dark to Bright finds edges that start below the threshold value and cross above the
threshold value.
• Bright or Dark finds any edge.
Edge Profile Graph
In the Edge Profile graph displayed when the Relative threshold is selected, the red line
shows the percentage pixel intensity relative to the green threshold line. The threshold
line will move up or down with the percent value.
Absolute Threshold
Absolute threshold finds an edge at a specific gray scale level. While Absolute threshold is less likely to find a false
edge than Relative Threshold, it may miss edges if the light level changes between inspections.
100
Minneapolis, MN USA
Banner Engineering Corp.
2/2010
PresencePLUS Software Tools
Field/Graph
Description
Value
Value is displayed when Type is Absolute. Enter a specific gray scale value from 0 to
255.
Polarity
• Bright to Dark finds edges that start above the threshold value and cross below the
threshold value.
• Dark to Bright finds edges that start below the threshold value and cross above the
threshold value.
• Bright or Dark finds any edge.
Edge Profile Graph
In the Edge Profile graph displayed when the Absolute threshold is selected, the red line
shows the percentage pixel intensity relative to the green threshold line. The threshold
line will move up or down with the percent value.
Edge Strength
Edge strength measures the rate of change of grayscale values and needs sharply-defined transitions. Edge strength
is more tolerant of gradual changes in light levels across the tool than other transition types and it will filter out weak
or gradual edges.
Field
Description
Edge
Enter an edge bandwidth value from 1 to 255.
Polarity
• Bright to Dark finds edges that start above the threshold value and cross below the
threshold value.
• Dark to Bright finds edges that start below the threshold value and cross above the
threshold value.
• Bright or Dark finds any edge.
Banner Engineering Corp.
Minneapolis, MN USA
101
PresencePLUS Software Tools
2/2010
Graph Tab
When Edge Strength is selected in the Input tab, the software displays the Graph tab. This tab provides similar
information to the Input tab, but displays separate Edge Profile and Edge Strength graphs for easier viewing.
The Edge Profile graph represents the absolute gray scale level across the tool ROI.
The Edge Strength graph represents the change in gray scale along the tool O
RI. Edge Strength detects an edge when
the rate of change (solid red line on the graph) crosses the selected intensity change amount (dashed green lines on
the screen).
A bright-to-dark transition has a negative edge strength value, and a dark-to-bright transition has a positive edge
strength value. When the Edge Strength level is adjusted, both the negative and positive green dotted lines will adjust
together.
Filters
ROI Width
Increases in increments of 4 pixels (for example, 1, 5, 9, 13, ...) up to the total FOV size.
Some things to note:
• Narrow ROIs execute faster but could miss the part.
• Wide ROIs are more consistent but don't execute as fast.
• The ROI must be 13 pixels or wider to calculate the rotation of a part.
Smoothing
Runs a rolling average along the ROI length. It filters out sharp changes in the edge profile.
Note: A high filter number may miss the edge of a narrow line.
102
Minneapolis, MN USA
Banner Engineering Corp.
2/2010
Min Width
PresencePLUS Software Tools
Filters out small spike-of-intensity changes, and narrow dark or bright bands. It determines
the distance (in pixels) before and after an edge that must be free from additional transitions
or the end of the FOV before the edge is recognized.
Note: A high filter number may miss the edge of a narrow line.
Sample Rate
Determines the sub-pixel resolution, which increases the resolution of the tool, and increases
the inspection time.
1.
2.
3.
4.
1-pixel resolution
1/2-pixel resolution
1/3-pixel resolution
1/4-pixel resolution
Results
The Results field provides the position of the first edge found. The position is expressed as X, Y coordinates in pixels,
with the origin (0,0) at the upper-left corner of the screen.
Select
If you select Rotation Enable , the software Activates the rotation compensation calculation. ROIs that follow will
rotate according to the difference between the reference image and the current inspection image.
Note: ROI width must be 13 pixels or greater.
Advanced Tab
If you have enabled the Advanced Configuration in the System setup, the software displays and Advanced tab. This
enables you to force any location tool to Absolute Positioning.
Banner Engineering Corp.
Minneapolis, MN USA
103
PresencePLUS Software Tools
2/2010
Graph Tab
When Edge Strength is selected, the Graph tab appears on the tool window. The graph for the Input tab overlays both
the edge strength graph and the edge profile. In the Graph tab, the edge profile graph and the edge strength graph are
separated for easier viewing.
The top graph, Edge Profile, represents the absolute gray scale level across the Edge tool.
The bottom graph, Edge Strength, represents the change in gray scale along the Edge tool.
Edge Strength detects an edge when the rate of change (solid red line on the screen) crosses the selected intensity
change amount (dashed green lines on the screen).
A bright-to-dark transition has a negative edge strength value, and a dark-to-bright transition has a positive edge strength
value. When the Edge Strength level is adjusted, both the negative and positive lines will adjust together.
Graph Tab
104
Minneapolis, MN USA
Banner Engineering Corp.
2/2010
PresencePLUS Software Tools
7.2.2 Geometric Find Tool
The Geometric Find tool uses edge content to locate the best matching shape in a search area of an image. During
setup, the you identify a reference shape within a search area for the Geometric Find tool. This reference shape is
subsequently used to locate like shapes in new images by searching for shapes similar to the reference shape.
Tools that follow the Geometric Find tool translate and rotate their ROIs relative to positional information from the
Geometric Find tool. Geometric Find returns the location of the best shape found.
Note: If the Geometric Find tool is preceded by a Location tool (for example, a Locate or another Geometric
Find tool), the Search ROI will translate by the amount that the preceding Location tool found. However, even if
the Location tool has rotation enabled, the Search ROI will not rotate.
Banner Engineering Corp.
Minneapolis, MN USA
105
PresencePLUS Software Tools
2/2010
Note: The Geometric Find tool requires strong and repeatable edge content in the image.
Usage
• Locate the position of a label
• Locate electronic components on a circuit board
• Locate date/lot code for inspection
Note: In general, the Geometric Find tool can be used to locate a rounded object or an object where lar
ge amounts
of rotation are possible. In these types of applications, a linear Locate tool will not work as well.
Fields
The following are fields on the Geometric Find tool Input tab:
• Threshold on page 155
• Edge Length on page 156
• Legend on page 156
• Results on page 159
Supported Platforms
ProII Color ProII/ProII OMNI
1.3
Color
OMNI/OMNI AREA/AREA1.3 EDGE/EDGE GEO/GEO
1.3
1.3
1.3
BCR/BCR
1.3
Yes
Yes
No
Yes
Yes
No
No
Yes
Geometric Find Input Tab
106
Minneapolis, MN USA
Banner Engineering Corp.
2/2010
PresencePLUS Software Tools
Adding a Geometric Find Tool
To add a Geometric Find tool to an inspection:
1. Click the button of the tool to be added to the inspection.
2. If desired, rename the tool.
3. Draw an ROI.
Field/Button
Description
Use this field to rename the tool. The default is
tool_name_1, tool_name_2, and so on, where the default
tool_name depends on the tool being created (for example,
locate, edge or the like). The name can have only
alphanumeric characters and underscores with no spaces.
Click this button to add an ROI to an image.
Click this button to add a mask to an image. A mask is a
way to remove some anomaly in the ROI that might
deleteriously affect the inspection.
Banner Engineering Corp.
Minneapolis, MN USA
107
PresencePLUS Software Tools
Field/Button
2/2010
Description
Click this button to remove an ROI or a mask from an
image.
Use this field to rotate the ROI. You can manually key in
a rotation angle, or you can use the up or down arrow keys
to rotate the ROI.
Threshold
Adaptive Threshold
Adaptive Threshold adjusts the edge threshold on each acquired image. The Sensor automatically sets the threshold
and attempts to adjust for contrast variations.
Edge Strength
Edge Strength sets the edge threshold at a predetermined gray scale value from 0 to 127. Edge Strength provides more
control over what gets to be considered an edge pixel.
Edge Length
The tool ignores target patterns with edges equal to or shorter than the specified number of pixels for edge length.
Legend
All edges found by the Geometric Find tool are color-coded in the Image window. Strong edges show up in green, and
weak edges show up in red.
Note: Both weak and strong edges in the pattern ROI are expected to be present in the inspection.
108
Minneapolis, MN USA
Banner Engineering Corp.
2/2010
PresencePLUS Software Tools
Results
The Results field returns the following:
• Total number of shapes above the minimum acceptance level.
• Position of each shape's center. The origin (0,0) is the upper-left corner of the screen.
Geometric Find Tool Advanced Tab
Fields in the Geometric Find Tool Advanced tab are described in the following subsections.
Fields
The following are fields on the Geometric Find tool Input tab:
• Rotation Range on page 157
• Extra and Missing Edges on page 157
• Minimum Acceptance Level on page 173
• Reject Threshold on page 158
• Scaling Range on page 159
• Tool Timeout and Absolute Positioning on page 112
• Results on page 159
Advanced Tab
Banner Engineering Corp.
Minneapolis, MN USA
109
PresencePLUS Software Tools
2/2010
Rotation Range
These adjustments are used to set the maximum allowable rotation (0° to 180°) that a target pattern can have and still
be identifiable.
Extra and Missing Edges
110
Minneapolis, MN USA
Banner Engineering Corp.
2/2010
PresencePLUS Software Tools
Field
Description
Extra Edges
If left unchecked (disabled), the Sensor will find a target shape that might have extra
edges. If checked (enabled), the Sensor will not find a target shape that has extra edges
of a specified length. The size of the minimum edge length is adjustable.
Note: If checked, the application will not allow a minimum edge length to be set
below the number specified for Minimum Edge Length (in the Input tab ) for this
tool.
Missing Edges
If left unchecked (disabled), then the Sensor will find a target shape, even if it is missing
some edge content. If checked (enabled), then the Sensor will not find a target shape that
is missing edges of a specified length. The size of the minimum edge length to check for
is adjustable.
Note: If checked, the application will not allow a minimum edge length to be set
below the number specified for Minimum Edge Length (in the Input tab ) for this
tool.
Minimum Acceptance Level
This adjustment sets the acceptance level for pattern matches.
• Decrease the Minimum Acceptance Level to allow more variations in matching patterns.
• Increase the Minimum Acceptance Level to filter out patterns that contain small defects.
Percent match is a value between 20% and 100% that indicates the quality of the match (100% is a perfect match; 20%
is a slight match). The percent match can be used to detect large defects.
Note: Banner does not recommend setting the Minimum Acceptance Level below 70%.
Reject Threshold
These adjustments allow the user to set the “band of gray scale values” the tool uses to determine the threshold when
Adaptive Threshold is specified.
If the Low is set to zero (default) and the High is set to 255 (default), then all gray scale values within the acquired
image are used to determine the threshold.
An example of narrowing the band of gray scale values is to set the Low at 50 and the High at 200.With these settings,
only gray scale values from 50 to 200 will be used by the Geometric Find tool to determine the threshold when
Adaptive
Threshold is specified.
These controls allow the user to “block” dark spots or light spots from influencing the threshold in the image acquired
by the Sensor.
Banner Engineering Corp.
Minneapolis, MN USA
111
PresencePLUS Software Tools
2/2010
Scaling Range
Scaling Range allows you to set a range from a low of 0.8 to a high of 1.2. In Run mode, this will enable matches to
occur even with slight variations in shape from the reference shape.
Tool Timeout and Absolute Positioning
Set a timeout in milliseconds that determines how long the Geometric tool will attempt to determine whether a pattern
is good or not.
Select Force to Absolute Positioning if you want to change the Geometric tool from relative positioning to absolute.
Results
The Results field returns the following:
• Total number of shapes above the minimum acceptance level.
• Position of each shape's center. The origin (0,0) is the upper-left corner of the screen.
7.2.3 Pattern Find Tool
The Pattern Find tool locates the first shape in a search area of the image. During setup, identify a section of the image
containing the target shape, and assign that shape as the reference for the Pattern Find tool. This reference shape is
subsequently used to locate the target shape in new images by searching for shapes very similar to the reference one.
The shape is remembered by the sensor in full gray scale detail, and the search is conducted in a ay
w that is “normalized”
or indifferent to variations in the level of illumination.
Tools that follow the Pattern Find tool translate and rotate their ROIs relative to positional information from the Pattern
Find tool. Pattern Find returns the location of the first shape found.
Usage
• Match letters and numbers
• Locate a fiducial on a circuit board
• Spot-check for an object
Note: Only one target shape is found in the search area. Only the ROIs that follow a Location tool will move
relative to the Location tools.
112
Minneapolis, MN USA
Banner Engineering Corp.
2/2010
PresencePLUS Software Tools
Fields
The following are fields on the Pattern Find tool Input tab:
• Minimum Acceptance Level on page 173
• Rotation Enabled on page 173
• Selected Pattern on page 174
• Results on page 115
Supported Platforms
ProII Color ProII/ProII OMNI
1.3
Color
OMNI/OMNI AREA/AREA1.3 EDGE/EDGE GEO/GEO
1.3
1.3
1.3
BCR/BCR
1.3
Yes
Yes
No
Yes
Yes
No
No
No
Pattern Find Input Tab
Adding a Pattern Find Tool
To add a Pattern Fine tool to an inspection:
1. Click the button of the tool to be added to the inspection.
Banner Engineering Corp.
Minneapolis, MN USA
113
PresencePLUS Software Tools
2/2010
2. If desired, rename the tool.
3. Draw an ROI.
Field/Button
Description
Use this field to rename the tool. The default is
tool_name_1, tool_name_2, and so on, where the default
tool_name depends on the tool being created (for example,
locate, edge or the like). The name can have only
alphanumeric characters and underscores with no spaces.
Click this button to add an ROI to an image.
Click this button to remove an ROI from an image.
Use this field to rotate the ROI. You can manually key in
a rotation angle, or you can use the up or down arrow keys
to rotate the ROI.
Minimum Acceptance Level
This adjustment sets the acceptance level for pattern matches.
• Decrease the Minimum Acceptance Level to allow more variations in matching patterns.
• Increase the Minimum Acceptance Level to filter out patterns that contain small defects.
Percent match is a value between 20% and 100% that indicates the quality of the match (100% is a perfect match; 20%
is a slight match). The percent match can be used to detect large defects.
Note: Banner does not recommend setting the Minimum Acceptance Level below 70%.
Rotation Enabled
The Pattern Find tool has a +/- 10 degree rotation ability. All subsequent ROIs will rotate relative to the edge found.
During setup, the tool calculates the angle of the pattern found. During inspection, the new angle is compared to the
original angle. If there is any rotational change between the new angle and the original angle, all subsequent ROIs will
rotate that amount.
Selected Pattern
The Selected Pattern field indicates whether the captured image is fine as it is or if there are potential issues. For
example, in the display below, the image is marinal for both translational content and for rotational content.
114
Minneapolis, MN USA
Banner Engineering Corp.
2/2010
PresencePLUS Software Tools
Results
Pattern Find Advanced Tab
Select Force to Absolute Positioning if you want to change the Pattern tool from relative positioning to absolute.
7.2.4 Blob Find Tool
The Blob Find tool is a Location tool used to position other vision tools in reference to some object, or "Blob." In
imaging, a group of adjacent, like-shaded pixels, is called a Blob, short for Binary Large OBject . Unlike the Locate
or Geometric Find tools, the Blob Find tool does not depend on strong and repeatable edges. Rather
, Blob Find locates
a Blob in the FOV quickly and is most useful in cases where an object does not need to be matched precisely, but does
need to be identified speedily.
Note: The Blob Find tool starts out disabled, and you need to enable it in the Tools Configuration tab of the System dialog.
Banner Engineering Corp.
Minneapolis, MN USA
115
PresencePLUS Software Tools
2/2010
ProII Color ProII/ProII OMNI
1.3
Color
OMNI/OMNI AREA/AREA1.3 EDGE/EDGE GEO/GEO
1.3
1.3
1.3
BCR/BCR
1.3
Yes
Yes
No
Yes
Yes
No
No
No
Fields
The following are fields on the Blob Find tool Input tab:
• Threshold on page 207
• Blob Find Tool Input Tab Results on page 119
Supported Platforms
Blob Find Input Tab
116
Minneapolis, MN USA
Banner Engineering Corp.
2/2010
PresencePLUS Software Tools
Adding a Blob Find Tool
1. Click the button of the tool to be added to the inspection.
2. If desired, rename the tool.
3. Draw an ROI.
Control
Description
Use this field to rename the tool. The default is
tool_name_1, tool_name_2, and so on, where the default
tool_name depends on the tool being created (for example,
locate, edge or the like). The name can have only
alphanumeric characters and underscores with no spaces.
Click this button to add an ROI to an image.
Click this button to add a mask to an image. A mask
excludes an area inside the ROI.
Banner Engineering Corp.
Minneapolis, MN USA
117
PresencePLUS Software Tools
Control
2/2010
Description
Click this button to remove an ROI or mask from an image.
Use this field to rotate the ROI. You can manually key in
a rotation angle, or you can use the up or down arrow keys
to rotate the ROI.
Note: The angle used in the Rotation calculation is the MajorAxis angle, measured with respect to the horizontal
plane. This angle is not reliable if the part rotates through ± 90 degrees because the Blob Find tool doesn't pay
attention to what is "top" or "bottom" on the Blob.
Threshold
Type
Fixed
Select Fixed when the lighting and image content will remain relatively constant for all inspections.
If you select Fixed , you can also specify Threshold and Reject Levels.
Threshold Level
The Threshold Level (e.g., 141) defines the white/black cutoff point. Once a threshold is chosen, any pixels brighter
than the threshold become pure white while those darker than the threshold become pure black.
Reject Level
The Reject Level field is for bright Blobs only, and is used to narrow the range of pixel intensities to consider in an
inspection. Leaving the defaults at 0 for low and 255 for high will result in the tool taking into consideration all gray
scale levels in the ROI from 0 (black) to 255 (white). Note that the Reject Level field is visible only when Bright bead
type is selected.
Adaptive
Select Adaptive when there are lighting changes that cause the acquired image to change.
118
Minneapolis, MN USA
Banner Engineering Corp.
2/2010
PresencePLUS Software Tools
Adaptive thresholding is a technique that is used to adjust the threshold for the BLOB tool based upon lighting changes
and image content within the ROI. It performs best if used with bi-modal images, which have a clear contrast in the
ROI. Adaptive thresholding chooses the current threshold value by converging to a value based on the average value
of the pixels above and below the previous threshold value; it will not move the value of the threshold above or below
the upper or lower limits.
Low Limit: Enter a gray scale value in this field, and the tool will not allow the Adaptive threshold to go below this
value.
Upper Limit: Enter a gray scale value in this field, and the tool will not allow the Adaptive threshold to go above this
value.
Reject Level: The Reject Level field is for bright Blobs only, and is used to narrow the range of pixel intensities to
consider in an inspection. Leaving the defaults at 0 for low and 255 for high will result in the tool taking into
consideration all gray scale levels in the ROI from 0 (black) to 255 (white). Note that the Reject Level field is visible
only when Bright bead type is selected.
Reject Level Example
Consider setting up an inspection for a relatively bright object that ranges from 180 to 200 in pixel intensity and takes
up 15 percent of the Field of View; yet, the remaining 85 percent of the Field of View ranges from 230 to 255 in pixel
intensity. Setting a Reject Level of 220 will allow the tool to “pay attention” to only the bright object being inspected.
Further, masking the bright parts of the Field of View will not be necessary as only pixels whose intensity is less than
the Reject Level will contribute to bright Blobs. Note that rejected pixels are colored orange in the histogram.
Blob Type
• Choose Dark if the part is darker than the background.
• Choosing Dark with a Fixed threshold will cause the tool to fix the threshold at the level specified in the Threshold
level field. The tool will choose as dark Blobs all grouped pixels below the specified threshold.
• Choosing Dark with an Adaptive threshold type will cause the tool to limit the threshold to the range specified in
the Threshold level Lower and Upper Limit fields. The tool will choose as dark Blobs all grouped pixels below the
threshold chosen.
• Choose Bright if the part is lighter than the background.
• Choosing Bright with a Fixed threshold type will cause the tool to fix the threshold at the Bright level specified in
the Threshold level field. The tool will choose as bright Blobs all grouped pixels above the specified Bright threshold
and less than or equal to the Reject level. Note: Pixels in the ROI which are brighter than the specified Reject level
will turn orange in the Image window and be ignored during inspection.
• Choosing Bright with an Adaptive threshold type will cause the tool to limit the threshold to the range specified in
the Threshold level Lower and Upper Limit fields. The tool will choose as bright Blobs all grouped pixels above
the specified Lower Limit and less than or equal to the Upper Limit. Note: Pixels in the ROI which are brighter
than the specified Reject level will turn orange in the Image window and be ignored during inspection.
Blob Find Tool Input Tab Results
Banner Engineering Corp.
Minneapolis, MN USA
119
PresencePLUS Software Tools
2/2010
Count: The number of Blobs found.
Total Area: The total area (in pixels) of all the Blobs.
Threshold Level: The white/black cutoff point.
From the dropdown list of Blobs, you can select a specific Blob to get area and centroid information about that specific
Blob.
Histogram
The Histogram is a display of the grayscale values on the "x" axis and the number of pixels on the "y" axis. The
Histogram displays the amount of pixels for each grayscale value. The graph displays information for all grayscale
values (0-255). Cursors, shown as vertical lines, represent minimum threshold, maximum threshold, threshold level
and reject level. Corresponding cursor can be moved horizontally to adjust a value.
120
Minneapolis, MN USA
Banner Engineering Corp.
2/2010
PresencePLUS Software Tools
Blob Find Filter/Sort Tab
Blob Sort
The Sort drop-down list allows the user to select a sort method to determine which Blob the sensor labels as "Blob
#1." By default, Blobs are numbered according to scan order; that is, the sensor numbers Blobs as it encounters them
while scanning the FOV from top-to-bottom and then left-to-right. Select one of the computed statistics choices from
the drop-down list to use for the sort:
• No sorting
• Position
• Area on page 187
• Perimeter on page 188
• Compactness on page 189
• Major Axis Length, Minor Axis Length, and Major Axis Angle on page 189
• Eccentricity on page 189
• Min Radius and Min Radius Position on page 191
• Max Radius and Max Radius Position on page 191
Blob Sort Order
Once you select a Sort method, you need to define a Sort Order:
• If Position is selected for the Sort method, then Blob order is based on the x,y coordinates of the centroids and the
options are—
• Left most
• Top most
• Right most
• Bottom most
• For any of the other options, Blob order is based on Increasing or Decreasing value of the parameter selected. For
example, if Perimeter and Increasing is selected, the smallest perimeter Blob will be Blob #1.
Blob Filter
The Blob filter allows you to more accurately select a specific Blob to locate and to use for positioning other Vision
tools. Filter modifies the Blob count based on Computed Statistics criteria so that, for example, only circular Blobs
(compactness) or symmetric Blobs (eccentricity) are included in the Blob count.
Banner Engineering Corp.
Minneapolis, MN USA
121
PresencePLUS Software Tools
2/2010
When you click the Preset button, the sensor uses the selected Blob to preset the filter values so that only the selected
Blob will subsequently be identified by the sensor. This reduces the time it would take to manually enter values. When
the sensor is in Run mode, you should use the runtime filter results to fine-tune these settings.
Blob Find Tool Advanced Tab
Fields
The following are fields on the Blob Find Advanced tab:
• Options on page 137
• Blob Find Tool Advanced Tab Results on page 123
Options
122
Minneapolis, MN USA
Banner Engineering Corp.
2/2010
PresencePLUS Software Tools
Discard Boundary Blobs: The Discard Boundary Blobs checkbox, if selected, allows you to determine if you want
blobs touching the perimeter of the search ROI to be included in your results.
Fill Holes: Fill Holes checkbox, if selected, allows you to ignore (by filling) small features such as scratches, glare
and so on which might otherwise appear as small imperfections or non-blobs within a larger blob. If you select this
option, you can specify the size of the largest hole to fill in the Largest Hole to Fill field.
Compute Statistics: The Compute Statistics checkbox, when selected, enables advanced results to be calculated and
displayed when inspections are run.
Largest Hole to Fill: If you select Fill Holes, you must specify the size of the largest hole to fill in this field.
Blob Find Tool Advanced Tab Results
Area
The area (A) is just a count of the total number of pixels belonging to the blob.
Centroid
The centroid (xc, yc) is the point at the center of mass of the blob. For simple blobs like solid circles, ellipses, or
rectangles, this is just the center of the shape. For more complicated shapes it is helpful to imagine a piece of cardboard
cut out in the shape of the blob. The centroid is the point where you could balance the cardboard on the tip of a pencil.
For complicated shapes-especially shapes with unfilled holes-the centroid might lie outside the shape.
The x coordinate of the centroid is calculated by adding up the x coordinates of each pixel in the blob and dividing by
the area. The y coordinate is similar:
Perimeter
The perimeter (P) gives an approximate measurement of the length of the circumference of the blob. Because blobs
are built from individual pixels, it is most practical to estimate the perimeter by counting the contrib
utions of individual
pixels on the blob's boundary. The following table describes the exact values that are added to the perimeter for each
possible pixel configuration. In each example, the description refers to the center pixel in the corresponding pictures.
A pixel with no neighbors that belong to the same blob contributes
(3.14) linear pixels to the perimeter of the blob. This can only happen
in a blob that has an area of one. Since such small blobs are usually
ignored, this circumstance is rare.
A pixel with one neighbor that belongs to the same blob contributes
2.571 linear pixels to the perimeter of the blob.
A pixel with two neighbors that belong to the same blob, forming a
straight line, contributes exactly 2 linear pixels to the perimeter of the
blob.
Banner Engineering Corp.
Minneapolis, MN USA
123
PresencePLUS Software Tools
2/2010
A pixel with two neighbors that belong to the same blob, forming a
corner, contributes 1.414 linear pixels to the perimeter of the blob.
A pixel with three neighbors that belong to the same blob contributes
exactly 1 linear pixel to the perimeter of the blob. A pixel with three
neighbors that belong to the same blob contributes exactly 1 linear
pixel to the perimeter of the blob.
A pixel with four neighbors that belong to the same blob contributes
nothing to the perimeter of the blob.
This method of counting tends to slightly overestimate the "true" perimeter. For example, a circle with a radius of 100
pixels will have a computed perimeter of approximately 660 pixels, compared with the expected value of 628 pixels.
If the camera is configured to convert pixel distances to other units, (e.g. inches), the perimeter will be given in those
units. If the blob contains holes that have not been filled, the length of the perimeter will include the points on the
perimeters of these holes.
Compactness
The compactness is high for blobs that are nearly circular and low for blobs that are elongated or complicated.
compactness =
Where A is the area and P is the perimeter of the Blob in question. An idealized circle would have a compactness of
100, but because the perimeter is approximated (see above), the highest realistic value for most blobs is roughly 90.
Very small blobs with just a handful of pixels may reach or even exceed the theoretical maximum of 100, again because
of the approximations in the perimeter calculation.
Major Axis Length, Minor Axis Length, and Major Axis Angle
To understand Major Axis Length, Minor Axis Length, and Major Axis Angle, it is important to note that these are
not measurements of the Blob itself because the Blob may be an irregular shape. Rather, these measurements are
determined by a well-defined shape, a "best fit ellipse" as shown below.
These three results combine to give information about the elongation and orientation of a blob . The equations used
to compute these statistics are fairly complicated, but the results usually have an intuitively useful meaning, described
below. The first step in computing these results is to compute the M2,0, M0,2 and M1,1 statistical moments:
124
Minneapolis, MN USA
Banner Engineering Corp.
2/2010
PresencePLUS Software Tools
where A is the area, (xc, yc) are the coordinates of the centroid and (xi, yi) are the coordinates of pixel i. These values
represent the variance with respect to x, the variance with respect to y, and the covariance, respectively. The final
results can be calculated as follows.
The table below gives a more practical perspective on how to interpret these results. If the camera is configured to
convert pixels to other units, the major and minor axis lengths will be given in those units. The major axis angle is
always given in degrees.
Blob Shape
Meaning of Major Axis
Length
Meaning of Minor Axis
Length
Meaning of Major Axis
angle
circular, no holes
diameter of the circle
equal to the major axis
length
unstable
elliptical, no holes
length of the ellipse
width of the ellipse
orientation of the ellipse
square, no holes
diameter of a circle that best equal to the major axis
approximates the square
length
rectangular, no holes
length of an ellipse that best width of an ellipse that best orientation of the rectangle
approximates the rectangle approximates the rectangle
unstable
complicated shape, no holes length of an ellipse that best width of an ellipse that best orientation of the
approximates the shape
approximates the shape
shape-unstable if length and
with are nearly equal
Banner Engineering Corp.
Minneapolis, MN USA
125
PresencePLUS Software Tools
any shape with holes
2/2010
results vary depending on
exact shape-experiment on
your particular shape
results vary depending on
exact shape-experiment on
your particular shape
results vary depending on
exact shape-experiment on
your particular shape
Eccentricity
The eccentricity of a blob is defined as the length of the major axis divided by the length of the minor axis. For circular
regions and other regions with radial symmetry (like a square), the value will be very close to 1. For elongated regions,
the value will grow, possibly becoming quite large.
Max Radius and Max Radius Position
These results are equivalent to those for the minimum radius, but they refer to the pixel on the perimeter of the blob
that is farthest from the centroid .
Min Radius and Min Radius Position
The minimum radius of a blob is the distance from the centroid of the blob to the closest pix
el on that blob's perimeter.
The minimum radius position gives the pixel coordinates of that closest perimeter point. If the blob contains unfilled
holes, the minimum radius position may be on the perimeter of a hole. If the camera is configured to convert pixels to
other units, the minimum radius (but not the minimum radius position) will be given in those units.
7.3 Vision Gray Scale Tools
Vision tools analyze an image and extract information used for judgment criteria.
7.3.1 Average Gray Scale Tool
The Average Gray Scale tool calculates the average pixel intensity within the selected ROI. Each pixel has a gray
scale intensity value from 0 to 255, where 0 is black and 255 is white. The Average Gray Scale tool records the gray
scale value of each pixel in an ROI and averages them. With this information, the Average Gray Scale tool can detect
changes in intensity that can indicate several conditions, such as missing objects, holes, texture changes, and possible
color changes.
Using the Reject Level parameter, the tool can be set up to ignore pixel intensities that are not pertinent to an inspection
Usage
• Spot-check for holes
• Check for change in surface texture
• Check for color quality
• Check for presences/absence of a label or other objects
Fields
The following are fields on the Average Gray Scale tool Input tab:
• Reject Level Example on page 132
• Average Gray Scale Results on page 128
• Histogram on page 128
Supported Platforms
ProII Color ProII/ProII OMNI
1.3
Color
OMNI/OMNI AREA/AREA1.3 EDGE/EDGE GEO/GEO
1.3
1.3
1.3
BCR/BCR
1.3
Yes
Yes
No
Yes
Yes
Yes
No
No
Average Gray Scale Input Tab
126
Minneapolis, MN USA
Banner Engineering Corp.
2/2010
PresencePLUS Software Tools
Adding an Average Gray Scale Tool
To add an area tool to an inspection:
1. Click the button of the tool to be added to the inspection.
2. If desired, rename the tool.
3. Draw an ROI.
Control
Description
Use this field to rename the tool. The default is
tool_name_1, tool_name_2, and so on, where the default
tool_name depends on the tool being created (for example,
locate, edge or the like). The name can have only
alphanumeric characters and underscores with no spaces.
Click this button to add an ROI to an image.
Click this button to add a mask to an image. A mask
excludes an area inside the ROI.
Banner Engineering Corp.
Minneapolis, MN USA
127
PresencePLUS Software Tools
Control
2/2010
Description
Click this button to remove an ROI or a mask from an
image.
Use this field to rotate the ROI. You can manually key in
a rotation angle, or you can use the up or down arrow keys
to rotate the ROI.
Reject Level Example
Consider setting up an inspection for a relatively bright object that ranges from 180 to 200 in pixel intensity and takes
up 15 percent of the Field of View; yet, the remaining 85 percent of the Field of View ranges from 230 to 255 in pixel
intensity. Setting a Reject Level of 220 will allow the tool to “pay attention” to only the bright object being inspected.
Further, masking the bright parts of the Field of View will not be necessary as only pixels whose intensity is less than
the Reject Level will contribute to bright Blobs. Note that rejected pixels are colored orange in the histogram.
Average Gray Scale Results
The Results field returns the average gray scale value of the pixels in the ROI as well as the Standard Deviation.
Histogram
The Average Gray Scale tool has an optional Histogram feature. The histogram below, corresponds to an Average
Gray Scale tool ROI. The horizontal axis of the histogram is the individual pixel brightness values, the vertical axis is
a count of how many pixels in the Average Gray Scale ROI have that brightness.
128
Minneapolis, MN USA
Banner Engineering Corp.
2/2010
PresencePLUS Software Tools
7.3.2 Blob Detect Tool
In imaging, a group of adjacent, like-shaded pixels, is called a Blob, short for Binary Large OBject . The Blob tool
separates selected pixels into two categories: black and white. After the pixels are separated into black and white, they
are grouped and adjacent black or white pixels are seen as a dark or bright Blob.
Usage
• Count pills
• Measure hole size
• Verify the number of characters in date/lot code
• Detect LCD segments
• Detect missing products during packaging
Fields
The following are fields on the Blob Detect tool Input tab:
• Threshold on page 207
• Blob Type on page 132
• Blob Detect Tool Input Tab Results on page 132
• Histogram on page 136
Supported Platforms
ProII Color ProII/ProII OMNI
1.3
Color
OMNI/OMNI AREA/AREA1.3 EDGE/EDGE GEO/GEO
1.3
1.3
1.3
BCR/BCR
1.3
Yes
Yes
No
Yes
Yes
Yes
No
No
Blob Tool Input Tab
Banner Engineering Corp.
Minneapolis, MN USA
129
PresencePLUS Software Tools
2/2010
Adding a Blob Detect Tool
1. Click the button of the tool to be added to the inspection.
2. If desired, rename the tool.
3. Draw an ROI.
Control
Description
Use this field to rename the tool. The default is
tool_name_1, tool_name_2, and so on, where the default
tool_name depends on the tool being created (for example,
locate, edge or the like). The name can have only
alphanumeric characters and underscores with no spaces.
Click this button to add an ROI to an image.
Click this button to add a mask to an image. A mask
excludes an area inside the ROI.
Click this button to remove an ROI or mask from an image.
130
Minneapolis, MN USA
Banner Engineering Corp.
2/2010
Control
PresencePLUS Software Tools
Description
Use this field to rotate the ROI. You can manually key in
a rotation angle, or you can use the up or down arrow keys
to rotate the ROI.
Threshold
Type
Fixed
Select Fixed when the lighting and image content will remain relatively constant for all inspections.
If you select Fixed , you can also specify Threshold and Reject Levels.
Threshold Level
The Threshold Level (e.g., 141) defines the white/black cutoff point. Once a threshold is chosen, any pixels brighter
than the threshold become pure white while those darker than the threshold become pure black.
Reject Level
The Reject Level field is for bright Blobs only, and is used to narrow the range of pixel intensities to consider in an
inspection. Leaving the defaults at 0 for low and 255 for high will result in the tool taking into consideration all gray
scale levels in the ROI from 0 (black) to 255 (white). Note that the Reject Level field is visible only when Bright bead
type is selected.
Adaptive
Select Adaptive when there are lighting changes that cause the acquired image to change.
Banner Engineering Corp.
Minneapolis, MN USA
131
PresencePLUS Software Tools
2/2010
Adaptive thresholding is a technique that is used to adjust the threshold for the BLOB tool based upon lighting changes
and image content within the ROI. It performs best if used with bi-modal images, which have a clear contrast in the
ROI. Adaptive thresholding chooses the current threshold value by converging to a value based on the average value
of the pixels above and below the previous threshold value; it will not move the value of the threshold above or below
the upper or lower limits.
Low Limit: Enter a gray scale value in this field, and the tool will not allow the Adaptive threshold to go below this
value.
Upper Limit: Enter a gray scale value in this field, and the tool will not allow the Adaptive threshold to go above this
value.
Reject Level: The Reject Level field is for bright Blobs only, and is used to narrow the range of pixel intensities to
consider in an inspection. Leaving the defaults at 0 for low and 255 for high will result in the tool taking into
consideration all gray scale levels in the ROI from 0 (black) to 255 (white). Note that the Reject Level field is visible
only when Bright bead type is selected.
Reject Level Example
Consider setting up an inspection for a relatively bright object that ranges from 180 to 200 in pixel intensity and takes
up 15 percent of the Field of View; yet, the remaining 85 percent of the Field of View ranges from 230 to 255 in pixel
intensity. Setting a Reject Level of 220 will allow the tool to “pay attention” to only the bright object being inspected.
Further, masking the bright parts of the Field of View will not be necessary as only pixels whose intensity is less than
the Reject Level will contribute to bright Blobs. Note that rejected pixels are colored orange in the histogram.
Blob Type
• Choose Dark if the part is darker than the background.
• Choosing Dark with a Fixed threshold will cause the tool to fix the threshold at the level specified in the Threshold
level field. The tool will choose as dark Blobs all grouped pixels below the specified threshold.
• Choosing Dark with an Adaptive threshold type will cause the tool to limit the threshold to the range specified in
the Threshold level Lower and Upper Limit fields. The tool will choose as dark Blobs all grouped pixels below the
threshold chosen.
• Choose Bright if the part is lighter than the background.
• Choosing Bright with a Fixed threshold type will cause the tool to fix the threshold at the Bright level specified in
the Threshold level field. The tool will choose as bright Blobs all grouped pixels above the specified Bright threshold
and less than or equal to the Reject level. Note: Pixels in the ROI which are brighter than the specified Reject level
will turn orange in the Image window and be ignored during inspection.
• Choosing Bright with an Adaptive threshold type will cause the tool to limit the threshold to the range specified in
the Threshold level Lower and Upper Limit fields. The tool will choose as bright Blobs all grouped pixels above
the specified Lower Limit and less than or equal to the Upper Limit. Note: Pixels in the ROI which are brighter
than the specified Reject level will turn orange in the Image window and be ignored during inspection.
Blob Detect Tool Input Tab Results
132
Minneapolis, MN USA
Banner Engineering Corp.
2/2010
PresencePLUS Software Tools
Count: The number of Blobs found.
Total Area: The total area (in pixels) of all the Blobs.
Threshold Level: The white/black cutoff point.
From the dropdown list of Blobs, you can select a specific Blob to get area and centroid information about that specific
Blob.
Blob Detect Filter/Sort Tab
Note: The Blob Detect Filter/Sort tab starts out disabled, and you need to enable it in the Tools Configuration tab of the System di
Banner Engineering Corp.
Minneapolis, MN USA
133
PresencePLUS Software Tools
2/2010
Blob Sort
The Sort drop-down list allows the user to select a sort method to determine which Blob the sensor labels as "Blob
#1." By default, Blobs are numbered according to scan order; that is, the sensor numbers Blobs as it encounters them
while scanning the FOV from top-to-bottom and then left-to-right. Select one of the computed statistics choices from
the drop-down list to use for the sort:
• No sorting
• Position
• Area on page 187
• Perimeter on page 188
• Compactness on page 189
• Major Axis Length, Minor Axis Length, and Major Axis Angle on page 189
• Eccentricity on page 189
• Min Radius and Min Radius Position on page 191
• Max Radius and Max Radius Position on page 191
134
Minneapolis, MN USA
Banner Engineering Corp.
2/2010
PresencePLUS Software Tools
Blob Sort Order
Once you select a Sort method, you need to define a Sort Order:
• If Position is selected for the Sort method, then Blob order is based on the x,y coordinates of the centroids and the
options are—
• Left most
• Top most
• Right most
• Bottom most
• For any of the other options, Blob order is based on Increasing or Decreasing value of the parameter selected. For
example, if Perimeter and Increasing is selected, the smallest perimeter Blob will be Blob #1.
Blob Filter
The Blob filter allows you to more accurately select a specific Blob to locate and to use for positioning other Vision
tools. Filter modifies the Blob count based on Computed Statistics criteria so that, for example, only circular Blobs
(compactness) or symmetric Blobs (eccentricity) are included in the Blob count.
When you click the Preset button, the sensor uses the selected Blob to preset the filter values so that only the selected
Blob will subsequently be identified by the sensor. This reduces the time it would take to manually enter values. When
the sensor is in Run mode, you should use the runtime filter results to fine-tune these settings.
Banner Engineering Corp.
Minneapolis, MN USA
135
PresencePLUS Software Tools
2/2010
Histogram
The Histogram is a display of the grayscale values on the "x" axis and the number of pixels on the "y" axis. The
Histogram displays the amount of pixels for each grayscale value. The graph displays information for all grayscale
values (0-255). Cursors, shown as vertical lines, represent minimum threshold, maximum threshold, threshold level
and reject level. Corresponding cursor can be moved horizontally to adjust a value.
Blob Detect Tool Advanced Tab
Fields
136
Minneapolis, MN USA
Banner Engineering Corp.
2/2010
PresencePLUS Software Tools
The following are fields on the Blob Detect Advanced tab:
• Options on page 137
• Blob Detect Tool Advanced Tab Results on page 138
Options
Discard Boundary Blobs: The Discard Boundary Blobs checkbox, if selected, allows you to determine if you want
blobs touching the perimeter of the search ROI to be included in your results.
Fill Holes: Fill Holes checkbox, if selected, allows you to ignore (by filling) small features such as scratches, glare
and so on which might otherwise appear as small imperfections or non-blobs within a larger blob. If you select this
option, you can specify the size of the largest hole to fill in the Largest Hole to Fill field.
Banner Engineering Corp.
Minneapolis, MN USA
137
PresencePLUS Software Tools
2/2010
Compute Statistics: The Compute Statistics checkbox, when selected, enables advanced results to be calculated and
displayed when inspections are run.
Largest Hole to Fill: If you select Fill Holes, you must specify the size of the largest hole to fill in this field.
Blob Detect Tool Advanced Tab Results
Area
The area (A) is just a count of the total number of pixels belonging to the blob.
Centroid
The centroid (xc, yc) is the point at the center of mass of the blob. For simple blobs like solid circles, ellipses, or
rectangles, this is just the center of the shape. For more complicated shapes it is helpful to imagine a piece of cardboard
cut out in the shape of the blob. The centroid is the point where you could balance the cardboard on the tip of a pencil.
For complicated shapes-especially shapes with unfilled holes-the centroid might lie outside the shape.
The x coordinate of the centroid is calculated by adding up the x coordinates of each pixel in the blob and dividing by
the area. The y coordinate is similar:
Perimeter
The perimeter (P) gives an approximate measurement of the length of the circumference of the blob. Because blobs
are built from individual pixels, it is most practical to estimate the perimeter by counting the contrib
utions of individual
pixels on the blob's boundary. The following table describes the exact values that are added to the perimeter for each
possible pixel configuration. In each example, the description refers to the center pixel in the corresponding pictures.
A pixel with no neighbors that belong to the same blob contributes
(3.14) linear pixels to the perimeter of the blob. This can only happen
in a blob that has an area of one. Since such small blobs are usually
ignored, this circumstance is rare.
A pixel with one neighbor that belongs to the same blob contributes
2.571 linear pixels to the perimeter of the blob.
A pixel with two neighbors that belong to the same blob, forming a
straight line, contributes exactly 2 linear pixels to the perimeter of the
blob.
A pixel with two neighbors that belong to the same blob, forming a
corner, contributes 1.414 linear pixels to the perimeter of the blob.
138
Minneapolis, MN USA
Banner Engineering Corp.
2/2010
PresencePLUS Software Tools
A pixel with three neighbors that belong to the same blob contributes
exactly 1 linear pixel to the perimeter of the blob. A pixel with three
neighbors that belong to the same blob contributes exactly 1 linear
pixel to the perimeter of the blob.
A pixel with four neighbors that belong to the same blob contributes
nothing to the perimeter of the blob.
This method of counting tends to slightly overestimate the "true" perimeter. For example, a circle with a radius of 100
pixels will have a computed perimeter of approximately 660 pixels, compared with the expected value of 628 pixels.
If the camera is configured to convert pixel distances to other units, (e.g. inches), the perimeter will be given in those
units. If the blob contains holes that have not been filled, the length of the perimeter will include the points on the
perimeters of these holes.
Compactness
The compactness is high for blobs that are nearly circular and low for blobs that are elongated or complicated.
compactness =
Where A is the area and P is the perimeter of the Blob in question. An idealized circle would have a compactness of
100, but because the perimeter is approximated (see above), the highest realistic value for most blobs is roughly 90.
Very small blobs with just a handful of pixels may reach or even exceed the theoretical maximum of 100, again because
of the approximations in the perimeter calculation.
Major Axis Length, Minor Axis Length, and Major Axis Angle
To understand Major Axis Length, Minor Axis Length, and Major Axis Angle, it is important to note that these are
not measurements of the Blob itself because the Blob may be an irregular shape. Rather, these measurements are
determined by a well-defined shape, a "best fit ellipse" as shown below.
These three results combine to give information about the elongation and orientation of a blob . The equations used
to compute these statistics are fairly complicated, but the results usually have an intuitively useful meaning, described
below. The first step in computing these results is to compute the M2,0, M0,2 and M1,1 statistical moments:
Banner Engineering Corp.
Minneapolis, MN USA
139
PresencePLUS Software Tools
2/2010
where A is the area, (xc, yc) are the coordinates of the centroid and (xi, yi) are the coordinates of pixel i. These values
represent the variance with respect to x, the variance with respect to y, and the covariance, respectively. The final
results can be calculated as follows.
The table below gives a more practical perspective on how to interpret these results. If the camera is configured to
convert pixels to other units, the major and minor axis lengths will be given in those units. The major axis angle is
always given in degrees.
Blob Shape
Meaning of Major Axis
Length
Meaning of Minor Axis
Length
Meaning of Major Axis
angle
circular, no holes
diameter of the circle
equal to the major axis
length
unstable
elliptical, no holes
length of the ellipse
width of the ellipse
orientation of the ellipse
square, no holes
diameter of a circle that best equal to the major axis
approximates the square
length
rectangular, no holes
length of an ellipse that best width of an ellipse that best orientation of the rectangle
approximates the rectangle approximates the rectangle
unstable
complicated shape, no holes length of an ellipse that best width of an ellipse that best orientation of the
approximates the shape
approximates the shape
shape-unstable if length and
with are nearly equal
any shape with holes
140
results vary depending on
exact shape-experiment on
your particular shape
results vary depending on
exact shape-experiment on
your particular shape
Minneapolis, MN USA
results vary depending on
exact shape-experiment on
your particular shape
Banner Engineering Corp.
2/2010
PresencePLUS Software Tools
Eccentricity
The eccentricity of a blob is defined as the length of the major axis divided by the length of the minor axis. For circular
regions and other regions with radial symmetry (like a square), the value will be very close to 1. For elongated regions,
the value will grow, possibly becoming quite large.
Max Radius and Max Radius Position
These results are equivalent to those for the minimum radius, but they refer to the pixel on the perimeter of the blob
that is farthest from the centroid .
Min Radius and Min Radius Position
The minimum radius of a blob is the distance from the centroid of the blob to the closest pix
el on that blob's perimeter.
The minimum radius position gives the pixel coordinates of that closest perimeter point. If the blob contains unfilled
holes, the minimum radius position may be on the perimeter of a hole. If the camera is configured to convert pixels to
other units, the minimum radius (but not the minimum radius position) will be given in those units.
7.3.3 Circle Detect Tool
Test
The Circle Detect tool finds a single circle or piece of a circle.The tool works by first finding many edge points along
the transitions between bright and dark pixels and then fitting a circular shape to some or all of those points. It can
determine a bend radius, and the circumference of a circular part.
Place the Region of Interest (ROI) by clicking near the center of the circle you wish to find and dragging the cursor to
the outside of that circle. The tool works best when the inner ring of the ROI is completely inside the circle being
detected.
Usage
• Find flaws like chips or metal spurs along a punch or drilled hole
• Measure hole size
• Measure the size of a disk
• Verify that the neck on a vial or bottle is the correct size
• Measure the bend radius of an electronic component
• Find the radius of a circle that is too big to fit in the image
Fields
The following are fields on the Circle Detect tool Input tab:
• Edges on page 143
• Search For Field on page 143
• Legend on page 162
• Results on page 145
Supported Platforms
ProII Color ProII/ProII OMNI
1.3
Color
OMNI/OMNI AREA/AREA1.3 EDGE/EDGE GEO/GEO
1.3
1.3
1.3
BCR/BCR
1.3
Yes
Yes
No
Yes
Yes
No
No
No
Circle Detect Tool Input Tab
Banner Engineering Corp.
Minneapolis, MN USA
141
PresencePLUS Software Tools
2/2010
Adding an Circle Detect Tool
1. Click the button of the tool to be added to the inspection.
2. If desired, rename the tool.
3. Draw an ROI.
Field/Button
Description
Use this field to rename the tool. The default is tool_name_1, tool_name_2, and
so on, where the default tool_name depends on the tool being created (for example,
locate, edge or the like). The name can have only alphanumeric characters and
underscores with no spaces.
Click this button to add an ROI to an image.
Click this button to remove an ROI from an image.
142
Minneapolis, MN USA
Banner Engineering Corp.
2/2010
PresencePLUS Software Tools
When adding an ROI for a Circle Detect too, click near the center of the circle you wish to inspect and drag to the
outside of the circle. Adjust the inner and outer rings of the ROI by dragging the squares on the top, bottom, and sides.
If using the "Circular, Arc" option, adjust the angular range by dragging the lines at the start and end of the arc.
Edges
Threshold measures the rate of change of grayscale values and needs sharply-defined transitions. The Circle Detect
tool finds edge points by scanning along many invisible lines from inside of the ROI to the outside. Arrows on the
ROI point outwards to indicate this direction. Three settings—Threshold, Polarity, and Sample Rate—give you control
over how the edge scan works.
Field/Graph
Description
Threshold
Edges are selected by the edge strength method, which measures the rate of change from
bright to dark or dark to bright. Enter an edge strength threshold in the range from 1 to
255. The default value is 20. As this value gets lower, the tool will find weaker, blurrier
or more gradual edges.
Polarity
• Bright to Dark: Finds only the edges with their bright side towards the center of the
ROI and their dark side towards the outside of the ROI.
• Dark to Bright: Finds only the edges with their dark side towards the center of the
ROI and their bright side towards the outside of the ROI
• Bright or Dark finds all edges.
Sample Rate
The Sample Rate sets the spacing between the invisible scan lines at the midpoint between
the inner and outer rings of the ROI. When the sample rate is raised, fewer edges will
be found and they will be spaced more widely. When the sample rate is lowered, more
edge will be found. This creates a tradeoff between speed and precision. Higher sample
rates execute faster, and lower sample rates find more precision results and are capable
of detecting smaller flaws.
Search For Field
The Search For offers three ways to fit a circle to the edge points the tool finds:
• "Circle, Best Points" is the most common choice. It automaticallyfigures which edge points make the best circle and
ignores the rest. The points that are being ignored will be shown on the image in orange. This mode is very tolerant
of noise or extra edges in the ROI, but under some circumstances it may ignore edges you wish to include.
• "Circle, All Points" finds a circle that explains all the edges as well as possible without ignoring an
ything. This setting
is the fastest, but it works poorly if there are any extra edges or noise within the ROI. This mode is useful if the circle
being examined is irregular or elliptical.
• "Circular Arc" finds a piece of a circle. Using this setting tofind the start or end angle of an arc or bend or to measure
the angle subtended by a bend.
Banner Engineering Corp.
Minneapolis, MN USA
143
PresencePLUS Software Tools
144
2/2010
Minneapolis, MN USA
Banner Engineering Corp.
2/2010
PresencePLUS Software Tools
Legend
The Legend describes the pixel colors on the image.
Results
Using the Search For "CIrcle, Best Points" or "Circle, All Points" options will produce the following results.
Result
Description
Center
The center point of the circle detected.A Measure tool can measure from this center
point to other features.
Radius
The distance from the center of the detected circle to its edges. Use this value in a
Test tool to determine if a circle is the correct size.
Circumference
The distance around the circle.
Min Radius
The distance from the center of the circle to the closest green edge point. Click on
this result to see the location. Use this value in a Test tool to look for flaws like
metal spurs on the inside of a drilled or punched hole.
Max Radius
The distance from the center of the circle to the farthest green edge point. Use the
value in a Test tool to find flaws like chips or tearing on the outside of a punched
or drilled hole.
Average Error
The average distance between green edge points and the circle found. Use thisalue
v
in a Test tool to determine if a circle is squished (elliptical), poorly formed, or
irregular.
Using the Search For "Circular Arc" option will produce the following additional results.
Banner Engineering Corp.
Minneapolis, MN USA
145
PresencePLUS Software Tools
2/2010
Result
Description
Arc Length
The distance along the arc.
Arc Angle
The angle between the start and end of the arc. This will be between 0 and 360
degrees.
Arc Start Angle
The angle between the x-axis and the beginning of the arc. This will be between
-180 and +180 degrees.
Arc End Angle
The between the x-axis and the end of the arc. This will be between -180 and +180
degrees.
7.3.4 Edge Tool
The Edge tool finds and marks the position of all edges along an ROI line. It detects and counts transitions between
bright and dark pixels. The total number of edges can be counted, and the position of each edge can be found. Edge
position information can be used for distance or angle measurement.
Usage
• Measure the height and width of a part
• Count the pins on a resistor
• Measure the height of a needle
• Measure the deflection of an automotive gauge
• Detect the edge of a web
• Verify that a bottle cap is on completely
Fields
The following are fields on the Edge tool Input tab:
• Threshold Type on page 164
• Filters on page 169
• Edge Tool Results on page 151
Supported Platforms
ProII Color ProII/ProII OMNI
1.3
Color
OMNI/OMNI AREA/AREA1.3 EDGE/EDGE GEO/GEO
1.3
1.3
1.3
BCR/BCR
1.3
Yes
Yes
No
Yes
Yes
No
Yes
No
Edge Tool Input Tab
146
Minneapolis, MN USA
Banner Engineering Corp.
2/2010
PresencePLUS Software Tools
Adding an Edge Tool
1. Click the button of the tool to be added to the inspection.
2. If desired, rename the tool.
3. Draw an ROI.
Field/Button
Description
Use this field to rename the tool. The default is tool_name_1, tool_name_2, and
so on, where the default tool_name depends on the tool being created (for example,
locate, edge or the like). The name can have only alphanumeric characters and
underscores with no spaces.
Click this button to add an ROI to an image.
Click this button to remove an ROI from an image.
Banner Engineering Corp.
Minneapolis, MN USA
147
PresencePLUS Software Tools
2/2010
Threshold Type
The threshold is used to mark the gray scale transition point. The tool marks the edge when the pixel intensity crosses
the threshold level. From the dropdown list, select one of the following:
• Relative
• Absolute
• Edge Strength
Relative Threshold
Relative threshold is the default, and it finds an edge at a relative pixel intensity. The brightest gray scale level is 100%
and the darkest is 0%. While Relative threshold is more tolerant of light fluctuations between inspections than other
transition types, it may find false edges.
Field/Graph
Description
Percent
Percent is displayed when the Type is Relative. Choose the percentage value at which
the edge should be marked.
Polarity
• Bright to Dark finds edges that start above the threshold value and cross below the
threshold value.
• Dark to Bright finds edges that start below the threshold value and cross above the
threshold value.
• Bright or Dark finds any edge.
Edge Profile Graph
In the Edge Profile graph displayed when the Relative threshold is selected, the red line
shows the percentage pixel intensity relative to the green threshold line. The threshold
line will move up or down with the percent value.
Absolute Threshold
Absolute threshold finds an edge at a specific gray scale level. While Absolute threshold is less likely to find a false
edge than Relative Threshold, it may miss edges if the light level changes between inspections.
148
Minneapolis, MN USA
Banner Engineering Corp.
2/2010
PresencePLUS Software Tools
Field/Graph
Description
Value
Value is displayed when Type is Absolute. Enter a specific gray scale value from 0 to
255.
Polarity
• Bright to Dark finds edges that start above the threshold value and cross below the
threshold value.
• Dark to Bright finds edges that start below the threshold value and cross above the
threshold value.
• Bright or Dark finds any edge.
Edge Profile Graph
In the Edge Profile graph displayed when the Absolute threshold is selected, the red line
shows the percentage pixel intensity relative to the green threshold line. The threshold
line will move up or down with the percent value.
Edge Strength
Edge strength measures the rate of change of grayscale values and needs sharply-defined transitions. Edge strength
is more tolerant of gradual changes in light levels across the tool than other transition types and it will filter out weak
or gradual edges.
Field
Description
Edge
Enter an edge bandwidth value from 1 to 255.
Polarity
• Bright to Dark finds edges that start above the threshold value and cross below the
threshold value.
• Dark to Bright finds edges that start below the threshold value and cross above the
threshold value.
• Bright or Dark finds any edge.
Banner Engineering Corp.
Minneapolis, MN USA
149
PresencePLUS Software Tools
2/2010
Graph Tab
When Edge Strength is selected in the Input tab, the software displays the Graph tab. This tab provides similar
information to the Input tab, but displays separate Edge Profile and Edge Strength graphs for easier viewing.
The Edge Profile graph represents the absolute gray scale level across the tool ROI.
The Edge Strength graph represents the change in gray scale along the tool O
RI. Edge Strength detects an edge when
the rate of change (solid red line on the graph) crosses the selected intensity change amount (dashed green lines on
the screen).
A bright-to-dark transition has a negative edge strength value, and a dark-to-bright transition has a positive edge
strength value. When the Edge Strength level is adjusted, both the negative and positive green dotted lines will adjust
together.
Filters
Field
Description
ROI Width
Increases in increments of 4 pixels (for example, 1, 5, 9, 13, ...) up to the total
FOV size. Some things to note:
• Narrow ROIs execute faster but could miss the edge.
• Wide ROIs are more consistent but don't execute as fast.
• The ROI must be 13 pixels or wider to calculate the rotation of a part.
150
Minneapolis, MN USA
Banner Engineering Corp.
2/2010
PresencePLUS Software Tools
Field
Description
Smoothing
Runs a rolling average along the ROI length. It filters out sharp changes in the
edge profile.
Note: A high filter number may miss the edge of a narrow line.
Min Width
Filters out small spike-of-intensity changes, and narrow dark or bright bands. It
determines the distance (in pixels) before and after an edge that must be free from
additional transitions or the end of the ROI before the edge is recognized.
Note: A high filter number may miss the edge of a narrow line.
Sample Rate
Determines the sub-pixel resolution, which increases the resolution of the tool,
and increases the inspection time.
1.
2.
3.
4.
1-pixel resolution
1/2-pixel resolution
1/3-pixel resolution
1/4-pixel resolution
Edge Tool Results
The Results field returns the following:
• X,Y coordinates of the current edge. The origin (0,0) is the upper-left corner of the screen.
• A Edge Number field for selecting an edge to analyze.
• Total number of bright-to-dark and dark-to-bright edges, depending on the Polarity option in effect.
Graph Tab
When Edge Strength is selected, the Graph tab appears on the tool window. The graph for the Input tab overlays both
the edge strength graph and the edge profile. In the Graph tab, the edge profile graph and the edge strength graph are
separated for easier viewing.
The top graph, Edge Profile, represents the absolute gray scale level across the Edge tool.
Banner Engineering Corp.
Minneapolis, MN USA
151
PresencePLUS Software Tools
2/2010
The bottom graph, Edge Strength, represents the change in gray scale along the Edge tool.
Edge Strength detects an edge when the rate of change (solid red line on the screen) crosses the selected intensity
change amount (dashed green lines on the screen).
A bright-to-dark transition has a negative edge strength value, and a dark-to-bright transition has a positive edge strength
value. When the Edge Strength level is adjusted, both the negative and positive lines will adjust together.
Graph Tab
152
Minneapolis, MN USA
Banner Engineering Corp.
2/2010
PresencePLUS Software Tools
7.3.5 Geometric Count Tool
The Geomtetric Count tool uses edge content to find shapes in an image. During setup, the user identifies a section of
the image containing the target shape and assigns that shape as the reference for the Geometric Count tool.This reference
shape is subsequently used to locate all similar shapes in new images by searching inside the Search ROI. Geometric
Count returns the following information:
• Number of shapes found
• Location of all shapes found
Note: If the Geometric Count tool is preceded by a Location tool (for example, Locate or Geometric Find tool),
then the Search ROI will only translate by the amount that the preceding Location tool found. Thus, even if the
Location tool has rotation enabled, the Search ROI will not rotate.
Note: The Geometric Count tool requires strong and repeatable edge content in the image.
Usage
• Verify date/lot codes
• Inspect electronic component assembly
• Inspect printing
Fields
The following are fields on the Geometric Count tool Input tab:
• Threshold on page 155
• Enabling Remote Teach on page 303
• Count on page 155
• Edge Length on page 156
• Legend on page 156
• Results on page 159
Supported Platforms
ProII Color ProII/ProII OMNI
1.3
Color
OMNI/OMNI AREA/AREA1.3 EDGE/EDGE GEO/GEO
1.3
1.3
1.3
BCR/BCR
1.3
Yes
Yes
No
Yes
Yes
No
No
Yes
Geometric Count Tool Input Tab
Banner Engineering Corp.
Minneapolis, MN USA
153
PresencePLUS Software Tools
2/2010
Adding a Geometric Count Tool
To add a tool to an inspection:
1. Click the button of the tool to be added to the inspection.
2. If desired, rename the tool.
3. Draw an ROI.
Field/Button
Description
Use this field to rename the tool. The default is
tool_name_1, tool_name_2, and so on, where the default
tool_name depends on the tool being created (for example,
locate, edge or the like). The name can have only
alphanumeric characters and underscores with no spaces.
Click this button to add an ROI to an image.
Click this button to add a mask to an image
Click this button to remove an ROI from an image.
154
Minneapolis, MN USA
Banner Engineering Corp.
2/2010
Field/Button
PresencePLUS Software Tools
Description
Use this field to rotate the ROI. You can manually key in
a rotation angle, or you can use the up or down arrow keys
to rotate the ROI.
Threshold
Adaptive Threshold
Adaptive Threshold adjusts the edge threshold on each acquired image. The Sensor automatically sets the threshold
and attempts to adjust for contrast variations.
Edge Strength
Edge Strength sets the edge threshold at a predetermined gray scale value from 0 to 127. Edge Strength provides more
control over what gets to be considered an edge pixel.
Enabling Remote Teach
The Remote Teach function is a method of remotely updating inspection parameters in Run mode. Vision tools and
Test tools can be selected to be taught or not taught. To remotely teach an inspection, the Remote Teach function must
be enabled on each tool to be taught.
Note: Remote Teach in the Geometric Count tool will learn a new shape. Remote Teach in a Geometric Count
Test tool will learn a new number of shapes.
Count
In the Maximum Number to Find field, enter the maximum number of outline patterns to find, or use the up and
down arrow keys to change the number.
Banner Engineering Corp.
Minneapolis, MN USA
155
PresencePLUS Software Tools
2/2010
The lower the number you enter, the faster the inspection time because the inspection will stop once it reaches the
selected number. The maximum number of outline patterns that the tool will find is 255.
Edge Length
The tool ignores target patterns with edges equal to or shorter than the specified number of pixels for edge length.
Legend
All edges found by the Geometric Find tool are color-coded in the Image window. Strong edges show up in green, and
weak edges show up in red.
Note: Both weak and strong edges in the pattern ROI are expected to be present in the inspection.
Results
The Results field returns the following:
• Total number of shapes above the minimum acceptance level.
• Position of each shape's center. The origin (0,0) is the upper-left corner of the screen.
Geometric Count Tool Advanced Tab
Fields in the Geometric Count Tool Advanced tab are described in the following.
Fields
The following are fields on the Geometric Count tool Advanced tab:
• Rotation Range on page 157
• Extra and Missing Edges on page 157
• Minimum Acceptance Level on page 173
• Reject Threshold on page 158
• Scaling Range on page 159
• Results on page 159
156
Minneapolis, MN USA
Banner Engineering Corp.
2/2010
PresencePLUS Software Tools
Advanced Tab
Rotation Range
These adjustments are used to set the maximum allowable rotation (0° to 180°) that a target pattern can have and still
be identifiable.
Extra and Missing Edges
Banner Engineering Corp.
Minneapolis, MN USA
157
PresencePLUS Software Tools
2/2010
Field
Description
Extra Edges
If left unchecked (disabled), the Sensor will find a target shape that might have extra
edges. If checked (enabled), the Sensor will not find a target shape that has extra edges
of a specified length. The size of the minimum edge length is adjustable.
Note: If checked, the application will not allow a minimum edge length to be set
below the number specified for Minimum Edge Length (in the Input tab ) for this
tool.
Missing Edges
If left unchecked (disabled), then the Sensor will find a target shape, even if it is missing
some edge content. If checked (enabled), then the Sensor will not find a target shape that
is missing edges of a specified length. The size of the minimum edge length to check for
is adjustable.
Note: If checked, the application will not allow a minimum edge length to be set
below the number specified for Minimum Edge Length (in the Input tab ) for this
tool.
Minimum Acceptance Level
This adjustment sets the acceptance level for pattern matches.
• Decrease the Minimum Acceptance Level to allow more variations in matching patterns.
• Increase the Minimum Acceptance Level to filter out patterns that contain small defects.
Percent match is a value between 20% and 100% that indicates the quality of the match (100% is a perfect match; 20%
is a slight match). The percent match can be used to detect large defects.
Note: Banner does not recommend setting the Minimum Acceptance Level below 70%.
Reject Threshold
These adjustments allow the user to set the “band of gray scale values” the tool uses to determine the threshold when
Adaptive Threshold is specified.
If the Low is set to zero (default) and the High is set to 255 (default), then all gray scale values within the acquired
image are used to determine the threshold.
An example of narrowing the band of gray scale values is to set the Low at 50 and the High at 200.With these settings,
only gray scale values from 50 to 200 will be used by the Geometric Find tool to determine the threshold when
Adaptive
Threshold is specified.
These controls allow the user to “block” dark spots or light spots from influencing the threshold in the image acquired
by the Sensor.
158
Minneapolis, MN USA
Banner Engineering Corp.
2/2010
PresencePLUS Software Tools
Scaling Range
Scaling Range allows you to set a range from a low of 0.8 to a high of 1.2. In Run mode, this will enable matches to
occur even with slight variations in shape from the reference shape.
Results
The Results field returns the following:
• Total number of shapes above the minimum acceptance level.
• Position of each shape's center. The origin (0,0) is the upper-left corner of the screen.
7.3.6 Line Detect Tool
The Line Detect tool finds a single, straight-line segment. The tool works by first finding many edge points along the
transitions between bright and dark pixels and then fitting a line to some or all of those points. I can measure the length
of a straight edge, find damage or flaws along an edge or offer a way to measure between a straight line and other
points or lines in the image.
Place the Region of Interest (ROI) by clicking to one side of the line you wish to find and then dragging the cursor
perpendicularly across that line before releasing. Adjust the width of the ROI by dragging either side.
Usage
• Measure the height and width of a part
• Measure the height of a needle
• Measure the deflection of an automotive gauge
• Detect the edge of a web
• Verify that a bottle cap is on completely
• Find chips, spurs, or other flaws along a straight edge
• Measure the angle between two lines
Fields
The following are fields on the Line Detect tool Input tab:
• Edges on page 161
• Search For Field on page 161
• Legend on page 162
• Results on page 162
Supported Platforms
Banner Engineering Corp.
Minneapolis, MN USA
159
PresencePLUS Software Tools
2/2010
ProII Color ProII/ProII OMNI
1.3
Color
OMNI/OMNI AREA/AREA1.3 EDGE/EDGE GEO/GEO
1.3
1.3
1.3
BCR/BCR
1.3
Yes
Yes
No
Yes
Yes
No
No
No
Line Detect Tool Input Tab
Adding an Line Detect Tool
1. Click the button of the tool to be added to the inspection.
2. If desired, rename the tool.
3. Draw an ROI.
Field/Button
Description
Use this field to rename the tool. The default is tool_name_1, tool_name_2, and
so on, where the default tool_name depends on the tool being created (for example,
locate, edge or the like). The name can have only alphanumeric characters and
underscores with no spaces.
160
Minneapolis, MN USA
Banner Engineering Corp.
2/2010
Field/Button
PresencePLUS Software Tools
Description
Click this button to add an ROI to an image.
Click this button to remove an ROI from an image.
When adding an ROI for a Line Detect tool, click to one side of the line you wish to find and drag the cursor
perpendicularly across the line before releasing. Adjust the width of the ROI by dragging either side.
Edges
The Line Detect tool finds edge points by scanning along many invisible lines parallel to the arrows shown on the
edges of the ROI. Three settings—Threshold, Polarity, and Sample Rate—give you control over how the edge scan
works.
Field/Graph
Description
Threshold
Edges are selected by the edge strength method, which measures the rate of change from
bright to dark or dark to bright. Enter an edge strength threshold in the range from 1 to
255. The default is 20. As this value gets lower, the tool will find weaker, blurrier or
more gradual edges.
Polarity
• Bright to Dark: Finds only the edges with their bright side towards the center of the
ROI and their dark side towards the outside of the ROI.
• Dark to Bright: Finds only the edges with their dark side towards the center of the
ROI and their bright side towards the outside of the ROI.
• Bright or Dark: Finds all edges.
Sample Rate
The Sample Rate sets the spacing between invisible scan lines at the midpoint between
the inner and outer part of the ROI. When the sample rate is raised, fewer edges will be
found and they will be spaced more widely. When the sample rate is lowered, more edge
will be found. This creates a trade-off between speed and precision. Higher sample rates
execute faster, and lower sample rates find more precise results and are capable of
detecting smaller flaws.
Search For Field
The Search For offers two ways to fit a line to the edge points the tool finds:
• "Line, Best Points" is the most common choice. It automatically figures which edge points make the best line and
ignores the rest. The points that are being ignored will be shown on the image in orange. This mode is tolerant of
Banner Engineering Corp.
Minneapolis, MN USA
161
PresencePLUS Software Tools
2/2010
noise or extra edges in the ROI, but under some circumstances it may ignore edges you wish to include. Also, if the
line in the image has gaps in it, this mode may produce lines that are shorter than you want.
• "Line, All Points" finds a line that explains all the edges as well as possible without ignoring anything. This setting
is the fastest, but it works poorly if there are any extra edges or noise within the ROI. This mode can be useful if the
line being examined is jagged, irregular, or curved.
Legend
The Legend describes the pixel colors on the image.
Results
Result
Description
Start Point, Midpoint, End Point
The (x,y) coordinates of the start, middle, and end of the line found. Click on any
of these results to see where they are in the image. By definition, the start point
will be on the end of the line that is closer to the left side of the O
R I, when viewed
in the direction of the arrows.
Use these values with a Measure tool.
Worst Distance
The distance from the line to the farthest green edge point. Click on this result to
see the location. Use this value in a Test tool to look for damage or deviation along
an edge. This result may be most useful when using the Search For "Line, All
Points" option.
Length
The distance from the start point of the line to the end point.
Angle
The angle between the x-axis and the vector from the start of the line to the end
of the line. This will be in the range from -180 to +180.
Average Error
The average distance between the green edge points and the line found. Use this
value in a Test tool to determine whether a line is curved or irregular. This may
be most useful when using the Search For "Line, All Points" option.
7.3.7 Object Tool
The Object tool detects the edges of dark and bright segments in an ROI. The Object tool measures the widths of every
dark and light segment along the ROI. The Object tool calculates the midpoint for every object, and counts the total
number of objects. The midpoint can be used to measure distances and angles. Each object can have unique size limit,
or all objects may have the same size limit.
162
Minneapolis, MN USA
Banner Engineering Corp.
2/2010
PresencePLUS Software Tools
Usage
• Measure the width of a label
• Locate the center of a box on a conveyor
• Measure the gaps between stamped parts on a Web.
Fields
The following are fields on the Object tool Input tab:
• Threshold Type on page 164
• Filters on page 169
• Object Tool Results on page 170
Supported Platforms
ProII Color ProII/ProII OMNI
1.3
Color
OMNI/OMNI AREA/AREA1.3 EDGE/EDGE GEO/GEO
1.3
1.3
1.3
BCR/BCR
1.3
Yes
Yes
No
Yes
Yes
No
Yes
No
Object Tool Input Tab
Banner Engineering Corp.
Minneapolis, MN USA
163
PresencePLUS Software Tools
2/2010
Adding a Linear Tool
To add a tool to an inspection:
1. Click the button of the tool to be added to the inspection.
2. If desired, rename the tool.
3. Draw an ROI.
Field/Button
Description
Use this field to rename the tool. The default is tool_name_1, tool_name_2, and
so on, where the default tool_name depends on the tool being created (for example,
locate, edge or the like). The name can have only alphanumeric characters and
underscores with no spaces.
Click this button to add an ROI to an image.
Click this button to remove an ROI from an image.
Threshold Type
The threshold is used to mark the gray scale transition point. The tool marks the edge when the pixel intensity crosses
the threshold level. From the dropdown list, select one of the following:
• Relative
• Absolute
• Edge Strength
Relative Threshold
Relative threshold is the default, and it finds an edge at a relative pixel intensity. The brightest gray scale level is 100%
and the darkest is 0%. While Relative threshold is more tolerant of light fluctuations between inspections than other
transition types, it may find false edges.
Field/Graph
Description
Percent
Percent is displayed when the Type is Relative. Choose the percentage value at which
the edge should be marked.
Polarity
• Bright to Dark finds edges that start above the threshold value and cross below the
threshold value.
• Dark to Bright finds edges that start below the threshold value and cross above the
threshold value.
• Bright or Dark finds any edge.
164
Minneapolis, MN USA
Banner Engineering Corp.
2/2010
PresencePLUS Software Tools
Field/Graph
Description
Edge Profile Graph
In the Edge Profile graph displayed when the Relative threshold is selected, the red line
shows the percentage pixel intensity relative to the green threshold line. The threshold
line will move up or down with the percent value.
Absolute Threshold
Absolute threshold finds an edge at a specific gray scale level. While Absolute threshold is less likely to find a false
edge than Relative Threshold, it may miss edges if the light level changes between inspections.
Field/Graph
Description
Value
Value is displayed when Type is Absolute. Enter a specific gray scale value from 0 to
255.
Polarity
• Bright to Dark finds edges that start above the threshold value and cross below the
threshold value.
• Dark to Bright finds edges that start below the threshold value and cross above the
threshold value.
• Bright or Dark finds any edge.
Edge Profile Graph
In the Edge Profile graph displayed when the Absolute threshold is selected, the red line
shows the percentage pixel intensity relative to the green threshold line. The threshold
line will move up or down with the percent value.
Banner Engineering Corp.
Minneapolis, MN USA
165
PresencePLUS Software Tools
2/2010
Edge Strength
Edge strength measures the rate of change of grayscale values and needs sharply-defined transitions. Edge strength
is more tolerant of gradual changes in light levels across the tool than other transition types and it will filter out weak
or gradual edges.
Field
Description
Edge
Enter an edge bandwidth value from 1 to 255.
Polarity
• Bright to Dark finds edges that start above the threshold value and cross below the
threshold value.
• Dark to Bright finds edges that start below the threshold value and cross above the
threshold value.
• Bright or Dark finds any edge.
Graph Tab
When Edge Strength is selected in the Input tab, the software displays the Graph tab. This tab provides similar
information to the Input tab, but displays separate Edge Profile and Edge Strength graphs for easier viewing.
The Edge Profile graph represents the absolute gray scale level across the tool ROI.
The Edge Strength graph represents the change in gray scale along the tool O
RI. Edge Strength detects an edge when
the rate of change (solid red line on the graph) crosses the selected intensity change amount (dashed green lines on
the screen).
166
Minneapolis, MN USA
Banner Engineering Corp.
2/2010
PresencePLUS Software Tools
A bright-to-dark transition has a negative edge strength value, and a dark-to-bright transition has a positive edge
strength value. When the Edge Strength level is adjusted, both the negative and positive green dotted lines will adjust
together.
Filters
Field
Description
ROI Width
Increases in increments of 4 pixels (for example, 1, 5, 9, 13, ...) up to the total
FOV size. Some things to note:
• Narrow ROIs execute faster but could miss the edge.
• Wide ROIs are more consistent but don't execute as fast.
• The ROI must be 13 pixels or wider to calculate the rotation of a part.
Smoothing
Runs a rolling average along the ROI length. It filters out sharp changes in the
edge profile.
Note: A high filter number may miss the edge of a narrow line.
Min Width
Filters out small spike-of-intensity changes, and narrow dark or bright bands. It
determines the distance (in pixels) before and after an edge that must be free from
additional transitions or the end of the ROI before the edge is recognized.
Note: A high filter number may miss the edge of a narrow line.
Sample Rate
Determines the sub-pixel resolution, which increases the resolution of the tool,
and increases the inspection time.
1.
2.
3.
4.
1-pixel resolution
1/2-pixel resolution
1/3-pixel resolution
1/4-pixel resolution
Object Width
Object Width filters out objects and spaces that are smaller than the minimum and larger than the maximum values
specified.
Banner Engineering Corp.
Minneapolis, MN USA
167
PresencePLUS Software Tools
2/2010
The minimum and maximum object width affects both objects and spaces between objects. Minimum object width
can filter out objects and spaces.
Object Tool Results
The Results field returns the following:
• The position of the object midpoint. The origin (0,0) is the upper-left corner of the screen.
• A Select Object Number field for selecting an object to analyze.
• Total number of Bright, Dark, or All objects (depending on the Bright/Dark option in effect.
• Distance between the edges of the current object.
Graph Tab
When Edge Strength is selected, the Graph tab appears on the tool window. The graph for the Input tab overlays both
the edge strength graph and the edge profile. In the Graph tab, the edge profile graph and the edge strength graph are
separated for easier viewing.
The top graph, Edge Profile, represents the absolute gray scale level across the Edge tool.
The bottom graph, Edge Strength, represents the change in gray scale along the Edge tool.
Edge Strength detects an edge when the rate of change (solid red line on the screen) crosses the selected intensity
change amount (dashed green lines on the screen).
A bright-to-dark transition has a negative edge strength value, and a dark-to-bright transition has a positive edge strength
value. When the Edge Strength level is adjusted, both the negative and positive lines will adjust together.
Graph Tab
168
Minneapolis, MN USA
Banner Engineering Corp.
2/2010
PresencePLUS Software Tools
Filters
Banner Engineering Corp.
Minneapolis, MN USA
169
PresencePLUS Software Tools
2/2010
Field
Description
ROI Width
Increases in increments of 4 pixels (for example, 1, 5, 9, 13, ...) up to the total
FOV size. Some things to note:
• Narrow ROIs execute faster but could miss the edge.
• Wide ROIs are more consistent but don't execute as fast.
• The ROI must be 13 pixels or wider to calculate the rotation of a part.
Smoothing
Runs a rolling average along the ROI length. It filters out sharp changes in the
edge profile.
Note: A high filter number may miss the edge of a narrow line.
Min Width
Filters out small spike-of-intensity changes, and narrow dark or bright bands. It
determines the distance (in pixels) before and after an edge that must be free from
additional transitions or the end of the ROI before the edge is recognized.
Note: A high filter number may miss the edge of a narrow line.
Sample Rate
Determines the sub-pixel resolution, which increases the resolution of the tool,
and increases the inspection time.
1.
2.
3.
4.
1-pixel resolution
1/2-pixel resolution
1/3-pixel resolution
1/4-pixel resolution
Object Width
Object Width filters out objects and spaces that are smaller than the minimum and larger than the maximum values
specified.
The minimum and maximum object width affects both objects and spaces between objects. Minimum object width
can filter out objects and spaces.
Object Tool Results
The Results field returns the following:
• The position of the object midpoint. The origin (0,0) is the upper-left corner of the screen.
• A Select Object Number field for selecting an object to analyze.
• Total number of Bright, Dark, or All objects (depending on the Bright/Dark option in effect.
• Distance between the edges of the current object.
170
Minneapolis, MN USA
Banner Engineering Corp.
2/2010
PresencePLUS Software Tools
7.3.8 Pattern Count Tool
The Pattern Count tool locates a pattern within a reference image, using and uses that pattern as a reference pattern
to locate the same pattern in new images. A reference pattern is stored in memory. The tool searches for patterns that
are very similar to the reference pattern. All patterns that match the reference pattern are counted and the center of the
first pattern found is determined. The location of the first pattern found is returned to the user. This information can
be used to measure distances and angles. The reference pattern is remembered by the sensor in full gray scale detail,
so the tool can find patterns in various light levels.
Usage
• Verify fabric patterns
• Verify date/lot codes
• Inspect electronic component assembly
Fields
The following are fields on the Pattern Count tool Input tab:
• Enabling Remote Teach on page 303
• Rotation Enabled on page 173
• Minimum Acceptance Level on page 173
• Patterns on page 173
• Selected Pattern on page 174
• Results on page 174
Supported Platforms
ProII Color ProII/ProII OMNI
1.3
Color
OMNI/OMNI AREA/AREA1.3 EDGE/EDGE GEO/GEO
1.3
1.3
1.3
BCR/BCR
1.3
Yes
Yes
No
Yes
Yes
No
No
No
Pattern Count Input Tab
Banner Engineering Corp.
Minneapolis, MN USA
171
PresencePLUS Software Tools
2/2010
Adding a Pattern Count Tool
To add a tool to an inspection:
1. Click the button of the tool to be added to the inspection.
2. If desired, rename the tool.
3. Draw an ROI.
Field/Button
Description
Use this field to rename the tool. The default is
tool_name_1, tool_name_2, and so on, where the default
tool_name depends on the tool being created (for example,
locate, edge or the like). The name can have only
alphanumeric characters and underscores with no spaces.
Click this button to add an ROI to an image.
Click this button to add a mask to an image
172
Minneapolis, MN USA
Banner Engineering Corp.
2/2010
Field/Button
PresencePLUS Software Tools
Description
Click this button to remove an ROI from an image.
Use this field to rotate the ROI. You can manually key in
a rotation angle, or you can use the up or down arrow keys
to rotate the ROI.
Enabling Remote Teach
The Remote Teach function is a method of remotely updating inspection parameters in Run mode. Vision tools and
Test tools can be selected to be taught or not taught. To remotely teach an inspection, the Remote Teach function must
be enabled on each tool to be taught.
Rotation Enabled
The Pattern Find tool has a +/- 10 degree rotation ability. All subsequent ROIs will rotate relative to the edge found.
During setup, the tool calculates the angle of the pattern found. During inspection, the new angle is compared to the
original angle. If there is any rotational change between the new angle and the original angle, all subsequent ROIs will
rotate that amount.
Minimum Acceptance Level
This adjustment sets the acceptance level for pattern matches.
• Decrease the Minimum Acceptance Level to allow more variations in matching patterns.
• Increase the Minimum Acceptance Level to filter out patterns that contain small defects.
Percent match is a value between 20% and 100% that indicates the quality of the match (100% is a perfect match; 20%
is a slight match). The percent match can be used to detect large defects.
Note: Banner does not recommend setting the Minimum Acceptance Level below 70%.
Patterns
In Maximum Number of Patterns to find field, manually key in a value or use the up or down arrow keys to specify
the number of patterns to find.
Banner Engineering Corp.
Minneapolis, MN USA
173
PresencePLUS Software Tools
2/2010
Selected Pattern
The Selected Pattern field indicates whether the captured image is fine as it is or if there are potential issues. For
example, in the display below, the image is marinal for both translational content and for rotational content.
Results
Results indicate the following:
• Number of patterns found: The total number of patterns above the minimum acceptance level and below the
maximum number of patterns.
• Location of the first match: The position of the pattern's center. The origin (0,0) is the upper-left corner of the
screen.
7.4 Vision Color Tools
Color tools include Average Color, Color Blob, and Color Match, where color is a discriminator between a good and
bad condition.
7.4.1 Average Color Tool
The Average Color Tool can be used to visually inspect a part by analyzing all colors in a Region of Interest (ROI)
and reducing them to a single set of color values, the average of the combined colors in the ROI.
Usage
The Average Color tool is used to analyze parts with subtle color variations that cannot accurately be detected by gray
scale sensors. This is especially true when the parts are of similar colors.
In combination with a Test Tool, Average Color can be used to sort and verify parts by the presence or absence of a
specified color.
With the use of a Communication Tool, Average Color can be used to measure colors and report what is seen.
• Differentiating yellow as opposed to gray caps on bottles of soda.
• Sorting between dark blue and light blue toys on an assembly line.
• Matching burgundy trim pieces in automotive assembly.
174
Minneapolis, MN USA
Banner Engineering Corp.
2/2010
PresencePLUS Software Tools
Fields
The following are fields on the Average Color tool Input tab:
• Options on page 176
• Average Color Tool Results - HSI on page 176
• Average Color Tool Results - RGB Average on page 177
Supported Platforms
ProII Color ProII/ProII OMNI
1.3
Color
OMNI/OMNI AREA/AREA1.3 EDGE/EDGE GEO/GEO
1.3
1.3
1.3
BCR/BCR
1.3
Yes
No
No
No
Yes
No
No
No
Average Color Input Tab
Adding an Color Tool
To add an area tool to an inspection:
1. Click the button of the tool to be added to the inspection.
2. If desired, rename the tool.
Banner Engineering Corp.
Minneapolis, MN USA
175
PresencePLUS Software Tools
2/2010
3. Draw an ROI.
Control
Description
Use this field to rename the tool. The default is
tool_name_1, tool_name_2, and so on, where the default
tool_name depends on the tool being created (for example,
locate, edge or the like). The name can have only
alphanumeric characters and underscores with no spaces.
Click this button to add an ROI to an image.
Click this button to add a mask to an image. A mask
excludes an area inside the ROI.
Click this button to remove an ROI from an image.
Use this field to rotate the ROI. You can manually key in
a rotation angle, or you can use the up or down arrow keys
to rotate the ROI.
Options
The Options group lets you set the Color Space (HSI or RGB) and the intensity range.
Options
Description
Color Space
Use the drop-down to choose how to visualize and output the color values by either
HSI or RGB.
Reject pixels brighter than
You can set intensity tolerances between 0 and 255. Pixels in the ROI that are
brighter than the intensity value set here will not be included in the measurement.
Reject pixels darker than
You can set intensity tolerances between 0 and 255. Pixels in the ROI that are
darker than the intensity value set here will not be included in the measurement.
Average Color Tool Results - HSI
Hue, Saturation, and Intensity (HSI) is a representation of color space that is closer to human perception of color
dynamics.
The results are shown as an average for each value: hue, saturation, and intensity. In addition, the standard deviation
is displayed so that you can test the variance of color. The greater the range of colors of the pixels within the ROI, the
higher the standard deviation will be. If all pixels are uniformly the same color, the standard deviation will be zero.
176
Minneapolis, MN USA
Banner Engineering Corp.
2/2010
PresencePLUS Software Tools
The table below describes the results and shows the color map. A color map is a visual legend showing the hue,
saturation, and intensity:
• Hue and Saturation are represented in the circular color map, while Intensity is shown as a gradient bar.
• The crosshairs indicate the average hue and saturation, and the line on the intensity bar shows the average intensity.
• The irregular outline in the color map includes all the individual colors represented in the ROI from which the average
color is derived.
Value
Description
HSI Color Map
Hue
A representation of average hue as an angle
in degrees around a circle, which will always
be between 0 and 359°.
Saturation
A representation of average saturation as a
distance from the center of the circle where
0 is the center of the circle (and could include
the colors black, white and gray) and 100
would be on the very edge of the color map
circle. With a higher saturation number, the
color represented is more vivid.
Intensity
The average brightness of a color, represented
in a number from 0 (black) to 255 (white).
Average Color Tool Results - RGB Average
Red : The average of the red color component, represented as a number from 0 to 255. Fully saturated red is a [255,
0, 0].
Banner Engineering Corp.
Minneapolis, MN USA
177
PresencePLUS Software Tools
2/2010
Green : The average of the green color component, represented as a number from 0 to 255. Fully saturated green is a
[0, 255, 0].
Blue : The average of the blue color component, represented as a number from 0 to 255. Fully saturated blue is a [0,
0, 255].
Intensity : The average brightness of a color, represented in a number from 0 (black) to 255 (white).
7.4.2 Color Blob Tool
One way to conduct a color inspection is to group adjacent pixels within the same color range together to form a Blob,
or Binary Large OBject .
The Color Blob Tool is used to separate same color Blobs from the larger scene and to analyze parts with color variations
that cannot accurately be detected by gray scale sensors.
The Color Blob tool can be used to detect parts with either different or similar colors. In addition, the Color Blob tool
can give area, shape and spatial content.
Usage
• Is the red trim in the correct position?
• Is that the fuse, and is it dark or light blue?
• Is the light blue fuse located next to the dark blue fuse?
Fields
The following are fields on the Color Blob tool Input tab:
• Color Probes on page 180
• Options on page 181
• Color Blob Tool Color Map Visualization on page 191
Supported Platforms
ProII Color ProII/ProII OMNI
1.3
Color
OMNI/OMNI AREA/AREA1.3 EDGE/EDGE GEO/GEO
1.3
1.3
1.3
BCR/BCR
1.3
Yes
No
No
No
Yes
No
No
No
Color Blob Input Tab
178
Minneapolis, MN USA
Banner Engineering Corp.
2/2010
PresencePLUS Software Tools
Adding an Color Tool
To add an area tool to an inspection:
1. Click the button of the tool to be added to the inspection.
2. If desired, rename the tool.
3. Draw an ROI.
Control
Description
Use this field to rename the tool. The default is
tool_name_1, tool_name_2, and so on, where the default
tool_name depends on the tool being created (for example,
locate, edge or the like). The name can have only
alphanumeric characters and underscores with no spaces.
Click this button to add an ROI to an image.
Click this button to add a mask to an image. A mask
excludes an area inside the ROI.
Banner Engineering Corp.
Minneapolis, MN USA
179
PresencePLUS Software Tools
Control
2/2010
Description
Click this button to remove an ROI from an image.
Use this field to rotate the ROI. You can manually key in
a rotation angle, or you can use the up or down arrow keys
to rotate the ROI.
Color Probes
In the Color Blob tool, you need to define the bright Blob/dark Blob threshold. The threshold for the Color Blob tool
is not a specific gray scale value, but instead bright blobs are those that match the colors you de
fine using Color Probes,
and dark blobs are those colors that do not match.
Button
Description
Used to identify a color value range that will be used to define a Blob. The probe identifies the
color values within the selected area and groups together all adjacent pixels with that range of
values.
Used to select and remove a color probe.
Note: The color probe may be created outside the ROI, but a BLOB of that color will only be detected within
the ROI.
180
Minneapolis, MN USA
Banner Engineering Corp.
2/2010
PresencePLUS Software Tools
Note: The above has a single probe. Use more than one probe when the range of color to include in the Blob
exceeds the range that a single probe can detect. Below additional probes have been added.
Options
Min/Max Size
Allows the user to determine what size object will be considered a Blob, thereby filtering other content as noise
Banner Engineering Corp.
Minneapolis, MN USA
181
PresencePLUS Software Tools
2/2010
Note: Use Grayscale Blob when trying to distinguish white, black and shades of gray. Using Color Blob for
grayscale analysis is not as effective as using Grayscale Blob.
Color Blob Tool Color Map Visualization
Hue, Saturation, and Intensity is a representation of color space that is closer to human perception of color dynamics.
Hue and Saturation are represented in the circular color map, while Intensity is shown as a gradient bar.
The white outline in the color map includes the range of colors that would define a Blob, while the bars on the gradient
bar includes the range of intensities.
Color Blob Filter/Sort Tab
Note: The Color Blob Filter/Sort tab starts out disabled, and you need to enable it in theTools Configuration tab
of the System dialog.
182
Minneapolis, MN USA
Banner Engineering Corp.
2/2010
PresencePLUS Software Tools
Blob Sort
The Sort drop-down list allows the user to select a sort method to determine which Blob the sensor labels as "Blob
#1." By default, Blobs are numbered according to scan order; that is, the sensor numbers Blobs as it encounters them
while scanning the FOV from top-to-bottom and then left-to-right. Select one of the computed statistics choices from
the drop-down list to use for the sort:
• No sorting
• Position
• Area on page 187
• Perimeter on page 188
• Compactness on page 189
• Major Axis Length, Minor Axis Length, and Major Axis Angle on page 189
• Eccentricity on page 189
• Min Radius and Min Radius Position on page 191
• Max Radius and Max Radius Position on page 191
Banner Engineering Corp.
Minneapolis, MN USA
183
PresencePLUS Software Tools
2/2010
Blob Sort Order
Once you select a Sort method, you need to define a Sort Order:
• If Position is selected for the Sort method, then Blob order is based on the x,y coordinates of the centroids and the
options are—
• Left most
• Top most
• Right most
• Bottom most
• For any of the other options, Blob order is based on Increasing or Decreasing value of the parameter selected. For
example, if Perimeter and Increasing is selected, the smallest perimeter Blob will be Blob #1.
Blob Filter
The Blob filter allows you to more accurately select a specific Blob to locate and to use for positioning other Vision
tools. Filter modifies the Blob count based on Computed Statistics criteria so that, for example, only circular Blobs
(compactness) or symmetric Blobs (eccentricity) are included in the Blob count.
When you click the Preset button, the sensor uses the selected Blob to preset the filter values so that only the selected
Blob will subsequently be identified by the sensor. This reduces the time it would take to manually enter values. When
the sensor is in Run mode, you should use the runtime filter results to fine-tune these settings.
184
Minneapolis, MN USA
Banner Engineering Corp.
2/2010
PresencePLUS Software Tools
Color Blob Tool Advanced Tab
Fields
The following are fields on the Color Blob tool Advanced tab:
• Advanced Options on page 186
• Range on page 187
• Color Blob Advanced Tab Results on page 187
Below is the Color Blob tool Advanced tab .
Banner Engineering Corp.
Minneapolis, MN USA
185
PresencePLUS Software Tools
2/2010
Advanced Options
Below are the Color Blob tool Advanced tab Options
Option
Description
Discard Boundary Blobs
Use to determine whether Blobs found on the perimeter of the ROI should be
included in the results.
186
Minneapolis, MN USA
Banner Engineering Corp.
2/2010
PresencePLUS Software Tools
Option
Description
Compute Statistics
Allows user to calculate and display advanced results.
Fill Holes
Allows user to ignore (byfilling) small imperfections, or non-Blobs, within a larger
Blob. Largest Hole to Fill allows users to specify the size of the imperfection so
that valid non-Blobs are excluded.
Enable Remote Teach
Allows user to relearn the color identified by the color probe while the sensor is
running.
Range
Enter a value or use the arrow keys to specify a tolerance for Hue and/or Saturation. As you adjust the tolerance, it is
shown in the Color Map.
The brackets on the intensity bar will widen or narrow as you adjust the intensity tolerance up or down.
There are a couple of ways to use the Invert Colors option:
• Check the box while setting up a Color Blob inspection that involves a busy background in order to get a "negative
effect" to see more easily if there are other color Blobs in the background that are the same as the one you specified
with the color probe.
• You might check this box if there is a single dominant color in the item to be inspected but several different colors
you that are important for the inspection. Rather than creating a probe for each of the minor colors, use the probe to
specify the dominant color, then click Invert Colors to feature the other colors for the inspection.
Color Blob Advanced Tab Results
Area
The area (A) is just a count of the total number of pixels belonging to the blob.
Banner Engineering Corp.
Minneapolis, MN USA
187
PresencePLUS Software Tools
2/2010
Centroid
The centroid (xc, yc) is the point at the center of mass of the blob. For simple blobs like solid circles, ellipses, or
rectangles, this is just the center of the shape. For more complicated shapes it is helpful to imagine a piece of cardboard
cut out in the shape of the blob. The centroid is the point where you could balance the cardboard on the tip of a pencil.
For complicated shapes-especially shapes with unfilled holes-the centroid might lie outside the shape.
The x coordinate of the centroid is calculated by adding up the x coordinates of each pixel in the blob and dividing by
the area. The y coordinate is similar:
Perimeter
The perimeter (P) gives an approximate measurement of the length of the circumference of the blob. Because blobs
are built from individual pixels, it is most practical to estimate the perimeter by counting the contrib
utions of individual
pixels on the blob's boundary. The following table describes the exact values that are added to the perimeter for each
possible pixel configuration. In each example, the description refers to the center pixel in the corresponding pictures.
A pixel with no neighbors that belong to the same blob contributes
(3.14) linear pixels to the perimeter of the blob. This can only happen
in a blob that has an area of one. Since such small blobs are usually
ignored, this circumstance is rare.
A pixel with one neighbor that belongs to the same blob contributes
2.571 linear pixels to the perimeter of the blob.
A pixel with two neighbors that belong to the same blob, forming a
straight line, contributes exactly 2 linear pixels to the perimeter of the
blob.
A pixel with two neighbors that belong to the same blob, forming a
corner, contributes 1.414 linear pixels to the perimeter of the blob.
A pixel with three neighbors that belong to the same blob contributes
exactly 1 linear pixel to the perimeter of the blob. A pixel with three
neighbors that belong to the same blob contributes exactly 1 linear
pixel to the perimeter of the blob.
A pixel with four neighbors that belong to the same blob contributes
nothing to the perimeter of the blob.
188
Minneapolis, MN USA
Banner Engineering Corp.
2/2010
PresencePLUS Software Tools
This method of counting tends to slightly overestimate the "true" perimeter. For example, a circle with a radius of 100
pixels will have a computed perimeter of approximately 660 pixels, compared with the expected value of 628 pixels.
If the camera is configured to convert pixel distances to other units, (e.g. inches), the perimeter will be given in those
units. If the blob contains holes that have not been filled, the length of the perimeter will include the points on the
perimeters of these holes.
Compactness
The compactness is high for blobs that are nearly circular and low for blobs that are elongated or complicated.
compactness =
Where A is the area and P is the perimeter of the Blob in question. An idealized circle would have a compactness of
100, but because the perimeter is approximated (see above), the highest realistic value for most blobs is roughly 90.
Very small blobs with just a handful of pixels may reach or even exceed the theoretical maximum of 100, again because
of the approximations in the perimeter calculation.
Eccentricity
The eccentricity of a blob is defined as the length of the major axis divided by the length of the minor axis. For circular
regions and other regions with radial symmetry (like a square), the value will be very close to 1. For elongated regions,
the value will grow, possibly becoming quite large.
Major Axis Length, Minor Axis Length, and Major Axis Angle
To understand Major Axis Length, Minor Axis Length, and Major Axis Angle, it is important to note that these are
not measurements of the Blob itself because the Blob may be an irregular shape. Rather, these measurements are
determined by a well-defined shape, a "best fit ellipse" as shown below.
These three results combine to give information about the elongation and orientation of a blob . The equations used
to compute these statistics are fairly complicated, but the results usually have an intuitively useful meaning, described
below. The first step in computing these results is to compute the M2,0, M0,2 and M1,1 statistical moments:
Banner Engineering Corp.
Minneapolis, MN USA
189
PresencePLUS Software Tools
2/2010
where A is the area, (xc, yc) are the coordinates of the centroid and (xi, yi) are the coordinates of pixel i. These values
represent the variance with respect to x, the variance with respect to y, and the covariance, respectively. The final
results can be calculated as follows.
The table below gives a more practical perspective on how to interpret these results. If the camera is configured to
convert pixels to other units, the major and minor axis lengths will be given in those units. The major axis angle is
always given in degrees.
Blob Shape
Meaning of Major Axis
Length
Meaning of Minor Axis
Length
Meaning of Major Axis
angle
circular, no holes
diameter of the circle
equal to the major axis
length
unstable
elliptical, no holes
length of the ellipse
width of the ellipse
orientation of the ellipse
square, no holes
diameter of a circle that best equal to the major axis
approximates the square
length
rectangular, no holes
length of an ellipse that best width of an ellipse that best orientation of the rectangle
approximates the rectangle approximates the rectangle
unstable
complicated shape, no holes length of an ellipse that best width of an ellipse that best orientation of the
approximates the shape
approximates the shape
shape-unstable if length and
with are nearly equal
any shape with holes
190
results vary depending on
exact shape-experiment on
your particular shape
results vary depending on
exact shape-experiment on
your particular shape
Minneapolis, MN USA
results vary depending on
exact shape-experiment on
your particular shape
Banner Engineering Corp.
2/2010
PresencePLUS Software Tools
Min Radius and Min Radius Position
The minimum radius of a blob is the distance from the centroid of the blob to the closest pix
el on that blob's perimeter.
The minimum radius position gives the pixel coordinates of that closest perimeter point. If the blob contains unfilled
holes, the minimum radius position may be on the perimeter of a hole. If the camera is configured to convert pixels to
other units, the minimum radius (but not the minimum radius position) will be given in those units.
Max Radius and Max Radius Position
These results are equivalent to those for the minimum radius, but they refer to the pixel on the perimeter of the blob
that is farthest from the centroid .
Color Blob Tool Color Map Visualization
Hue, Saturation, and Intensity is a representation of color space that is closer to human perception of color dynamics.
Hue and Saturation are represented in the circular color map, while Intensity is shown as a gradient bar.
The white outline in the color map includes the range of colors that would define a Blob, while the bars on the gradient
bar includes the range of intensities.
7.4.3 Color Match Tool
The Color Match tool behaves somewhat like the Average Grayscale tool; you simply draw an ROI over the color
you wish to check for in future inspections.
The tool takes two inputs--Color Match Percent Threshold and Itensity Match Range-and will automatically generate
a Color Map of Hue, Saturation, and Intensity.
Hue, Saturation, and Intensity is a representation of color space that is closer to human perception of color dynamics.
Hue and Saturation are represented in the circular color map, while Intensity is shown as a gradient bar.
Banner Engineering Corp.
Minneapolis, MN USA
191
PresencePLUS Software Tools
2/2010
The white outline in the color map includes the range of colors.while the bars on the gradient bar includes the range
of intensities.
Usage
• Verify healthy fruit color and ripeness
• Verify stain color on wood
• Verify product color in packaging applications
Fields
The following are fields on the Color Match tool Input tab:
• Color Match Percent Threshold on page 193
• Intensity Match Range on page 193
• Enabling Remote Teach on page 303
• Color Map Visualization on page 194
Supported Platforms
ProII Color ProII/ProII OMNI
1.3
Color
OMNI/OMNI AREA/AREA1.3 EDGE/EDGE GEO/GEO
1.3
1.3
1.3
BCR/BCR
1.3
Yes
No
No
No
Yes
No
No
No
Adding an Color Tool
To add an area tool to an inspection:
1. Click the button of the tool to be added to the inspection.
2. If desired, rename the tool.
3. Draw an ROI.
Control
Description
Use this field to rename the tool. The default is
tool_name_1, tool_name_2, and so on, where the default
tool_name depends on the tool being created (for example,
locate, edge or the like). The name can have only
alphanumeric characters and underscores with no spaces.
Click this button to add an ROI to an image.
192
Minneapolis, MN USA
Banner Engineering Corp.
2/2010
Control
PresencePLUS Software Tools
Description
Click this button to add a mask to an image. A mask
excludes an area inside the ROI.
Click this button to remove an ROI from an image.
Use this field to rotate the ROI. You can manually key in
a rotation angle, or you can use the up or down arrow keys
to rotate the ROI.
Color Match Percent Threshold
The first of two settable parameters for the Color Match tool, the Color Match PercentThreshold, controls the variation
in the colors to be matched in the future.
Increasing this number will reduce the range of colors present on the Acceptable Colors map. When the Color Match
Percent Threshold is set to 100, the map of Acceptable Colors will include only one hue. If this threshold is reduced
to 0 the map of Acceptable Colors will start to look more like a rainbow, including a large number of hues. A typical
setting for this threshold is around 90.
Intensity Match Range
As the Color Match Percent Threshold defines the specific hues which can be considered good, the Intensity Match
Range defines the grayscale brightness level necessary to constitute a match. This value ranges from 0 to 255.
As the Tolerance value is changed, the acceptable Min and Max limits on either side of the Reference are calculated.
When the number is set to 255, a full range of color shades are displayed on the map of Acceptable Colors; starting
with black on the left and continuing to the fully saturated color on the right. When this tolerance is set to 0, only a
single shade of each color is acceptable; that is, no change in the amount of black present in the color is allowed. Or,
to say it another way, no changing the intensity of illumination for a given color target is allowed.
Enabling Remote Teach
The Remote Teach function is a method of remotely updating inspection parameters in Run mode. Vision tools and
Test tools can be selected to be taught or not taught. To remotely teach an inspection, the Remote Teach function must
be enabled on each tool to be taught.
Banner Engineering Corp.
Minneapolis, MN USA
193
PresencePLUS Software Tools
2/2010
Color Map Visualization
Hue, Saturation, and Intensity is a representation of color space that is closer to human perception of color dynamics.
Hue and Saturation are represented in the circular color map, while Intensity is shown as a gradient bar.
The white outline in the color map includes the range of colors.while the bars on the gradient bar includes the range
of intensities.
7.5 Premium Vision Tools
Premium Vision tools are advanced tools for specialty applications. These include Barcode, Bead, Optical Character
Recognition (OCR) and Optical Character Verification (OCV) tools.
7.5.1 Barcode Tool
The Barcode tool is more of an appliance than a generic vision tool. The tool is easy to use: push one button and it
just works. In addition to decoding the data present in the barcode symbol, the Barcode tool also grades the symbol
according to ISO-specified quality parameters. These grades are meant to test whether the physical barcode symbol
was printed correctly. Both linear codes and the 2D data matrix codes are graded-- each according to a different ISO
standard. In the linear case, the spec is ISO 15416. For the Data Matrix, the relevant document is ISO 15415.
Fields
The following are fields on the Barcode tool Input tab:
• Barcode Type on page 195
• Results on page 196
Supported Platforms
ProII Color ProII/ProII OMNI
1.3
Color
OMNI/OMNI AREA/AREA1.3 EDGE/EDGE GEO/GEO
1.3
1.3
1.3
BCR/BCR
1.3
Yes
Yes
Yes
Yes
Yes
No
No
No
Barcode Input Tab
194
Minneapolis, MN USA
Banner Engineering Corp.
2/2010
PresencePLUS Software Tools
Barcode Type
Select one of the following for the Barcode Type:
• Any -- Enables the Barcode tool to read any supported barcode type
Banner Engineering Corp.
Minneapolis, MN USA
195
PresencePLUS Software Tools
2/2010
• DataMatrix
• DataMatrix (Dot Peened)
• Linear Code 128
• Linear Code 39
• Linear Code CODABAR
• Linear Code 2 of 5 Interleaved
• Linear Code EAN 13
• Linear Code EAN8
• Linear Code UPCE
• Linear Code POSTNET
• Linear Code IMB
• PDF-417
• Linear Code PHARMACODE
• MULTIPLE -- When you select this option, you can select multiple barcode types you want the sensor to read
Click on the Edit Selections button to modify the list of available barcode types.
Results
196
Minneapolis, MN USA
Banner Engineering Corp.
2/2010
PresencePLUS Software Tools
The Results field provides the number of barcodes found, barcode type, data read, and quality parameters.
Note: When the Barcode tool finds multiple barcodes, the Select Barcode field allows you to select each barcode
individually. The multiple barcodes are arranged in order (with respect to image origin) from left to right, top to
bottom, according to the location of the lower-left corner of the barcode.
7.5.2 Barcode Tool Advanced Tab
Fields
The following are fields on the Barcode tool Advanced tab:
• All Barcodes Options on page 198
• Datamatrix Only Options on page 199
• Linear Only Options on page 200
Banner Engineering Corp.
Minneapolis, MN USA
197
PresencePLUS Software Tools
2/2010
All Barcodes Options
198
Minneapolis, MN USA
Banner Engineering Corp.
2/2010
PresencePLUS Software Tools
Color Scheme
The Color Scheme determines what color scheme of barcode the sensor will reconize. Of the three Color Scheme
options, the default is Either.
Color Scheme Option
Description
Black on White
The sensor will recognize barcodes that are black (or dark)
marked on a white (or light) background.
White on Black
The sensor will recognize barcodes that are white (or light)
marked on a black (or dark) background.
Either
The sensor will recognize either barcodes that are black
(or dark) marked on a white (or light) background or white
(or light) marked on a black (or dark) background.
View Scheme
The View Scheme option determines which view of barcode the sensor will recognize. The default is Either.
View Scheme Option
Description
Normal
The sensor will recognize barcodes that are presented in
the mirrored view.
Mirrored
The sensor will recognize barcodes that are presented in
the mirrored view.
Either
The sensor will recognize barcodes that are presented in
either the normal or mirrored view.
Maximum to Find
Use the arrow keys or enter the maximum number of barcodes to find.
Enable Grades
Check this box to get barcode grade information. Note that, while this is intended to provide useful information about
a specific barcode, it is not intended to be used as a verifier.
Datamatrix Only Options
The Decoder Mode determines which decode algorithm to employ and how imperfections in barcode images are
handled. Of the two options, Robust is preferred and is the default.
Banner Engineering Corp.
Minneapolis, MN USA
199
PresencePLUS Software Tools
2/2010
Decoder Mode Option
Description
Robust
When you select Robust, the sensor employs an algorithm
that performs routines to correct for imperfections of the
barcode image. This mode typically has the higher read
rate.
Fast
When you select Fast, the sensor employs an algorithm
that is "tailored" for speed. The algorithm does NOT
correct for barcode image imperfections. The Fast setting
has the best results on high-contrast images that contain
high-quality DataMatrix barcodes. Fast should be used
only when demanded by the desired read rates. If speed is
not critical, select Robust for better results.
Linear Only Options
Check Sum Verify (Code 39 and Interleaved 2 of 5)
Check the box to use a checksum to verify the integrity of a Code 39 or Code 2 of 5 Interleaved linear barcodes.
Relaxed Quietzone (Linear Only)
Check the box to provide a greater tolerance with respect to the quiet zone required before and after the barcode.
Direction (Pharmacode Only)
From the drop-down list, select one of the following:
—Left To Right
—Right To Left
—Top To Bottom
—Bottom To Top
7.5.3 Barcodes Read by Banner BCR
Barcode
Codabar (NW-7
in Japan, USD4,
2 of 7)
200
Date
Format Industries
Notes
1972
linear
16-characters,
self-checking,
variable length,
discrete,
start/stop
characters.
blood banks, cotton
industry, libraries, photo
labs, air parcel express,
information processing
industry
Minneapolis, MN USA
Example
Banner Engineering Corp.
2/2010
Barcode
(Code 25, ITF-14,
ITF, “I” 2 of 5,
I25)
PresencePLUS Software Tools
Date
Format Industries
1972
linear
1975
linear
1976
linear
NOT included: 2
of 5 Industrial OR
2 of 5 Matrix
Code 39 (USD-3,
3 of
9,LOGMARS)
includes: Code 39
extended
EAN-13 (UPC-A)
Notes
Distribution industry,
warehousing,
product/container
identification, general
industrial, automotive Can
be printed directly on
corrugated cartons
10 characters
(numeric only),
optional
check-sum,
variable length,
continuous,
start/stop
characters.
LOGMARS (Department of
Defense standard), HIBCC
(health industry standard),
AIAG (automotive industry
standard), general industry
Most common
non-UPC (i.e.
non-retail) code.
43 characters,
optional
check-sum,
variable length,
discrete,
start/stop
characters.
retail products worldwide
(point-of-sale)
Example
10 characters
(numeric only),
check-sum,
continuous. Like
an international
UPC symbol,
EAN-13 includes
the UPC-A
standard, fixed
length (10 data
digits plus 2 or
3-digit country
code and 1 check
digit).
The only
difference
between UPC-A
and EAN-13 is
UPC-A has a
single digit
country (or
product type)
code.
UPC-E
~1976
Banner Engineering Corp.
linear
small retail products in USA 6 characters
and Canada (point-of-sale) (numeric only),
check sum,
continuous.
Commonly called
a
“zerosuppressed”
version of the
standard UPC-A
Minneapolis, MN USA
201
PresencePLUS Software Tools
Barcode
Date
2/2010
Format Industries
Notes
Example
symbol, this
barcode is used
on small items or
crowded labels
where space is at
a
premium.
EAN-8
Code 128
(GS1-128,
EAN-128,
UCC-128,
UCC/EAN-128)
includes: Code
128/EAN 128
subsets A, B, & C
Postnet includes:
Delivery Point
Barcode(DPBC)
202
1976
linear
1981
linear
1980
linear
retail products worldwide
(point-of-sale)
10 characters
(numeric only),
check-sum,
continuous. A
shortened version
of EAN-13.
Fixed length (5
data digits plus 2
flag digits and 1
check digit)
Retail distribution, carton Most compact
tracking, inventory control, linear code. All
general industrial.
128 printable
ASCII characters,
check-sum,
variable length,
continuous,
start/stop
characters.
Mail sorting for US Postal
Service
10 characters
(numeric only),
check-sum,
discrete. Three
main data strings
are stored in
Postnet codes: a
5 digit ZIP code
(with check
digit), a 9 digit
ZIP+4 code (with
check digit), and
an 11 digit ZIP+4
plus delivery
code (with check
digit).
Minneapolis, MN USA
Banner Engineering Corp.
2/2010
Barcode
Data Matrix
(ECC 200)
PresencePLUS Software Tools
Date
Format Industries
1990
2D
PDF417
IMB
2006
Pharmacode
Banner Engineering Corp.
Notes
Integrated circuit, printed
circuit boards and
automotive, aerospace,
electronics,semiconductor
and medical device
industries.
Stores up to 3116
numbers or 2335
ASCII characters.
Banner supports
only the latest
version of this
standard,
ECC-200. (the
older subset,
including the
ECC-000 to
ECC-140
standards, will
not be
supported). This
is the target
market for the
Banner BCR.
2D
Transport, identification
cards, and inventory
management.
Consists of 3 to
90 rows, each of
which is like a
small linear bar
code.
linear
Mail sorting for US Postal
Service
The Intelligent
Mail barcode
(IMB) replaces
the POSTNET
and PLANET
barcodes. It is a
65-bar code for
use on mail in the
United States
linear
Parmaceutical Binary Code
and is used for packing
control in the
pharmaceutical industry.
Pharmacode can
represent only a
single integer
from 3 to
131070.
Minneapolis, MN USA
Example
203
PresencePLUS Software Tools
2/2010
7.5.4 Bead Tool
The Bead tool is used to inspect parts on which an application of adhesives or sealant material has been placed. In an
industrial setting, this "bead" of material is commonly applied in a strip on a known path. The Bead tool can look at
this pre-defined path and verify whether the adhesive or sealant has been correctly applied.
For the purposes of this tool, a bead is any long, narrow strip of approximate consistent width and approximately
consistent color. The bead must have sufficient contrast with its background so that a simple grayscale thresholding
scheme, like that used in the Blob Tool, can separate the two. Background clutter and optical noise (i.e. shiny spots,
holes in the bead) are permitted, but their presence may degrade the robustness of a bead inspection.
The Bead Tool also assumes that the bead material has been applied by a mechanized system and thus is quite consistent
in location and direction. The tool does not attempt to detect, follow, or account for variations in bead location.
Usage
• Check for uniformity of a bead of adhesive.
• Check for the uniformity of a gap.
Fields
The following are fields on the Bead tool Input tab:
• Drawing a Connected Line ROI on page 205
• Bead Type on page 207
• Threshold on page 207
• Filters on page 209
• Results on page 209
Supported Platforms
ProII Color ProII/ProII OMNI
1.3
Color
OMNI/OMNI AREA/AREA1.3 EDGE/EDGE GEO/GEO
1.3
1.3
1.3
BCR/BCR
1.3
Yes
Yes
No
Yes
Yes
No
No
No
Bead Tool Input Tab
204
Minneapolis, MN USA
Banner Engineering Corp.
2/2010
PresencePLUS Software Tools
Drawing a Connected Line ROI
To begin defining the ROI:
1. Click on the Draw ROI button.
2. Click on the bead to mark a starting point. A small circle will mark this start point. As you move the mouse away
from the start point, the software draws a dotted line following the mouse pointer.
3. Click on any part of the field of view, and a second point is drawn with a line connecting the two dots to define a
line segment.
4. Add more segments as necessary. (Depending on the bends of the bead, you need more se
gments for better resolution.)
Note that the dotted line is only displayed while the mouse pointer is in the FOV.
5. You can end creating the ROI by--
Banner Engineering Corp.
Minneapolis, MN USA
205
PresencePLUS Software Tools
2/2010
• clicking on the Done button.
• pressing the ESC button on the keyboard.
6. When you are done, the ROI will look something like what is shown below.
Note: When drawing the connected line ROI, if the end point of one segment comes close the beginning of another
segment, the tool will tend to automatically close the loop. Below the picture on the left shows the position just
before the loop is closed, and the picture on the right shows the loop automatically closed.
Modifying an ROI
To change the position of a point, select the point and drag with the cursor. You can add more points to the line by
clicking on the line connecting different points.
To extend the ROI to more line segments, click the Extend button, and select from the beginning or the end of the
existing ROI.
To delete a point on the ROI, select the point, and click the Delete button.
206
Minneapolis, MN USA
Banner Engineering Corp.
2/2010
PresencePLUS Software Tools
You can also change the ROI width:
• By changing the value in the ROI Width field.
• By clickin on the lines that define the ROI width, and dragging to modify the width.
One-Shot
Once an ROI has been defined and terminated, the software performs a one-shot analysis of the existing image. The
software sends the values of all the input parameters to the sensor where the sensor performs analysis on the reference
image with those values, and computes initial values for number of good, narrow, and wide regions as well as other
characteristics of the regions.
Bead Tool Inputs
Bead Type
From the drop-down list, select Dark Bead or Bright Bead as appropriate for your application.
Threshold
Type
Banner Engineering Corp.
Minneapolis, MN USA
207
PresencePLUS Software Tools
2/2010
Adaptive
Select Adaptive when there are lighting changes that cause the acquired image to change.
Adaptive thresholding is a technique that is used to adjust the threshold for the BLOB tool based upon lighting changes
and image content within the ROI. It performs best if used with bi-modal images, which have a clear contrast in the
ROI. Adaptive thresholding chooses the current threshold value by converging to a value based on the average value
of the pixels above and below the previous threshold value; it will not move the value of the threshold above or below
the upper or lower limits.
Low Limit: Enter a gray scale value in this field, and the tool will not allow the Adaptive threshold to go below this
value.
Upper Limit: Enter a gray scale value in this field, and the tool will not allow the Adaptive threshold to go above this
value.
Reject Level: The Reject Level field is for bright Blobs only, and is used to narrow the range of pixel intensities to
consider in an inspection. Leaving the defaults at 0 for low and 255 for high will result in the tool taking into
consideration all gray scale levels in the ROI from 0 (black) to 255 (white). Note that the Reject Level field is visible
only when Bright bead type is selected.
Fixed
Select Fixed when the lighting and image content will remain relatively constant for all inspections.
If you select Fixed , you can also specify Threshold and Reject Levels.
Threshold Level
The Threshold Level (e.g., 141) defines the white/black cutoff point. Once a threshold is chosen, any pixels brighter
than the threshold become pure white while those darker than the threshold become pure black.
Reject Level
The Reject Level field is for bright Blobs only, and is used to narrow the range of pixel intensities to consider in an
inspection. Leaving the defaults at 0 for low and 255 for high will result in the tool taking into consideration all gray
scale levels in the ROI from 0 (black) to 255 (white). Note that the Reject Level field is visible only when Bright bead
type is selected.
208
Minneapolis, MN USA
Banner Engineering Corp.
2/2010
PresencePLUS Software Tools
Filters
Samples Per Pixel
Bead Width
Ignore Boundary Pixels
From the drop-down list select the pixels to sample: Every Pixel, Every 2nd Pixel
or Every 4th Pixel.
Change the value for Min and Max Bead Width by using the arrow keys in each field,
or by typing the desired value.
Check this box if you want the software to ignore boundary pixels. Boundary pixels
are bead pixels that touch the ROI. If you choose to ignore boundary pixels, you might
ignore one or more segments.
Results
The full list of results for the following bead are noted in the table below.
Banner Engineering Corp.
Minneapolis, MN USA
209
PresencePLUS Software Tools
2/2010
Result
Example Value
Threshold used
137
Minimum width found
8.20 (px)
Maximum width found
19.91 (px)
Average width found
12.58 (px)
Number of good regions
8
Total length of good regions
175.00 (px)
Longest good region length
53.00 (px)
Number of narrow regions
5
Total length of narrow regions
72.00 (px)
Longest narrow region length
20.00 (px)
Number of wide regions
3
Total length of wide regions
87.00 (px)
Longest wide region length
40.00 (px)
7.5.5 Optical Character Recognition (OCR) Tool
Optical character recognition (OCR) is the electronic interpretation of printed text that has been captured by a Vision
Sensor. The OCR tool in the PresencePLUS software is used to train character patterns and their variations into the
Vision Sensor's font library so that the Vision Sensor can recognize character patterns on labels and packages. Each
character pattern is associated with a character ID so that the Sensor is able to identify character strings on a label or
package. For example, you might train different fonts for the letter (S or S) and use the keyboard to associate these
variations with the character ID "S".
Usage
The OCR Vision Sensor tool can be used:
• to ensure that the correct lot or date code is printed on a label or package.
• to ensure that the right labels are placed on the appropriate packages.
• with the Barcode tool to match strings and/or substrings with the human readable text.
Fields
The following are fields on the OCR tool Input tab:
• Should I Use OCR or OCV? on page 229
• Decoded String Field on page 230
• Trainer on page 231
210
Minneapolis, MN USA
Banner Engineering Corp.
2/2010
PresencePLUS Software Tools
Supported Platforms
ProII Color ProII/ProII OMNI
1.3
Color
OMNI/OMNI AREA/AREA1.3 EDGE/EDGE GEO/GEO
1.3
1.3
1.3
BCR/BCR
1.3
Yes
Yes
Yes
Yes
Yes
No
No
No
OCR Tool Input Tab
Decoded String Field
Once the Sensor has been trained, the Decoded String field should show the characters the software detects in the
image area. If the Sensor does not correctly identify all the characters in the string, you may need to do some additional
training.
Note: The software ignores spaces.
Note: For OCV, if the Decoded string does not match the Expected String, then the Decoded string will be
displayed in red.
Banner Engineering Corp.
Minneapolis, MN USA
211
PresencePLUS Software Tools
2/2010
7.5.6 Trainer
The Box Tab
When you capture a reference image using the OCR or OCV tool, these tools use sophisticated pattern recognition
algorithms to box what is estimated to be individual characters in a captured image. In the example below, the initial
image capture finds all the individual characters except the 3 and the 4, which it has incorrectly boxed as a single
character. In the Box tab, you can calibrate image settings so that the software will more accurately box the characters
in a character string.
On the Box tab, you can calibrate the following:
• Image Control Parameters on page 232
• ROI Control Calibration on page 233
• Character Settings Calibration on page 235
• Character Connectivity Calibration on page 238
212
Minneapolis, MN USA
Banner Engineering Corp.
2/2010
PresencePLUS Software Tools
• Thresholding Calibration on page 240
Training List
You can add, load, or import images as a Training List to train character patterns into the Sensor.
Button
Description
Use the right arrow to cycle down through a list of images, and use the left arrow to
cycle up through the list.
Click this button to add the currently displayed image to the Training List.
Note: Use this button as Sensor images are being captured.
Click this button to remove the currently selected image from the Training List.
Click this button to import images from the player/recorder folder where bitmaps are
saved.
Click this button to select a .pbl file that has been previously saved with images.
Click this button to save the current Training List.
Click this button to clear the Training List.
Banner Engineering Corp.
Minneapolis, MN USA
213
PresencePLUS Software Tools
2/2010
Image Control Parameters
The Image Control parameters determine what image or images to use when fine-tuning how characters are boxed
within the ROI.
Parameters
The following describe the image control parameters set in this group.
Image
Description
Additional Information
Reference Image
Boxing is first done using the Reference
Image captured with the OCR or OCV tool.
Training List
Create or use a Training List (or Play List)
of images previously saved, or by adding
images currently displayed in the Image
window to get some variants of character
patterns.
Note: For the best results when
training the Sensor, you should
capture several character string images
to account for slight character pattern
variations.
Sensor Images
Capture sensor images using either a
Continous, External, or Manual/Hold
trigger.
ROI Control Calibration
The ROI Control provides a way to adjust the image if it is not on a horizontal plane, if the characters are slanted so
that the software cannot box them accurately, or if the camera is positioned in such a way that the captured image is
backwards or upside down.
214
Minneapolis, MN USA
Banner Engineering Corp.
2/2010
PresencePLUS Software Tools
Parameters
The following are used to calibrate the ROI:
ROI Control
Description
Additional Information
Rotation
Use the up or down arrow controls to rotate
the ROI clockwise, or counterclockwise so that
the ROI aligns with the character string image.
Deslant Angle
In order for the OCV/OCR Vision tool to box
correctly, there must be a minimum of a 2 to
3 pixel-wide column between characters. If
the characters are slanted in such a way that
they overlap in this 2 to 3 pixel-wide column,
then the image may need to be manipulated,
or deslanted, so that the image can box
correctly. Use the up or down arrow controls
to adjust for the slant as appropriate.
Flipping Mode
From the dropdown, select None, Horizontal,
Vertical, or Both.
Note: Performance is reduced if you have
to flip the image. If you can't re-orient the
camera so that the character string in the
captured image reads normally from left
to right on a horizontal plane, consider
assigning each character pattern as it
appears to a character ID in the font
library.
Banner Engineering Corp.
Minneapolis, MN USA
215
PresencePLUS Software Tools
2/2010
Character Settings Calibration
The Character Settings calibration group on the OCR or OCV Trainer is used to define characteristics of the string
images captured by the Vision Sensor.
Standard Character Settings
Enhanced Character Settings
Parameters
The following are parameters to used to calibrate character settings.
Character
Settings
Description
Additional Information
Print Contrast
From the drop-down list, select Dark
on bright or Bright on dark, which
defines the relationship of the
characters and the background; that is
black on white or white on black.
Character spacing Use the up and down arrow controls
to specify the number of pixels the
216
Minneapolis, MN USA
Banner Engineering Corp.
2/2010
Character
Settings
PresencePLUS Software Tools
Description
Additional Information
software should ignore where one
character box ends and where the next
character box begins.
Min Stroke
Thickness
Use the up and down arrow controls
to specify the stroke thickness of the
characters. This is used to eliminate
spurious marks that might result in
false-positive identification of
characters.
Enhanced Character Settings
The enhanced OCR/OCV settings provide for fine-tuning how the sensor boxes characters. To enable Enhanced
OCR/OCV tools:
1. Click the System button on the UI to display the System Setup dialog.
2. Select the Tools Configuration tab.
3. Check the box next to Enhanced under OCR and/or OCV.
Banner Engineering Corp.
Minneapolis, MN USA
217
PresencePLUS Software Tools
2/2010
Enhanced
Description
Character Settings
Min Box Width
Min Box Height
Max Box Width
Max Box Height
218
Additional Information
These values determine the
minimum width and height
allowed for the boxing around
a character. Typically, these
values will be the width (and
height) of the smallest valid
character. If a character is
smaller than the Min Box
Width setting, for example, the
sensor will force the box to be
the Min Box Width unless the
Undersized characters has
Discard selected, in which case,
for example, a 10 pixel
character will be ignored.
These values determine the
maximum width and height
allowed for the boxing around
a character. Typically, these
values will be the width (and
height) of the largest valid
character. If a character is
larger than the Max Box Width
setting, for example, the sensor
will force the box to be the Max
Minneapolis, MN USA
Banner Engineering Corp.
2/2010
PresencePLUS Software Tools
Enhanced
Description
Character Settings
Additional Information
Box Width unless the
Oversized characters has
Discard selected, in which case,
for example, a 5 pixel character
will be ignored.
Enable Adaptive
Max Box Width
If a box reaches the Max Box
Width without finding a natural
character ending, when Enable
Adaptive Max Box Width is
checked, the senor will adjust
the right edge of the box tofind
a most likely endpoint for a
character.
Undersized
characters
• When Discard is selected, the
sensor will reject proposed
boxes that do not meet the
minimum requirements (see
Minimum Box Width above).
• When Extend is selected, the
sensor will make the character
fit the box.
Oversized
characters
• When Discard is selected, the
sensor will reject proposed
boxes that do not meet the
maximum requirements (see
Maximum Box Width above)
.
• When Split is selected, the
sensor will split the character
into multiple characters.
Character Connectivity Calibration
Intra-Character Connectivity defines the maximum number of pixel spaces between two character strokes so that both
strokes will be considered part of the same character. In the example below, if the Horizontal Gap were defined too
small, the "H" could be considered an I - I.
Banner Engineering Corp.
Minneapolis, MN USA
219
PresencePLUS Software Tools
2/2010
Note: Here "0" vertical gap really means "infinite" vertical gap (but bounded by the ROI); that is, all pixels in a
vertical line can be considered part of the same character.
Parameters
The following are the parameters that you adjust to set Intra-Character Connectivty.
Intra-Character Connectivity Description
Additional Information
Max Horizontal Gap
Use the up or down arrow
controls to set the maximum
number of pixel spaces that can
exist between two horizontal
character strokes so that the
image is boxed as a single
character image.
Max Vertical Gap
Use the up or down arrow
controls to set the maximum
220
Minneapolis, MN USA
Banner Engineering Corp.
2/2010
PresencePLUS Software Tools
Intra-Character Connectivity Description
Additional Information
number of pixel spaces that can
exist between two vertical
character strokes so that the
image is boxed as a single
character image.
Thresholding Calibration
The Thresholding calibration group includes options for adjusting the grayscale threshold level for the image.
Parameters
The following are the parameters that can be set for Thresholding.
Thresholding Type
Description
Additional Information
Adaptive
If you select Adaptive from the
drop-down list, which is the
default, the software
automatically chooses the
grayscale threshold level for the
bimodal image.
Note: this threshold
assumes that the image is
bimodal.
Fixed
If you select Fixed from the
drop-down list, you need to enter
the Lower Reject and Threshold
(see the example below).
Note: If the Print Contrast
is set to Bright on dark,
then the Lower Reject and
Thresholds will be the
opposite.
Banner Engineering Corp.
Minneapolis, MN USA
221
PresencePLUS Software Tools
2/2010
Thresholding Type
Description
Additional Information
Uniformly Changing
If you select Uniformly
Changing, then the grayscale
contrast of the image changes
along the read direction of the
ROI in uniform increments (up
or down) over the units indicated
in the Box count field. The
default box count is 16. Use the
arrow controls to adjust as
apppropriate.
Note: The Box count
integer is close to the
number of characters in the
image. A good starting
point is the number of
characters in the image.
Non-uniformly Changing
If you select Non-uniformly
Changing, then the grayscale
contrast of the image varies
irregularly along the read
direction of the ROI. The default
box count is 16. Use the arrow
controls to adjust as
apppropriate.
Note: The Box count
integer is close to the
number of characters in the
image. A good starting
point is the number of
characters in the image.
Enable low contrast
thresholding
222
Check the Enable low contrast
thresholding if the contrast is
not sufficient to allow characters
to box correctly.
Minneapolis, MN USA
Banner Engineering Corp.
2/2010
PresencePLUS Software Tools
The Train Tab
The Train tab is where you train character patterns into the Font Library; that is, assign a character ID to each character
pattern. As character patterns are trained into theVision Sensor, the software will begin to recognize character patterns.
Banner Engineering Corp.
Minneapolis, MN USA
223
PresencePLUS Software Tools
2/2010
Read Acceptance
There are three levels of Read Acceptance, Loose (default), Medium, and Strict. Which you select will determine
how forgiving the Sensor will be regarding character variability. In other words, the stricter you set Read Acceptance,
the less forgiving the Sensor will be for variability, which might mean training more characters that will lead to a bigger
library, and eventually some effect on performance. Also, a Font Library that gets too many characters may have an
increased chance of false positive reads.
Note: No matter the level Read Acceptance selected, the software always uses a slightly tighter tolerance when
training the Sensor than when the Sensor is in Run mode.
Training List
You can add, load, or import images as a Training List to train character patterns into the Sensor.
224
Minneapolis, MN USA
Banner Engineering Corp.
2/2010
Button
PresencePLUS Software Tools
Description
Use the right arrow to cycle down through a list of images, and use the left arrow to
cycle up through the list.
Click this button to add the currently displayed image to the Training List.
Note: Use this button as Sensor images are being captured.
Click this button to remove the currently selected image from the Training List.
Click this button to import images from the player/recorder folder where bitmaps are
saved.
Click this button to select a .pbl file that has been previously saved with images.
Click this button to save the current Training List.
Click this button to clear the Training List.
Font Library
The Vision Sensor's Font Library shows trained fonts in yellow. It also provides for importing a Font Library from
another tool and for reviewing the various character patterns trained into the Sensor.
Banner Engineering Corp.
Minneapolis, MN USA
225
PresencePLUS Software Tools
2/2010
Library Control
Library Control lets you manage the entire library. You can export a libary, delete a libary, or import a library; that is,
import all trained characters from another tool.
Button
Description
Click this button to delete all the trained characters from the current library.
Click this button to undo the last operation.
226
Minneapolis, MN USA
Banner Engineering Corp.
2/2010
PresencePLUS Software Tools
Button
Description
Click this button to import a font library from another OCR or OCV tool.To be able to import
the font library from another tool, you must first export the library from that tool and save
the font library to a file. Then, you can import the font library into the current tool.
Note: If a tool is copied, its font library is also copied.
Click this button to export the current library so that it can be imported elsewhere.
Synthetic Character Control
Synthetic Character Control lets you view all the character patterns associated with a particular character ID. You can
remove any one character pattern or all the character patterns associated with a character ID.
Button
Description
Use this button to remove the currently viewed character pattern in the Entry field.
Use this button to remove all the entries for the character pattern currently viewed in the Entry
field.
Use the arrows to cycle through the character patterns for a particular character ID.
7.5.7 Advanced Tab
Use the up and down arrow controls on the Time out field to change the inspection timeout in milliseconds.
Banner Engineering Corp.
Minneapolis, MN USA
227
PresencePLUS Software Tools
2/2010
Note: When the tool times out, it may have decoded part of the string before the time ran out.This partial decoding
is reported back as the Decoded String. In OCV, whenever a timeout occurs, it is considered NO MATCH even
if the returned Decoded String matched Expected String.
7.5.8 Optical Character Verification (OCV) Tool
Optical character verification (OCV) is very similar to the OCR tool regarding decoding an image and building the
Font Library. However, where OCR always feeds back what it decodes, the OCV tool simply provides success/failure
results; that is, OCV simply indicates whether or not an expected character string matches a decoded string. If the
strings match, then the result is Success. If the strings do not match, then the result is Failure.
Usage
The OCV Vision Sensor tool can be used:
• to ensure that the correct lot or date code is printed on a label or package.
• to ensure that the right labels are placed on the appropriate packages.
• verify string with a string that is received from Industrial Protocols.
Fields
The following are fields on the OCV tool Input tab:
• Should I Use OCR or OCV? on page 229
• Decoded String Field on page 230
• Trainer on page 231
Supported Platforms
228
Minneapolis, MN USA
Banner Engineering Corp.
2/2010
PresencePLUS Software Tools
ProII Color ProII/ProII OMNI
1.3
Color
OMNI/OMNI AREA/AREA1.3 EDGE/EDGE GEO/GEO
1.3
1.3
1.3
BCR/BCR
1.3
Yes
Yes
Yes
Yes
Yes
No
No
No
OCV Input Tab
Should I Use OCR or OCV?
Most applications should use OCR because it provides more information than simply a success/failure. However, there
are times where you don't care about any additional information, but do require a bit better performance than OCR can
provide.
With OCR, the Sensor has no idea what to expect at each character position so, when it decodes an image for each
character pattern, it has to search the entire Font Library to find a character ID that matches.
For the OCV tool, on the other hand, each character position is filtered such that there are a finite number of character
variants associated with a single character ID.
Banner Engineering Corp.
Minneapolis, MN USA
229
PresencePLUS Software Tools
2/2010
Decoded String Field
Once the Sensor has been trained, the Decoded String field should show the characters the software detects in the
image area. If the Sensor does not correctly identify all the characters in the string, you may need to do some additional
training.
Note: The software ignores spaces.
Note: For OCV, if the Decoded string does not match the Expected String, then the Decoded string will be
displayed in red.
230
Minneapolis, MN USA
Banner Engineering Corp.
2/2010
PresencePLUS Software Tools
7.5.9 Trainer
The Box Tab
When you capture a reference image using the OCR or OCV tool, these tools use sophisticated pattern recognition
algorithms to box what is estimated to be individual characters in a captured image. In the example below, the initial
image capture finds all the individual characters except the 3 and the 4, which it has incorrectly boxed as a single
character. In the Box tab, you can calibrate image settings so that the software will more accurately box the characters
in a character string.
On the Box tab, you can calibrate the following:
• Image Control Parameters on page 232
• ROI Control Calibration on page 233
• Character Settings Calibration on page 235
• Character Connectivity Calibration on page 238
• Thresholding Calibration on page 240
Training List
You can add, load, or import images as a Training List to train character patterns into the Sensor.
Banner Engineering Corp.
Minneapolis, MN USA
231
PresencePLUS Software Tools
Button
2/2010
Description
Use the right arrow to cycle down through a list of images, and use the left arrow to
cycle up through the list.
Click this button to add the currently displayed image to the Training List.
Note: Use this button as Sensor images are being captured.
Click this button to remove the currently selected image from the Training List.
Click this button to import images from the player/recorder folder where bitmaps are
saved.
Click this button to select a .pbl file that has been previously saved with images.
Click this button to save the current Training List.
Click this button to clear the Training List.
Image Control Parameters
The Image Control parameters determine what image or images to use when fine-tuning how characters are boxed
within the ROI.
232
Minneapolis, MN USA
Banner Engineering Corp.
2/2010
PresencePLUS Software Tools
Parameters
The following describe the image control parameters set in this group.
Image
Description
Additional Information
Reference Image
Boxing is first done using the Reference
Image captured with the OCR or OCV tool.
Training List
Create or use a Training List (or Play List)
of images previously saved, or by adding
images currently displayed in the Image
window to get some variants of character
patterns.
Note: For the best results when
training the Sensor, you should
capture several character string images
to account for slight character pattern
variations.
Sensor Images
Capture sensor images using either a
Continous, External, or Manual/Hold
trigger.
ROI Control Calibration
The ROI Control provides a way to adjust the image if it is not on a horizontal plane, if the characters are slanted so
that the software cannot box them accurately, or if the camera is positioned in such a way that the captured image is
backwards or upside down.
Banner Engineering Corp.
Minneapolis, MN USA
233
PresencePLUS Software Tools
2/2010
Parameters
The following are used to calibrate the ROI:
ROI Control
Description
Additional Information
Rotation
Use the up or down arrow controls to rotate
the ROI clockwise, or counterclockwise so that
the ROI aligns with the character string image.
Deslant Angle
In order for the OCV/OCR Vision tool to box
correctly, there must be a minimum of a 2 to
3 pixel-wide column between characters. If
the characters are slanted in such a way that
they overlap in this 2 to 3 pixel-wide column,
then the image may need to be manipulated,
or deslanted, so that the image can box
correctly. Use the up or down arrow controls
to adjust for the slant as appropriate.
Flipping Mode
From the dropdown, select None, Horizontal,
Vertical, or Both.
Note: Performance is reduced if you have
to flip the image. If you can't re-orient the
camera so that the character string in the
captured image reads normally from left
to right on a horizontal plane, consider
assigning each character pattern as it
appears to a character ID in the font
library.
234
Minneapolis, MN USA
Banner Engineering Corp.
2/2010
PresencePLUS Software Tools
Character Settings Calibration
The Character Settings calibration group on the OCR or OCV Trainer is used to define characteristics of the string
images captured by the Vision Sensor.
Standard Character Settings
Enhanced Character Settings
Parameters
The following are parameters to used to calibrate character settings.
Character
Settings
Description
Additional Information
Print Contrast
From the drop-down list, select Dark
on bright or Bright on dark, which
defines the relationship of the
characters and the background; that is
black on white or white on black.
Character spacing Use the up and down arrow controls
to specify the number of pixels the
Banner Engineering Corp.
Minneapolis, MN USA
235
PresencePLUS Software Tools
Character
Settings
2/2010
Description
Additional Information
software should ignore where one
character box ends and where the next
character box begins.
Min Stroke
Thickness
Use the up and down arrow controls
to specify the stroke thickness of the
characters. This is used to eliminate
spurious marks that might result in
false-positive identification of
characters.
Enhanced Character Settings
The enhanced OCR/OCV settings provide for fine-tuning how the sensor boxes characters. To enable Enhanced
OCR/OCV tools:
1. Click the System button on the UI to display the System Setup dialog.
2. Select the Tools Configuration tab.
3. Check the box next to Enhanced under OCR and/or OCV.
236
Minneapolis, MN USA
Banner Engineering Corp.
2/2010
PresencePLUS Software Tools
Enhanced
Description
Character Settings
Min Box Width
Min Box Height
Max Box Width
Max Box Height
Additional Information
These values determine the
minimum width and height
allowed for the boxing around
a character. Typically, these
values will be the width (and
height) of the smallest valid
character. If a character is
smaller than the Min Box
Width setting, for example, the
sensor will force the box to be
the Min Box Width unless the
Undersized characters has
Discard selected, in which case,
for example, a 10 pixel
character will be ignored.
These values determine the
maximum width and height
allowed for the boxing around
a character. Typically, these
values will be the width (and
height) of the largest valid
character. If a character is
larger than the Max Box Width
setting, for example, the sensor
will force the box to be the Max
Banner Engineering Corp.
Minneapolis, MN USA
237
PresencePLUS Software Tools
2/2010
Enhanced
Description
Character Settings
Additional Information
Box Width unless the
Oversized characters has
Discard selected, in which case,
for example, a 5 pixel character
will be ignored.
Enable Adaptive
Max Box Width
If a box reaches the Max Box
Width without finding a natural
character ending, when Enable
Adaptive Max Box Width is
checked, the senor will adjust
the right edge of the box tofind
a most likely endpoint for a
character.
Undersized
characters
• When Discard is selected, the
sensor will reject proposed
boxes that do not meet the
minimum requirements (see
Minimum Box Width above).
• When Extend is selected, the
sensor will make the character
fit the box.
Oversized
characters
• When Discard is selected, the
sensor will reject proposed
boxes that do not meet the
maximum requirements (see
Maximum Box Width above)
.
• When Split is selected, the
sensor will split the character
into multiple characters.
Character Connectivity Calibration
Intra-Character Connectivity defines the maximum number of pixel spaces between two character strokes so that both
strokes will be considered part of the same character. In the example below, if the Horizontal Gap were defined too
small, the "H" could be considered an I - I.
238
Minneapolis, MN USA
Banner Engineering Corp.
2/2010
PresencePLUS Software Tools
Note: Here "0" vertical gap really means "infinite" vertical gap (but bounded by the ROI); that is, all pixels in a
vertical line can be considered part of the same character.
Parameters
The following are the parameters that you adjust to set Intra-Character Connectivty.
Intra-Character Connectivity Description
Additional Information
Max Horizontal Gap
Use the up or down arrow
controls to set the maximum
number of pixel spaces that can
exist between two horizontal
character strokes so that the
image is boxed as a single
character image.
Max Vertical Gap
Use the up or down arrow
controls to set the maximum
Banner Engineering Corp.
Minneapolis, MN USA
239
PresencePLUS Software Tools
2/2010
Intra-Character Connectivity Description
Additional Information
number of pixel spaces that can
exist between two vertical
character strokes so that the
image is boxed as a single
character image.
Thresholding Calibration
The Thresholding calibration group includes options for adjusting the grayscale threshold level for the image.
Parameters
The following are the parameters that can be set for Thresholding.
Thresholding Type
Description
Additional Information
Adaptive
If you select Adaptive from the
drop-down list, which is the
default, the software
automatically chooses the
grayscale threshold level for the
bimodal image.
Note: this threshold
assumes that the image is
bimodal.
Fixed
If you select Fixed from the
drop-down list, you need to enter
the Lower Reject and Threshold
(see the example below).
Note: If the Print Contrast
is set to Bright on dark,
then the Lower Reject and
Thresholds will be the
opposite.
240
Minneapolis, MN USA
Banner Engineering Corp.
2/2010
PresencePLUS Software Tools
Thresholding Type
Description
Additional Information
Uniformly Changing
If you select Uniformly
Changing, then the grayscale
contrast of the image changes
along the read direction of the
ROI in uniform increments (up
or down) over the units indicated
in the Box count field. The
default box count is 16. Use the
arrow controls to adjust as
apppropriate.
Note: The Box count
integer is close to the
number of characters in the
image. A good starting
point is the number of
characters in the image.
Non-uniformly Changing
If you select Non-uniformly
Changing, then the grayscale
contrast of the image varies
irregularly along the read
direction of the ROI. The default
box count is 16. Use the arrow
controls to adjust as
apppropriate.
Note: The Box count
integer is close to the
number of characters in the
image. A good starting
point is the number of
characters in the image.
Enable low contrast
thresholding
Banner Engineering Corp.
Check the Enable low contrast
thresholding if the contrast is
not sufficient to allow characters
to box correctly.
Minneapolis, MN USA
241
PresencePLUS Software Tools
2/2010
The Train Tab
The Train tab is where you train character patterns into the Font Library; that is, assign a character ID to each character
pattern. As character patterns are trained into theVision Sensor, the software will begin to recognize character patterns.
242
Minneapolis, MN USA
Banner Engineering Corp.
2/2010
PresencePLUS Software Tools
Read Acceptance
There are three levels of Read Acceptance, Loose (default), Medium, and Strict. Which you select will determine
how forgiving the Sensor will be regarding character variability. In other words, the stricter you set Read Acceptance,
the less forgiving the Sensor will be for variability, which might mean training more characters that will lead to a bigger
library, and eventually some effect on performance. Also, a Font Library that gets too many characters may have an
increased chance of false positive reads.
Note: No matter the level Read Acceptance selected, the software always uses a slightly tighter tolerance when
training the Sensor than when the Sensor is in Run mode.
Training List
You can add, load, or import images as a Training List to train character patterns into the Sensor.
Banner Engineering Corp.
Minneapolis, MN USA
243
PresencePLUS Software Tools
Button
2/2010
Description
Use the right arrow to cycle down through a list of images, and use the left arrow to
cycle up through the list.
Click this button to add the currently displayed image to the Training List.
Note: Use this button as Sensor images are being captured.
Click this button to remove the currently selected image from the Training List.
Click this button to import images from the player/recorder folder where bitmaps are
saved.
Click this button to select a .pbl file that has been previously saved with images.
Click this button to save the current Training List.
Click this button to clear the Training List.
Font Library
The Vision Sensor's Font Library shows trained fonts in yellow. It also provides for importing a Font Library from
another tool and for reviewing the various character patterns trained into the Sensor.
244
Minneapolis, MN USA
Banner Engineering Corp.
2/2010
PresencePLUS Software Tools
Library Control
Library Control lets you manage the entire library. You can export a libary, delete a libary, or import a library; that is,
import all trained characters from another tool.
Button
Description
Click this button to delete all the trained characters from the current library.
Click this button to undo the last operation.
Banner Engineering Corp.
Minneapolis, MN USA
245
PresencePLUS Software Tools
Button
2/2010
Description
Click this button to import a font library from another OCR or OCV tool.To be able to import
the font library from another tool, you must first export the library from that tool and save
the font library to a file. Then, you can import the font library into the current tool.
Note: If a tool is copied, its font library is also copied.
Click this button to export the current library so that it can be imported elsewhere.
Synthetic Character Control
Synthetic Character Control lets you view all the character patterns associated with a particular character ID. You can
remove any one character pattern or all the character patterns associated with a character ID.
Button
Description
Use this button to remove the currently viewed character pattern in the Entry field.
Use this button to remove all the entries for the character pattern currently viewed in the Entry
field.
Use the arrows to cycle through the character patterns for a particular character ID.
7.5.10 Advanced Tab
Use the up and down arrow controls on the Time out field to change the inspection timeout in milliseconds.
246
Minneapolis, MN USA
Banner Engineering Corp.
2/2010
PresencePLUS Software Tools
Note: When the tool times out, it may have decoded part of the string before the time ran out.This partial decoding
is reported back as the Decoded String. In OCV, whenever a timeout occurs, it is considered NO MATCH even
if the returned Decoded String matched Expected String.
7.5.11 OCV Tool and the Remote Command Channel
Commands
Syntax
Description
set ocvtool tool_name|tool_number exp_string value
Sets the expected string, if it is a constant. The
Value should be a quoted string containing
printable ASCII characters (see Character Strings
on page 331).
get ocvtool tool_name|tool_number exp_string
Gets the value of the exptected string.
Examples
Set Command Example Assuming that you have two OCV tools, my_ocv_tool_1 and my_ocv_tool_2, each with
their first operand configured as a constant. To set the constant of the second ocvtool to
foobar, issue the following command:
set ocvtool my_ocv_tool_2 "foobar"
or
Banner Engineering Corp.
Minneapolis, MN USA
247
PresencePLUS Software Tools
2/2010
set ocvtool 2 "foobar"
Get Command Example
To get the constant of the second ocvtool, issue the following command:
get ocvtool my_ocv_tool_2
or
get ocvtool 2
7.6 Analysis Tools
Analysis tools analyze the information gathered with the Vision tools to create measurements and tolerances for the
Vision tools.
Analysis Tools
Location
Tools
ProII/ProII OMNI
1.3
Color
OMNI/OMNI AREA/AREA1.3 EDGE/EDGE GEO/GEO BCR/BCR
1.3
1.3
1.3
1.3
Coordinate Yes
Tool on
page 263
Yes
Yes
Yes
No
No
No
No
Communication Yes
Tool on
page 248
Yes
Yes
Yes
Yes
Yes
Yes
Yes
Math Tool Yes
on page 267
Yes
Yes
Yes
Yes
Yes
Yes
Yes
Yes
Yes
Yes
Yes
Yes
Yes
Yes
Yes
String Tool Yes
on page 294
Yes
Yes
Yes
No
No
No
Yes
Test Tool
Yes
on page 301
Yes
Yes
Yes
Yes
Yes
Yes
Yes
Measure
Tool on
page 272
ProII
Color
7.6.1 Communication Tool
The Communication tool is used to conditionally export data from the Sensor to an external device. Results from
Vision tools can be selected by the Communication tool and exported to an external device. The Sensor can export
data over the Ethernet or via its serial channels.
Examples of exported results
• Execution times
• Whole-number counts
• Input and output values from a Test tool
• Success from Locate and Test tools
• Reference point-to-edge and rotation distances
Fields
248
Minneapolis, MN USA
Banner Engineering Corp.
2/2010
PresencePLUS Software Tools
The following are fields on the Communication tool Input tab:
• Select on page 250
• Connections on page 250
• Format on page 251
• Output Filter on page 251
• Guidelines for Configuring the Communication Tool on page 251
Supported Platforms
ProII Color ProII/ProII OMNI
1.3
Color
OMNI/OMNI AREA/AREA1.3 EDGE/EDGE GEO/GEO
1.3
1.3
1.3
BCR/BCR
1.3
Yes
Yes
Yes
Yes
Yes
Yes
Yes
Yes
Communication Tool Input Tab
Adding a Communication Tool
Important: Add the Communication tool after the Vision tools that have data to be exported.
The Communication tool can export results data from the first Location, Vision, Analysis, and Test tools as follows:
Banner Engineering Corp.
Minneapolis, MN USA
249
PresencePLUS Software Tools
2/2010
• In the sequence that the tools are selected within the Communication tool.
• In the sequence that the options are listed within the tools for export
One inspection can have more than one Communication tool.
Use one Communication tool to:
• Export data out of one port (serial or Ethernet).
• Export identical data out of multiple ports at the same time.
Use multiple Communication tools to:
• Separate the data and export separate segments to unique external devices.
• Customize the order of the exported data.
• Export data from the Vision tools at different times during the inspection.
• Customize the “Start Strings” control characters to unique external devices.
Note: The Test tool can have the Communication tool as one of its inputs. Therefore, if a Test tool is added after
the Communication tool, a discrete output can be activated:
• If the TCP/IP connection is lost.
• If the external device fails to acknowledge it received data.
This output could contribute to an inspection Pass/Fail if it is an input to a Test tool. A Communication tool without
a Test tool will not contribute to the inspection Pass/Fail.
Select
This field provides a drop-down list from which to select tools; select the results to export from the selected tool’s tab
that appears in the configuration window.
Connections
This field provides a drop-down list from which to select the communication connection(s) to export the data.
250
Minneapolis, MN USA
Banner Engineering Corp.
2/2010
PresencePLUS Software Tools
Format
This field provides options for formatting the ASCII string of data that will be exported.
Output Filter
This field provides a means to make specific output selections in order to avoid unwanted output information.
Guidelines for Configuring the Communication Tool
There are four main steps in configuring the Communication tool:
1. Select the Vision tools and their results to export (in the Select field).
• When a tool is selected, the selected tool’s tab appears in the Configuration window.
• Click on the tab to select the data to be exported.
2. Select the communication connection(s) that will export the data (in the Connection field).
• If MULTIPLE is chosen from the drop-down list, then click Edit Selections to select more than one port.
• Click View Settings to display the configuration of the connection.
• Data can be sent through 11 different communication connections: one connector for the serial connection, and
10 sockets (1 to 10) through the Ethernet connector.
• The 10 Ethernet sockets are comprised of the Sensor IP address and port number. The table below lists the default
Ethernet socket addresses.
Socket
Default IP Address
Port
1
192.168.0.1
20,000
2
192.168.0.1
20,001
3
192.168.0.1
20,002
4
192.168.0.1
20,003
5
192.168.0.1
20,004
6
192.168.0.1
20,005
7
192.168.0.1
20,006
Banner Engineering Corp.
Minneapolis, MN USA
251
PresencePLUS Software Tools
2/2010
Socket
Default IP Address
Port
8
192.168.0.1
20,007
9
192.168.0.1
20,008
10
192.168.0.1
20,009
• The serial port is the RS-232 connector (Pins 1, 9, and 10) on the Sensor. The deafult settings for the serial port
are listed below.
Attribute
Default Setting
Baud Rate
115200
Data Bits
8
Parity
None
Stop Bit
1
Flow Control
None
3. Format the ASCII string of data (in the Format field).
• Choose a Delimiter and Start and End strings.
• Check the Enable Labels box to add the names for data being sent.
Allowable ASCII string options are shown below.
Note: Start and End strings can now accept ASCII Hex values, and the following special characters: "\r",
"\n", "\t".
Option Name
Values
Description
Delimiter
, <Comma>
The delimiter is used to separate the
individual pieces of data being sent.
The delimiter will follow every
individual segment of data, including
start string and end string.
: < Colon>
; <Semicolon>
\r\n <CR_LF> Carriage return and
then line feed
\n\r <LF-CR> Line feed then carriage
return
\r <CR> Carriage return only
\n <LF> Line feed only
Start String
252
User-defined ASCII characters (limit This option is a mechanism for
of 75 characters)
adding characters before a string of
data.
Note: ASCII Hex characters are
allowed. Special symbols such
as \r, \n, and \t will cause a
carriage return, new line, and tab
to be output repsectively.
Minneapolis, MN USA
Banner Engineering Corp.
2/2010
PresencePLUS Software Tools
Option Name
Values
Description
End String
User-defined ASCII characters (limit This option is a mechanism for
of 75 characters)
adding characters after a string of
data.
Note: ASCII Hex characters are
allowed. Special symbols such
as \r, \n, and \t will cause a
carriage return, new line, and tab
to be output repsectively.
Enable Labels
Parameter labels
Check this box to add a label to the
data before the data itself. Example:
Dark Count = 3, where "Dark
Count=" is the label.
4. Set conditions for conditionally exporting the selected data (in the Output Filter field).
• Select Pass to export the selected information on a passing Test tool.
• Select Fail to export the selected information on a failing Test tool.
Communication Tool Exportable Results
The Communication tool sends out the data in the same sequence that the tools appear in the inspection, and the result
of transmitting this data will increase the inspection time.
The following shows the data sent out for each Communication tool.
Result
Value
Description
Success
1 = The connection is valid, and data Checks the connection (Ethernet only).
will be sent.
Execution time
Given in ms.
Processing time for the Sensor to send
the data out.
The table below shows the format of the data.
Result*
Number
Format
Example
Point (X,Y)
Decimal
(0.00, 00.00)
(23.41, 156.52)
Distance
Decimal
00.00
99.00
Count
Whole
0
4
* Available data is tool and model-dependent.
Location Tools
• Communication Tool Exportable Results: Locate Tool on page 254
• Communication Tool Exportable Results: Geometric Find Tool on page 254
• Communication Tool Exportable Results: Pattern Find Tool on page 255
Gray Scale Tools
• Communication Tool Exportable Results: Blob Detect Tool on page 255
• Communication Tool Exportable Results: Edge Tool on page 256
• Communication Tool Exportable Results: Geometric Count Tool on page 256
• Communication Tool Exportable Results: Object Tool on page 257
Banner Engineering Corp.
Minneapolis, MN USA
253
PresencePLUS Software Tools
2/2010
• Communication Tool Exportable Results: Pattern Count Tool on page 257
Color Tools
• Communication Tool Exportable Results: Average Color Tool on page 258
• Communication Tool Exportable Results: Color Blob Tool on page 258
• Communication Tool Exportable Results: Color Match Tool on page 258
Premium Tools
• Communication Tool Exportable Results: Barcode Tool on page 259
• Communication Tool Exportable Results: Bead Tool on page 259
• Communication Tool Exportable Results: OCR Tool on page 260
• Communication Tool Exportable Results: OCV Tool on page 261
Analysis Tools
• Communication Tool Exportable Results: Math Tool on page 261
• Communication Tool Exportable Results: Measure Tool on page 261
• Communication Tool Exportable Results: String Tool on page 262
• Communication Tool Exportable Results: Test Tool on page 262
Communication Tool Exportable Results: Locate Tool
Data Label
Value
Description
Tool Name
string
User-defined name
Success
1 or 0
1 = Tool executed successfully
0 = Tool did not find a point to use as a reference
Execution Time
ms
Fastest recorded tool processing time since the start of the inspection
or since power-up.
Execution Time Min
ms
Fastest recorded tool processing time for the current inspection or
since power-up.
Execution Time Max
ms
Slowest recorded tool processing time since the start of the
inspection or since power-up.
Edge Offset Point
pixels (X, Y)
Distance from the reference edge to the current edge.
Edge Location Point
pixels (X, Y)
X, Y coordinates of the current edge.
Rotation
degrees
Amount of rotation from the current edge to the reference edge.
Rotation Origin
pixels (X, Y)
X, Y coordinates of the point from which ROIs will rotate.
Communication Tool Exportable Results: Geometric Find Tool
Data Label
Value
Description
Tool Name
string
User-defined name
Success
1 or 0
1 = Tool executed successfully
0 = Tool did not find a point to use as a reference
Execution Time
ms
Tool processing time for the current inspection.
Execution Time Min
ms
Fastest recorded tool processing time since the start of the inspection or
since power-up.
254
Minneapolis, MN USA
Banner Engineering Corp.
2/2010
PresencePLUS Software Tools
Data Label
Value
Description
Execution Time Max
ms
Slowest recorded tool processing time since the start of the inspection or
since power-up.
Rotation Origin
pixels (X, Y)
X, Y coordinates of the point from ROIs will rotate.
Best Match Rotation
degrees
Rotational value of the first pattern found.
Best Match Location
Point
pixels (X, Y)
X, Y coordinates of the first pattern found.
Best Match %
20-100%
Percent match of the first patttern found.
Communication Tool Exportable Results: Pattern Find Tool
Data Label
Value
Description
Tool Name
string
User-defined name
Success
1 or 0
1 = Tool executed successfully
0 = Tool did not find a point to use as a reference
Execution Time
ms
Tool processing time for the current inspection.
Execution Time Min
ms
Fastest recorded tool processing time since the start of the inspection
or since power-up.
Execution Time Max
ms
Slowest recorded tool processing time since the start of the inspection
or since power-up.
Match Acceptance Level
Range Min
20 - 100%
Minimum percent the current pattern must match the reference pattern
to be considered a match.
Match Acceptance Level
Range Min
20 - 100%
Maximum percent the current pattern must match the reference pattern
to be considered a match.
Rotation Origin
pixels (X,Y)
X, Y coordinates of the point from which ROIs will rotate.
First Match Rotation
degrees
Rotational value of the first pattern found.
First Match Location Point
pixels (X, Y)
X,Y coordinates of the first pattern found.
% Match of First Pattern Found 15 - 100%
Percent match of the first pattern found.
Communication Tool Exportable Results: Blob Detect Tool
Data Label
Value
Description
Tool Name
string
User-defined name
Execution Time
ms
Tool processing time for the current inspection.
Execution Time Min
ms
Fastest recorded tool processing time since the start of the inspection
or since power-up.
Execution Time Max
ms
Slowest recorded tool processing time since the start of the inspection
or since power-up.
Count
whole number
Number of Blobs found.
Total Area
pixels
Number of pixels when combining all Blobs found.
Largest Blob Area
pixels
Number of pixels in the largest Blob.
Banner Engineering Corp.
Minneapolis, MN USA
255
PresencePLUS Software Tools
2/2010
Data Label
Value
Description
Largest Location
pixels (X, Y)
Centroid of the largest Blob.
Smallest Blob Area
pixels
Number of pixels in the smallest Blob.
Smallest Location
pixels (X, Y)
Centroid of the smallest Blob.
Communication Tool Exportable Results: Edge Tool
Data Label
Value
Description
Tool Name
string
User-defined name
Execution Time
ms
Tool processing time for the current inspection.
Execution Time Min
ms
Fastest recorded tool processing time since the start of the inspection
or since power-up.
Execution Time Max ms
Slowest recorded tool processing time since the start of the inspection
or since power-up.
Bright-to-Dark Count whole number
Total number of bright-to-dark edges.
Dark-to-Bright Count whole number
Total number of dark-to-bright edges.
Total Edge Count
whole number
Total number of all edges.
Location(s)
pixels (X, Y)
X, Y coordinates of all the edges found.
Communication Tool Exportable Results: Geometric Count Tool
Data Label
Value
Description
Tool Name
string
User-defined name
Success
1 or 0
1 = Tool executed successfully
0 = Tool did not find a point to use as a reference
Execution Time
ms
Tool processing time for the current inspection.
Execution Time Min
ms
Fastest recorded tool processing time since the start of the inspection or
since power-up.
Execution Time Max
ms
Slowest recorded tool processing time since the start of the inspection or
since power-up.
Match Count
whole number
Total number of patterns above the minimum acceptance leval and below
the maximum number of patterns.
Rotation Origin
pixels (X, Y)
X, Y coordinates of the point from ROIs will rotate.
Match Rotation
degrees
Rotational value of the first pattern found.
Best Match Location
Point
pixels (X, Y)
X, Y coordinates of the first pattern found.
Best Match %
20-100%
Percent match of the first patttern found.
256
Minneapolis, MN USA
Banner Engineering Corp.
2/2010
PresencePLUS Software Tools
Communication Tool Exportable Results: Object Tool
Data Label
Value
Description
Tool Name
string
User-defined name
Execution Time
ms
Tool processing time for the current inspection.
Execution Time Min
ms
Fastest recorded tool processing time since the start of
the inspection or since power-up.
Execution Time Max
ms
Slowest recorded tool processing time since the start of
the inspection or since power-up.
Dark Count
whole number
Total number of dark objects.
Total Object Count
whole number
Total number of all objects.
Min Bright Object Width
pixels
Width of the smallest bright object found.
Max Bright Object Width
pixels
Width of the largest bright object found.
Min Dark Object Width
pixels
Width of the smallest dark object found.
Max Dark Object Width
pixels
Width of the largest dark object found.
Width(s)
pixels
Widths of all objects found.
Location(s)
pixels (X, Y)
Midpoint position of all the objects found.
Communication Tool Exportable Results: Pattern Count Tool
Data Label
Value
Description
Tool Name
string
User-defined name
Execution Time
ms
Tool processing time for the current inspection.
Execution Time Min
ms
Fastest recorded tool processing time since the start of the
inspection or since power-up.
Execution Time Max
ms
Slowest recorded tool processing time since the start of the
inspection or since power-up.
Match Count
whole number
Total number of patterns above the minimum acceptance
level and below the maximum acceptance level.
Match Acceptance Level Range Min 20 - 100%
Minimum percent the current pattern must match the
reference pattern to be considered a match.
Match Acceptance Level Range Min 20 - 100%
Maximum percent the current pattern must match the
reference pattern to be considered a match.
Rotation Origin
pixels (X,Y)
X, Y coordinates of the point from which ROIs will rotate.
First Match Rotation
degrees
Rotational value of the first pattern found.
First Match Location Point
pixels (X, Y)
X,Y coordinates of the first pattern found.
% Match of Pattern(s) Found
15 - 100%
Percent match of the first pattern found.
Banner Engineering Corp.
Minneapolis, MN USA
257
PresencePLUS Software Tools
2/2010
Communication Tool Exportable Results: Average Color Tool
Data Label
Value
Description
Tool Name
string
User-defined name
Success
1 or 0
1 = Tool executed successfully
0 = Tool did not find a point to use as a reference
Execution Time
ms
Tool processing time for the current inspection.
Execution Time Min
ms
Fastest recorded tool processing time since the start of the inspection or
since power-up.
Execution Time Max
ms
Slowest recorded tool processing time since the start of the inspection or
since power-up.
Communication Tool Exportable Results: Color Blob Tool
Data Label
Value
Description
Tool Name
string
User-defined name
Success
1 or 0
1 = Tool overall results passed.
2 = Tool overall results failed.
Execution Time
ms
Tool processing time for the current inspection.
Execution Time Min
ms
Fastest recorded tool processing time since the start of the inspection or
since power-up.
Execution Time Max
ms
Slowest recorded tool processing time since the start of the inspection or
since power-up.
Total Area
pixels
Total number of pixes in all the color Blobs.
Largest Blob Area
pixels
Number of pixels in the largest color Blob.
Largest Blob Location
pixels (X, Y)
Centroid of the largest color Blob.
Smallest Blob Area
pixels
Number of pixels in the smallest color Blob.
Smallest Blob Location
pixels (X, Y)
Centroid of the smallest color Blob.
Threshold
Threshold Min
Threshold Max
Count
Areas
Locations
Communication Tool Exportable Results: Color Match Tool
Data Label
Value
Description
Tool Name
string
User-defined name
258
Minneapolis, MN USA
Banner Engineering Corp.
2/2010
PresencePLUS Software Tools
Data Label
Value
Description
Success
1 or 0
1 = Tool executed successfully
0 = Tool did not find a point to use as a reference
Execution Time
ms
Tool processing time for the current inspection.
Execution Time Min
ms
Fastest recorded tool processing time since the start of the inspection
or since power-up.
Execution Time Max
ms
Slowest recorded tool processing time since the start of the inspection
or since power-up.
Color Match Test Result
Color Match Percent
%
Match Percent Threshold
%
Brightness
whole number
The grayscale brightness. This value ranges from 0 to 255.
Brightness Lower Limit
whole number
The grayscale brightness lower limit. This value ranges from 0 to 255.
Brightness Upper Limit
whole number
The grayscale brightness upper limit. This value ranges from 0 to 255.
Communication Tool Exportable Results: Barcode Tool
Data Label
Value
Description
Tool Name
string
User-defined name
Execution Time
ms
Tool processing time for the current inspection.
Execution Time Min
ms
Fastest recorded tool processing time since the start of the
inspection or since power-up.
Execution Time Max
ms
Slowest recorded tool processing time since the start of the
inspection or since power-up.
Success
Max Time Exceeded
Number Found
whole number
Coordinates of Barcodes Found
Barcode Type
Symbol Type
Number of Barcode Data Elements whole number
Read
Barcode Data Read
Barcode Read Status
2-D Symbol Dimensions
Communication Tool Exportable Results: Bead Tool
Data Label
Value
Description
Tool Name
string
User-defined name
Banner Engineering Corp.
Minneapolis, MN USA
259
PresencePLUS Software Tools
2/2010
Data Label
Value
Description
Success
1 or 0
1 = Tool overall results passed.
2 = Tool overall results failed.
Execution Time
ms
Tool processing time for the current inspection.
Execution Time Min
ms
Fastest recorded tool processing time since the start of
the inspection or since power-up.
Execution Time Max
ms
Slowest recorded tool processing time since the start of
the inspection or since power-up.
Threshold Used
Minimum Width Found
Maximum Width Found
Average Width Found
Number of Good Regions
Total Length of Good Regions
Good Region Lengths
Longest Good Region Length
Number of Narrow Regions
Total Length of Narrow Regions
Narrow Region Lengths
Longest Narrow Region Length
Number of Wide Regions
Total Length of Wide Regions
Wide Region Lengths
Longest Wide Region Length
Communication Tool Exportable Results: OCR Tool
Data Label
Value
Description
Tool Name
string
User-defined name
Success
1 or 0
1 = Tool overall results passed.
2 = Tool overall results failed.
Execution Time
ms
Tool processing time for the current inspection.
Execution Time Min
ms
Fastest recorded tool processing time since the start of
the inspection or since power-up.
Execution Time Max
ms
Slowest recorded tool processing time since the start of
the inspection or since power-up.
Max Time Exceeded
String Read
string
String Length
whole number
260
Minneapolis, MN USA
Banner Engineering Corp.
2/2010
PresencePLUS Software Tools
Communication Tool Exportable Results: OCV Tool
Data Label
Value
Description
Tool Name
string
User-defined name
Success
1 or 0
1 = Tool overall results passed.
2 = Tool overall results failed.
Execution Time
ms
Tool processing time for the current inspection.
Execution Time Min
ms
Fastest recorded tool processing time since the start of the inspection
or since power-up.
Execution Time Max
ms
Slowest recorded tool processing time since the start of the inspection
or since power-up.
Max Time Exceeded
String Read
String Length
OCV Result
Expected String
Communication Tool Exportable Results: Math Tool
Data Label
Value
Description
Tool Name
string
User-defined name
Success
1 or 0
1 = Tool overall results passed.
2 = Tool overall results failed.
Execution Time
ms
Tool processing time for the current inspection.
Execution Time Min
ms
Fastest recorded tool processing time since the start of the inspection or
since power-up.
Execution Time Max
ms
Slowest recorded tool processing time since the start of the inspection or
since power-up.
Output
Communication Tool Exportable Results: Measure Tool
Data Label
Value
Description
Tool Name
string
User-defined name
Execution Time
ms
Tool processing time for the current inspection.
Execution Time Min
ms
Fastest recorded tool processing time since the start of the inspection or since
power-up.
Execution Time Max
ms
Slowest recorded tool processing time since the start of the inspection or
since power-up.
Distance
pixels
Total distance from the points selected for Tool One and Tool Two.î
Banner Engineering Corp.
Minneapolis, MN USA
261
PresencePLUS Software Tools
2/2010
Data Label
Value
Description
Distance X
pixels
Horizontal component (X) of the total distance.
Distance Y
pixels
Vertical component (Y) of the total distance.
Origin Point
pixels (X,
Y)
X, Y coordinates of the origin point.
Measure Location Point pixels (X,Y) X,Y coordinates of the point selected for Tool One.
1
Measure Location Point pixels (X,Y) X,Y coordinates of the point selected for Tool Two.
2
Communication Tool Exportable Results: String Tool
Data Label
Value
Description
Tool Name
string
User-defined name
Success
1 or 0
1 = Tool overall results passed.
2 = Tool overall results failed.
Execution Time
ms
Tool processing time for the current inspection.
Execution Time Min
ms
Fastest recorded tool processing time since the start of the inspection or
since power-up.
Execution Time Max
ms
Slowest recorded tool processing time since the start of the inspection or
since power-up.
Max Time Exceeded
Operand 1
Operand 2
Operation Result
Communication Tool Exportable Results: Test Tool
Data Label
Value
Description
Tool Name
string
User-defined name
Success
1 or 0
1 = Tool overall results passed.
2 = Tool overall results failed.
Execution Time
ms
Tool processing time for the current inspection.
Execution Time Min
ms
Fastest recorded tool processing time since the start of the inspection or since
power-up.
Execution Time Max
ms
Slowest recorded tool processing time since the start of the inspection or since
power-up.
Input1
1, 0, or -1
1 = Input 1 results passed.
0 = Input 1 results failed.
-1 = Input1 results not defined.
262
Minneapolis, MN USA
Banner Engineering Corp.
2/2010
PresencePLUS Software Tools
Data Label
Value
Description
Input2
1, 0, or -1
1 = Input 2 results passed.
0 = Input 2 results failed.
-1 = Input2 results not defined.
Input3
1, 0, or -1
1 = Input 3 results passed.
0 = Input 3 results failed.
-1 = Input3 results not defined.
Input4
1, 0, or -1
1 = Input 4 results passed.
0 = Input 4 results failed.
-1 = Input4 results not defined.
Output
1 or 0
1 = Tool overall results passed.
0 = Tool overall results failed.
7.6.2 Coordinate Tool
The Coorodinate tool takes coordinate values from different vision tools and combines then into a single output
representing object x and y coordinates as well as a rotational offset from a default position defined in the inspection.
The Coordinate tool can accept x, y coordinates, and angle (Theta) data from an
y tool that produces locational information
as part of the results:
• Locate tool
• Geometric Find tool
• Pattern Find tool
• Blob Find tool
• Blob Detect tool
• Color Blob tool
• Pattern Count tool
• Geometric Count tool
• Edge tool
• Object tool
• Barcode tool
• BCR tool
• Measure tool
• Math tool
Note: The Coordinate tool also accepts user-defined constants for any of these values. Additionally, not all tools
(for example, Barcode) produce angle data.
The Coordinate tool can be used with the PresencePLUS Remote Command Channel (RCC), which is used to interf
ace
and operate industrial robots.
Fields
The following are fields on the Coordinate tool Input tab:
• Coordinate Tool Inputs on page 264
Supported Platforms
Banner Engineering Corp.
Minneapolis, MN USA
263
PresencePLUS Software Tools
2/2010
ProII Color ProII/ProII OMNI
1.3
Color
OMNI/OMNI AREA/AREA1.3 EDGE/EDGE GEO/GEO
1.3
1.3
1.3
BCR/BCR
1.3
Yes
Yes
No
Yes
Yes
No
No
No
Coordinate Tool Input Tab
Coordinate Tool Inputs
Tool List Filter
The Tool List Filter helps to limit the input data available for x,y coordinates and angle data. From the drop-down,
select either of the following:
• Absolute—this is the default, and enables x and y location data as well as angle information from any tools that
provide this data.
• Offset Only—which enables the selection of location offsets of x and y coordinates and angle data from location
tools.
264
Minneapolis, MN USA
Banner Engineering Corp.
2/2010
PresencePLUS Software Tools
X - Coordinate
From the drop-down list of available tools that provide x and y coordinate data, select a tool or, to enter a constant
value, select CONSTANT.
Select x or y coordinate information for that tool.
Y - Coordinate
From the drop-down list of available tools that provide x and y coordinate data, select a tool or, to enter a constant
value, select CONSTANT.
Select x or y coordinate information for that tool.
Banner Engineering Corp.
Minneapolis, MN USA
265
PresencePLUS Software Tools
2/2010
Rotation (Degrees)
From the drop-down list of available tools that provide angle data, select a tool or, to enter a constant value, select
CONSTANT.
Result
Coordinate Tool and the Remote Command Channel (RCC)
The Coordinate tool can be used with the PresencePLUS RCC to interface with industrial robots. The RCC can get or
set x,y coordinates, angle information, or the entire set of Coordinate tool data:
• get coordinate_tool_identifier returns all the Coordinate tool outputs separated by the field delimiter and bounded
by start and end frame delimters (as configured for the RCC).
• get coordtool coordinate_tool_identifier [ x | y | angle ] returns the specified Coordinate tool output.
• set coordtool coordinate_tool_identifier [ x | y | angle ] sets value for the specified input.
Note: The coordinate_tool_identifier can be a tool name or a tool number.
Examples
Set Command Example
Assuming that you have two Coordinate tools, my_coord_tool_1 and my_coord_tool_2,
to set the x coordinate of the second coordtool to 50, issue the following command:
set coordtool my_coord_tool_2 x 50
or
set coordtool 2 x 50
Get Command Example
To get the constant of the second coordtool, issue the following command:
get coordtool my_coordtool_tool_2 x
or
get coordtool 2 x
266
Minneapolis, MN USA
Banner Engineering Corp.
2/2010
PresencePLUS Software Tools
7.6.3 Math Tool
The Math tool provides basic arithmetic, inequality expressions, and statistical information for PresencePLUS
inspections. In general, the Math tool takes one or more pieces of information fromVision tools and makes mathematical
espressions out of them. The results of the Math tool's analysis are displayed in the Result windows at the bottom of
the screen.
The inputs to the Math tool are called Operands. The Operation is the mathematical expression used to analyze the
Operands.
Fields
The following are fields on the Math tool Input tab:
• Math Tool Modes on page 268
• Use of Constants on page 271
• Results on page 271
Supported Platforms
ProII Color ProII/ProII OMNI
1.3
Color
OMNI/OMNI AREA/AREA1.3 EDGE/EDGE GEO/GEO
1.3
1.3
1.3
BCR/BCR
1.3
Yes
Yes
Yes
Yes
Yes
Yes
Yes
Yes
Math Tool Input Tab
Banner Engineering Corp.
Minneapolis, MN USA
267
PresencePLUS Software Tools
2/2010
Math Tool Modes
One Operand Operation
There is only a one operation that requires a single Operand--AbsoluteValue. This Operator requires the user to provide
only one Operand.
One Operand Functions
abs
Abs (Absolute value) returns Abs(X1).
The absolute value of an operand is its unsigned magnitude. For example, Abs(-1.5) and Abs(1.5) both
return 1.5
Two Operand Operations
Two Operand Operations require two inputs (Operand 1 and Operand 2). For each operand, you specify:
• the vision tool (or a constant)
268
Minneapolis, MN USA
Banner Engineering Corp.
2/2010
PresencePLUS Software Tools
• a specific attribute of interest for that tool.
The following are classified as Two Operand Operations:
• Add
• Subtract
• Multiply
• Divide
• Greater Than
• Greater Than Equal To
• Less Than
• Less Than Equal To
• Equal To
• Diff
• Mod
• Div
Arithmetic Operations
Add
Returns (X1 + X2)
Subtract
Returns (X1 - X2 )
Multiply
Returns (X1 * X2)
Divide
Returns (X1 / X2)
Relational Operations
Greater Than
If (X1 > X2) returns True, else False.
Greater Than or Equal To
If (X1 >= X2) returns True, else False.
Less Than
If (X1 < X2) returns True, else False.
Less Than or Equal To
If (X1 >= X2) returns True, else False.
Equal To
If (X1 = X2) returns True, else False.
Banner Engineering Corp.
Minneapolis, MN USA
269
PresencePLUS Software Tools
2/2010
If the output of relational operation is used as an input for another Math
Tool, True interpreted as 1 and False interpreted
as 0.
Two Operand Functions
Diff (Difference)
Returns Abs(X1 - X2).
Returns the difference - absolute value of the difference between two operands.
Mod (Modulus)
Returns Mod(X1 / X2).
The modulus, or remainder, operator divides operand1 by operand2 and returns the
remainder.
Div (Integer Division)
Returns Div(X1 ÷ X2).
Returns the integer part of division, remainder is discarded.
Multiple Operand Operations
Multiple Operand Operations allow the user to make a long list of input data. All of these pieces of information are
inputs to the selected Operation.
For example, select Min as the Operation, and select an input tool. A tab is created for the input tool. Click on this tab
to specify the attribute(s) of the vision tool that will be the Operands. Multiple tools can contribute multiple Operands
to the list as shown in the examples below.
270
Minneapolis, MN USA
Banner Engineering Corp.
2/2010
PresencePLUS Software Tools
Math tool outputs can be sent out via a Communications tool and/or used as an input to a Test tool (or another Math
tool).
Multiple Operand Functions
Min (Minimum)
Returns Min (X1, X2, ..., Xn).
Returns the operand with the lowest value.
Max (Maximum)
Returns Max (X1, X2, ..., Xn).
Returns the operand with the highest value.
Count
Returns Count (X1, X2, ..., Xn).
Returns the count of operands.
Sum
Returns Sum (X1, X2, ..., Xn).
Returns the arithmetic sum of operands.
Mean
Returns Sum (X1, X2, ..., Xn) ÷ Count (X1, X2, ..., Xn).
Returns the mean value of operands.
Median
The statistical median is middle number of a group of numbers that ha
ve been arranged in order
by size. If there is an even number of terms, the median is the mean of the tw
o middle numbers.
StdDev (Standard
Deviation) and
Variance
The standard deviation and variance are measures of how spread out operands values are.
Use of Constants
In general, a user-defined constant can be selected as one of the Operands for the Math tool. This allows for a number
of things, including scaling the output of a vision tool in real units (by dividing that output by a known conversion
factor). Along the same lines, dynamic scaling of outputs is also possible by dividing one Operand by another and then
multiplying by a constant conversion factor. In this case, two Math tools would be used: one set for Division, the other
for Multiplication. The output of the first Math tool would be an Operand for the second Math tool.
Results
The output of the math operation selected for the inputs is diplayed in the results area of the Math tool Input tab.
Math Tool and the Remote Command Channel (RCC)
Syntax
Description
set mathtool tool_name|tool_number value operand_1|operand_2 Sets the specified tool operand, if it is a constant.
Value should be a floating number.
get mathtool tool_name|tool_number operand_1|operand_2
Banner Engineering Corp.
Gets the value of the specified tool operand, if it
is a constant.
Minneapolis, MN USA
271
PresencePLUS Software Tools
2/2010
Examples
Set Command
Example
Assuming that you have two Math tools, my_math_tool_1 and my_math_tool_2, each
with their first operand configured as a constant. To set the constant of the second mathtool
to 100.5, issue the following command:
set mathtool my_math_tool_2 operand_1 100.5
or
set mathtool 2 operand_1 100.5
To get the constant of the second mathtool, issue the following command:
Get Command Example
get mathtool my_math_tool_2 operand_1
or
get mathtool 2 operand_1
7.6.4 Measure Tool
Measure tool can be used to measure distance, calculate angles, and create points and lines for use as inputs to other
Measure Tools.
There are three Measure Tool operations:
• Measure from a point to a point
• Intersect two lines
• Measure from a line to a point
• Measure a curve to a point
• Measure a curve to a line
In these operations, points are generated by a variety of vision tools and lines are created by Coordinate tools, Line
Detect tools, or other Measure tools.
Usage
• Determine the location of a Blob
• Determine the distance between Blobs
• Determine a distance between a Blob and a closest point on a bead
• Determine a distance between a Blob and a farthest point on a bead
Fields
The following are fields on the Measure tool Input tab:
• Measure Tool Operations on page 273
• Measurement Type on page 281
Supported Platforms
ProII Color ProII/ProII OMNI
1.3
Color
OMNI/OMNI AREA/AREA1.3 EDGE/EDGE GEO/GEO
1.3
1.3
1.3
BCR/BCR
1.3
Yes
Yes
Yes
272
Yes
Yes
Yes
Minneapolis, MN USA
Yes
Yes
Banner Engineering Corp.
2/2010
PresencePLUS Software Tools
Measure Tool Input Tab
Measure Tool Operations
Measure from a Point to a Point
In this operation, the distance between two points is calculated. In addition, the X and Y components of that distance
calculation are returned.
Along with distance, the following results are generated in this operation:
• A line from point 1 to point 2
• The angle of that line (relative to the x-axis)
• The midpoint of point 1 and point 2
Intersect Two Lines
In this operation, the results of the intersection of two lines is generated. These results are:
• The angle of intersection between the two lines, measure from line 1 to line 2.
• The intersection point
Banner Engineering Corp.
Minneapolis, MN USA
273
PresencePLUS Software Tools
2/2010
Measure from a Line to a Point
In this operation, the software calculates the distance between a line and a point. This is the shortest distance from the
line to the point, and is generated by creating a line perpendicular to the original line that intersects the point. In addition,
it returns the distance calculations for the X and Y component.
Additionally, the following results are generated in this operation:
• The perpendicular line, which goes from the line to the point
• The angle of that line (relative to the x-axis)
• The intersection point between the original line and the perpendicular line
Measure from a Curve to a Point
This operation is available if a Bead Tool has been added to the inspection prior to the particular instance of the Measure
Tool being edited. In this operation, the software calculates the distance between a curve and a point. This measurement
can be from either the closest or the farthest point on the curve, and is selected in the Bead tab in the Measure Tool.
274
Minneapolis, MN USA
Banner Engineering Corp.
2/2010
PresencePLUS Software Tools
The curve, drawn in purple over the image of the bead, is an artifact generated by the bead tool. It shows the computed
center spine of the bead detected by the Bead Tool within its ROI.
The tool returns the distance calculations for the X and Y component.
Additionally, the following results are generated in this operation:
• The line connecting the two points
• The angle of that line (relative to the x-axis)
• The coordinates of the selected (farthest or closest) point on the curve
Measure from a Curve to a Line
This operation is available if a Bead Tool has been added to the inspection prior to the particular instance of the Measure
Tool being edited. In this operation, the software calculates the distance between a curve and a line produced by other
Measure Tool.
This measurement is made from either the closest or the farthest point on the curve. It is the shortest distance from the
line to the selected point, and is generated by creating a line perpendicular to the original line that intersects the selected
point on the curve. The points are selected in the Bead tab in the Measure Tool.
Banner Engineering Corp.
Minneapolis, MN USA
275
PresencePLUS Software Tools
2/2010
The curve, drawn in purple over the image of the bead, is an artifact generated by the bead tool. It shows the computed
center spine of the bead detected by the Bead Tool within its ROI.
276
Minneapolis, MN USA
Banner Engineering Corp.
2/2010
PresencePLUS Software Tools
The tool returns the distance calculations for the X and Y component.
Additionally, the following results are generated in this operation:
• The line connecting the curve and the selected line
• The angle of that line (relative to the x-axis)
• The coordinates of the selected (farthest or closest) point on the curve
Conventions of the Measure Tool
The Measure tool reports an angle associated with every line it finds, according to the following conventions:
• For the line defined by two points, the tool measures the angle between the line and the horizontal axis. The tool
assigns a positive or negative value to the angle, depending on the line's direction. Angles are positive if measured
clockwise and negative if measured counterclockwise.
Banner Engineering Corp.
Minneapolis, MN USA
277
PresencePLUS Software Tools
2/2010
• When defining the angle between two lines, the Measure tool takes into account the order of the tool inputs.The sign
of the angle from Line 1 to Line 2, for example, differs from the sign of the angle from Line 2 to Line 1. The tool
detects the intersection point of two lines. Even if they intersect outside the viewable FOV (field of view), the resulting
angle between the 2 lines is correct, and the intersection point created can be passed into other Measure tools for
distance or other measurements. Note that the X or Y coordinates of the point in this case may be negative.
How the Tool Measures Two Points
The inputs to the Measure tool for measuring two points are any two points that vision tools generate. These can be
an Edge transition, a Blob centroid, or a Geo pattern. The results include the total distance between the points and the
x- and y-component distances. In addition to finding these distance values, the Measure tool also calculates the line
between the two endpoints. The software reports the angle between this line and the camera’s horizontal plane, as well
as the coordinates for the line’s midpoint.
As shown below, the Measure tool window shows the settings and results of the inspection. In the inspection image,
the two points Edge_1 and Edge_2 define the dashed red line that runs from top left to bottom right.The actual measured
distance between the points is the solid line labeled MT_1, and the solid red triangle is the line’s midpoint. MT_1’s
direction is the direction of the measurement operation: from Edge_1 to Edge_2.
278
Minneapolis, MN USA
Banner Engineering Corp.
2/2010
PresencePLUS Software Tools
The two shorter dashed lines represent the x- and y-components. The angle between MT_1 and the horizontal plane
is the curved clockwise arrow. In the Results section of the MeasureTool window, this angle is listed as +53.11 degrees.
How the Tool Measures Two Lines
This mode finds the angle between two lines. Both inputs are existing Measure tools. The order in which these tools
are input does matter.
The intersection point can well be off the screen. This angle gives the ability to measure two lines for parallelism.
Banner Engineering Corp.
Minneapolis, MN USA
279
PresencePLUS Software Tools
2/2010
The Measure tool window to the left shows the settings and results of the inspection to the right.
The inputs are both existing Measure tools (MT_1 and MT_2).The output, called MT_3, is the angle between the lines
of each of the inputs. MT_3 is a curved counterclockwise arrow from the first input, MT_1, towards the arrowhead of
the second input, MT_2. The Results section of the measure Tool window lists this angle a -90.00 degrees. The only
other piece of information reported is the intersection point of the two best fit lines, marked by a solid red triangle.
How the Tool Measures a Line and a Point
This mode finds the shortest distance between a point and a line. The two inputs to the Measure tool are:
• any point a vision tool generates
• any line another measure tool generates.
The shortest distance between a line and a point lies along another line. This new line is perpendicular to the original
line, as shown below.
280
Minneapolis, MN USA
Banner Engineering Corp.
2/2010
PresencePLUS Software Tools
The Measure tool window to the left shows the settings and results of the inspection to the right.
In the Inspection image, the center point of BLOB_1 and the nearest point in the input line MT_1 define the dashed
red line that runs from bottom left to top right. The actual measured distance between BLOB_1 and MT_1 is labeled
MT_2. The solid red triangle shows where MT_1 and MT_2 intersect.The Results section of the MeasureTool window
lists the distance between the intersection point and the Blob midpoint as 197.55 pixels.
The two shorter dashed lines represent the x- and y-components. The angle between MT_2 and the horizontal plane
is the curved counterclockwise arrow. In the Results section of the Measure Tool window, this angle is listed as -36.89
degrees.
Measurement Type
The PresencePLUS software can perform all three Measure tool operations using the default Absolute type or the
alternate Relative type. The types differ in how the Rotation Enable feature of a one of the Location tools—Locate,
Geometric Find, and Pattern Find—affect the Measure tool.
Absolute
When the measurement type is set to Absolute, the x- and y-components of the measured distance use the absolute, or
fixed, coordinate system of the camera’s field of view (FOV). If a rotation enabled Location tool precedes the Measure
tool in the order of operation (that is, if the Location tool is to the left of the Measure tool in the Navigation/Results
window), then the x- and ycomponent values and the angle of the line change as rotation occurs.
Banner Engineering Corp.
Minneapolis, MN USA
281
PresencePLUS Software Tools
2/2010
Relative
For the Measurement type to be set to Relative, a Location-type tool must precede the Measure tool in the order of
operation. When the user selects the Relative type, the window indicates to what Locate tool the measurement is
relative.
The coordinate system of the Measure tool changes based on the rotation information the Location-type tool provides.
The x- and y-components and the angle of the measurement remain constant even if the part rotates in the camera’s
FOV. The relative Measure tool is relative to the rotation-enabled Locate tool. The part has rotated, but the x- and
y-distances and the angle of the line are largely unaffected.
282
Minneapolis, MN USA
Banner Engineering Corp.
2/2010
PresencePLUS Software Tools
Preserve Sign
When this checkmark is set, the X and Y distances are computed as distance offsets. These distance offsets are
represented by signed numbers. Negative numbers mean distance offset is toward the origin (0,0), positive numbers
mean distance offset is away from origin.
Additional Measure Tool Tabs
Measure Tool Locate Tab
Use the drop-down list to select either to Measure From the Reference Point or the Current Point. ClickMeasure Tool
on page 272 for more information about the Measure tool.
Locate Tab
Banner Engineering Corp.
Minneapolis, MN USA
283
PresencePLUS Software Tools
2/2010
Measure Tool Geometric Find/Count Tab
On the Geometric Find tab, use the drop-down list to select either to Measure From the Reference Point or the Current
Point.
On the Geometric Count tab, use the up or down arrow keys to select the Barcode to measure to. ClickMeasure Tool
on page 272 for more information about the Measure tool.
Geometric Find and Geometric Count Tabs
284
Minneapolis, MN USA
Banner Engineering Corp.
2/2010
PresencePLUS Software Tools
Geometric Count Tab
Banner Engineering Corp.
Minneapolis, MN USA
285
PresencePLUS Software Tools
2/2010
Measure Tool Pattern Find/Count Tab
On the Pattern Find tab, use the drop-down list to select either to Measure From the Reference Point or the Current
Point.
The Pattern Count tab shows the location of the Pattern Location used in the measurement. ClickMeasure Tool on
page 272 for more information about the Measure tool.
Pattern Find and Pattern Count Tabs
286
Minneapolis, MN USA
Banner Engineering Corp.
2/2010
PresencePLUS Software Tools
Pattern Count Tab
Banner Engineering Corp.
Minneapolis, MN USA
287
PresencePLUS Software Tools
2/2010
Measure Tool Blob and Color Blob Tab
From the dropdown list select the Blob #, Smallest or Largest Blob to measure to. ClickMeasure Tool on page 272 for
more information about the Measure tool.
Blob or Color Blob Tab
288
Minneapolis, MN USA
Banner Engineering Corp.
2/2010
PresencePLUS Software Tools
Measure Tool Circle Tab
The Circle tab for the selected Circle tool displays the coordinates of the circle center. ClickMeasure Tool on page 272
for more information about the Measure tool.
Circle Tab
Banner Engineering Corp.
Minneapolis, MN USA
289
PresencePLUS Software Tools
2/2010
Measure Tool Edge Tab
Use the up or down arrow keys to select the Edge Number to measure to. ClickMeasure Tool on page 272 for more
information about the Measure tool.
Edge Tab
290
Minneapolis, MN USA
Banner Engineering Corp.
2/2010
PresencePLUS Software Tools
Measure Tool Line Tab
From the drop-down list, select one of the following to display the coordinates of the specific location:
• Midpoint
• Start Point
• End Point
ClickMeasure Tool on page 272 for more information about the Measure tool.
Line Tab
Banner Engineering Corp.
Minneapolis, MN USA
291
PresencePLUS Software Tools
2/2010
Measure Tool Object Tab
Use the up and down arrow keys to select the Object Number to use as a point to measure to. ClickMeasure Tool on
page 272 for more information about the Measure tool.
Object Tab
292
Minneapolis, MN USA
Banner Engineering Corp.
2/2010
PresencePLUS Software Tools
Measure Tool Barcode Tab
Use the up or down arrow keys to select the Barcode to measure to. ClickMeasure Tool on page 272 for more information
about the Measure tool.
Barcode Tab
Banner Engineering Corp.
Minneapolis, MN USA
293
PresencePLUS Software Tools
2/2010
7.6.5 String Tool
String tool can be used to compare barcode and/or OCR strings with one and other, with Industrial protocol inputs,
or with constants.
Fields
The following are fields on the String tool Input tab:
• Operation Field on page 295
• Operand 1 Field on page 296
• Operand 2 Field on page 296
• Result Field on page 297
Supported Platforms
ProII Color ProII/ProII OMNI
1.3
Color
OMNI/OMNI AREA/AREA1.3 EDGE/EDGE GEO/GEO
1.3
1.3
1.3
BCR/BCR
1.3
Yes
Yes
Yes
294
Yes
Yes
No
Minneapolis, MN USA
No
No
Banner Engineering Corp.
2/2010
PresencePLUS Software Tools
String Tool Input Tab
Operation Field
There are three options you can select form the Operation drop-down list on the String tool Input tab:
• String Compare
• Masked String Compare
• Find Substring
Operation Option
Description
String Compare
Select String Compare from the drop-down list to compare
the strings that you select in the Operand 1 Field on page
296and Operand 2 Field on page 296 fields.
Banner Engineering Corp.
Minneapolis, MN USA
295
PresencePLUS Software Tools
2/2010
Operation Option
Description
Masked String Compare
If you select Masked String Compare, then the string
defined in Operand 2 Field on page 296 must be a contstant
defined in the field or retrieved from Industrial Ethernet.
Find Substring
If you select Find Substring from the drop-down list, then
the String tool will determine if the string specified in
Operand 1 Field on page 296 is in the string defined in
Operand 2 Field on page 296.
Operand 1 Field
Use the drop-down list in Operand 1 to select the first string for the comparison operation. The options are:
• one or more strings decoded by OCR tools (for example OCR_1, OCR_2, etc.)
• Barcode tools
• CONSTANT
• Industrial Ethernet
Operand 2 Field
Use the drop-down list in Operand 2 to select thefirst string for the comparison operation.The options depend on what
you select for an Operation Field on page 295. If you select String Compare or Find Substring, then the options are:
• one or more strings decoded by OCR tools (for example OCR_1, OCR_2, etc.)
• Barcode tools
• CONSTANT
• Industrial Ethernet
If you select Masked String Compare, then you must use a CONSTANT value either entered in the field for coming
from Industrial Ethernet. Masked String Compare does so on a positional basis; for example, it looks for characters a
position 1, 2, and 3, and 4, 5, and 6 are ignored because they are masked. Sensor-decoded strings cannot be used
because they can be of variable length.
296
Minneapolis, MN USA
Banner Engineering Corp.
2/2010
PresencePLUS Software Tools
Result Field
The Result field indicates whether or not the strings specified in Operand 1 and Operand 2 match.
Advanced Tab
Fields
The following are fields on the String tool Advanced tab:
• Options on page 298
The String tool Advanced tab provides the opportunity to refine the string matching characteristics; specifically, it
provides the opportunity to ignore things like case, special characters, whitespace and the like.
Banner Engineering Corp.
Minneapolis, MN USA
297
PresencePLUS Software Tools
2/2010
Options
The Options on the Advanced tab provide for more fine-grained tuning of string matching parameters. You can select
any or all of the options.
Option
Description
Ignore Case
Match the same letters that are
only different in their case.
Ignore Special
Ignore special characters.
298
Match Results
Minneapolis, MN USA
Banner Engineering Corp.
2/2010
Option
PresencePLUS Software Tools
Description
Match Results
Ignore Whitespace Ignore whitespace.
Ignore Numbers
Ignore any numbers
Banner Engineering Corp.
Minneapolis, MN USA
299
PresencePLUS Software Tools
2/2010
Option
Description
Ignore Alphabets
Ignore any alphabetic characters
300
Match Results
Minneapolis, MN USA
Banner Engineering Corp.
2/2010
PresencePLUS Software Tools
String Tool and the Remote Command Channel (RCC)
Syntax
Description
set stringtool tool_name|tool_number operand_1|operand_2 value Sets the specified tool operand, if it is a constant.
Value should be a quoted string (see Character
Strings on page 331).
get stringtool tool_name|tool_number operand_1|operand_2
Gets the value of the specified tool operand, if it
is a constant.
Examples
Set Command
Example
Assuming that you have two String tools, my_string_tool_1 and my_string_tool_2, each
with their first operand configured as a constant. To set the constant of the second stringtool
to foobar, issue the following command:
set stringtool my_string_tool_2 operand_1 foobar
or
set stringtool 2 operand_1 foobar
Get Command Example
To get the constant of the second stringtool, issue the following command:
get mathtool my_string_tool_2 operand_1
or
get stringtool 2 operand_1
7.6.6 Test Tool
The Test tool uses Boolean logic to combine or convert tool results. Its data can be used to evaluate the results of a
single tool or multiple tools. The output of the Test tool can be used to input to another Test tool or to generate a
discrete output. Additionally, a discrete input can be tied to a Test tool.
The Test tool displays the result ranges it is using as judgement criteria. Typically, these ranges are automatically set
by Quick Teach or by teaching the inspection. Additionally, they can be manually set or modified either before or after
teaching or running the inspection, in which case Quick Teach will discard any manually entered values. The Test tool
also displays the results of the last image evaluated while setting up or running the inspection.
For inspections with many Vision tools, the Test tools can be linked together.
Usage
• Gather results from image processing tools and discrete inputs
• Establish parameters for desired inspection results
• Tie multiple results together with logic options
• Include results in the overall Pass/Fail criteria
• Activate an output based on the inspection results
Fields
The following are fields on the Test tool Input tab:
• Logic on page 302
• Inputs on page 303
Banner Engineering Corp.
Minneapolis, MN USA
301
PresencePLUS Software Tools
2/2010
• Enabling Remote Teach on page 303
• Pass/Fail Contribution on page 303
• Tool Tabs in the Test Tool Window on page 304
Supported Platforms
ProII Color ProII/ProII OMNI
1.3
Color
OMNI/OMNI AREA/AREA1.3 EDGE/EDGE GEO/GEO
1.3
1.3
1.3
BCR/BCR
1.3
Yes
Yes
Yes
Yes
Yes
Yes
Yes
Yes
Test Tool Input Tab
Logic
Use logic to combine multiple inputs to the Test tool. The results at the inputs and the logic option selected will
determine whether the Test tool is True or False.
302
Minneapolis, MN USA
Banner Engineering Corp.
2/2010
PresencePLUS Software Tools
Inputs
Choose previous tools or external inputs that need to be evaluated to pass the Test tool. When a tool is chosen, another
tab pops up in the Test tool window.
Note: The tool to be evaluated must appear before the Test tool in the Navigation window.
Select Invert to invert the individual input. If the input is True, Invert reverses it to False. If the input is False, Invert
reverses it to True.
Enabling Remote Teach
The Remote Teach function is a method of remotely updating inspection parameters in Run mode. Vision tools and
Test tools can be selected to be taught or not taught. To remotely teach an inspection, the Remote Teach function must
be enabled on each tool to be taught.
Pass/Fail Contribution
Check this box if the Test tool will influence the Pass/Fail status of the inspection. Do not check this box if the overall
Pass/Fail status of the inspection is not dependent on the current Test tool. The Pass/Fail contribution influences the
following:
• Discrete output Pass
• Discrete output Fail
• Pass/Fail results counter
• Pass (Green) and Fail (red) LEDs on the Sensor
• Freezing an image on the video monitor
• Display options on the PC
Banner Engineering Corp.
Minneapolis, MN USA
303
PresencePLUS Software Tools
2/2010
Tool Tabs in the Test Tool Window
For each tool selected in the Input tab as Input 1, 2, 3, or 4, the software displays a tab.
Tool Options
Tool
Values
Locate
Not Available
Pattern Find
Not Available
Geometric Find
Not Available
Average Gray Scale
Average Gray Scale
Min/Max/Tolerance % *
BLOB
Count
Min/Max
Largest Area
Min/Max/Tolerance % *
Smallest Area
Min/Max/Tolerance % *
Total BLOB Area
Min/Max/Tolerance % *
Bright-to-dark (edge count)
Min/Max
Dark-to-bright (edge count)
Min/Max
All (edge count
Min/Max
Count
Min/Max
Edge
Object
Options
• Bright object
• Dark object
• All (bright or dark)
Width (pixels)
Min/Max
• Bright
• Dark
304
Minneapolis, MN USA
Banner Engineering Corp.
2/2010
PresencePLUS Software Tools
Tool
Values
Options
Geometric Count
Match count
Min/Max
Measure
Distance
Min/Max/Tolerance % *
Distance X
Distance Y
Test
True/False value
Pass/Fail Contribution
Communication
Success/Fail
Pass/Fail
Discrete Inputs 1-6
ON/OFF
System Error
True/Fale
Test Tool Average Gray Scale Tab
Tool Options
Values
Options
Gray Scale
Min/Max/Tolerance % *
Deviation
Min/Max /Tolerance %
Test Tool Average Gray Scale Tab
Banner Engineering Corp.
Minneapolis, MN USA
305
PresencePLUS Software Tools
2/2010
Test Tool Blob and Color Blob Tab
Indicates if the result is a MATCH or NO MATCH.
Test Tool Color Blob Tab
306
Minneapolis, MN USA
Banner Engineering Corp.
2/2010
PresencePLUS Software Tools
Test Tool Circle Tab
Values
Options
Radius
Min/Max/Tolerance %
Radius Min
Min/Max/Tolerance %
Radius Max
Min/Max/Tolerance %
Circumference
Min/Max/Tolerance %
Banner Engineering Corp.
Minneapolis, MN USA
307
PresencePLUS Software Tools
2/2010
Values
Options
Average Error
Min/Max/Tolerance %
Test Tool Circle Tab
Test Tool Edge Tab
Values
Options
Bright to Dark
Min/Max
Dark to Bright
Min/Max
Total
Min/Max
Test Tool Edge Tab
308
Minneapolis, MN USA
Banner Engineering Corp.
2/2010
PresencePLUS Software Tools
Test Tool Geometric Count Tab
Values
Options
Count
Min/Max
Test Tool Geometric Count Tab
Banner Engineering Corp.
Minneapolis, MN USA
309
PresencePLUS Software Tools
2/2010
Test Tool Line Tab
Values
Options
Line Length
Min/Max/Tolerance %
Angle (Degrees)
Min/Max/Tolerance %
Worst Distance
Min/Max/Tolerance %
Average Error
Min/Max/Tolerance %
310
Minneapolis, MN USA
Banner Engineering Corp.
2/2010
PresencePLUS Software Tools
Test Tool Line Tab
Test Tool Pattern Count Tab
Test
Values
Options
Match Count
Count
Min/Max
Test Tool Pattern Count Tab
Banner Engineering Corp.
Minneapolis, MN USA
311
PresencePLUS Software Tools
2/2010
Test Tool Object Tab
Test
Values
Options
Count
Bright Object
Min/Max
Dark Object
Min/Max
Totabl Object
Min/Max
Select
Object
All
Width (px)
Object #
Min/Max/Tolerance %
Test Tool Object Tab
312
Minneapolis, MN USA
Banner Engineering Corp.
2/2010
PresencePLUS Software Tools
Test Tool Average Color Tab
Category
Values
Options
Averages
Hue
Begin/End/Tolerance %
Saturation
Min/Max /Tolerance %
Intensity
Min/Max /Tolerance %
Hue
Min/Max /Tolerance %
Standard Deviations
Banner Engineering Corp.
Minneapolis, MN USA
313
PresencePLUS Software Tools
Category
2/2010
Values
Options
Saturation
Min/Max /Tolerance %
Intensity
Min/Max /Tolerance %
Test Tool Average Color Tab
314
Minneapolis, MN USA
Banner Engineering Corp.
2/2010
PresencePLUS Software Tools
Test Tool Color Match Tab
Indicates whether there is a color MATCH or NO MATCH.
Test Tool Color Match Tab
Banner Engineering Corp.
Minneapolis, MN USA
315
PresencePLUS Software Tools
2/2010
Test Tool OCR Tab
Test
Values
Options
String Length
Count
Min/Max
Data Read
String
Test Tool OCR Tab
Test Tool OCV Tab
Indicates where the String matches or not.
Test Tool OCV Tab
316
Minneapolis, MN USA
Banner Engineering Corp.
2/2010
PresencePLUS Software Tools
Test Tool Math Tab
Indicates where the String matches or not.
Test Tool MathTab
Banner Engineering Corp.
Minneapolis, MN USA
317
PresencePLUS Software Tools
2/2010
Test Tool Measure Tab
Indicates where the String matches or not.
Test Tool Measure Tab
318
Minneapolis, MN USA
Banner Engineering Corp.
2/2010
PresencePLUS Software Tools
Test Tool Test Tab
Indicates whether the test
Test Tool TestTab
Banner Engineering Corp.
Minneapolis, MN USA
319
Communication Tool Setup
Chapter 8
To set up the Communication tool, click on the System button in the Main Menu toolbar to bring up the System Setup
window, then click on the Communication tab.
8.1 Ethernet Connection
In order to establish an Ethernet connection , the external device must be directed to the correct IP address and the
correct TCP port. In TCP/IP protocol, a TCP port number is used with the IP address to identify a specific path or
socket. The sensor has sockets 1 to 10, and can send out unique sets of data to 10 different devices.
Valid user TCP/IP port numbers are in the range of 1024 through 65535. The PresencePLUS GUI provides automatic
notification if you attempt to use a reserved port.
To view an Ethernet connection:
1. Click on the System button in the Main Menu toolbar to bring up the System Setup window.
2. Click on the Communication tab.
3. Choose a connection from the fixed Connection drop-down list of the Communication Tool Setup field.
Each Ethernet socket has a unique TCP port number as shown below
Banner Engineering Corp.
Minneapolis, MN USA
321
Communication Tool Setup
2/2010
Note: The following addresses are defaults.
Socket
Default IP Address
Port
1
192.168.0.1
20000
2
192.168.0.1
20001
3
192.168.0.1
20002
4
192.168.0.1
20003
5
192.168.0.1
20004
6
192.168.0.1
20005
7
192.168.0.1
20006
8
192.168.0.1
20007
9
192.168.0.1
20008
10
192.168.0.1
20009
8.2 Serial Connection
The sensor has a single serial connection that you can configure, Serial 1:
• Serial 1 is the DB-9 connector.
Note: The Pro has 2 serial connections. Serial 2 in the dropdown list is to support those sensors.
Attribute
Default Setting
Baud Rate
115200
Data Bits
8
Parity
None
Stop Bit
1
Flow Control
None
To setup a serial connection:
1. Click on the System button in the Main Menu toolbar to bring up the System Setup window.
2. Click on the Communication tab.
3. Choose Serial 1 from the Connection drop-down list of the Communication Tool Setup field.
322
Minneapolis, MN USA
Banner Engineering Corp.
2/2010
Communication Tool Setup
Note:
Because there is no flow control for the serial connections, the sensor wil not detect or log a lost or broken
connection
8.3 Overview of Testing the Communication Tool
1.
2.
3.
4.
5.
Connect the Sensor to a PC using a crossover Ethernet cable (STPX. ) or the serial pins on the Sensor cable.
Start an inspection that has a configured Communication tool. For details about configuring the Communication.
Start HyperTerminal or Telnet.
Trigger the Sensor.
Look in HyperTerminal or Telnet to see if the data has updated.
8.4 Detailed Steps for Testing the Communication Tool
There a number of software programs such as Telnet and HyperTerminal that can test the connection with the
Communication tool.
• Telnet can test Ethernet communications and is relatively easy to set up.
• HyperTerminal can test both serial and Ethernet communications, but note that HyperTerminal for Windows NT
does not have an Ethernet option.
8.4.1 Testing Ethernet Communications
To test Ethernet communications with Telnet:
Banner Engineering Corp.
Minneapolis, MN USA
323
Communication Tool Setup
1.
2.
3.
4.
2/2010
Start an inspection that has a configured Communication tool.
Connect a PC to the controller using an Ethernet crossover cable.
From the Start menu, click Start > Run.
In the dialog box, type:
telnet controller_ip_address ip_port
Example: telnet 192.168.0.22 20000
5. Click OK to open a Telnet window.
6. Trigger the sensor.
7. View the results.
To test Ethernet communications with HyperTerminal:
1.
2.
3.
4.
5.
Start an inspection that has a configured Communication tool.
Connect a PC to the controller using an Ethernet crossover cable.
Start a new connection with HyperTerminal.
Connect using TCP/IP (Winsock).
Configure HyperTerminal to talk with the controller. For example:
• Host Address: 192.168.0.1
• Port Number: 20000 (Ethernet Socket 1)
6. Trigger the sensor.
7. View the results.
8.4.2 Testing Serial Communications
To test serial communications with Telnet:
1.
2.
3.
4.
5.
Start an inspection that has a configured Communication tool.
Connect a PC to the sensor using a serial cable.
Start a new connection with HyperTerminal.
Connect using COM1 (choose a serical COM port).
Configure HyperTerminal to talk with the sensor. For example:
• Baud rate = 1155200 bits/sec (sensor default).
• Data bits = 8 (sensor default)
• Parity = None (sensor default)
• Stop Bits = 1 (sensor default)
• Flow Control = None
6. Trigger the sensor.
7. View the results.
8.5 Troubleshooting Ethernet Connections
1. Check the LEDs on teh sensor's RJ-45 connetor.
• No LEDs are ON: the cable may not be the correct type (straight or crossover), or it could be broken.
• Only the yellow LED is ON: the electrical connection is good, but the sensor device are not exchanging data.
• Yellow LED is ON and the green LED is ON orflashing: data are being exchanged between the PC and the sensor.
2. Verify that the Communication tool is configured correctly.
• The connection should be Ethernet socket 1 - 10.
• Verify that you have selected the desired result data in the Tool tab.
324
Minneapolis, MN USA
Banner Engineering Corp.
2/2010
Communication Tool Setup
3. Check the receiving device setup.
• Check the IP address. The device IP subnet must match the sensor IP subnet.
• Check the Port number: 20000 - 20009 (not 2000).
• Check all firewall and anti-virus software to verify that it is not blocking the sensor's Ethernet socket.
8.6 Troubleshooting Serial Connections
1. Verify the hardware.
• Check for breaks in the serial cable.
• Use a straight serial cable from the sensor to the PC.
• When using the terminal strip connector, the common wire (pin 5 on a DB-9) goet to Common on the terminal
strip (pin2).
2. Verify that the Communication tool is configured correctly.
• Use Serial 1 for the DB-9 connection and Serial 2 for the terminal strip.
• Verify that the desired result data has been checked.
3. Check the receiving device setup.
• Check the receiving device setup.
• Check that the COM port properties on teh receiving device matches the System parameters in the sensor (baud
rate, data bits, parity, stop bits, and flow control).
8.7 Remote Command Channel Configuration
This section describes the commands that are supported to communicate with a Vision sensor. All commands are
case-insensitive
8.7.1 Remote Command Set
All RCC commands are case-insensitive. Valid characters for commands are 7-bit ASCII alphabetic or numeric
characters (A-Z, a-z, 0-9), dash (-) and underscore (_).
All commands have the following structure:
ACTiON OBJECT_IDENTIFIER QUALIFIER(S)
ACTION is an operation the user intends to perform on the OBJECT_IDENTIFIER. There are three possible actions
available:
• GET — used to retrieve information associated with the named object. This information can be a Boolean value, and
unsigned or signed number, a string or, for complex objects like the Communications tool, a field-delimited record
that includes other data types.
• SET — used to assign a value to a named object.
• EXEC — used to execute a pre-defined functional object or activity in the sensor. Activities may take object identifiers
as parameter qualifiers.
The table below identifies objects that are supported in the current RCC release, their identi
fiers, and the corresponding
actions that they will support. Items highlighted in bold are command keywords. Flag objects are appended with the
FLG suffix, status objects are appended with the STS suffix, and counters are appended with the CNT suffix.
Banner Engineering Corp.
Minneapolis, MN USA
325
Communication Tool Setup
2/2010
System Object,
Component, or
Activity
Object or
Activity
Identifier
Support Actions Required
Qualifiers
Trigger
TRIGGER
EXEC
None
Optional
Qualifiers
Comments
Timeout (msec)
If no qualifiers are
specified, a 30
second timeout is
used.
or
NOWAIT
Product Change
PRODCHANGE EXEC
Numeric Inspection Timeout (msec)
ID
or
By default, a 30
second timeout is
used.
NOWAIT
Counter or Flag
Reset
RESET
EXEC
SYSERRFLG
None
Reset either the
System Error Flag,
Pass and Fail
counters, or
Missing Trigger
count.
or
PASSFAILCNT
or
MISSTRIGCNT
Remote Teach
RTEACH
EXEC
None
TRIGGER or
TRIGGER
NOWAIT or
TRIGGER
Timeout (msec)
Enables remote
teach. If no
qualifiers are
specified, remote
teach will occur on
the next trigger. If
TRIGGER
qualifier is
specified, remote
teach will occur
immediately, and
the command will
block until a
default 30-second
timeout expires. If
TRIGGER
NOWAIT is
specified, remote
teach will occur
immediately, and
the command will
return right away.
If a timeout value
is specified, the
command will
block until the
specified timeout
expires.
Online Status
ONLINESTS
GET
None
None
Retrieve the sensor
online status.
Ready State
READYFLG
GET
None
None
Returns 1 if the
camera is ready, 0
otherwise
326
Minneapolis, MN USA
Banner Engineering Corp.
2/2010
Communication Tool Setup
System Object,
Component, or
Activity
Object or
Activity
Identifier
Support Actions Required
Qualifiers
Optional
Qualifiers
Comments
Current
Inspection
Number
INSPNUM
GET
None
None
Retrieve currently
running inspection
GET
None
CommTool
Numberor
CommTool
Name
Retrieve comm
tool results, either
by specifying its
sequential number
in the inspection
(1,2,..,n) or by
specifying its
name. By default,
data for the first
comm tool will be
retrieved.
Pass/Fail flag
PASSFAILFLG GET
None
None
Retrieve the value
of the Pass/Fail
flag - 1 if pass, 0 if
fail
System Error
SYSERRFLG
GET
None
None
Retrieve the value
of the System
Error - either 0 or
1
Frame Number
FRAMENUM
GET
None
None
Retrieve the
current frame
number
Pass Count
PASSCNT
GET
None
None
Retrieve the pass
count
Fail Count
FAILCNT
GET
None
None
Retreive the failed
count
Iteration Count
ITERCNT
GET
None
None
Retrieve the
Iteration Count
System Error
Count
SYSERRCNT
GET
None
None
Retrieve the
system error count
Missed Trigger
Count
MISSTRIGCNT GET
None
None
Retrieve the
missed trigger
count
I/O Line Status
IOSTS
GET
I/O line id,
numeric, either 1
through 4 or 1
through 6
None
Retrieve the
cached status of
the I/O line
Gain
GAIN
GET
None
Retrieve the gain
Gain
GAIN
SET
None
Set the gain
Exposure
EXPOSURE
GET
None
Retrieve the
camera exposure
Communications COMMTOOL
Tool Results
Banner Engineering Corp.
Positive Integer
Minneapolis, MN USA
327
Communication Tool Setup
2/2010
System Object,
Component, or
Activity
Object or
Activity
Identifier
Support Actions Required
Qualifiers
Optional
Qualifiers
Comments
Exposure
EXPOSURE
SET
Positive Number
None
Get the camera
exposure
Frame Number
Tag
FRAMETAG
SET
ENABLE
None
Enables frame
number as
command
acceptance
indicator
Frame Number
Tag
FRAMETAG
SET
DISABLE
None
Disables frame
number as
command
acceptance
indicator
Frame Number
Tag
FRAMETAG
GET
None
None
Retrieve the status
of the frame tag
indicator
8.7.2 RCC Return Values
RCC return values are numeric, and are listed below:
• 0 - command accepted. This return code is generated when a valid SET, GET, and EXEC command has been completely
handled by the sensor. It may be followed by a command-specific return value or a completion code.
If the frame tag is enabled, the current frame number will be returned instead of 0 as command acceptance indicator.
• -100 - Invalid command entered by the user.
• Trigger and Product Change error codes:
• -201 - Product change command attempted in the middle of the inspection
• -202 – Trigger command attempted in the middle of product change
• -203 – Trigger command is attempted when the inspection is not executing (sensor is idle)
• -204 – Specified inspection slot is out of range
• -205 – Trigger command attempted in the middle of the inspection
• -206 – Product change command attempted in the middle of a product change
• -207 – Product change command attempted while the sensor is in the Teach mode
• -208 – Product change attempted when the GUI is connected, and the inspection is not executing
• Comm tool error codes
• -301 – get/set tool command attempted while the inspection is not executing
• -302 – get command issued before inspection is triggered for the first time – tool results unavailable
• -303 – get/set tool command attempted in the middle of the inspection
• -304 – get/set tool command attempted in the middle of the product change
• -305 – Tool specified in get/set command not found in the inspection
• -306 – Requested comm tool is not configured for RCC
• -307 - Tool executed with an error or did not execute
• -308 - Specified tool operand is not a constant, and cannot be modified
• Reset command error codes
• -401 – Reset command attempted in the middle of the inspection
• -402 – Reset command attempted in the middle of the product change
328
Minneapolis, MN USA
Banner Engineering Corp.
2/2010
Communication Tool Setup
• -500 – RCC commands are not accepted because the sensor is in the Playback mode
• Timeout error codes
• -600 – Product change timeout occurred
• -601 – Trigger timeout occurred
• -700 – Specified value is out of range
• -701 – Set Gain command attempted when the GUI is connected and the inspection is not executing
• -702 – Set Exposure command attempted when the GUI is connected and the inspection is not executing
• -800 – Product Change, Trigger or Get Commtool command attempted when either Product Change or Trigger
Command timeout occurred, but the operation has not yet completed.
8.7.3 Frame Tag Numbers
RCC provides user with a debug facility that allows users to correlate command completion with current frame numbers.
This facility is enabled by issuing a SET FRAMETAG ENABLE command. This command will cause RCC to send
the current frame number as the command acceptance code. This will allow users to track when each command was
issued, and which frame it applies to.
For EXEC TRIGGER command, returned number will be the frame number at the completion of the inspection
execution.
For EXEC TRIGGER command, returned number will be the frame number at the completion of the inspection
execution.
For all other commands, the returned number is the current frame number.
8.7.4 Command Processing
RCC commands are interpreted in the context of the running PPVS system. Due to the constantly changing system
state caused either by external action or by previous RCC commands, certain rules are imposed on RCC command
acceptance and processing. Please note that command acceptance does not constitute successful completion of the
command.
1. EXEC TRIGGER command can be successfully accepted under the following conditions:
• Inspection is Executing and is Ready
2. EXEC PRODCHANGE command can be successfully accepted under the following conditions:
• Sensor is idle (inspection is not loaded), and the GUI is not connected
• Inspection is Executing and is Ready
• Sensor was previously product changed to an invalid slot
3. EXEC RESET command can be successfully accepted under the following conditions:
• Sensor is idle (inspection is not loaded)
• Inspection is Executing and is Ready
4. SET GAIN or SET EXPOSURE commands can be successfully accepted under the following conditions:
• Inspection is Executing and is Ready
5. GET status, counter or flag commands can be accepted at any time. If issued when inspection is Executing but is
not Ready, these values may change as the inspection is executing.
6. GET COMMTOOL command can be successfully accepted if the inspection has been loaded. However, RCC may
not have valid data until the inspection has been triggered (executed) at least once.
Commands with timeouts, such as EXEC TRIGGER and EXEC PRODCHANGE, will block processing of additional
commands while they are executing if they are invoked without the NOWAIT option. Additional commands that are
issued while processing is blocked will be queued, and will be processed in the order that they were received when the
blocking command finishes its execution.
Banner Engineering Corp.
Minneapolis, MN USA
329
Communication Tool Setup
2/2010
When blocking commands, such as EXEC TRIGGER and EXEC PRODCHANGE, are invoked with the NOWAIT
option, GET commands that retrieve flags and status are accepted for processing. All other commands are rejected
with an appropriate error code.
8.7.5 RCC Log
RCC Log allows users to monitor and troubleshoot communication inputs and outputs.
Log consists of a circular buffer with up to 400 entries. These entries can be one of three types:
• IN – characters received in the input stream
• CMD – commands that were extracted after the frame start and frame end delimiters have been received
• OUT – formatted command output, with frame delimiters already included.
Log entries are time stamped with system time and sorted in the order they were received.
Non-displayable ASCII characters are shown in the ASCII Hex string form. The ASCII Hex strings are preceded by
character sequence “\x” (backslash-lower-case-x). The ASCII Hex string will always be two characters long. For
example, NULL will be converted to “\x00”, and carriage return will be converted to “\x0D”. To represent ASCII Hex
digits, only upper case letters, A-F, are used.
Sample RCC log is given below:
0000000118.116
0000000118.116
0000000118.116
0000000118.116
0000000118.116
0000000118.116
0000000118.116
0000000118.116
0000000118.116
0000000118.116
0000000118.116
0000000118.116
0000000118.116
0000000118.116
0000000118.116
0000000118.483
IN
IN
IN
IN
IN
IN
IN
IN
IN
IN
IN
IN
IN
IN
CMD
OUT
e
x
e
c
t
r
i
g
g
e
r
\x0D
\x0A
exec trigger
0\x0D\x0A
In this example, command exec trigger was sent to RCC interface. The interface was configured to use no start frame
delimiter, and carriage return (\x0D) and line feed (\x0A) as frame delimiters. As soon as valid frame delimiters were
received, the command exec trigger was sent for processing, and the command response was sent back after inspection
finished executing.
8.7.6 Frame and Field Delimiters
The PresencePLUS GUI includes a drop-down list of Frame delimiters as follows:
• <none> for no delimiter
• \r for carriage return (<CR>)
• \n for line feed (LF)
• \r\n for carriage return followed by a line feed (CR-LF)
• \n\r for line feed followed by a carriage return (LF-CR)
In addition to the above field delimiters, you can enter other delimiter types keeping in mind the following:
• ASCII hex format can be used as a delimiter
• a NULL character can be used as a delimiter (specified in ASCII hex format)
• Frame delimiters can be multi-character sequences up to 20 characters long
The PresencePLUS GUI includes a drop-down list of Field delimiters as follows:
330
Minneapolis, MN USA
Banner Engineering Corp.
2/2010
Communication Tool Setup
• <none> for no delimiter
• , for comma
• ; for semi-colon
• : for colon
• <SPC> for space
• \t for tab
In addition to the above field delimiters, you can enter other delimiter types keeping in mind the following:
• ASCII hex format can be used as a delimiter
• a NULL character can be used as a delimiter (specified in ASCII hex format)
• Field delimiters can be multi-character sequences up to 10 characters long
Character Strings
Communications Tool configured for Barcode or String Tool output may produce strings that contain non-printable
ASCII characters, such as carriage returns, line feeds, and characters in the upper ASCII range.
To output these strings, the following encoding rules are used:
• Tool output strings will be enclosed in double quote characters, “.
• Any non-printable ASCII character, including NULL, will be converted to its ASCII Hex equivalent. The ASCII Hex
string will be preceded by character sequence “\x” (backslash-lower-case-x). The ASCII Hex string will always be
two characters long. For example, NULL will be converted to “\x00”, and carriage return will be converted to “\x0D”.
To represent ASCII Hex digits, only upper case letters, A-F, will be used.
• Any backslash encountered in the Barcode or StringTool data will be converted to its ASCII Hex equivalent, “\x5C”.
• Any double quote encountered in the Barcode or String Tool will be converted to its ASCII Hex equivalent, “\x22”.
For RCC input strings, the formatting rules are expanded to accommodate readability as follows:
• Carriage return can be specified as character sequence "\r" (backslash-r).
• Line feed can be specified as character sequence "\n" (backslash-n).
• Double quote can be specified as character sequence "\"" (backslash-doublequote).
• Backslah can be specified as character sequence "\\" (backslash-backslash).
• tab can be specified as character sequence "\t" (backslash-t).
• Embedded NULLL characters are not allowed.
Banner Engineering Corp.
Minneapolis, MN USA
331
Communication Tool Setup
332
2/2010
Minneapolis, MN USA
Banner Engineering Corp.
Teach
Chapter 9
The inspection parameters can be taught automatically by using the Teach function. There are two Teach options:
Quick Teach and Teach. The Quick Teach button is in the Tools window, and the Teach button is in the Main Menu
toolbar.
9.1 Quick Teach
Use Quick Teach to set the Pass/Fail parameters based on the reference image. This is a fast way to start inspecting
products with minimal effort. This method works best when the reference image is a good representation of all the
parts. If the good parts can vary in appearance, standard Teach is a better option.
Click the Quick Teach button to trigger the following events:
1. The results calculated from the reference image are transferred to the minimum and maximum fields in the Test
tool.
2. If a tool’s Results field includes a tolerance (e.g., shortest distance), then the additional tolerance is calculated
(default is 10%).
3. The Save window prompts the user to save the inspection on the Sensor.
4. The software proceeds to the Run screen.
Caution: Quick Teach will overwrite all the minimum and maximum values in the Test tool. If values were
entered manually, or no changes are desired, go directly to Run without clicking Quick Teach.
9.2 Teach
Use Teach to automatically set the Pass/Fail parameters based on a sample of good parts. Instead of using the reference
image as the good part, Teach uses new good parts that are presented to the sensor under running conditions.
Note: The Teach screen looks very similar to the Run screen. Verify that the sensor is at the Run screen and not
the Teach screen before running an inspection.
There is no limit to the sample size during the Teach process. Teach will only expand the parameter window. If the
current tolerances were greater than the sample set shown during the Teach process, then the Sensor will retain the old
tolerances. Use Teach when there is a large part variation between the good parts.
Caution: Only use good parts with Teach. A taught bad part will pass the inspection.
9.3 Teach Screen
To display the Teach screen, click the Teach button on the Main Menu toolbar, or click the Next button on the Tools
screen Build tab.
Use the Teach screen to automatically set judgment tolerances to accommodate all variations of good product. After
teaching the inspection, typically proceed to the Run screen to run it.
Banner Engineering Corp.
Minneapolis, MN USA
333
Teach
2/2010
Note: Before entering the Run screen, a pop-up prompts the user to save the inspection. Save the inspection to
one of the memory locations on the Sensor. As an alternative to teaching, enter judgment tolerances in the Results
tab in the Test tool, and run the inspection without teaching.
9.3.1 Teaching an Inspection
Teaching on a number of known good samples finds acceptable variations and automatically sets the judgment tolerances
to accommodate the full range of acceptable results.
Several Teach parameters may be selected in the Teach tool’s Teach tab, such as how many images to consider during
a teaching session and what type of captured images to display.
Teach Screen Field/Button
Description
• Use All to not limit the Teach sample size. All is the
default.
• Use Count to have the Sensor automatically stop the
Teach process after a set number of samples.
Use the Count option when there is a known sample set
size. Use the arrows to increase or decrease the sample
size. When the sample size is reached, the Sensor will
334
Minneapolis, MN USA
Banner Engineering Corp.
2/2010
Teach Screen Field/Button
Teach
Description
stop the Teach process, and the Start/Stop button will
return to displaying Start.
The Sensor must receive an external trigger (pin 3) to
accept a sample.
Determines when information is updated on the PC.
• Next Pass: Display the next passing inspection.
• Next Fail: Display the next failed inspection.
• Next: Display the next available inspection.
• None: Do not display inspections.
Capture Control determines how often information is
updated on the PC.
• Latched: Sets the Display option to None after an
inspection is displayed to prevent displaying additional
inspections.
• Continuous: Continuously updates the inspection
information according to the display option.
Note: The display may not capture every
inspection.
• Image Enable: Determines if the image is included in
the result information. If checked, the inspection image
and results will update upon capture. If unchecked, only
the results will update upon capture.
Note: Displaying the image on the PC will add to
the inspection time.
Teach Counts tracks the number of samples used in each
Teach process. Teach ignores samples that fail. Samples
fail for the following reasons:
• An Edge tool before the Test tool fails.
• A Locate tool before the Test tool fails.
• Measure tool fails to find two points.
• Time-out error.
• An ROI rotates or translates off the screen.
Click the Reset Teach button to clear all previously
gathered data.
Start
Click the Start button to start the Teach routine.
Stop
Click the Start button to stop the Teach routine.
Next
When you click the Next button, the software prompts
you to save the inspection, and then it continues on to the
Run screen.
Banner Engineering Corp.
Minneapolis, MN USA
335
Teach
2/2010
9.4 Remote Teach
This section explains teaching inspections on good product using Remote Teach.
9.4.1 Understanding Remote Teach
The Remote Teach function is a method of remotely updating inspection parameters in Run mode. Vision tool(s) and
Test tool(s) can each be selected to be taught. To remotely teach an inspection, the Remote Teach function must be
enabled on each tool to be taught.
Note: The Location tools, the Measure tool, and the Communication tool are not affected by Remote Teach.
The sequence of events in the sensor is as follows:
1. With the sensor in Run mode (and Ready), pulse the Remote Teach line (Pin 2, gray wire).
2. The sensor recognizes that the Remote Teach line is active and waits for the next valid trigger.
3. At the next valid trigger, Ready goes inactive (the Green Ready LED shuts OFF), and the sensor acquires a new
image.
4. The sensor adjusts the ROI (if the inspection uses Location tools).
5. The Vision tool learns the new pattern and performs the analysis.
6. The sensor adjusts the minimums and maximums in the Test tool (if the Test tool is enabled for Remote Teach).
7. The inspection indicates Pass if the pattern meets the requirements of theVision tool and (if the Test tool is enabled
for Remote Teach) if the evaluation of the Test tool(s) passes with the adjusted minimums and maximums.
8. The inspection will Fail if the Vision tool(s) or the Test tool(s) fails. If the inspection fails, another Remote Teach
sequence or user intervention is required.
9.4.2 Remotely Teaching a Tool
To remotely teach a tool, the user must enable Remote Teach on each tool to be taught. This can be accomplished by
clicking on the Enable Remote Teach box in the tool window before running an inspection (typically performed when
the inspection is created).
To perform a Remote Teach, do the following:
1.
2.
3.
4.
5.
6.
Verify that the correct tools are enabled for Remote Teach.
Verify that the sensor is in Run mode.
Verify that the Green Ready LED is ON.
Activate the Remote Teach input.
Position the target as desired.
Trigger the Sensor.
Following a Remote Teach, subsequent inspections will be performed with the newly learned parameters of the Vision
tool(s) and the Test tool.
Caution: A successful Remote Teach will occur ONLY if the new target is similar in contrast to the original
target. The exposure time and gain are NOT modified during Remote Teach.
9.4.3 Timing Sequence
The timing for the Remote Teach sequence is shown below (the diagram assumes Remote Teach is enabled on the
tools and that all signals meet minimum times).
It is important to note that the remotely taught parameters are not saved to non-volatile memory; hence, the remotely
taught inspection is good only as long as Run mode is maintained and power to the Sensor is not lost.
336
Minneapolis, MN USA
Banner Engineering Corp.
2/2010
Teach
To record the remotely taught inspection, the logging function must be used.
9.4.4 Remote Teach Results
Remote Teach will indicate normal Pass/Fail results. To clarify normal results, the rules are as follows:
• If Location tools were used in the inspection, then they must perform correctly; that is, the Locate tool must find an
edge, and the Vision tool(s) must find a pattern. If they do not perform correctly, the Remote Teach will fail, andthe
inspection will indicate Fail.
Note: If the Remote Teach fails for this reason, then the new pattern will not be taught, and the previous
inspection will still be valid.
• If Location tools were used and they performed correctly or if Location tools were not used, then the Remote Teach
will attempt to update the Vision tool (if enabled). If the Vision tool fails, then the Remote Teach will fail, and the
inspection will indicate Fail.
Note: If the Remote Teach fails for this reason, then the existing inspection is not valid. The Remote Teach
inspection will continue to fail until a new inspection is taught or selected (via Product Change) or until the
Sensor is taken out of Run mode.
• If the Remote Teach is successful, the inspection will indicate Pass, and the new inspection will perform with the
new parameters.
Banner Engineering Corp.
Minneapolis, MN USA
337
Teach
338
2/2010
Minneapolis, MN USA
Banner Engineering Corp.
Run Screen
Chapter 10
Use the Run screen to start, stop, monitor, and log an inspection. To display the Monitor tab on the Run screen, click
Run in the Main Menu toolbar. The Monitor tab is the default tab in the window.
To exit the Run screen, verify that Run is stopped, and click another destination on the Main Menu toolbar.
While running an inspection, you can monitor the following:
• Pass and Fail counts
• The status of inputs, outputs, Product Select System errors, and whether the Sensor is Ready
• Next Pass, Next Fail, Next Remote Teach, Next Remote Teach Fail, Next, None
To run an inspection, set options and preferences, and click the Start button.
Fields in the Monitor tab are explained below.
Run Screen Monitor Tab
Banner Engineering Corp.
Minneapolis, MN USA
339
Run Screen
2/2010
10.1 Selected Inspection
Displays the filename of the selected inspection. The default is the last saved inspection.
10.2 Display
Display Option
Description
Next Pass
Display next passed inspection.
Next Fail
Display next failed inspection.
Next RT
Display next remotely taught inspection.
Next FT Fail
Display next failed, remotely taught inspection.
Next
Display all inspections. The display is updated continuously, but because of transfer
speed limits, not every image will be displayed. For faster image speed, reduce
the resolution.
None
Display is not updated.
10.3 Capture Control
Capture Control Option
Description
Latched
The condition set in the Display field is displayed, or latched, until set.
Continuous
The condition set in the Display field is displayed.
Image Enable
Checked: The PC displays an image of the inspection.
Unchecked: The PC will collect the inspection information without an image.
340
Minneapolis, MN USA
Banner Engineering Corp.
2/2010
Capture Control Option
Run Screen
Description
Note: Capturing images slows sensor response. For highspeed applications
where the PC remains connected to the sensor, you should uncheck Image
Enable unless absolutely necessary.
10.4 Results
Results Field
Description
Pass Count
Number of passed inspections.
Fail Count
Number of failed inspections.
Total Count
Total number of inspections.
Reset Button
Clears teh counts for the selected inspection.
Note: Each of the stored inspections has its own Pass/Fail registers to store the Pass/Fail counts for that particular
inspection.
10.5 Inputs
Each numbered circle represents an input and its current state.
The legend below applies to the colored circles in the Inputs:
• Gray = Inactive (not currently available)
• Red = Active (not currently available)
• Not Visible = Not selected as input/output
10.6 Outputs
Banner Engineering Corp.
Minneapolis, MN USA
341
Run Screen
2/2010
Each numbered circle represents an output and its current state.
The legend below applies to the colored circles in the outputs:
• Gray = Inactive (not currently available)
• Red = Active (not currently available)
• Not Visible = Not selected as input/output
10.7 Product Select
Displays the last latched Product Select (binary encoded).
The legend below applies to the colored circles in the outputs:
• Gray = Inactive (not currently available)
• Red = Active (not currently available)
• Not Visible = Not selected as input/output
10.8 System
E = System error
R = Ready
Note: The results of the discrete I/O are not displayed in real time.They update approximately 4 times per second.
10.9 Start/Stop
Click the Start button to start running the inspection and click Stop to stop running the inspection.
10.10 Select Tab
The fields on the Select tab of the Run screen are described below.
Product Select
• The Hardware Input option signals the sensor to run the product option currently selected by the Product and Product
Select input lines (not necessarily what is shown in the drop-down list on the tab). With this option selected, then,
the Product Change and Product Select input will change the inspection when signaled to do so.
• The Software Override option is typically used for troubleshooting a specific inspection and it signals the sensor
that you will manually select an inspection to run. The inspection displayed in the field next to Software Override
will be the inspection that runs.
342
Minneapolis, MN USA
Banner Engineering Corp.
2/2010
Run Screen
Failed Image Hold
Enter the number of seconds failed images should be displayed on the optional
NTSC video monitor. The default is 1 second.
Trigger Delay Adjust
Enter the number of milliseconds to delay the camera before it takes a picture after
the sensor receives a valid trigger. The default is 0 milliseconds.
Note: Using the Trigger Delay when a part is triggered too early may be easier than moving the sensor.
Select Tab
10.11 Log Tab
Fields in the Runs screen's Log tab are described below.
Mode
• Pass-Logs only passed inspections based on Strategy.
• Fail-Logs only failed inspections based on Strategy.
• RT-Log remotely-taught inspections based on Strategy.
• RT Fail-Log failed, remotely-taught inspections based on Strategy.
Banner Engineering Corp.
Minneapolis, MN USA
343
Run Screen
2/2010
• Any-Logs both passed and failed inspections based on Strategy.
• None-Log not updated.
Strategy
• Last Ten-Stores the previous 10 inspections that meet the Mode criteria (this is the default).
• First Ten-Stores the first 10 inspections that meet the Mode criteria.
• First and Last Five-Stores the first 5 and last 5 inspections that meet the Mode criteria.
Camera
Shows the number of stored inspections currently in the camera's memory.
• Obtain button-Moves the stored inspection data from the camera's memory to the GUI's memory
.
• Flush button-Deletes all stored inspections from the camera's memory.
PC
• Save All button-Enables the user to write the log files from...
• Save Selected button-Enables the user to write the current log file from the GUI's memory onto a hard
drive or other storage device.
• Load button-Enables the user to load a saved file from the computer's hard drive or other storage device
into the GUI to be viewed.
Result View
• Clear All button-Deletes all inspections from the GUI's memory.
• Clear Selected button-Deletes the currently selected inspection from the GUI's memory.
Log Tab
344
Minneapolis, MN USA
Banner Engineering Corp.
2/2010
Run Screen
10.12 Run Results
In the Run screen, the Results/Navigation window at the bottom of the display defaults to the Results window shown
below. The Results window provides information about the
last displayed inspection. Each tool in the list can be expanded to show its results. Each result shown indicates the
tolerance assigned to the parameter and its current value.
• If the current value falls within the Test tool’s set tolerance or if the tool executed properly, then a green checkmark
symbol is shown beside that parameter.
Banner Engineering Corp.
Minneapolis, MN USA
345
Run Screen
2/2010
• If the current value falls outside the Test tool’s set tolerance or if the tool failed to execute properly, then a red failed
symbol is shown beside that parameter.
Name
Level
Parent Level
Description
Current Inspection
First
None
Name of currently running inspection.
The Camera
Second
Inspection Name
Sensor Information:
• Gain
• Exposure time (ms)
The Trigger
Second
Inspection Name
Trigger Input Information:
• Divide
• Delay
• Width
• Polarity
The Inspection
Manager
346
Second
Inspection Name
General Inspection Information:
• Fail hold time (ms): how long a failed image is
displayed on the monitor
• Power-up time: time since last shutdown (resolution
= second)
• Pass count
• Fail count
• Missed trigger count: total number of triggers
missed because sensor was not Ready
• Lifetime: ow long the sensor has been turned on
(resolution = 1 hour)
Minneapolis, MN USA
Banner Engineering Corp.
2/2010
Name
Run Screen
Level
Parent Level
Description
• Total inspection time minimum (ms): minimum
inspection time recorded (resolution = 0.1 ms)
• Total inspection time maximum (ms): maximum
inspection time recorded (resolution = 0.1 ms)
• Total inspection time (ms)*: inspection time from
trigger until the end of processing time for last
inspection (resolution = 0.1 ms) (does not include
inspection capture to PC*)
• Config timestamp: when inspection was created
* Capturing an image on teh PC adds to the inspection
time. Set display settings to None to decrease the
inspection time to a minimum.
Tools (tool name)
Second
Inspection Name
Information about current tool:
• Execution time (resolution = 0.1 ms)
• Inputs (parameters set for the current tool)
• Results (results of the current tool)
System log
First
None
Not used
10.13 Run Player/Recorder
The Player/Recorder is typically used for troubleshooting and is actually two features in one—a bitmap Player and a
bitmap Recorder. The Recorder can save image files from the camera to an external hard drive for later use. The Player
can force the Vision sensor to run on these stored bitmaps rather than “live” pictures taken from the imager chip.
The Player/Recorder feature has two states, based on the status of the Start button. If the Start button has not been
pressed, then the sensor can run on saved images. Once the Start button is pressed, then the sensor is evaluating live
images and can't run on saved images.
For non-color cameras, the images which are saved by the Recorder feature are 8-bit grayscale bitmaps with the same
resolution as the vision sensor they came from. A P4 Geo would generate 128x100 resolution BMP files (13.5 kB in
size) while a P4 Omni would make 640x480 BMPs (302 kB) and a P4 BCR 1.3 make 1280x1024 BMPs (1282 kB).
The Player feature will work only for the correct resolution images; but it does not care where those images come from
originally. Anything that can generate an 8-bit grayscale bitmap of the correct resolution can be a source for Player
images: a digital camera, a photo-editing software package, an image from another sensor, etc.
Playback Tab
Banner Engineering Corp.
Minneapolis, MN USA
347
Run Screen
348
2/2010
Minneapolis, MN USA
Banner Engineering Corp.
2/2010
Run Screen
Record Tab
10.13.1 Record
The Record tab is present on the Run screen when the vision sensor is running on live images (that is, the Start button
has been pressed).
Banner Engineering Corp.
Minneapolis, MN USA
349
Run Screen
2/2010
There are three steps to recording bitmap images using this feature:
1. Choose a Record Path. At the top of the tab, at the end of the line labeled Record Path, click the button. This will
open up the Record to… window allowing you to browse for the folder where you want the images to be saved.
2. Choose a Record Mode. Right beneath the Record Path selection is the Record Mode drop down menu. This is
where the user selects the conditions (if any) for saving images. The choices are similar to those for the Logging
feature.
3. Press Record. After choosing which images to save and where to save them, the last step is to press the red Record
button found midway down the page. As the images are saved, the file names will appear in the Playback List
window. Press the record button or the square Stop button to stop recording.
350
Minneapolis, MN USA
Banner Engineering Corp.
2/2010
Run Screen
10.13.2 Playback
The Playback feature is available whenever the vision sensor is in Run mode but the Start button has not been pushed.
To enter Playback mode on a currently running sensor, hit the Stop button. Clicking on the Playback tab will bring up
the screen shown below left. This screen is almost exactly the same as the Record screen shown earlier: the only
differences are the title of the tab and the fact that the Record button is inactive.
There are three steps to playing back bitmap images using this feature:
Banner Engineering Corp.
Minneapolis, MN USA
351
1. Load INP file. In Playback mode the vision sensor will be running off of stored images. These images will need
to be evaluated in some way, using vision tools, etc. To begin the Playback process, load an INP file as if you are
going to run the inspection on live images. When you get to the Run screen, however, hit Playback instead of Start.
2. Make a Playback List. At the bottom of the Playback screen is a box entitled Playback List. This is where you can
see the collection of image files the Player will be feeding to the sensor. To add a new BMP file to the Playback
List, click the plus button . This will bring up the Add Image(s) window allowing you to find the relevant files on
your computer.
3. Click the Play button. Once the Playback List is populated with image file(s), the Play button becomes active.
When the Play button is clicked, the Play button becomes to the Pause button and the images in the Playback List
are nspected. Press the square Stop button or the Pause button to stop.
Other Playback Features
After files have been added to the Playback List, a couple of buttons become active:
• The minus button is used to remove the currently selected bitmap from the list.
• The Clear All Images button is used to erase all of the files on the list.
There are two Playback modes possible:
• Single Play Mode (the default). In this mode, the Player will run through all the files on the Playback List once and
then stop.
• Repeated Play Mode is entered by clicking on the Single Play Mode button. Repeated Play puts the Player into a
continuous loop inspecting the files on the Playback List over and over until the Stop or Pause buttons are clicked or
the mode is changed back to Single Play.
Instead of running through all the files on the Playback List as fast as possible, the Player can be made to step through
each image individually. Clicking on the file name in the list runs the inspection file once on that image. Using the
Forward or Back buttons will allow you to step through the images one at a time.
Product Change
Chapter 11
This section explains the Product Change ( line 15) input.
The Product Change input is used in conjunction with one of the four I/O points programmed as Product Select lines.
The inspection loaded will be executed following a valid trigger.
• The Product Change input responds to the leading edge transition of a pulse greater than 1 millisecond.
• The Product Select input is pulsed to correspond to a program location. For example, five pulses will load program
#5.
11.1 Product Change Specifications
State
Current Sinking (NPN)
Current Sourcing (PNP)
ON
< 2V at 1 mA max.
> 8V at -7.5 mA max.
OFF
> 10 V at 4 mA max.
< 2V at -7.5 mA max.
11.2 Product Select Input Specifications
State
Current Sinking (NPN)
Current Sourcing (PNP)
ON
< 2V at 1 mA max.
> 8V at -7.5 mA max.
OFF
> 10V at 4 mA max.
< 2V at -7.5 mA max.
11.3 ProII Product Select
The Pro II has four dedicated Product Select lines that can be thought of as making a BCD table. You can access
inspections 0-15 using the following pin combinations.
Inspection Number
Product Select #3
Product Select #2
Product Select #1
Product Select #0
0*
OFF
OFF
OFF
OFF
1
OFF
OFF
OFF
ON
2
OFF
OFF
ON
OFF
3
OFF
OFF
ON
ON
4
OFF
ON
OFF
OFF
5
OFF
ON
OFF
ON
6
OFF
ON
ON
OFF
7
OFF
ON
ON
ON
8
ON
OFF
OFF
OFF
9
ON
OFF
OFF
ON
Banner Engineering Corp.
Minneapolis, MN USA
353
Product Change
2/2010
Inspection Number
Product Select #3
Product Select #2
Product Select #1
Product Select #0
10
ON
OFF
ON
OFF
11
ON
OFF
ON
ON
12
ON
ON
OFF
OFF
13
ON
ON
OFF
ON
14
ON
ON
ON
OFF
15
ON
ON
ON
ON
* The only way to save an inspection to RamDisk (Inspection Number 0) is to use the Downloadable Inspection API.
Inspections stored in RamDisk are temporary; that is, if the sensor is restarted, or a product change occurs, the inspection
in RamDisk will be lost. If you try to access an inspection in RamDisk and there isn't one available, you will get an
system error 1000 (plus the Inspection Number attempted). For more information about the Downloadable Inspection
API, see the Inspection Download Users Guide.
Generalizing this BCD-type table; that is, writing an integer in binary and encoding the binary value into the correct
Product Select Inputs:
• the least significant bit is assigned to Product Select #0, or pin 19.
• the most significant bit is assigned to Product Select #3, or pin 16.
This will allow you to go to inspections 0-15.To get to higher inspection numbers, you have to start using up configurable
I/O (one of the options that you can select for the configurable I/O is Product Select).
Use the following guidelines to determine how many of the configurable I/O you will need to get to higher inspection
numbers:
• Using all four dedicated Product Select lines accomodates 24 inspections (16).
• By adding 2 of the configurable I/O, you will have a BCD table that has 26 entires (64 inspections).
• By adding all 6 of the configurable I/O as Product Select lines, you can access the full range of possible inspections
(technically 210 = 1024, but the real total is capped at an administrative limit of 999.)
The table below shows adding I/O #5 and I/O #6.
Inspection
Number
I/O #6 - Product
Select # 5
I/O #5 - Product
Select # 4
Product
Select #3
Product
Select #2
Product
Select #1
Product Select
#0
16
OFF
ON
OFF
OFF
OFF
OFF
17
OFF
ON
OFF
OFF
OFF
ON
18
OFF
ON
OFF
OFF
ON
OFF
19
OFF
ON
OFF
OFF
ON
ON
20
OFF
ON
OFF
ON
OFF
OFF
21
OFF
ON
OFF
ON
OFF
ON
22
OFF
ON
OFF
ON
ON
OFF
23
OFF
ON
OFF
ON
ON
ON
24
OFF
ON
ON
OFF
OFF
OFF
25
OFF
ON
ON
OFF
OFF
ON
26
OFF
ON
ON
OFF
ON
OFF
27
OFF
ON
ON
OFF
ON
ON
28
OFF
ON
ON
ON
OFF
OFF
29
OFF
ON
ON
ON
OFF
ON
354
Minneapolis, MN USA
Banner Engineering Corp.
2/2010
Product Change
Inspection
Number
I/O #6 - Product
Select # 5
I/O #5 - Product
Select # 4
Product
Select #3
Product
Select #2
Product
Select #1
Product Select
#0
30
OFF
ON
ON
ON
ON
OFF
31
OFF
ON
OFF
OFF
OFF
OFF
32
ON
OFF
OFF
OFF
OFF
OFF
33
ON
OFF
OFF
OFF
OFF
ON
34
ON
OFF
OFF
OFF
ON
OFF
35
ON
OFF
OFF
OFF
ON
ON
36
ON
OFF
OFF
ON
OFF
OFF
37
ON
OFF
OFF
ON
OFF
ON
38
ON
OFF
OFF
ON
ON
OFF
39
ON
OFF
OFF
ON
ON
ON
40
ON
OFF
ON
OFF
OFF
OFF
41
ON
OFF
ON
OFF
OFF
ON
42
ON
OFF
ON
OFF
ON
OFF
43
ON
OFF
ON
OFF
ON
ON
44
ON
OFF
ON
ON
OFF
OFF
45
ON
OFF
ON
ON
OFF
ON
46
ON
OFF
ON
ON
ON
OFF
47
ON
OFF
ON
ON
ON
ON
48
ON
ON
OFF
OFF
OFF
OFF
49
ON
ON
OFF
OFF
OFF
ON
50
ON
ON
OFF
OFF
ON
OFF
51
ON
ON
OFF
OFF
ON
ON
52
ON
ON
OFF
ON
OFF
OFF
53
ON
ON
OFF
ON
OFF
ON
54
ON
ON
OFF
ON
ON
OFF
55
ON
ON
OFF
ON
ON
ON
56
ON
ON
ON
OFF
OFF
OFF
57
ON
ON
ON
OFF
OFF
ON
58
ON
ON
ON
OFF
ON
OFF
59
ON
ON
ON
OFF
ON
ON
60
ON
ON
ON
ON
OFF
OFF
61
ON
ON
ON
ON
OFF
ON
62
ON
ON
ON
ON
ON
OFF
63
ON
ON
ON
ON
ON
ON
Banner Engineering Corp.
Minneapolis, MN USA
355
Note: When adding configurable I/O as extra Product Select lines, be aware that the least significant bit will be
I/O #1 and the most significant bit will be I/O #6. You do not need to use the I/O in order; but if you only wind
up using two of the six, for example, then the lower numbered I/O will the less significant than the higher numbered
I/O.
Saving Inspections
Chapter 13
Inspection (.ins) files can be saved either to the sensor or to the PC.You need to save inspections to the sensor in order
to run them; however, you can also save a copy to the PC or your network as a backup.
An inspection (.ins) file contains the image parameters, inspection parameters and, optionally, the reference image:
• Image parameters are the programmed values used by the sensor to acquire the inspection image.These values include
gain, exposure time, and trigger setup.
• Inspection parameters include Location tools, Vision tools, and Analysis tools as well as their associated parameters.
• The reference image is the image selected in the Setup screen.
Use the Save window to save an inspection to the Sensor or to save to an Inspections folder on the PC or network.
To display the Save dialog, click the Save button in the Menu toolbar.
Banner Engineering Corp.
Minneapolis, MN USA
357
Saving Inspections
2/2010
12.1 Saving Inspections to a Vision Sensor
To save an inspection to a Vision sensor:
1. Click on the Save button in the Menu toolbar to display the Save Inspection dialog.
2. Use the scroll bar and select an Inspection Number by clicking in the dialog next to the number where you want
to store the inspection, or enter a number in the Inspection Number field.
3. In the Inspection Name field, enter a name for the inspection.
4. Click the Save button in the dialog.
Note: Check the Space Needed and Space Available fields to ensure there is room to save an inspection. You
can choose whether to save a reference image. Not saving a reference image with the inspection frees up a lot of
room onboard the sensor. However, inspections that include any of the following tools require a reference image
to be saved:
• Geometric Find
• Geometric Count
• Pattern Find
• Pattern Count
• Color Match
• Color BLOB
358
Minneapolis, MN USA
Banner Engineering Corp.
2/2010
Saving Inspections
12.2 Saving Inspections to a PC or Network Drive
To save an inspection to a PC or network drive:
1. Click on the Save button in the Menu toolbar to display the Save Inspection dialog.
2.
3.
4.
5.
Select a disk drive from the Save in field.
Select a drive and a location for the stored inspection.
In the Inspection Name field, enter a name for the inspection.
From the Save as type drop-down, select:
• *.ins to save as a standard format for Vision sensors
• *.inp to save in an older format for compatibility with older sensors.
• *.bmp to only save the current image.
6. Click the Save button in the dialog.
Banner Engineering Corp.
Minneapolis, MN USA
359
Saving Inspections
360
2/2010
Minneapolis, MN USA
Banner Engineering Corp.
Backing Up and Restoring Vision
Sensor
Chapter
14
Data
13.1 Backing up Vision Sensor Data
To back up Vision sensor data:
1. Insert the PresencePLUS installation CD into the CD-ROM drive, and launch the install program.
2. Click on PresencePLUS Update Firmware.
3. From the list of sensors in thePresencePLUS Firmware Updater, select the sensor you want to back up, and click
Connect.
4. Click on the Sensor Backup tab.
Banner Engineering Corp.
Minneapolis, MN USA
361
Backing Up and Restoring Vision Sensor Data
2/2010
5. In the Create Backup section, click on the ellipses (...) button to select a filename for the backup file as well as a
location for the backup on the local computer or on the network.
362
Minneapolis, MN USA
Banner Engineering Corp.
2/2010
Backing Up and Restoring Vision Sensor Data
6. In the Backup Content field, select either of the following to backup:
• [ Firmware ] + [ Configuration ] + [ Inspection(s) ]
• [ Configuration ] + [ Inspection(s) ]
Banner Engineering Corp.
Minneapolis, MN USA
363
Backing Up and Restoring Vision Sensor Data
2/2010
7. Optionally, click on the Edit Note button to add notes for the backup operation.
364
Minneapolis, MN USA
Banner Engineering Corp.
2/2010
Backing Up and Restoring Vision Sensor Data
8. Click the Backup button to back up Vision sensor data.
13.2 Restoring Vision Sensor Data
To restore Vision sensor data:
1. Insert the PresencePLUS installation CD into the CD-ROM drive, and launch the install program.
2. Click on PresencePLUS Update Firmware.
Banner Engineering Corp.
Minneapolis, MN USA
365
Backing Up and Restoring Vision Sensor Data
2/2010
3. In the PresencePLUS Firmware Updater, click on the Restore tab.
4. From the list of sensors, select the one you want to restore to, and click Connect.
5. In the Restore Sensor section, click on the ellipses (...) button to select a backup file from which to restore the
Vision sensor data.
366
Minneapolis, MN USA
Banner Engineering Corp.
2/2010
Backing Up and Restoring Vision Sensor Data
6. Optionally, click the Read Note.. button to get more information about the restore.
Banner Engineering Corp.
Minneapolis, MN USA
367
7. If desired, check the box next to Restore Firmware and/or Optimized.
8. Click the Restore button to restore Vision sensor data from the selected backup file.
Hardware Installation
Chapter 15
14.1 Typical ProII Vision Application
A typical PresencePLUS Pro II sensor application is shown below.
14.2 PresencePLUS® ProII Components
The PresencePLUS ProII system consists of a PC with PresencePLUS software, a camera, a controller, and the
appropriate connections. The Sensor requires lighting and a trigger device. An optional video monitor can be connected
to the controller.
Note: The trigger device can be any 10-30V dc photoelectric sensor (PNP or NPN) or a device with a similar
output.
Banner Engineering Corp.
Minneapolis, MN USA
369
Hardware Installation
2/2010
PC with PresencePLUS Software
(Required only for configuration and diagnostics)
Controller
Terminal Block
-Power Supply
-Trigger Input
-Light Source
-Other I/O
Light Source
Video Monitor
(optional)
Camera
(Mounting Bracket is optional)
Trigger Device
14.3 ProII Cable Connections
The camera, PC, and optional video monitor are attached to the controller as shown.
Camera Cable to Camera
Crossover Ethernet Cable to PC Ethernet Port*
PPC06 -- 2 m (6')
STPX07 -- 2.1 m (7')
PPC06RA -- 2 m (6')
STPX25 -- 7.6 m (25')
PPC23 -- 7m (23')
or
PPC23RA -- 7m (23')
Standard Ethernet Cable to PC via Network Hub or
Switch
PPC32 -- 10 m (32')
PPC32RA -- 10 m (32')
370
STP07 -- 2.1 m (7')
STP25 -- 7.6 m (25')
Minneapolis, MN USA
Banner Engineering Corp.
2/2010
Hardware Installation
Monitor Cable to Video Monitor (optional)
Serial Cable to PC Serial Port*
BNC06 -- 2 m (6')
DB906 -- 2 m (6')
BNC15 -- 5 m (15')
DB915 -- 5 m (15')
BNC30 -- 9 m (30')
DB930 -- 9 m (30')
14.4 Mounting the Controller
Mount the controller to a Banner controller mounting bracket or to a flat surface using its four mounting flanges, as
shown below. Allow a minimum of 75 mm (3") of clearance for cable bend relief.
The following mounting hardware is supplied with the controller.
• Four M5 x 0.8 x 14 mm socket head cap screws
• Four M5 x 0.8 hex nuts
• Four split lock washers
• Four flat washers
• Short-arm hex key wrench
DIN Rail Mounting Option
Mount the controller to a DIN rail using Banner controller mounting brack
et SMBPPDH for flat mounting, or SMBPPDE
for edge mounting. Hardware for fastening the bracket to the controller is included with the bracket.
14.5 Mounting the Camera
Use the appropriate Banner Camera Model with the Banner controller:
ProII Model Type ProII Controller Model Number
Standard ProII Camera Model Number
Gray Scale
PPROCTL
PPROCAM
High Resolution
PPROCTL1.3
PPROCAM1.3
Color
PPROCTLC
PPROCAMC
Mount the camera to a Banner camera mounting bracket or to a flat surface. The camera has six M3 threads (two on
the top and two on each side) and one 1/4-20 UNC thread on its base.
Cable Bend Relief
If using a straight cable, allow at least 75 mm (3") clearance at the rear of the camera for cable bend relief. If using a
right-angle cable, allow at least 50 mm (2").
Mounting Hardware
The following mounting hardware is supplied with all brackedts:
• Four M3 x 0.5 x 6 mm socket head cap screws
• Four medium split lock washers
• Four flat washers
• Short-arm hex key wrench
Camera Mounting Brackets
Mount the camera with a U-Bracket, Long U-Bracket, Right-Angle Bracket, or Knuckle Assembly Kit. Secure the
camera to the bracket with the supplied M3 screws.
Banner Engineering Corp.
Minneapolis, MN USA
371
14.6 Mounting the Light Source
The light source must be securely mounted. Any movement in the light source during an inspection could affect
inspection performance.
14.7 Installing the Camera Lens
Remove any protective caps from the camera and lens. Turn the metal lens base clockwise to thread the lens onto the
camera. The plastic lens shroud is used for focusing; do not turn it when installing the lens.
14.8 Installing Lens Filters
These instructions are for Banner filters designed to fit Banner cameras.
Colored, infrared, and polarized lens filters can be used. The filter fits between the lens and camera and is held in place
with a retainer ring. Use the retainer ring tool that is supplied with the filter to add or remove a filter.
Dimensions and SpecificationsChapter 16
15.1 Controller Dimensions
15.2 Camera Dimensions
Banner Engineering Corp.
Minneapolis, MN USA
373
Dimensions and Specifications
2/2010
Pro II Camera with M12 Connector
Pro II Mini Camera with M12 Connector
374
Minneapolis, MN USA
Banner Engineering Corp.
2/2010
Dimensions and Specifications
15.2.1 Camera Mounting Bracket Dimensions
Bracket Model SMBPPU Dimensions
Bracket Model SMBPPLU Dimensions
Banner Engineering Corp.
Minneapolis, MN USA
375
Dimensions and Specifications
2/2010
Bracket Model SMBPPRA Dimensions
15.3 Sensor Specifications
Feature
Description
Controller Model Numbers
PPROCTL: Standard Gray Scale
PPROCTL1.3: High Resolution
PPROCTLC: Color
Camera Model Numbers
PPROCAM: Standard Gray Scale
PPROCAM1.3: High Resolution
PPROCAMC: Color
Power
PPROCTL: 10 to 30V dc @ less than 1.5 A (exclusive of load)
PPROCTL1.3 and PPROCTLC: 10 to 30V dc @ less than 1.2A (exclusive of load)
Discrete I/O
1 Trigger IN (pin 3)
1 Strobe OUT (pin 4)
1 Remote TEACH IN (pin 6)
4 Programmable I/O (pins 9-14)
1 Product Change IN (pin 15)
4 Product Select IN (pins 16-19
376
Minneapolis, MN USA
Banner Engineering Corp.
2/2010
Feature
Dimensions and Specifications
Description
Input/Output Configuration NPN (sinking) or PNP (sourcing) software selectable
Output Rating
150 mA max, each output
OFF-state leakage current: less than 100 µA
ON-State Saturation Voltage:
NPN—less than 1V @ 150 mA
PNP—greater than V+ -2V
Input Specifications
NPN: ON—less than 3V
OFF-state voltage: greater than 10V @ 4mA max.
PNP: ON—greater than (+V-2)V @ 1mA max.
OFF-state voltage: less than 3V @ 6 mA max.
Indicators
6 LED Indicators: Trigger, Ready, Power, Pass, Fail, Error
Communication
1 RJ-45 Ethernet
1 RS-232 DB-9 port
Display Options
PC or NTSC video; 9 m (30') max. cable length
Memory
Storage: 64 MB
Inspections: 999 maximum
Construction
Steel with black zinc plating
Weight: Approximately 0.55 kg (1.21 lbs)
Environmental Rating
IEC IP20; NEMA 1
Operating Conditions
Stable Ambient Temperature: 0° to + 50° C (+32° to + 122° F)
Stable Ambient Lighting: No large, quick changes in light level; no direct or
reflected sunlight
Relative Humidity: 90%, non-condensing
Certifications
15.4 Camera Specifications
Feature
Description
Camera Model Numbers
PPROCAMQ/PPROMCAMQ: Standard Gray Scale
PPROCAM1.3Q/PPROMCAM1.3Q: High Resolution
PPROCAMCQ/PPROMCAMCQ: Color
Imager Resolution
PPROCAMQ: 640 x 480 pixels; PPROMCAMQ: 752 x 480 pixels
PPROCAM1.3Q/PPROMCAM1.3Q: 1280 x 1024 pixels
PPROCAMCQ/PPROMCAMCQ: 752 x 480 pixels
Banner Engineering Corp.
Minneapolis, MN USA
377
Dimensions and Specifications
2/2010
Feature
Description
Pixel Size
PPROCAMQ: 7.4 x 7.4 µm; PPROMCAMQ: 6.0 x 6.0 µm
PPROCAM1.3Q/PPROMCAM1.3Q: 6.7 x 6.7 µm
PPROCAMCQ/PPROMCAMCQ: 6.0 x 6.0 µm
Imager Size
PPROCAMQ: 4.8 x 3.6 mm, 6 mm diagonal (1/3 inch CCD); PPROMCAMQ: 4.5 x
2.9 mm, 5.4 mm diagonal (1/3 inch CMOS)
PPROCAM1.3Q/PPROMCAM1.3Q: 8.6 x 6.9 mm, 11 mm diagonal (2/3 inch CMOS)
PPROCAMCQ/PPROMCAMCQ: 4.5 x 2.9 mm, 5.4 mm diagonal (1/3 inch CMOS)
Levels of Gray Scale or
Color
PPROCAMQ/PPROMCAMQ: 256 Gray Scale
PPROCAM1.3Q/PPROMCAM1.3Q: 256 Gray Scale
PPROCAMCQ/PPROMCAMCQ: 256 Red, Green, and Blue
Exposure Time
PPROCAMQ: 0.10 to 2830 milliseconds;PPROMCAMQ: 0.10 to 1040 milliseconds
PPROCAM1.3Q/PPROMCAM1.3Q: 0.10 to 1670 milliseconds
PPROCAMCQ/PPROMCAMCQ: 0.10 to 1040 milliseconds
Acquisition
PPROCAMQ/PPROMCAMQ: 48 frames per second max.
PPROCAM1.3Q/PPROMCAM1.3Q: 18 frames per second max.
PPROCAMCQ: 17 frames per second max.;PPROMCAMCQ: 55 frames per second
max.
Interface
LVDS
Lens Mount
Standard C-mount (1 inch—32 UN)
Construction
black anodized aluminum and black painted die cast zinc
Max. Cable Length
10 m (32')
Weight
approx. 0.09 kg
Environmental Rating
IEC IP20; NEMA 1
Operating Conditions
Stable Ambient Temperature: 0° to + 50° C (+32° to + 122° F)
Relative Humidity: 90%, non-condensing
Certifications
15.5 Monitor Specifications - 9" CRT
Feature
Description
Model Number
PPM9
Construction
Metal case, glass screen
Dimensions: 220 X 240 X 267 mm (8.66" X 9.45" X 10.51")
378
Minneapolis, MN USA
Banner Engineering Corp.
2/2010
Feature
Dimensions and Specifications
Description
Weight: 6 kg (13.2 lb.)
Operating Conditions
Operating Temperature: -10° to +55° C (+14° to 130° F)
Maximum Relative Humidity: 95%, non-condensing
Electrical
System: NTSC compatible
Picture Tube: 9" measured diagonally
Horizontal Resolution: > 1000 TV lines (center), > 800 TV lines (corners)
Power Requirement: 110-240V ac, 50/60 Hz
Power Consumption: 0.5A
Certifications
Listed TV/Video Product 8K37, E133441
R
C
Controls/Connectors
Horizontal Hold (rotary knob)
Vertical Hold (rotary knob)
Brightness (rotary knob)
Contrast (rotary knob)
Video IN-OUT (BNC)
Impedance High/Low switch (75 Ohms)
15.6 Monitor Specifications - Flat Panel 8" LCD Color
Feature
Description
Screen Size
8" diagonal
LCD Aspect Ratio
4:3
LCD Panel Type
TFT Active Matrix
Display Resolution
800(H) x 600(V)
Brightness (Central)
350 Nit
Viewing Angle
Left and Right 80°
Down 35°
Up 15°
Supply Voltage
12-24V dc
Red Wire: +V
Black Wire: -V
Current Draw
0.6 A @ 12V dc
Connections
Flying leads for power
BNC for Video
BNC adaptor provided
Operating Temperature
Banner Engineering Corp.
0° C to +50° C (+32° F to +122° F)
Minneapolis, MN USA
379
Dimensions and Specifications
2/2010
Feature
Description
Storage Temperature
-20° C to +60° C (-4° F to +140° F)
Video System
NTCS/PAL Auto Switching
Control
Selectable on monitor or via remote control (included)
On-screen control: Bright, contrast, color, tint
1.2 lb
Net Weight
15.7 Ethernet Communication Specifications
Use a crossover Ethernet cable for communicating directly with a PC. Use a straight Ethernet cable for communicating
with a network device, such as an Ethernet hub or switch.
Feature
Description
Protocol
TCP/IP
Data Transfer Rate
10/100 Mbps
Max Cable Length
120 m (393')
Recommended PC IP
Address
192.168.0.2
PC Subnet Mask
255.255.255.0
Factory Default Sensor IP 192.168.0.1
Address
Connector
RJ-45
Connector Pinout
Use RJ-45 network crossover cable for direct connection to a
PC.
Controller End of Cable
8 7 6 5 4 3 2 1
Pin
Name
Pin 1
TXD+
Pin 2
TXD-
Pin 3
RXD+
Pin 4
Not used
Pin 5
Not used
Pin 6
RXD-
Pin 7
Not used
Pin 8
Not used
1 2 3 4 5 6 7 8
PC End of Cable
15.8 Serial Port Communication Specifications
Feature
Description
Baud Rate
115K
380
Minneapolis, MN USA
Banner Engineering Corp.
2/2010
Dimensions and Specifications
Feature
Description
Data Bits
Eight
Stop Bits
One
Parity
Odd
Flow Control
None
Connector
Banner Engineering Corp.
Minneapolis, MN USA
381
Dimensions and Specifications
382
2/2010
Minneapolis, MN USA
Banner Engineering Corp.
A
A/D converter
2. The angle between the axis of observation and
perpendicular to the specimen surface.
aperture
Acronym for Analog-to-Digital Converter, an electronic device
that converts data from analog form to digital representation.
The size of a lens opening.
Abs (Absolute Value)
ASCII
Abs (Absolute value) returns Abs(X1). The absolute value of
an operand is its unsigned magnitude. For example, Abs(-1.5)
and Abs(1.5) both return 1.5
Acronym for American Standard Code for Information
Interchange. An 8-bit coded character set used to represent
alphanumeric, punctuation, and certain special control
characters.
acquisition
B
The manner in which outside information is brought into an
analysis system, as in an image acquisition. Generally involves
A/D conversion.
backlighting
A control method in which a threshold is adjusted based on
scene content.
A condition where the light reaching the image sensor does
not reflect from the surface of the object, but comes from
behind the objects or area of interest. Backlighting produces
a silhouette of the work piece.
algorithm
band-eliminator filter
A set of well-defined rules or procedures for solving a problem
in a finite number of steps, or providing an output from a
specific set of inputs. Usually implemented as a computer
program.
A filter that suppresses a given range of frequencies,
transmitting only those above and below that band.
adaptive threshold
bandpass
ambient light
Light that is present in the environment but not provided by
the sensing system.
The specific range of frequencies or wavelengths, passing
through a device. Typically measured between points equal to
50% of maximum amplitude.
barrel distortions
angle of incidence
The angle between the axis of an impinging light beam and
the axis perpendicular to the sample surface.
An image appearing to bulge outward on all sides, like a barrel.
This is caused by a decrease in effective magnification, as
points in the image move a way from the image center.
angle of view
beam splitter
1. The angle formed between two lines drawn from the most
widely separated points in the object plane to the center of
the lens.
A device for dividing a light beam into two or more separate
beams.
bimodal
contrast
Histogram distribution of values with two peaks.
The range of difference between light and dark values in an
image.
binary system
A vision system that creates a digitized image of an object in
which each pixel can have one of only two values, such as
light/dark, or zero/one.
Blob
cronym for Binary Large OBject. A connected region in a
binary image.
blooming
The "smearing" of regions of the image where the detected
brightness is at an excessive level for the receiving element,
due to electronic contamination from neighboring bright pixels.
C
c-mount
Threaded lens mount developed from 16 mm movie work.
used extensively for closed-circuit television. The threads have
a major diameter of 1" and a pitch of 32 threads per inch. The
flange focal distance is 0.69".
correlation
A process whereby two image segments are compared to
determine their similarity, or to find the position at which
optimal similarity exists.
D
dark field
An illumination technique supplying the illumination at a
shallow (grazing) angle to the surface of the work piece.
Ordinarily only a negligible amount of light reflects into the
Sensor. Specular reflections occur off any abrupt surface
irregularities, and are detectable in the image.
depth of field
The in-focus range of an imaging system. Measured from the
distance behind an object to the distance in front of the object,
with all objects appearing in focus.
depth of focus
The range of lens-to-image plane distance having the image
formed by the lens appearing in focus.
calibration
The relationship between the output of a measuring instrument
and some fiducial mark, an accepted standard of measurement,
or other reference datum for the purpose of reporting future
results relative to the reference.
centroid
deslant
In order for the OCV/OCR Vision tool to box correctly, there
must be a minimum of a 1 pixel-wide column between
characters. If the characters are slanted in such a way that they
overlap in ths 1 pixel-wide column, then the image may need
to be manipulated, or deslanted, so that the image can box
correctly.
The X and Y pixel coordinates of the center of mass in a two
dimensional Blob.
diffuse
collimated
A beam of light in which all optical rays are parallel.
384
The process of redirecting incident light over a range of
scattered angles, while reflecting from or transmitting through
a material.
PresencePLUS® Pro/ProII/ProII 1.3/ProII Color
distortion
front lighting
Undesired change in the shape of an image or waveform from
the original object or signal.
An arrangement in which the object is illuminated and viewed
from the same side.
edge
G
A change in pixel values exceeding some threshold between
two adjacent regions of relatively uniform values. Edges
correspond to changes in brightness corresponding to a
discontinuity in surface orientation, reflectance, or illumination.
gradient magnitude
The rate-of-change of pixel intensities over a small local
neighborhood.
f/stop (or f/number
Ratio of the focal length of a lens to the diameter of its opening.
Increasing or decreasing an exposure by one f/stop doubles or
halves the amount of light allowed through the lens.
gray scale
Standardized variations of values from white, through shades
of gray, to black in a digitized image with black assigned the
value of zero and white the value of 255.
feature
Any characteristic descriptive of an image or a region in an
image.
H
feature extraction
halogen
The process of generating a set of descriptors or characteristic
attributes from an image.
A gas, such as iodine, placed inside an incandescent lamp to
gather the evaporated filament off the bulb and redeposit it
back onto the filament.
fiducial mark
A mark defining a datum point or standard of positional
reference used as a basis for calculation or measurement.
high pass filter
A processing operation that enhances high frequencies (and
attenuates low frequencies).
field of view (FOV)
The area of object space imaged at the focal plane of a lens.
histogram
Frequency counts of the population of pixels of each intensity
(gray level) or other characteristic populations in an image.
fluorescent lamp
A lamp that produces light by exciting a phosphor with a
plasma, with the phosphor re-emitting the energy as light.
I
focal length
incandescent
The distance from a lens’ principal point to the corresponding
focal point. Also referred to as the equivalent focal length and
the effective focal length.
Thermal generation of light, usually through radiantfilaments
in a bulb.
385
incident light
ocv
The light falling directly on an object.
Acronym for Optical Character Verification. Verify a string
by a vision system.
inverse square law
The exponential relationship between increased distance and
decreased light intensity.
iris
An adjustable aperture built into a Sensor lens to permit control
of the amount of light passing through the lens.
L
LED
Acronym for Light-Emitting Diode.
M
P
parallax
The difference in appearance or position of an object when
viewed from two different locations.
photon
A particle of light. A quantum of electromagnetic energy
moving at the speed of light.
pincushion distortion
A visual effect where the sides of an image appear to bulge
inward on all sides like a pincushion. Caused by an increase
in effective magnification, as points in the image move away
from the image center.
mask
pixel
A pattern used to eliminate portions of another pattern. Regions
of an image at a constant value, usually white or black, form
the mask.
Acronym for picture element.
polarization
N
The restriction of the vibrations of light or magnetic field
vectors to one plane.
noise
polarized lighting
Irrelevant or meaningless data resulting from various causes
unrelated to the source of data being measured or inspected;
random undesirable video signals.
The use of polarizing filters to remove specular reflections
from a scene to be viewed. Typically, one polarizing filter is
placed in front of the light source and a second filter is placed
over the receiver with the two filters offset in their polarizing
direction by 90 degrees.
O
preprocessing
ocr
Enhancement, transformation, or filtering of images before
processing.
Acronym for Optical Character Recognition. Recognition of
each character in a string by a vision system.
386
PresencePLUS® Pro/ProII/ProII 1.3/ProII Color
R
sub-pixel resolution
Any technique resulting in a measurement with a resolution
(interpolated position of change) of less than one pixel.
recognition
A match between a description derived from an image and a
description obtained from a stored model or feature set.
T
region of interest (ROI)
template matching
The Region of Interest (ROI) is the area to be analyzed inside
user-defined boundaries.
Comparing a template with an object in an image. Usually
performed at the pixel level, as with a template correlation.
repeatability
threshold
The degree to which repeated measurements of the same
quantity vary about their mean.
The intensity (specific pixel value) below which a stimulus
produces no effect or response. Often used to convert a gray
scale or analog image into a binary image.
resolution
1. The smallest detectable change in position or size of an
object.
2. The closest distance between two objects (points) in an
image, identifiable as two separate objects rather than one
object.
S
thresholding
A scene segmentation process based on converting a gray scale
image into a binary image by reassigning pixel gray levels to
only two values. Regions of the binary image are separated,
based on whether pixel values in the gray scale image were
above or below a chosen intensity level.
throughput
The total capability of equipment to process or transmit data
during a specified time period.
shift register
An electronic circuit consisting of a series of storage locations
(registers). During each clock cycle, the information in each
location moves (shifts) into the adjacent location.
tolerance
The established range upon which to base the differentiation
between good and bad products.
signal-to-noise ratio
The ratio of the maximum value of an output signal to the
standard deviation amplitude of the noise on the signal.
translation
Movement left or right, up or down, but not rotated; a
geometrical operation that shifts the position of an image from
its original position.
strobe light
A pulsed illumination source that generates short bursts of
high-intensity light.
387
Z
zoom
Electronically or optically enlarging or reducing the size of an
image.
Index
A
absolute positioning 103
absolute threshold 100, 148, 165
adaptive threshold 108, 155
adding an area tool 127, 175, 179, 192
advanced tab
barcode tool 197
Blob Find tool 122
Blob tool 137
color Blob tool 185
geometric count tool 156
geometric find tool 109
string tool 297
area 123, 138, 187
area tools
adding 127, 175, 179, 192
mask 117, 127, 130, 176, 179, 193
average color tool 174
average gray scale
histogram 128
average gray scale tool 126
B
barcode tool 194
advanced tab 197
color scheme 199
decoder mode 199
barcode type 195
binary large object 178
binary large object(s) 115, 129
Blob 129
Blob Find 115
Blob Find tool 115
advanced tab 122
Blob tool 129
advanced tab 137
histogram 120, 136
C
centroid 123, 138, 188
character ID 210
character pattern 210
character spacing 216, 235
character strings 63, 331
Circle Detect tool 141
color Blob tool 178
advanced tab 185
color inspections 36
white balancing 37
color match tool 191
color scheme 199
command processing
EXEC PRODCHANGE 61, 329
EXEC RESET 61, 329
EXEC TRIGGER 61, 329
GET 62, 329
SET EXPOSURE 61, 329
communication tool 248
Ethernet connection 52, 321
setup 321
Communication tool error codes 60, 328
compactness 124, 139, 189
compute statistics 123, 138
coordinate tool 263
D
decoder mode 199
deslant 215, 234
discard boundary blobs 123, 137
E
eccentricity 126, 141, 189
edge length 108, 156
edge profile graph 100, 101, 148, 149, 165
edge strength 101, 108, 149, 155, 166
edge tool 146
error codes
Communication tool 60, 328
Reset command 61, 328
Trigger and Product Change 60, 328
Ethernet connection 52, 321
EXEC PRODCHANGE 61, 329
EXEC RESET 61, 329
EXEC TRIGGER 61, 329
F
fill holes 123, 137
filters 102, 150, 167, 169
fixed threshold 118, 131, 208
font library 225, 244
Frame Tag Numbers 61, 329
G
geometric count tool
advanced tab 156
geometric find tool 105
geomtetric count tool 153
Index
geomtric find tool
advanced tab 109
GET 62, 329
gray scale intensity 126
H
histogram 120, 128, 136
horizontal gap 220, 239
HSI 176
I
input tab
locate tool 98
inspection storage capacity 45
L
largest hole to fill 123, 138
line detect 161
Line Detect tool 159
linear tools
locate tool 98
locate tool 98
filters 102, 150, 167, 169
min width 103, 151, 167, 170
ROI width 102, 150, 167, 170
sample rate 103, 151, 167, 170
smoothing 102, 151, 167, 170
input tab 98
location tool
rotation enable 103
M
major axis angle 124, 139, 189
major axis length 124, 139, 189
mask 117, 127, 130, 176, 179, 193
math tool 267
max radius 126, 141, 191
max radius position 126, 141, 191
measure tool 272
min radius 126, 141, 191
min radius position 126, 141, 191
min stroke thickness 217, 236
min width 103
minor axis length 124, 139, 189
monitor tab
product select 342
ready 342
system error 342
O
optical character recognition (OCR) 210
optical character verification (OCV) 228
P
pattern count tool 171
390
pattern find tool 112
perimeter 123, 138, 188
polarity 100, 101, 143, 148, 149, 161, 164, 165, 166
print contrast 216, 235
product select 342
R
RCC log 62, 330
RCC return values 60, 328
ready 342
reference image 212, 231
region of interest (ROI) 214, 233
reject level 118, 119, 131, 132, 208
reject threshold 111, 158
relative threshold 100, 148, 164
remote teach 155, 173, 193, 303, 336
Reset command error codes 61, 328
RGB 36
ROI width 102, 150, 167, 170
rotation enable 103
rotation range 110, 157
run screen 339
monitor tab 339
S
sample rate 103, 151, 167, 170
scaling range 112, 159
sensor select tab 47
SET GAIN 61, 329
smoothing 102, 151, 167, 170
storage capacity
inspections 45
string tool 294
advanced tab 297
system error 342
system setup 47
sensor select tab 47
T
teach 333
teach screen 333
test tool 301
threshold 100, 143, 148, 164
adaptive 108, 155
reject 111, 158
threshold type
absolute 100, 148, 165
edge strength 101, 149, 166
fixed 118, 131, 208
relative 100, 148, 164
tools
average color 174
average gray scale 126
barcode 194
Blob 129
Blob Find 115
Circle 141
color Blob 178
color match 191
PresencePLUS® Pro/ProII/ProII 1.3/ProII Color
Index
tools (continued)
communication 248
coordinate 263
edge 146
geometric count 153
geometric find 105
Line 159
locate tool 98
math 267
measure 272
string 294
test 301
tools (continued)
pattern find 112
tools{pattern count} 171
Trigger and Product Change error codes 60, 328
V
vertical gap 220, 239
W
white balancing 37
391
Index
392
PresencePLUS® Pro/ProII/ProII 1.3/ProII Color