1
TECAN
9. Create/Edit a Method Wizard
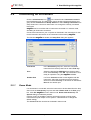
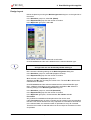
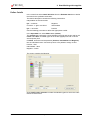
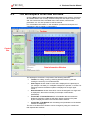
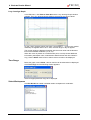
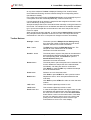
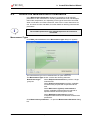
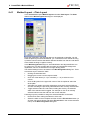
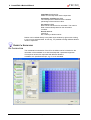
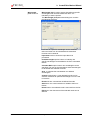
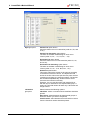
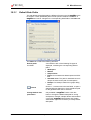
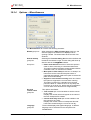
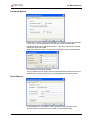
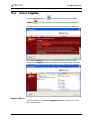
Graph Tab
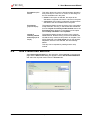
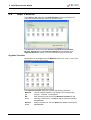
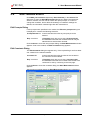
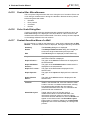
Use this tab to define the appearance of the graph.
Title group box
Following elements are available:
• Label text field: Enter a label for the graph.
• Color button: Select a color for the label of the graph.
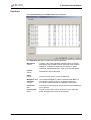
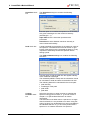
Curves group box
Following elements are available:
• Experimental group spin control: Select the
experimental group to be customized (only available if
more than one experimental group defined).
• Color button: Select a color for the curve of the
selected experimental group.
• Symbol drop down list: Select a symbol for the base
points of the selected experimental group.
• Label text field: Enter a label for the curve of the
selected experimental group.
• Hide curve check box: If selected, the curve is not
displayed.
• Line Width spin control: Select the line width for the
selected experimental group.
2006-01
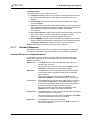
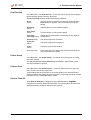
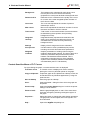
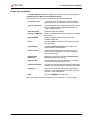
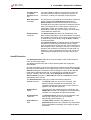
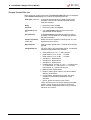
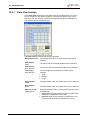
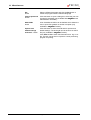
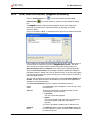
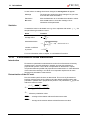
Font group box
Select Small, Medium, or Large font size.
Display... group
box
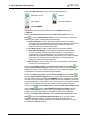
Following elements can be selected to be viewed:
Legend: The curve color, base point style, and label are
viewed together with additional information (analysis
type parameters, correlation coefficient, and so on).
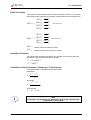
Base points
Intercepts: If intercepts are specified, the intercepts can
be displayed and labeled in the graph.
Error bars: If standards are defined as replicates, a bar
showing the range plus/minus standard deviation is
displayed for each base point.
Instructions for Use for magellan No. 30019874 Rev No. 1.0
9-35