1
Silk Central 15.5
Help
Borland Software Corporation
700 King Farm Blvd, Suite 400
Rockville, MD 20850
Copyright © Micro Focus 2014. All rights reserved. Portions Copyright © 2004-2009 Borland
Software Corporation (a Micro Focus company).
MICRO FOCUS, the Micro Focus logo, and Micro Focus product names are trademarks or
registered trademarks of Micro Focus IP Development Limited or its subsidiaries or affiliated
companies in the United States, United Kingdom, and other countries.
BORLAND, the Borland logo, and Borland product names are trademarks or registered
trademarks of Borland Software Corporation or its subsidiaries or affiliated companies in the
United States, United Kingdom, and other countries.
All other marks are the property of their respective owners.
2014-08-12
ii
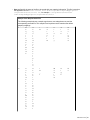
Contents
Silk Central 15.5
..................................................................................................6
What's New in Silk Central 15.5 .......................................................................................... 6
Manual Testing Enhancements ................................................................................6
Multiple Requirements Management Integrations per Project ................................. 6
Git Source Control Profile Integration .......................................................................6
Comparing Test Results of Multiple Test Runs ........................................................ 7
Downloading Displayed Data into Excel ...................................................................7
Storing Percentile Marker Data for Silk Performer Results ...................................... 7
Running the Front-End Server in 64-bit Mode ..........................................................7
What's New in Silk Central Connect .........................................................................7
Usability Enhancements ...........................................................................................8
Integration Enhancements ....................................................................................... 9
Technology Updates ................................................................................................ 9
Getting Started .................................................................................................................... 9
Tour of the UI ........................................................................................................... 9
Installing and Licensing Silk Central
......................................................................12
Issue Manager
.......................................................................................................12
Browser Settings .................................................................................................... 13
Login and Logout
...................................................................................................13
Working with Silk Performer Projects ..................................................................... 14
Working with Silk Performance Explorer
............................................................... 14
Silk Central Architecture .........................................................................................14
Silk Central, Risk-Based Testing, and Quality Goals ............................................. 16
Quick Start Tasks ................................................................................................... 18
Dashboard .........................................................................................................................40
Adding Panels to the Dashboard ............................................................................41
Dashboard Panels ..................................................................................................41
Dashboard Panel Permissions ............................................................................... 44
Adding a Report to a Dashboard Panel ..................................................................44
Requirements ....................................................................................................................45
Managing Requirements ........................................................................................ 45
Requirements Toolbar Functions ........................................................................... 47
Requirements Tree .................................................................................................48
Requirements Document View ...............................................................................49
Requirement Properties ......................................................................................... 49
Requirement Attachments ......................................................................................52
Working with Tests ................................................................................................. 54
Coverage ................................................................................................................57
Requirement History ...............................................................................................58
Requirement Change Notification .......................................................................... 60
Requirements Reports ........................................................................................... 60
Flags .......................................................................................................................62
Requirements Import ..............................................................................................63
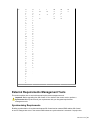
External Requirements Management Tools ........................................................... 69
Tests ................................................................................................................................. 82
Tests Document View ............................................................................................ 82
Working with the Tests Tree ...................................................................................83
Test Toolbar Functions ...........................................................................................88
Test Reports ...........................................................................................................89
Success Conditions ................................................................................................93
Test Containers ...................................................................................................... 94
Contents | 3
Test Folders ........................................................................................................... 95
Test Packages ........................................................................................................96
Test History ............................................................................................................ 99
Tests .....................................................................................................................100
Libraries ................................................................................................................131
Windows Script Host Tests .................................................................................. 139
Test Export, Update, and Import .......................................................................... 144
Integrating Silk Central into Rally ......................................................................... 147
Screen Capturing ................................................................................................. 148
Video Capturing ....................................................................................................149
Execution Planning ......................................................................................................... 150
Execution Planning Toolbar Functions .................................................................150
Execution Planning Document View .................................................................... 151
Manual Execution Planning ..................................................................................152
Configuration Testing ........................................................................................... 166
Working with the Execution Plans Tree ................................................................171
Executing Tests Assigned to Execution Plans ..................................................... 196
Manual Testing .....................................................................................................198
Analyzing Test Runs ............................................................................................ 206
Current Run Page ................................................................................................ 215
Working with Silk Performer Projects ................................................................... 217
Silk Test Classic Tests ......................................................................................... 220
Tracking .......................................................................................................................... 221
Activities ............................................................................................................... 222
Project Overview Report ...................................................................................... 230
Quality Goals ........................................................................................................230
Issues ..............................................................................................................................232
Creating New Issues ............................................................................................ 232
Viewing Issue Statistics in Document View ..........................................................232
Issues Document View .........................................................................................232
Viewing Issue Statistics in Details View ............................................................... 233
Issues Page ..........................................................................................................233
Assigning Existing Issues .....................................................................................233
Updating Issue States .......................................................................................... 234
Deleting Issues (Issue References) ..................................................................... 234
Issue Manager ......................................................................................................234
Reports ............................................................................................................................291
The Reporting Data Mart ......................................................................................291
Reporting Area ..................................................................................................... 306
Code Analysis ...................................................................................................... 323
Default Reports .................................................................................................... 344
Projects ........................................................................................................................... 367
Build Information .................................................................................................. 367
Comparing a Project with a Baseline ................................................................... 368
Selecting Projects .................................................................................................368
Project List ............................................................................................................368
Switching to a Recently-Accessed Project ........................................................... 369
Settings Configuration .......................................................................................... 369
Filtering .................................................................................................................427
Administration ................................................................................................................. 431
Getting Started ..................................................................................................... 432
Configuring the System ........................................................................................ 434
Configuring the Application .................................................................................. 441
Configuring Advanced Settings ............................................................................ 500
System Administration .................................................................................................... 517
System Administrator ........................................................................................... 517
4 | Contents
Databases ............................................................................................................ 518
Clients .................................................................................................................. 522
Infrastructure ........................................................................................................ 526
System Diagnostics ..............................................................................................529
Integrations ..................................................................................................................... 531
Code Analysis Tools Integration ...........................................................................531
Issue Tracking Profile Integrations ....................................................................... 531
Other Integrations .................................................................................................542
Requirement Management Tools ......................................................................... 545
Source Control Profile Integrations ...................................................................... 553
Test Automation Tools ......................................................................................... 567
Communicating with an External System Over SSL ............................................ 588
Contents | 5
Silk Central 15.5
Silk Central is a powerful, all-inclusive, software test-management tool. Silk Central builds quality and
productivity into your testing process, speeding the delivery of successful software projects while
minimizing the risks of application failures. It consolidates all the critical software-testing phases within a
single, scalable, Web-based testing system, enabling your local and distributed software-development
teams to share experiences, resources, and critical information.
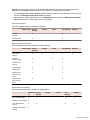
What's New in Silk Central 15.5
Silk Central 15.5 introduces significant enhancements and changes.
Manual Testing Enhancements
Updating all Tests of an Execution Plan or Testing Cycle
The manual testing window has been updated so that the overview area now lists all tests of an execution
plan or testing cycle. This allows you to update the status of several tests very efficiently, while still offering
the update of individual test steps in the test steps area at the bottom of the manual testing window.
Re-running Testing Cycles with Failed/Not Executed Tests
When duplicating a testing cycle, you can now choose how you want to copy the test assignment. For
example, you can choose not to copy Passed tests, enabling you to re-run the testing cycle only with
Failed and Not Executed tests.
Moving Tests Between Testers While Preserving the Interim Results
Interim results are no longer discarded when a manual test is moved from one tester to another. Tests can
be moved within the current or any other running testing cycle.
Synchronizing Tests of an Execution Plan
The Assigned Tests tab of the selected execution plan now offers the ability to synchronize the list of
assigned tests with the most current test assignment.
Multiple Requirements Management Integrations per
Project
You can now configure up to 5 requirements management tool integrations per Silk Central project.
Important: Before upgrading from Silk Central 15.0 or earlier to the current version, perform a
Synchronize All to synchronize all your requirements with your integrated requirements
management tools.
Git Source Control Profile Integration
Silk Central now supports Git with a new source control profile plugin.
6
| Silk Central 15.5
Comparing Test Results of Multiple Test Runs
The Test Results view provides an optimized results overview with full drill-down capabilities. All
information is included, like result files, thumbnail screenshots, messages, and stacktraces. This allows
you to quickly analyze the root cause of failed test runs, especially because you can compare the results of
multiple runs side-by-side.
Downloading Displayed Data into Excel
You can now download displayed tests into an Excel sheet.
This function is enabled in the Document View and Grid View. In the Document View, the action
generates an Excel sheet that includes all currently visible rows. In the Grid View, the action generates an
Excel sheet that includes all rows, not just the visible ones.
Storing Percentile Marker Data for Silk Performer
Results
Silk Performer results contain a high amount of percentile marker data that would consume a lot of space
in the database (table TM_PerfReportPercentileMarker). In previous releases, this information was
always stored in the database, which could cause issues if you have many Silk Performer tests. With Silk
Central 15.5, storing percentile marker data is disabled by default, but can be turned on if desired.
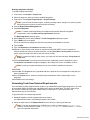
Running the Front-End Server in 64-bit Mode
Use this option to leverage memory above 2GB. Refer to "Memory Settings for Silk Central Servers" in the
Online Help for detailed information.
Restriction: The following integrations are not supported when running the front-end server in 64-bit
mode:
•
•
IBM Rational ClearQuest
IBM Rational RequisitePro
The following integrations have limitations when running the front-end server in 64-bit mode:
•
•
Serena Version Manager (PVCS): The front-end server service needs to run as a user account,
not as system account.
UNC source control: Authentication is not possible.
What's New in Silk Central Connect
Silk Central Connect 15.5 introduces significant enhancements and changes.
Using Silk Central Connect in Silk Central Projects
Silk Central Connect's Silk4J projects can now be used within Silk Central projects.
Combine the powers of Silk Central Connect and Silk Central. This enables you to use all Silk Central
features for your Silk Central Connect projects, for example requirements, issues, attributes, schedules,
parameters, dependencies, notifications, and more.
Silk Central 15.5
|7
Testing Internal Web Applications Using Cloud-Based Execution
Servers
If you are testing an internal Web application on your intranet using cloud-based execution servers, you
can configure the tunnel settings for local intranet website testing. With this setting, the Silk Central
application server opens a tunnel to cloud-based execution servers and acts as a proxy to allow testing a
website in your local intranet. Note that this option is slower than a direct connection, so only select it if
needed.
Usability Enhancements
This section lists the usability enhancements that have been made throughout Silk Central.
Project-Aware Dashboard Panels
You can now configure dashboard panels to always display the data of the currently active project, rather
than having to add multiple panels for different projects.
For most panels, you need to configure a project, as the panel will only show data for a certain project. You
can add several panels to show appropriate data for other projects side-by-side, or configure <Use current
project> for the panel to always display the data of the currently active project. Click
(Configure) in the
header of a panel to configure a different project. You need certain permissions to view or edit the content
of the different panels.
Uploading and Inserting Images in Descriptions
Additionally to inserting linked images, you can now upload and insert images in descriptions of
requirements, tests, and test steps.
Permission to Delete Test Runs and Execution Plan Runs
A new permission has been added for deleting test runs and execution plan runs. Users with the role Test
Manager and Tester own this permission per default.
Conversion of Single-Select Lists to Multi-Select
You can update an existing single-select list to be a multi-select list.
Sending Report Subscriptions as Excel Template Attachment
You can now configure your report subscriptions to send a report per email as attached Excel template.
Improved Assignment of Tests and Requirements
Assigning tests to execution plans and requirements to tests has been made even easier by adding the
options of filtering by name and by adding a context menu to expand and collapse requirement nodes.
Global Search for ID
The global search functionality in Silk Central now also supports searching for IDs across all supported
assets.
The Search field allows you to perform a search across several assets in Silk Central. The following assets
are considered when submitting a global search:
•
•
•
•
•
•
8
| Silk Central 15.5
Requirements and their properties
Tests, folders, test containers and their attribute values, properties, and parameters
Test steps and their properties
Execution plans, configuration suites, testing cycles, folders and their parameters and keywords
Library folders, steps, and shared steps
Issues (only issues that are assigned to a test)
Note: The search index is updated in the background on a regular basis. The search results may
occasionally be slightly outdated.
Linking Issues at Creation in Issue Manager
When creating an issue in Issue Manager, you now have the option to immediately create a link between
this issue and another issue.
Integration Enhancements
This section lists the enhancements that have been made to the integrations in Silk Central.
Team Foundation Server 2013 Support
Silk Central 15.5 now supports Team Foundation Server 2013.
Microsoft Visual Studio/Visual Studio Test Agent 2012 and 2013
Support
Silk Central 15.5 now supports Microsoft Visual Studio/Visual Studio Test Agent 2012 and 2013.
IBM Rational DOORS 9.5 Support
Silk Central 15.5 now supports IBM Rational DOORS 9.5.
Bugzilla 4.4.2 Support
Silk Central 15.5 now supports Bugzilla 4.4.2.
Mandatory Field Support for Bugzilla Integration
Silk Central now supports mandatory fields in its Bugzilla issue tracking profile integration.
Technology Updates
Oracle 12c (version 12.1.0.1.0) Support
Silk Central 15.5 now supports Oracle 12c (version 12.1.0.1.0).
Getting Started
Silk Central promotes product quality throughout the development cycle.
Today's e-business systems are increasingly complex, and reliability is more important than ever.
Therefore, assuring product quality throughout the development cycle is an important key to success. The
best way to check a product’s quality over time is to perform key tests on a daily basis. Silk Central helps in
this regard by automating test executions that follow freely configurable schedules, both during product
development and after deployment. By providing reports with different levels of detail, checking the status
of products in development is as straightforward as checking an HTML report in a Web browser.
With complex software projects, thorough testing of new builds is critically important. Silk Central saves
time and man hours by automating this process.
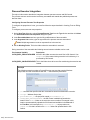
Tour of the UI
This topic provides an overview of the Silk Central user interface.
Silk Central 15.5
|9
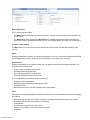
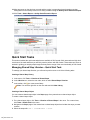
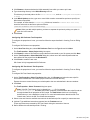
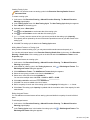
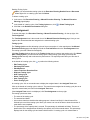
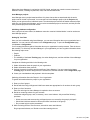
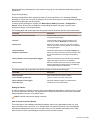
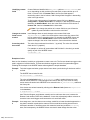
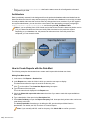
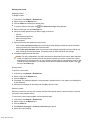
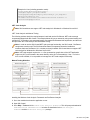
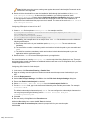
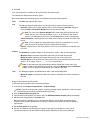
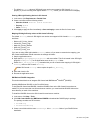
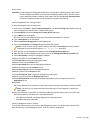
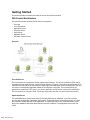
Basic UI Structure
The UI of Silk Central includes:
•
•
The Menu: Placed across the top of the user interface. It gives you quick access to the functional units
of Silk Central.
The Workspace: In this example, the Workspace is the tabbed region showing the functional work
area of the currently selected Silk Central unit. This view changes based on the unit you are working in.
The Units of Silk Central
The Menu gives you quick access to the functional units of Silk Central. It includes the following major
sections:
Home
Displays the dashboard, which is your personal starting area. You can customize the dashboard by adding
and arranging various panels, which give you the information you need for your daily work.
Requirements
Displays and enables you to maintain control over your project's requirements during development. You
can perform the following tasks:
•
•
•
•
Create, modify, and delete requirements.
Associate tests with requirements.
Track the change history of requirements.
Generate test plans from requirement lists.
You can additionally access and manage the following:
•
•
•
•
Properties of the requirements.
Integrated external requirement-management tools.
Requirement filters.
Notifications that inform you about changes to the requirements.
Tests
Enables you to create and manage automated and manual tests. You can additionally access and manage
the following:
•
•
•
•
•
•
10
| Silk Central 15.5
Libraries of shared steps, out of which commonly-used manual tests and test steps can be reused.
Properties of the individual test steps for manual tests.
Test attributes.
The data sources that can be used for tests.
Source control profiles, in which these tests are stored.
Test filters.
•
•
Notifications that inform you about changes to the tests.
Version and build of the product that is tested with a specific test.
Execution Planning
Displays and allows you to manage the executions that execute the tests. You can perform the following
tasks:
•
•
•
•
•
Configure execution plans.
Assign tests to execution plans.
Set-up execution plan dependencies.
Configure execution-server deployment, including the execution servers on which the tests are
executed.
Plan and manage the manual execution of tests.
You can additionally access and manage the following:
•
•
•
•
Execution filters.
Execution schedules.
Version and build of the product that is tested with a specific execution of a test.
Notifications that inform you about changes concerning the execution process.
Tracking
Displays the Activities page, the Cross-Project Activities page, the Project Overview Report, and
Quality Goals.
The Activities page displays the activity for recently-executed, current, and upcoming execution plans on
a per-project basis.
Issues
Displays and enables you to manage the issues that are related to the active project.
You can additionally access and manage the following:
•
•
Projects in Issue Manager, when issues reside in Issue Manager.
External issue tracking profiles, in which issues may possibly reside.
Reports
Displays and enables you to manage the reports which provide you with information on the requirements,
tests, and execution plans. You can perform the following tasks:
•
•
•
•
Generate reports.
Download report templates.
Edit report parameters.
Create new reports based on pre-installed templates.
Additionally provides access to code analysis functionality information, with which you can evaluate the
degree to which the code in your Application Under Test (AUT) is covered by test cases. You can then
make informed estimates regarding effort, cost, and risk associated with specific code changes.
Global Search
The Search field allows you to perform a search across several assets in Silk Central. The following assets
are considered when submitting a global search:
•
•
Requirements and their properties
Tests, folders, test containers and their attribute values, properties, and parameters
Silk Central 15.5
| 11
•
•
•
•
Test steps and their properties
Execution plans, configuration suites, testing cycles, folders and their parameters and keywords
Library folders, steps, and shared steps
Issues (only issues that are assigned to a test)
Note: The search index is updated in the background on a regular basis. The search results may
occasionally be slightly outdated.
Projects
Displays and enables you to manage all projects in your Silk Central installation from a high-level testmanager’s view. Additionally enables you to switch between projects, and manage project settings.
User
Displays and enables you to manage user settings. Additionally enables the following:
•
•
•
Log out of Silk Central.
Print the current Silk Central page.
Bookmark the current Silk Central page. This is especially useful for bookmarking reports, where the
current parameters are saved in the book-marked URL.
Administration
Displays and enables you to manage the administration settings. For additional information, see the
Administration topics in this Help.
Help
Click to view context-sensitive help for the current page. Additionally provides access to the following:
•
•
•
The Silk Central documentation.
Tools that are shipped with Silk Central.
About. Shows version and license information.
Context Menu Commands
Silk Central supports Windows-style context menus across many test management elements, for example
tests, requirements, execution plans, folders, containers, reports, and more. Available through right mouseclick, context menu commands typically include those commands that are available from each unit's
toolbar. For elements listed in tree views, context menus offer commands for expanding and collapsing
tree view elements. Commands that are not available to selected elements are disabled.
Installing and Licensing Silk Central
For information regarding the installation and licensing of Silk Central, refer to the Silk Central Installation
Help, which is also available from both the Silk Central installation CD and the Silk Central download site.
Issue Manager
Issue Manager, the issue-tracking tool of Silk Central, is fully integrated with Silk Central, enabling you to
correlate issues with system requirements and executed tests.
Test issues can be added and managed in the menu through Tests > Details View > Issues. For more
information, see the Issue Manager topics in this Help.
12
| Silk Central 15.5
Browser Settings
To optimize the functionality and performance of Silk Central, adjust the following settings in your browser:
•
•
Make sure that you enabled the cache of your browser.
If you have problems accessing Silk Central through the browser, add the Silk Central server to the list
of trusted sites in your browser.
For a list of supported browsers, refer to the Release Notes. In the menu, click Help > Documentation .
Click Silk Central 15.5 Release Notes.
Login and Logout
The procedures in this section explain how to log in to and out of Silk Central.
Logging in to Silk Central
To log in to Silk Central:
1. Navigate to the URL of your Silk Central installation.
2. On the Silk Central login page, enter your user name in the form <client>\<username> and your
password.
When you login to Silk Central with a user of the default client, you do not need to enter the client name.
Just enter your user name.
3. If you check the Remember login check box, you will stay logged in until you click Log out in the menu
(User > Log out).
4. Click Login.
You will be directed to your personal Dashboard. You can quickly Continue working in your last visited
area by clicking this link on the top of the Dashboard page.
Logging out from Silk Central
To log out from Silk Central:
1. In the menu, go to User:<Username>.
2. Click Log out.
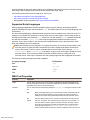
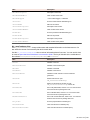
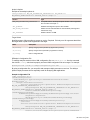
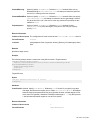
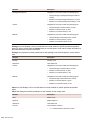
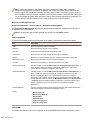
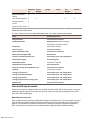
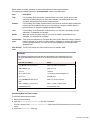
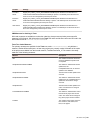
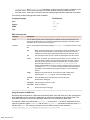
Login Page
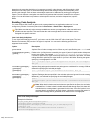
Use this page to login to Silk Central. The page displays the following items:
Item
Description
Client\Username
Enter your LDAP or Silk Central user name in the
following way: <client>\<username>. When you login to
Silk Central with a user of the default client, you do not
need to enter the client name. Just enter your username.
Password
Enter a valid password for the user name that you
entered.
Remember login
If you check the Remember login check box, you will
stay logged in until you click Log out in the menu (User >
Log out).
Silk Central 15.5
| 13
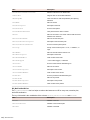
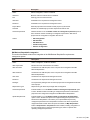
Item
Description
Login
Logs you in to Silk Central (if the entered credentials are
valid).
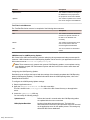
Working with Silk Performer Projects
Silk Performer is fully integrated with the test and execution functionality of Silk Central. Silk Performer
projects can be integrated into Silk Central tests and directly executed through Silk Central. This allows for
powerful test-result analysis and reporting. It also enables unattended testing, which means tests are run
automatically by Silk Central based on pre-configured schedules.
Refer to the Silk Performer Help for details on configuring the integration of Silk Performer with Silk
Central.
Silk Performer project files can be directly opened in Silk Performer from Silk Central, where scripts and
settings can be edited. Edited Silk Performer projects can subsequently be checked back into Silk Central
to make them available for future test executions.
Silk Central provides information on execution plan run properties during Silk Performer test executions.
Use the AttributeGet methods to access execution plan run properties in the Silk Performer script. You
can access the following properties in the script:
•
•
•
•
•
•
•
•
•
#sctm_execdef_name
#sctm_execdef_id
#sctm_product
#sctm_version
#sctm_build
#sctm_keywords
#sctm_test_results_dir
#sctm_test_name
#sctm_test_id
Note: The term Project is used differently in Silk Performer than it is in Silk Central. A Silk Performer
project, when uploaded to Silk Central, becomes the core element of a Silk Central test. Silk Central
projects are high-level entities that may include multiple Silk Performer projects, tests, execution
plans, and requirements.
Working with Silk Performance Explorer
Silk Performance Explorer (Performance Explorer) is used for in-depth analysis of test runs. Performance
Explorer results analysis can be started directly from the Execution area and the Tests area of Silk
Central through execution runs on the Runs page or from Performance Explorer itself. Refer to the
Performance Explorer documentation for details regarding the integration of Performance Explorer with Silk
Central.
The results of load-test runs in Silk Performer can also be uploaded to Silk Central and associated with
tests. Refer to the Silk Performer Help for more details.
For additional information about the integration of Silk Central integration with Silk Performer, refer to the
Silk Performer Help and the Performance Explorer User Guide.
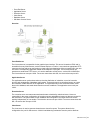
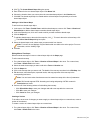
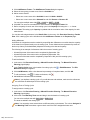
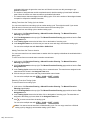
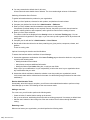
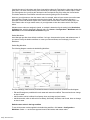
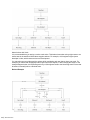
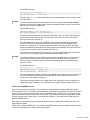
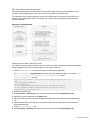
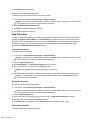
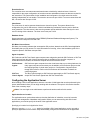
Silk Central Architecture
The following sections describe the Silk Central components.
•
14
| Silk Central 15.5
Overview
•
•
•
•
•
•
Front-End Server
Application Server
Execution Server
Chart Server
Database Server
Silk Meter License Server
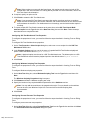
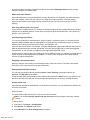
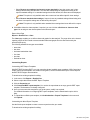
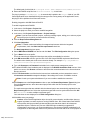
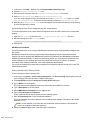
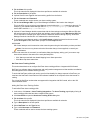
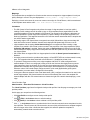
Overview
Front-End Server
The front-end server is responsible for the graphical user interface. This server is based on HTML and is
accessible from any Web browser, such as Internet Explorer or Firefox. A user sends an appropriate HTTP
request to the front-end server and receives a login page for authentication. After successful login, the user
can use the corresponding application based on the respective user rights. The front-end server can
operate as a stand-alone HTTP server, or it can be attached to a Web server, such as IIS via ISAPI filter.
The front-end server uses port 19120. For secure connections with SSL, the server also uses port 443.
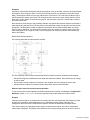
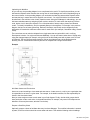
Application Server
The application server synchronizes tasks such as the distribution of schedules, control of execution
servers, and management of database configuration. These tasks require a centralized agency to ensure
the consistent, reliable behavior of the application. The application server also evaluates results, saves
them to the database, and sends alerts based on success conditions. The application server uses port
19122.
Execution Server
The execution server executes automated tests that are scheduled by authorized users. Users are
responsible for the proper configuration of execution servers and additional resources that are required for
test executions. The system allows for the installation and configuration of multiple execution servers
working independently of one another. The execution server uses port 19124. For secure connections with
SSL, the server also uses port 19125.
Chart Server
The chart server is used to generate charts that are viewed in reports. The system allows for the
configuration of a pool of chart servers. A built-in load balancing mechanism uses the pool to distribute
Silk Central 15.5
| 15
chart generation. The chart server is also used to generate reports and deliver them directly to the enduser for viewing within a browser. The chart server uses port 19126.
Database Server
System persistency is implemented using a RDBMS (Relational Database Management System). The
database server uses ports 1433 and 1521.
Silk Meter License Server
Silk Meter, the licensing software that accompanies Silk products, determines the Silk Central-application
functionality that you may access. For more information on licensing, refer to the installation guide of the
respective product. Silk Meter uses port 5461.
Agent Computers
Silk Performer and Silk Test Classic agent computers are assigned to particular Silk Performer or Silk Test
Classic projects from the pool of agent computers that are available to the controller computer. In
combination with Silk Central, the controller computer acts as an execution server.
Silk Performer
Agents
Silk Performer agent computers host the virtual users that are run during load tests. As
many agent computers as necessary can be added to a Silk Performer project so that
the required quantity of virtual users can be run. Configuration of agents is done
through Silk Performer. Refer to the Silk Performer documentation for details on
configuring agents.
Silk Test
Classic Agents
The same rules that apply to Silk Performer agents apply to Silk Test Classic agents,
except Silk Test Classic agents host Silk Test Classic tests.
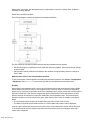
Silk Central, Risk-Based Testing, and Quality Goals
Often during software development, a balance must be struck between testing scope, time, and cost. One
commonly used method in determining this balance is risk-based testing.
A key practice of risk-based testing is the process of categorizing test assets based off of factors important
to the quality and to the end users of the application.
Based off of this categorization process, quality practitioners can determine the appropriate set of tests
based off of time available and the desired goals of the quality process. Executing a subset of tests
involves some amount of risk. Quantifying this risk in a relevant way ensures that the stakeholders are
informed throughout the process, which is key for a successful implementation of risk-based testing.
In Silk Central, factors used for risk-based testing are completely customizable using Quality Goals. A
quality goal can be created for any List type custom attribute or requirement property which are used to
categorize testing assets. This allows users to define a subset of tests that need to be executed in order for
the project to meet specific quality criteria. Quality goal reporting allows users to communicate to
stakeholders the test planning and execution process, relevant scope, time, and quality metrics on testing
assets.
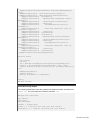
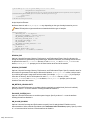
Implement a Risk-Based Testing Approach by using Quality Goals
For a given project, a user wants to balance the scope of testing and time while still ensuring the
application is of acceptable quality. The following steps illustrate a high-level workflow of how a user can
use quality goals to implement a risk-based testing approach.
In this project, the stakeholders are interested in ensuring enough of the test bed has been executed as
well as ensuring the most important requirements have been sufficiently tested. The data for the below
example is also included in the Demo project that is included with new versions of Silk Central.
1. Select a project.
16
| Silk Central 15.5
2. Create a requirement property of type List to capture the importance of the requirement.
For this example, create the requirement property Business Value with values:
• Low
• Medium
• High
3. Create a test attribute of type List to capture the type of purpose of the tests.
For this example, create the test attribute Level with values:
• Full
• Regression
• Smoke
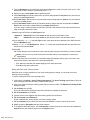
4. Click Tracking > Quality Goals.
5. Create a new quality goal.
For this example, create the quality goal Business Value for requirement property with the following
Goal %:
• High-100%
• Medium-75%
• Low-50%
6. Create a new quality goal.
For this example, create the quality goal Test Objectives for the test attribute with the following
Goal %:
• Full-80%
• Regression-50%
• Smoke-100%
7. After the test assets are developed, assign the attributes/properties to the requirements and tests.
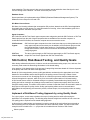
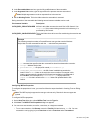
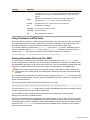
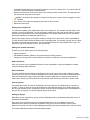
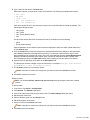
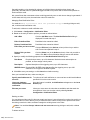
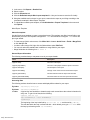
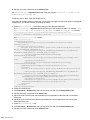
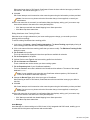
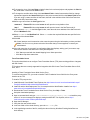
8. To determine the testing scope and ensure stakeholder agreement in the testing scope, click Reports >
Details View.
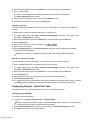
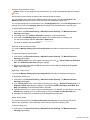
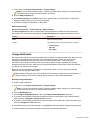
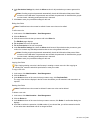
9. Click Tests > Status Report > Quality Goals Planning Report.
This report will show you the number and percentage of tests for each quality goal value, total planned
time for manual tests, and the number of tests required to meet the goal vs. the number of test available
in the project.
Silk Central 15.5
| 17
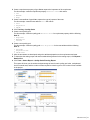
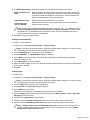
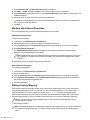
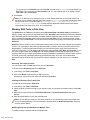
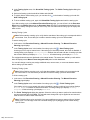
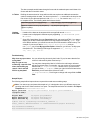
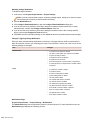
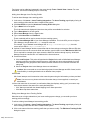
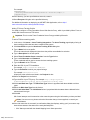
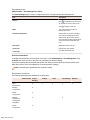
10.After agreement on the plan has occurred and the project is progressing through testing execution,
testing status for the Quality Goals can be easily evaluated using the Quality Goals Execution Report.
11.Click Tests > Status Report > Quality Goals Execution Report.
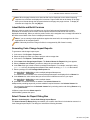
Quick Start Tasks
This section includes the quick start tasks that are available in Silk Central. Quick start tasks are high-level
overviews of the main tasks that you will likely need to perform with Silk Central. These tasks can serve as
tutorials in guiding you step-by-step through the best practice usage of the core functionality of Silk Central.
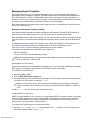
Managing Shared Step Libraries - Quick Start Task
To manage your shared step libraries, you will need to perform some or all of the following tasks.
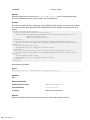
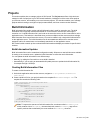
Creating a Shared Step Library
1. In the menu, click Tests > Libraries of Shared Steps.
2. In the Libraries tree, select the root node, which is called Shared Steps Libraries.
3. In the toolbar, click
to create a new library.
Note: You can also right click on the root node and click New Library.
Creating a Shared Steps Object
You can create a shared steps object in the Steps page of any manual test or shared steps object.
To create a shared steps object:
1. For a shared steps object, click Tests > Libraries of Shared Steps in the menu. For a manual test,
click Tests > Details View in the menu.
2. Navigate to the Steps page of the manual test or shared steps object that includes the steps you want
to share.
3. Select the steps with CTRL + CLICK or SHIFT + CLICK.
18
| Silk Central 15.5
4. Click
. The Create Shared Steps dialog box opens.
5. Enter a name for the new shared steps object in the Name field.
6. Choose the location where you want to place the new shared steps object in the Libraries tree.
7. Click OK. The shared steps object is created and the selected steps are replaced by a call to the
shared steps object.
Adding a Call to Shared Steps
To add a call to a shared steps object:
1. In the menu, click Tests > Details View to add the shared steps to a test or click Tests > Libraries of
Shared Steps to add the shared steps to another shared steps object.
2. In the corresponding tree, click on the node to which you want to add the shared steps.
3. Click the Steps tab.
4. To add the shared steps to the end of the steps list, click
. To insert it above the selected step, click
. The Call to Shared Steps dialog box opens.
5. Select the shared steps node, whose steps you want to add, from the tree.
Note: For a test, the tree displays only the libraries that are visible to the active project. For more
information, see the Visibility Page.
6. Click Ok.
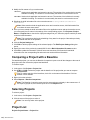
Editing Manual Test Steps
Edit the manual test steps of a test or a shared steps object in the Steps page.
To edit a manual test step:
1. For a shared steps object, click Tests > Libraries of Shared Steps in the menu. For a manual test,
click Tests > Details View in the menu.
2. Select the node whose steps you want to edit in the Tests or Libraries tree.
3. Click the Steps tab.
4. Click on the test step that you want to edit. The details of the test step are shown in the Edit Step view.
5. Edit the name, action description, expected results, and step properties of the test step in the
corresponding text boxes.
Note: You can insert values from data sources into manual test steps in the form of parameters.
Note: Silk Central supports HTML formatting and cutting and pasting of HTML content for
Description text boxes.
6. Perform one of the following actions to finish editing the test step:
•
•
•
Click OK and New Step to save your changes and add a new step after the current one.
Click OK to save your changes.
Click Cancel to revert your changes.
Creating a Version
To be able to revert a set of changes you want to apply to a shared steps object or a manual test, create a
version of the element.
To create a version of a shared steps object or a manual test:
1. For a shared steps object, click Tests > Libraries of Shared Steps in the menu. For a manual test,
click Tests > Details View in the menu.
Silk Central 15.5
| 19
2. Select the shared steps object in the Libraries tree, or the manual test in the Tests tree.
3. Click
in the toolbar.
This action is only enabled if the shared steps object or the manual test was changed.
The Create Versions dialog box opens.
4. Optional: Enter a comment on the version in the Comment text box.
5. Click Ok. The new version is shown in the History page.
Comparing Versions
To view the differences between two versions of a shared steps object or a manual test, compare the
versions.
To compare two versions of a shared steps object or a manual test:
1. For a shared steps object, click Tests > Libraries of Shared Steps in the menu. For a manual test,
click Tests > Details View in the menu.
2. Select the shared steps object in the Libraries tree, or the manual test in the Tests tree.
3. Click the History tab.
4. Select the two versions you want to compare with CTRL + CLICK.
5. Right click on the selection.
6. Select Compare Versions. The Compare Versions dialog box opens, displaying all the added,
changed, and removed content.
Note: Use the arrows to change the version numbers and compare additional versions.
Reverting to a Previous Version
To undo changes to a shared steps object or a manual test, revert to a previous version.
To revert a shared steps object or a manual test to a previous version:
1. For a shared steps object, click Tests > Libraries of Shared Steps in the menu. For a manual test,
click Tests > Details View in the menu.
2. Select the shared steps object in the Libraries tree, or the manual test in the Tests tree.
3. Click the History tab.
4. Right-click on the version to which you want to revert the shared steps object to.
5. Click Revert to Version <ID>.
6. The shared steps object or manual test is reverted to the selected version and a new version is created
in the History page. Attachments, parameters, and data sets are not reverted for manual tests.
Configuring Projects - Quick Start Task
To configure a project, you will need to perform some or all of the following tasks.
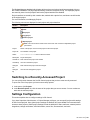
Configuring Project Settings
To customize the project settings:
1. In the menu, click Project:<Project Name> > Project Settings .
Note: If you have not selected a project, a warning message opens, asking you to select a project.
Select the project for which you want to define the setting.
2. Click the Project Settings tab to view the current settings. The Project Settings page opens.
3. Click Edit to modify the current project settings.
20
| Silk Central 15.5
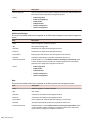
4. The Edit Project Settings dialog box displays. You can specify the following information:
Build Information File
Name
Build information files contain project information, including build number,
build log location, error log location, and build location. Enter the name of
your project’s build information file in this text box. All test executions will
read the build information from this specified file.
Project Release Date
Specify the planned release date for your project.
File Extensions to
ignore in Results
Specify result file types or other file types that should not be saved as
results for test executions.
Note: File extensions must be separated by commas, for example, xlg, *_, res. Changes made in
the Build Information File Name and File Extensions to ignore in Results fields will not effect
scheduled tests. To redistribute tasks to execution servers, you must reschedule the tests, or
disconnect from and reconnect to the database.
5. Click OK to save your project settings.
Creating Custom Attributes
To create a custom attribute:
1. In the menu, click Project:<Project Name> > Project Settings .
Note: If you have not selected a project, a warning message opens, asking you to select a project.
Select the project for which you want to define the setting.
2. Click the Attributes tab to view the list of current attributes.
3. Click New Attribute. The New Attribute dialog box displays.
4. Type a Name for the new attribute. This name will be displayed in list boxes when the attribute
becomes available for use.
5. Type a Description for the new attribute.
6. Select the attribute Type. See the Test Attribute and Requirement Property Types topic for descriptions
of each type of attribute.
7. Click OK.
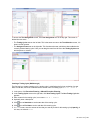
Creating Filters
To create a filter:
1. In the menu, click Project:<Project Name> > Project Settings .
Note: If you have not selected a project, a warning message opens, asking you to select a project.
Select the project for which you want to define the setting.
2. Click the Filters tab to view the list of available filters.
3. Click New Filter. The New Filter dialog box appears.
4. Type a Name for the new filter.
This name will be displayed in list boxes when the filter becomes available.
5. Select a Category from the list to make the filter available in the Requirements, Tests, or Execution
Planning area of Silk Central.
6. Optional: Type a Description for the new filter.
7. Optional: Check the Visible to other users check box to allow other users to see the filter.
8. Optional: Check the Editable by other users check box to allow other users to edit the filter.
Note: If Visible to other users and Editable by other users are checked, the filter is public. To
delete non-public (private) filters, you have to be the owner of the filter or you need the Delete
private filters of other users permission.
Silk Central 15.5
| 21
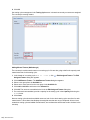
9. Select a category of filter criteria from the Selection criteria list. The available categories depend on
the general filter category you have selected.
Note: You can combine filters by selecting Nested Test Filter or Nested Requirement Filter.
Selecting one of these categories allows you to include an existing filter in your new filter.
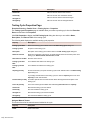
10.Select a Property, Operator, and Value for the filter from the respective lists.
Property Available properties depend on the filter category that you have selected in the previous
step. Defines the property for which you are defining a filter setting. If you have selected an
attribute category, the property list includes custom attributes to query against.
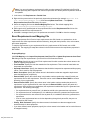
Operator Specifies the filter operator. The operator depends on the property type you have selected.
For example, if you have selected a property that is based on a string field type, the
following operators are available:
Value
Operator
Description
=
The string equals the defined value.
not
The string is different than the defined value.
contains
The string contains the defined value.
not contains
The string does not contain the defined value.
Enter the value that you want to filter out. Depending on the property type that you have
selected, values will either be strings that you can enter into the field, or a selection of
predefined values that you can select from the list box.
11.Optional: Click More if you want to add more than one filter category to the new filter. Repeat this
procedure to define new categories.
Note: If you define more than one filter category, you must define whether the categories need to
be fulfilled in addition to the existing categories (AND relationship), or if the filter returns true when
one of the filter categories is fulfilled (OR relationship). Select either AND or OR to define the filter
category relationship. You cannot define nested AND, OR relationships.
12.Optional: To remove filter categories, click Fewer. This removes the last filter category.
13.Click OK to save the new filter, or click Cancel to abort the operation.
Enabling Change Notification
To enable change notification:
1. In the menu, click Project:<Project Name> > Project Settings .
Note: If you have not selected a project, a warning message opens, asking you to select a project.
Select the project for which you want to define the setting.
2. Click the Notifications tab.
3. Click Configure Email Notification to open the Configure Email Notification dialog box.
4. If you want to be notified by email when changes are made to requirements in the currently selected
project, check the Changes on Requirements check box.
5. If you want to be notified by email when changes are made to tests within the currently selected project,
check the Changes on Tests check box.
6. Click OK to save the notification settings, or click Cancel to abort the operation without saving changes.
You will be notified by email about changes for which you have activated notification.
Creating Step Properties
To create a new step property:
22
| Silk Central 15.5
1. In the menu, click Project:<Project Name> > Project Settings .
Note: If you have not selected a project, a warning message opens, asking you to select a project.
Select the project for which you want to define the setting.
2. Click the Step Properties tab.
3. Click New Property. The New Step Property dialog box opens.
4. Enter a name for the new property in the Name text box.
Note: Step property fields are always declared as type string.
5. Click OK to make your property available to all manual test steps in the selected Silk Central project.
Note: To create a step property for a library, select the library node in the Libraries tree and
continue with the second step.
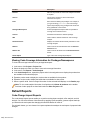
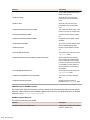
Analyzing Test Results - Quick Start Task
To analyze the results of a test, you will need to perform some or all of the following tasks.
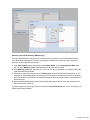
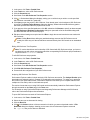
Creating New Reports
To create a new report:
1. In the menu, click Reports > Details View.
2. In the Reports tree, select the folder in which you want the new report to display.
This determines where the report is stored in the directory tree.
3. Click
on the toolbar. The Create New Report dialog box opens.
4. Type the name of the new report.
This is the name that is displayed in the Reports tree.
5. Check the Share this report with other users check box if you want to make this report available to
other users.
6. In the Timeout [s] field, type the maximum time period in seconds that Silk Central should wait for SQL
queries to complete.
7. From the Default tab list, select the tab that you want to be directed to when you select this report from
one of the context-sensitive report lists.
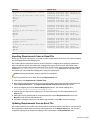
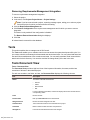
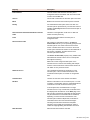
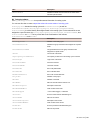
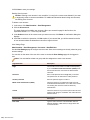
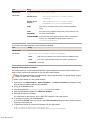
8. Select the corresponding result type from the Result category list.
This setting specifies the database table and view that is to be filtered for the report. The following result
types are available:
Result Type
Description
Requirement
Returns requirements available in the Requirements module that meet
the query criteria.
Test
Returns tests available in the Tests area that meet the query criteria.
Test Execution
Returns executed test results from the Executions area that meet the
query criteria.
Execution Plan
Returns execution plans from the execution area.
Issue
Returns issues, including imported issues.
Requirement Progress
Builds
Contains information on requirements progress per build so that you can
see how requirements develop across builds.
Requirement Progress
Days
The same as Requirement Progress Builds, but shows development on
a daily basis.
Silk Central 15.5
| 23
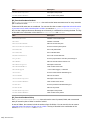
Result Type
Description
Test Progress Builds
Shows how tests develop across builds.
Test Progress Days
Same as above, but shows development on a daily basis.
Each result type offers a set of selection criteria. Based on the result type you have selected, specify an
appropriate Selection criteria for your report. These criteria typically group properties based on a view
or some other intuitive grouping, for example custom properties.
9. From the Property list, select the property that is to be filtered on.
For some selection criteria, properties are dynamic.
10.Select an Operator for the query.
The available operators depend on the property. Example operators are =, not, like, and not like.
Strings are always compared lowercase. Allowed wildcards for strings are "*" and "?", where * matches
any characters and ? matches exactly one character.
11.Select or specify the Value that the query is to be filtered on.
For date-based properties, the Value field is replaced with a calendar tool that you can use to select a
specific date.
12.Optional: To add an additional query string to this report, click More. An existing query string can be
deleted by clicking the string’s Delete button. When multiple query strings are defined, AND and OR
option buttons are displayed next to More. Use these option buttons to define if the queries should be
considered cumulatively, or if only one query string’s criteria needs to be met.
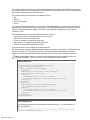
13.Click Next to configure report columns on the New Report dialog box.
14.Click Add Columns. The Add Columns dialog box lists all available report columns.
15.Select the columns that you want to have included in the report and click OK.
You can select multiple columns with Ctrl+Click.
Note: For test-planning reports, the list of available column names is enhanced with the column
names from the LQM_v_tests table. For details, refer to the Silk Central Database Model Schema.
The selected columns display in tabular format on the New Report dialog box.
16.Optional: Configure how each report column is to be displayed. For each column, specify a sort
direction, ascending, descending, or unsorted, using the up/down arrows in the Sorting column.
17.When multiple columns are selected for sorting, a list box is displayed in the Sort Order column that
allows you to more easily edit the column-sort order. Set these numbers as required.
18.Give each column an Alias.
This is the name by which each column will be labeled in the generated report.
19.With grouping, you can take advantage of SQL aggregation features, for example when selecting a
number of elements or querying a total sum of values. Check the Group by check box to specify that
SQL group by functions are to be applied.
20.Columns that are not selected for SQL group by functions are set to aggregation by default, which
means a single aggregate value is calculated. From the Aggregation list, select the appropriate
aggregation type.
The following types are available:
•
•
•
•
•
Count
Sum
Average
Minimum
Maximum
21.The Actions column enables you to move column listings up and down in the view, or to delete a
column.
22.Click Finish to complete your new report.
24
| Silk Central 15.5
Editing Report Properties
To edit the properties of a report:
1. In the menu, click Reports > Details View.
2. Select a report in the Reports tree.
3. Click the Properties tab.
4. Click Edit. The Edit Report dialog box appears.
5. Modify the Name, the Description and the Timeout [s] of the report as required.
6. Check the Share this report with other users check box if you want to make this report available to
other users.
7. From the Default tab list, select the tab that you want to be directed to when you select this report from
one of the context-sensitive report lists.
8. You can edit the report in two ways:
•
Create a simple report: Use the Selection criteria, Property, Operator, and Value lists to generate
SQL queries. Click More to add further query strings and choose the operators AND or OR to
combine the queries. Click
•
to delete a query string.
Create an advanced report: If you are familiar with SQL, you may want to edit the query code. Click
Advanced Query and modify the query code within the Report data query field. The Insert
placeholder list assists you in editing the SQL queries with pre-defined function placeholders. Click
Simple to go back to the simple mode.
Note: If you manually edit the SQL code for the query, upon finishing, click Check SQL to confirm
your work.
9. Click Finish to save your changes.
Editing Report Parameters
To edit the parameters of a report:
1. In the menu, click Reports > Details View.
2. Select a report in the Reports tree.
3. Click the Parameters tab. If the report has parameters defined for it, the parameters are listed here.
4. Click Edit Parameters. The Edit Parameters dialog box appears.
5. Edit the Label or Value of the listed parameters as required.
6. From the Usage list, select the usage type of the parameter:
•
•
•
Constant Value
Start Time
End Time
7. Click OK.
Writing Advanced Queries with SQL
Advanced reports can be created through manual SQL coding. Virtually any reporting option is available if
you know the database schema. Clicking Advanced Query hides the query string list boxes and opens the
Report data query field in which you can insert existing code or write new SQL code.
Restriction: The SQL statement select top is not supported.
One approach is to begin query-string construction using the list boxes as outlined in Creating New
Reports. If the report criteria are valid, the equivalent SQL statement will be generated and displayed, and
then move to advanced mode for further modifications.
Silk Central 15.5
| 25
Note: If you switch from advanced mode back to simple mode the changes you made within the code
will be lost.
To write an advanced query directly in SQL:
1. In the menu, click Reports > Details View.
2. In the Reports tree, select the folder in which you want the new report to display.
This determines where the report is stored in the directory tree.
3. Click
on the toolbar. The Create New Report dialog box opens.
4. Type the name of the new report.
This is the name that is displayed in the Reports tree.
5. Check the Share this report with other users check box if you want to make this report available to
other users.
6. Type a description of the report in the Description field.
7. Click Advanced Query to open the Report data query field. Insert previously written code or write new
code directly in the field.
The Insert placeholder list assists you in editing the SQL queries with pre-defined function
placeholders. For details, see SQL Functions for Custom Reports.
Note: If you manually edit SQL code for the query, click Check SQL to confirm your work.
8. Click Finish to save your settings.
Customizing BIRT Report Templates
With BIRT RCP Designer (BIRT), you can customize the pre-installed report templates of Silk Central and
create custom report templates. For details on using BIRT, see the Administration topics in this Help and
the BIRT RCP Designer documentation.
To download an existing template for editing:
In the menu, click Reports > Details View.
Select a report that utilizes the BIRT Report Template.
Click the Properties tab.
Click Download BIRT report template. You receive the report data as an empty generic BIRT report
template. The datasource is already configured.
5. Once you have saved the template to your local system, modify it as required.
For detailed information on configuring BIRT report templates, see the Administration topics in this
Help.
6. To upload the modified report template, click Administration > Report Templates in the menu and
click Upload.
1.
2.
3.
4.
Adding Sub-Reports
To aggregate the results from multiple reports into the currently selected report, you can add sub-reports.
When adding a report as a sub-report, the result columns and rows of the sub-report are concatenated to
the results of the selected report.
To add a report as a sub-report:
1.
2.
3.
4.
26
| Silk Central 15.5
In the menu, click Reports > Details View.
Select a report in the Reports tree.
Click the Properties tab.
Click Add Sub-Report.
The Add Sub-Report dialog box appears.
5. From the Reports tree, select the sub-report you want to append to the current report.
6. Click OK to complete the addition of the sub-report. Sub-reports are displayed on the associated
report’s Properties page in the Sub-Reports section.
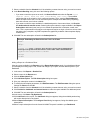
Viewing Reports
Because each template expects a certain data format to produce a useful graph, not all templates can be
applied to all report queries. You will receive an error message if you attempt to generate a report through
an incompatible report template. For example, selecting the Four Values Per Row As Horizontal Bar
template to display the Requirements Status Overview report works because this particular Microsoft Excel
template requires exactly the four values, failed, passed, not executed, and not covered that the
report query delivers.
To generate a report:
1. In the menu, click Reports > Details View.
2. In the Reports tree, select the report that you want to generate.
3. Click the Report tab.
4. Click the link <Click here to choose a report template>. The Select Report Template dialog box
displays.
5. Select the template you wish to use.
6. Click OK to display the report.
Displaying Charts
To display a chart:
1. In the menu, click Reports > Details View.
2. Select a report in the Reports tree.
3. Click the Chart tab to display the default chart.
4.
To select a different chart type, click
. The Select Chart Type dialog appears.
5. Select a chart type from the Chart type list.
6. Check the view properties that you want to apply to the chart:
• 3D view
• Show horizontal grid lines
• Show vertical grid lines
• Show legend
7. Specify how these chart options are to be saved:
•
•
Click the For current user only option to have these chart settings override the report’s standard
settings whenever the current user views this chart.
Click the As report standard option to have these chart settings presented to all users who do not
have overriding user settings defined. This setting does not effect individual user settings.
8. Click OK to display the new chart type.
Note: The chart configurations you define here become the default for this report. When standard
charts and graphs are not able to deliver the specific data that you require, or when they cannot
display data in a required format, you can customize the appearance of queried data using the Silk
Central reporting functionality. To open the current chart in a separate browser window, click at
the top of the Chart page.
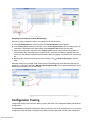
Generating Code-Change Impact Reports
To generate a code-change impact report:
Silk Central 15.5
| 27
1. In the menu, click Projects > Project List.
2. Select the project for which you want to analyze code-coverage data.
3. In the menu, click Reports > Code Analysis.
4. Click Create Code Change Impact Report. The Select Classes for Report dialog box appears.
5. Select a Product and Version if you want to change the pre-selected values.
6. In the Filter field, type criteria to filter the packages/namespaces. For example, entering the string
published will only list packages/namespaces that contain the string published in their names.
7. Select a package from the Packages/Namespaces list.
Use Ctrl+Click or Shift+Click to select multiple packages/Namespaces.
The classes that are available in the selected package/namespace are displayed in the Classes list.
8. In the Classes list, select a class that you want to have included as a source in your report.
Use Ctrl+Click or Shift+Click to select multiple classes.
9. Click Add. The selected classes are added to the Selected classes list.
10.Repeat the preceding steps until you have added all required classes to the Selected classes list.
You can remove classes from the Selected classes list by selecting entries and clicking Remove or by
clicking Remove All.
11.Select a report from the Select report list.
12.Click OK to generate the report.
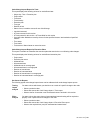
Managing Requirements - Quick Start Task
To manage your requirements with Silk Central, you will need to perform some or all of the following tasks.
Creating Requirements
To create a new requirement:
1. In the menu, click Requirements > Details View .
2. In the Requirements tree, select a requirement. The newly created requirement will be placed on the
same hierarchical level.
3.
Click
(New Requirement) in the toolbar. The New Requirement dialog box appears.
4. Type a Name and a Description for the requirement.
Note: Silk Central supports HTML formatting and cutting and pasting of HTML content for
description fields.
5. Optional: Uncheck the Inherit from parent check boxes. In this case the child requirement will not
inherit the properties from the parent requirement. By default, all check boxes are checked.
Note: In the Details View on the Properties page and in the Document View, inherited
properties are marked with asterisks (*).
6. Select the appropriate Priority, Risk, and Reviewed status from the lists.
7. If custom requirements were defined, they are listed below the Reviewed list. Type in the
corresponding field any custom property data that you want to track with this requirement.
8. To finish creating a new requirement:
•
•
•
28
| Silk Central 15.5
Click OK to create the requirement and to close the dialog box.
Click OK and New Requirement to create the requirement and to keep the dialog box open to enter
data for another requirement.
Click OK and New Child Requirement to create the requirement and to keep the dialog box open
to enter data for a child requirement.
Attaching a File to a Requirement
To attach a file to a requirement:
1. In the menu, click Requirements > Details View .
2. Select the requirement in the Requirements tree.
3. Click the Attachments tab.
When requirements management integration has been enabled between a Silk Central project and a
Caliber project, the Attachments page includes an Open Caliber button, which enables you to manage
requirement attachments directly in Caliber.
4. Click Upload File. The Upload File dialog box appears.
5. Click Browse and select the file that you want to attach from your local file system.
6. Type a Description for the attachment.
7. Click OK. The attachment is uploaded to the server and associated with the selected requirement.
Note: Attaching files to a requirement may not work in Mozilla Firefox. Mozilla Firefox requires usage
of three slashes, for example file:///, for a file link, while other browsers require only two, for
example file://. Aditionally, Mozilla Firefox includes a security feature blocking links from remote
files to local files and directories. For more information, see http://kb.mozillazine.org/
Firefox_:_Issues_:_Links_to_Local_Pages_Don't_Work
Attaching a Link to a Requirement
To attach a link to a requirement
1. In the menu, click Requirements > Details View .
2. Select the requirement in the Requirements tree.
3. Click the Attachments tab.
When requirements management integration has been enabled between a Silk Central project and a
Caliber project, the Attachments page includes an Open Caliber button, which enables you to manage
requirement attachments directly in Caliber.
4. Click Attach Link. The Attach Link dialog box appears.
5. Type the URL in the Link field.
6. Type a Description for the attached link.
7. Click OK. The link is associated with the selected requirement.
Generating Tests from Requirements Details View
You can generate tests directly out of the Requirements tree and assign tests to specific requirements.
The Requirements tree serves as a template for the test folder/test structure of the new Tests tree.
To generate a new test from the Details View:
1. In the menu, click Requirements > Details View .
2. Right-click the requirement or project node that you want to convert into a test and select Generate
Tests. The Generate Tests from Requirements dialog box appears. This dialog box enables you to
specify whether the leaves, which means the lowest-level nodes, of the selected requirements sub-tree
should be converted into tests or test folders and whether the tree should be generated into a new test
container or an existing container.
3. Enter a name for the new test container in the Enter Name field and select a product from the Select
Product list to create the container within the active Silk Central project.
The Select Product list is populated with the products that are configured by a project manager. For
detailed information, see the Administration topics in this Help or ask your project manager.
Silk Central 15.5
| 29
4. If you have defined a source control profile, select the source control profile you want to use for
managing the test sources from the Select Source Control Profile list.
For detailed information on source control profiles, see Source Control Profiles or ask your Silk Central
administrator.
5. To include all child requirements of the selected requirement in the test, check the Include Child
Requirements check box.
The check box is checked by default.
6. To have the new tests automatically assigned to the requirements from which they are created, check
the Assign newly generated tests to Requirements check box.
If this option is not selected, tests must be manually associated with requirements.
Note: This option is not available when checking Generate test folders from requirement tree
leaves.
7. Click OK to create the test.
The new test has the same structure as the Requirements tree.
8. A message box displays. Click Yes to view the test in the Tests area, or click No to remain in the
Requirements area.
Creating Filters
To create a filter:
1. In the menu, click Project:<Project Name> > Project Settings .
Note: If you have not selected a project, a warning message opens, asking you to select a project.
Select the project for which you want to define the setting.
2. Click the Filters tab to view the list of available filters.
3. Click New Filter. The New Filter dialog box appears.
4. Type a Name for the new filter.
This name will be displayed in list boxes when the filter becomes available.
5. Select a Category from the list to make the filter available in the Requirements, Tests, or Execution
Planning area of Silk Central.
6. Optional: Type a Description for the new filter.
7. Optional: Check the Visible to other users check box to allow other users to see the filter.
8. Optional: Check the Editable by other users check box to allow other users to edit the filter.
Note: If Visible to other users and Editable by other users are checked, the filter is public. To
delete non-public (private) filters, you have to be the owner of the filter or you need the Delete
private filters of other users permission.
9. Select a category of filter criteria from the Selection criteria list. The available categories depend on
the general filter category you have selected.
Note: You can combine filters by selecting Nested Test Filter or Nested Requirement Filter.
Selecting one of these categories allows you to include an existing filter in your new filter.
10.Select a Property, Operator, and Value for the filter from the respective lists.
Property Available properties depend on the filter category that you have selected in the previous
step. Defines the property for which you are defining a filter setting. If you have selected an
attribute category, the property list includes custom attributes to query against.
Operator Specifies the filter operator. The operator depends on the property type you have selected.
For example, if you have selected a property that is based on a string field type, the
following operators are available:
30
| Silk Central 15.5
Value
Operator
Description
=
The string equals the defined value.
not
The string is different than the defined value.
contains
The string contains the defined value.
not contains
The string does not contain the defined value.
Enter the value that you want to filter out. Depending on the property type that you have
selected, values will either be strings that you can enter into the field, or a selection of
predefined values that you can select from the list box.
11.Optional: Click More if you want to add more than one filter category to the new filter. Repeat this
procedure to define new categories.
Note: If you define more than one filter category, you must define whether the categories need to
be fulfilled in addition to the existing categories (AND relationship), or if the filter returns true when
one of the filter categories is fulfilled (OR relationship). Select either AND or OR to define the filter
category relationship. You cannot define nested AND, OR relationships.
12.Optional: To remove filter categories, click Fewer. This removes the last filter category.
13.Click OK to save the new filter, or click Cancel to abort the operation.
Creating Advanced Filters
Advanced custom filters enable you to combine simple filters to create complex filters that apply multiple
filter criteria simultaneously.
To create an advanced custom filter:
1. In the menu, select the appropriate area: Requirements, Tests, or Execution Planning.
2.
Click
(New Filter) in the toolbar. The New Filter dialog box appears.
3. If necessary, click Advanced to show the whole dialog box.
4. Click More to display a second set of filter-parameter fields with which you can define a second set of
filter parameters.
5. Select a logical operator for the application of the filtering queries. For example, with the operator and
filtered elements must meet both sets of criteria and with the operator or filtered elements must meet
one, but not both, of the criteria sets.
6.
To delete a filter-parameter string, click
.
7. To display additional filter-parameter fields and create additional filter queries, click More. To remove
excess filter-parameter sets, click Fewer.
Managing Test Executions - Quick Start Task
To manage the execution of a test, you will need to perform some or all of the following tasks.
Creating Execution Plans
To create an execution plan:
1. In the menu, click Execution Planning > Details View.
2. Select a folder or the project node in the Execution Plans tree.
3. Click
(New Child Execution Plan) on the toolbar or right-click the folder, testing cycle, or node and
click New Child Execution Plan. The New Execution Plan dialog box appears.
4. Type a name and description for the execution plan.
Silk Central 15.5
| 31
Note: Silk Central supports HTML formatting and cutting and pasting of HTML content for
Description text boxes.
5. Select a test container from the Test Container list.
Note: You can assign only one test container to an execution plan. Only tests from this test
container can be executed.
The latest version and build that are defined within the product that the container belongs to are
populated automatically in the Version and Build lists.
6. Select a product Version and Build from the lists.
These are used when a new run of this execution plan is started. Alternatively, you can check the Read
from Build Information File check box. In this casethe version and build are read from the build
information file on the application server at the beginning of each run. If a build information file is
available on the execution server, this file is used by default for the test run, overriding the settings on
the New Execution Plan dialog box.
7. Select a Priority for the execution plan from the list.
The priority parameter specifies the lowest priority that is considered in the data.
8. Optional: In the Source Control Label field you can specify that earlier versions of automation files,
instead of the latest versions, are fetched from the source control system.
Note: The Source Control Label property is only enabled if the associated test container uses a
source control profile that supports versioning.
9. Click OK to update the Execution tree with the newly created execution plan.
Manually Assigning Tests to Execution Plans
The tests that are assigned to the selected execution plans are listed on the Assigned Tests page.
To manually assign tests to an execution plan:
1. In the menu, click Execution Planning > Details View.
2. Select the execution plan to which you want to assign the selected tests.
3. Click the Assigned Tests tab.
4. Click the Manual assignment option. All tests of the test container which is associated with the
selected execution are displayed in the Tests tree. If you have created a test filter, you can select it
from the filter list above the Tests tree. To create a new test filter, click Tests in the menu and click
(New Filter) in the toolbar.
5. In the tree, click
on the left of the test that you want to assign to the execution plan.
Clicking the assign arrow of a folder or the top-level container assigns all child tests of that parent to the
selected execution plan.
Tip: Right-click a node to expand and collapse it.
Assigning Tests from Grid View to Execution Plans
The tests that are assigned to the selected execution plans are listed on the Assigned Tests page.
To assign one or more tests from Grid View to one or more execution plans:
1. In the menu, click Tests > Grid View .
2. Select the tests you want to assign to execution plans.
You can select multiple tests with Ctrl+Click or Shift+Click.
3. Right-click the selected tests and click Save Selection.
4. In the menu, click Execution Planning > Details View.
32
| Silk Central 15.5
5. Select the execution plan to which you want to assign the selected tests.
6. Click the Assigned Tests tab.
7. Click Assign Saved Selection.
Note: Only tests that reside in the test container of the execution plan are inserted. You can insert
the selected tests to more than one execution plans. You can not insert them into requirements in
a different project. The selection persists until you make a different selection or close Silk Central.
Assigning Tests to Execution Plans through a Filter
The tests that are assigned to the selected execution plans are listed on the Assigned Tests page.
You have to create a filter with the category Test before you can perform the following steps. See Creating
Filters for details. Alternatively select an existing filter.
To use a filter to assign one or more tests to an execution plan:
1. In the menu, click Execution Planning > Details View.
2. Select the execution plan to which you want to assign tests.
3. Click the Assigned Tests tab.
4. Click the Assignment by filter option.
5. Choose a filter from the list.
Note: If you assign tests to an execution plan in Tests > Grid View , the test assignment type is
automatically set to Manual Assignment, but the previously-filtered tests remain in the Assigned
Tests page.
Creating a Custom Schedule
To create a custom schedule for a selected execution plan, folder, or configuration suite:
1. In the menu, click Execution Planning > Details View.
2. Select the execution plan, folder, or configuration suite for which you want to configure a custom
schedule.
Note: To save an edited version of a global schedule as a custom schedule, click Edit while the
global schedule is selected in the list box. This enables you to edit the global schedule and save
the result as a custom schedule.
3. Click the Schedule tab.
4. Click the Custom option to enable the scheduling controls.
5. Click Edit.
6. Click
next to the From field and use the calendar tool to specify the time and date when the
execution schedule should begin.
7. Specify the Interval at which the tests should be executed.
8. In the Run section, specify when the schedule should end.
Select one of the following options:
•
•
•
Click Forever to define a schedule with no end.
Click n Time(s).
Click
next to the until field and use the calendar tool to specify the time and date when the
execution schedule should end.
9. Optional: Click Add Exclusion to define times when scheduled elements should not be executed.
10.Optional: Click Add Definite Run to define times when unscheduled executions should be executed.
11.Click Save to save your custom schedule.
Silk Central 15.5
| 33
Configuring Setup and Cleanup Executions
To define a test as a setup or cleanup test:
1. In the menu, click Execution Planning > Details View.
2. Click the execution plan for which you want to configure a setup or cleanup test.
3. Click the Setup/Cleanup tab.
4. Choose between a setup or cleanup test:
•
To define a setup test, click Edit in the Setup Test section. The Edit Setup Test dialog box
appears.
•
To define a cleanup test, click Edit in the Cleanup Test section. The Edit Cleanup Test dialog box
appears.
5. Select a test in the Tests tree.
6. Click OK.
The configured test displays in the corresponding section of the Setup/Cleanup page.
Adding Dependent Execution Plans
To add a dependent execution plan:
1. In the menu, click Execution Planning > Details View.
2. Select the execution plan that will act as the master execution plan.
3. Click the Dependencies tab.
4. Click Add dependent Execution Plan. The Add dependent Execution Plan dialog box appears.
5. From the Condition list, select the condition that is to trigger the dependent execution plan.
•
•
•
•
Any
Passed
Failed
Not Executed
The Any status means that the dependent test execution will trigger no matter what the status of the
previous test execution is.
6. Select an execution plan from the Execution Plans tree.
7. Specify where the dependent execution plan is to be deployed.
Option
Description
As specified in
the dependent
Execution Plan
Automated tests assigned to the dependent execution plan will be executed on
the execution server specified for the dependent execution plan on the
Deployment page. Manual tests assigned to the dependent execution plan will
be assigned to the users specified for the dependent execution plan on the
Deployment page.
Same as
<selected
execution plan’s
execution server>
Automated tests assigned to the dependent execution plan will be executed on
the execution server specified for the master execution plan on the Deployment
page. Manual tests assigned to the dependent execution plan will be assigned to
the users specified for the master execution plan on the Deployment page.
Select a pre-configured execution server and/or a manual tester from the list
Specific:
Execution Server/ boxes. Automated tests assigned to the dependent execution plan will be
executed on the specified execution server. Manual tests assigned to the
Manual Tester
dependent execution plan will be assigned to the specified manual tester. If only
a specific manual tester is defined and no server, only manual tests will be
34
| Silk Central 15.5
Option
Description
executed. If only a specific execution server is defined and no manual tester, only
automated tests will be executed.
8. Click OK to create the dependency.
Note: Silk Central will not allow you to create cyclical execution dependencies. You can select
conditions to fulfill for manual tests. For example, if the selected condition is Failed and all
manual tests passed, but some automated tests failed, only automated tests assigned to the
dependent execution plan are executed.
Assigning Keywords to Execution Plans
To assign keywords to execution plans:
1. In the menu, click Execution Planning > Details View.
2. In the Execution Plans tree, select the execution plan that you want to edit.
3. Click the Deployment tab.
4. In the Execution Environment section of the page, click Edit. The Assign Keywords dialog box
appears. All keywords that have been defined for your execution environment are listed here.
Note: The default reserved keywords for each execution server, #<execution
name>@<location name>, are included in the list.
5. Select a keyword in the Select or enter keywords list or directly enter a new keyword.
Select multiple keywords with Ctrl+Click or Shift+Click.
Tip: The Select or enter keywords field is auto-complete enabled. When you enter alphanumeric
characters, the field is dynamically updated with an existing keyword that matches the entered
characters. The field is disabled when multiple keywords are selected in the Select or enter
keywords or Assigned keywords lists.
Tip: If you only have a few execution servers and do not require hardware provisioning, it might be
enough to use only the default, reserved keywords that are created for each execution server. In
such cases, it is not necessary that you select additional keywords.
6. Click > to move the keyword into the Assigned keywords list. Click < to remove keywords from the list.
You can also double-click keywords to move them from the one list to the other.
Note: The execution servers that match the assigned keywords are listed below in the
dynamically-updated Matching execution servers list. This list updates each time you add or
remove a keyword. Click on the name of an execution server in the list to access the execution
servers in Administration > Execution Servers .
7. Click OK to save the keywords and close the Assign Keywords dialog box.
Starting Execution Plans
To run an execution plan independent of a schedule:
1. In the menu, click Execution Planning > Details View.
2. In the Execution Plans tree, select the execution plan, folder, or configuration suite that you want to
execute.
3.
Click
(Run) on the toolbar. The Run dialog box appears.
4. Define which tests you want to execute in the Run dialog box.
5. If the execution plan does not contain pending manual tests, the Go To Activities dialog box displays.
Click Yes to view the details of the execution plan runs in the Activities page, or click No if you want to
remain on the current Web page.
Silk Central 15.5
| 35
Note: Check the Don't show this dialog again (during this login session) check box if you do
not want to be asked about switching to the Activities page again in the future. This setting will be
discarded when you log out of Silk Central.
Viewing Test Run Details
To view the details of a test run:
1. In the menu, click Execution Planning > Details View.
2. Select an execution plan in the Execution Plans tree.
3. Click the Runs tab.
4. In the Test Runs grid at the bottom, click the Run ID of the test for which you want to see details. The
Test Run Results dialog box appears.
5. Click the Details tab.
Managing Tests - Quick Start Task
To organize your tests, you will need to perform some or all of the following tasks.
Creating Tests
To create a new test:
1. In the menu, click Tests > Details View .
2. Select a container or folder node in the Tests tree where you want to insert a new test.
3. Click
(New Child Test) on the toolbar or right-click within the tree and choose New Child Test.
A new test node is appended to the tree view, and the New Test dialog box appears.
4. Type a name and description for the test.
Note: Silk Central supports HTML formatting and cutting and pasting of HTML content for
Description text boxes.
5. Select the test type from the Type list.
6. Click Next and proceed to the appropriate topic for the selected test type in Configuring Test Properties.
Note: The well-defined public API of Silk Central enables you to implement a proprietary solution that
meets your automated test needs. Silk Central is open and extensible to any external tool that can be
invoked from a Java implementation or through a command-line call.
Note: Throughout the test configuration process and across all test types, Inherit from parent check
box options are provided where applicable, enabling you to accept settings of any existing parent
entity.
Editing Tests
To edit a test:
1. In the menu, click Tests > Details View .
2. Select the test or the test package that you want to edit.
3.
Click
(Edit) on the toolbar.
You can also click the Properties tab and click Edit or right-click the test or test package and select
Edit.
The Edit Test dialog box appears.
36
| Silk Central 15.5
Note: Silk Central supports HTML formatting and cutting and pasting of HTML content for
Description text boxes.
4. Edit the name and description of the selected test.
If the selected test is a test package, the Update Package Structure on Result check box is available.
Check the Update Package Structure on Result check box if you want to update the structure of the
test package according to the results of the test execution run.
5. Configure the properties of the test or the test package according to the test type as described in
Configuring Test Properties.
Creating a Test Package
To create a new test package out of a third-party test:
1. Run the test once to create the output.xml file, which contains the structure of the test package.
For additional information on executing a test, see Executing Individual Tests.
2. In the menu, click Tests > Details View .
3. In the Tests tree, right-click the test and choose Convert to Test Package. The selected test is
converted to a hierarchy representing the structure of the last execution result.
Creating Data-Driven Tests
To create a data-driven test:
1. In the menu, click Tests > Details View .
2. Create a new test.
For more information, see Creating Tests.
3. Click the Properties tab of the newly created test.
4.
Click
(Edit) next to Data-driven Properties. The Data-driven Properties dialog box appears.
5. Select a preconfigured data source from the Data Source list.
Note: Your data source may contain up to 100 rows. If it contains more than 100 rows, you need
to enter a query on the Data-driven Properties dialog box that returns 100 rows at most. This
prevents generating more than 100 tests out of one data source.
6. Click Next to continue.
7. Select a data set from the Data Set list.
In the case of Excel data sources, this is a worksheet name. In the case of database data sources, this
is a table name.
8. Check the Each data row is a single test check box to have each row in your data set considered to
be a separate test, or do not check this check box to create a single test for all data rows of your data
set.
9. Optional: Enter a SQL query in the Filter query field to filter your data set based on an SQL-syntax
query.
Note: Only simple WHERE clause queries are supported.
10.Check the Enable data-driven properties check box to enable data-driven functionality.
11.Click Finish to save your settings.
Note: Data-driven property settings are visible in the lower portion of each test’s Properties page.
Note: To use the data-driven test functionality of Silk Central with Silk Performer scripts, data
sources with column names matching the corresponding Silk Performer project attributes must be
used in conjunction with AttributeGet methods.
Silk Central 15.5
| 37
Assigning Attributes to Tests
To assign an attribute to a test:
1. In the menu, click Tests > Details View .
2. Select the test to which you want to assign an attribute.
3. Click the Attributes tab.
4. Click Add Attribute. The Add Attributes dialog box appears.
5. Click
(Add Attribute 'Importance') in the Add column of the attribute that you want to assign.
Based on the attribute type you have selected, an Edit Attribute dialog box appears, where you can
specify which of the available attribute values you want to assign to the test.
6. Select an attribute value and click OK to assign the attribute to the test.
Adding Predefined Parameters to Silk Performer Tests
To add a predefined parameter to a test:
1. In the menu, click Tests > Details View .
2. In the Tests tree, select the test node to which you want to add a predefined parameter.
3. Click the Parameters tab.
4. Click Add Predefined Parameter.
Note: The Add Predefined Parameter button is only available for Silk Performer tests, when the
Project property is already defined.
The Add Predefined Parameter dialog box appears, which lists all of the project attributes that are
available in the project file.
5. To add any of the listed parameters, click the corresponding add icon.
6. On the dialog box that appears, specify the actual value for the parameter.
7. Click Save to add the parameter to the active Tests tree node.
Creating Filters
To create a filter:
1. In the menu, click Project:<Project Name> > Project Settings .
Note: If you have not selected a project, a warning message opens, asking you to select a project.
Select the project for which you want to define the setting.
2. Click the Filters tab to view the list of available filters.
3. Click New Filter. The New Filter dialog box appears.
4. Type a Name for the new filter.
This name will be displayed in list boxes when the filter becomes available.
5. Select a Category from the list to make the filter available in the Requirements, Tests, or Execution
Planning area of Silk Central.
6. Optional: Type a Description for the new filter.
7. Optional: Check the Visible to other users check box to allow other users to see the filter.
8. Optional: Check the Editable by other users check box to allow other users to edit the filter.
Note: If Visible to other users and Editable by other users are checked, the filter is public. To
delete non-public (private) filters, you have to be the owner of the filter or you need the Delete
private filters of other users permission.
9. Select a category of filter criteria from the Selection criteria list. The available categories depend on
the general filter category you have selected.
38
| Silk Central 15.5
Note: You can combine filters by selecting Nested Test Filter or Nested Requirement Filter.
Selecting one of these categories allows you to include an existing filter in your new filter.
10.Select a Property, Operator, and Value for the filter from the respective lists.
Property Available properties depend on the filter category that you have selected in the previous
step. Defines the property for which you are defining a filter setting. If you have selected an
attribute category, the property list includes custom attributes to query against.
Operator Specifies the filter operator. The operator depends on the property type you have selected.
For example, if you have selected a property that is based on a string field type, the
following operators are available:
Value
Operator
Description
=
The string equals the defined value.
not
The string is different than the defined value.
contains
The string contains the defined value.
not contains
The string does not contain the defined value.
Enter the value that you want to filter out. Depending on the property type that you have
selected, values will either be strings that you can enter into the field, or a selection of
predefined values that you can select from the list box.
11.Optional: Click More if you want to add more than one filter category to the new filter. Repeat this
procedure to define new categories.
Note: If you define more than one filter category, you must define whether the categories need to
be fulfilled in addition to the existing categories (AND relationship), or if the filter returns true when
one of the filter categories is fulfilled (OR relationship). Select either AND or OR to define the filter
category relationship. You cannot define nested AND, OR relationships.
12.Optional: To remove filter categories, click Fewer. This removes the last filter category.
13.Click OK to save the new filter, or click Cancel to abort the operation.
Assigning Requirements to Tests
To manually assign requirements to tests:
1. In the menu, click Tests > Details View .
2. In the Tests tree, select the test to which you want to assign requirements.
3. Click the Assigned Requirements tab.
Note: If you have created a requirements filter, you can select it from the filter list above the
Requirements tree. To create a new requirements filter, click Requirements > Details View in
the menu and click
on the toolbar.
All requirements that are available for assignment are displayed in the Requirements tree.
4. Click Assign All Filtered to assign all filtered requirements to the selected test, or click
to the left of
a requirement to assign a single requirement to the selected test. Assigning all filtered requirements is
only enabled if a filter is selected and if you have either Manage requirements or Manage tests and
executions permission.
Note: Newly generated tests can automatically be assigned to the requirements from which they
are generated by checking the Assign newly generated tests to requirements check box on the
Generate Tests from Requirements dialog box. This is the default behavior.
Attaching Files to Test Elements
To attach a file to a test element:
Silk Central 15.5
| 39
1. In the menu, click Tests > Details View .
2. In the Tests tree, select a container, folder, or test.
3. Click the Attachments tab.
4. Click Upload File. The Upload File dialog box appears.
5. Click Browse to select a file from your local file system.
6. Optional: Enter a Description for the attachment.
7. Click OK to upload the attachment to the server and associate it with the selected element.
Note: Attaching files to a test element may not work in Mozilla Firefox. Firefox requires usage of three
slashes, for example file:///, for a file link, while other browsers require only two, for example
file://. Additionally, Firefox includes a security feature blocking links from remote files to local files
and directories. For more information, see http://kb.mozillazine.org/
Firefox_:_Issues_:_Links_to_Local_Pages_Don't_Work.
Attaching Links to Test Elements
To attach a link to a test element:
1. In the menu, click Tests > Details View .
2. In the Tests tree, select a container, folder, or test.
3. Click the Attachments tab.
4. Click Attach Link. The Attach Link dialog box appears.
5. Type the URL in the Link field.
6. Optional: Type a Description for the attached link.
7. Click OK to associate the link with the selected element.
Dashboard
The dashboard in Silk Central is your personal starting area. You can customize it by adding and arranging
various panels, which give you the information you need for your daily work.
When you log in to Silk Central for the first time, the dashboard shows just the Introduction panel. On the
top, your last login date and time is displayed. You can quickly Continue working in your last visited
area by clicking this link.
Click the buttons on the top, to perform the following actions:
•
•
•
Click Add Panel to add further panels to the dashboard.
Click Change Layout to change the layout of the dashboard.
Click Reset Dashboard to set the dashboard to the default view. All the panels you added and your
customized settings are removed.
To arrange your panels, click on the header of a panel and drag it to the desired position.
Click the buttons in the header of a panel to perform the following actions:
•
Click
to remove the panel from the dashboard.
•
Click
to configure the settings of the panel.
•
Click
to save the content of the panel as a PDF.
•
Click
to print the content of the panel.
You need certain permissions to view or edit the content of the different panels.
40
| Silk Central 15.5
Adding Panels to the Dashboard
To add a panel to the dashboard:
1. In the menu, click Home > My Dashboard.
2. Click Add Panel on the top left. The Add Panel dialog box appears, listing the available panels along
with a short description for each panel.
3. Select a panel.
4. Click OK.
5. If required, select a Project and a Time Span for the panel. Select <Use current project> for the panel
to always display the data of the currently active project.
6. Click OK.
For most panels, you need to configure a project, as the panel will only show data for a certain project. You
can add several panels to show appropriate data for other projects side-by-side, or configure <Use current
project> for the panel to always display the data of the currently active project. Click
(Configure) in the
header of a panel to configure a different project. You need certain permissions to view or edit the content
of the different panels.
Dashboard Panels
For most panels, you need to configure a project, as the panel will only show data for a certain project. You
can add several panels to show appropriate data for other projects side-by-side, or configure <Use current
project> for the panel to always display the data of the currently active project. Click
(Configure) in the
header of a panel to configure a different project. You need certain permissions to view or edit the content
of the different panels.
You can add the following panels to your dashboard:
Panel
Description
Assigned Issues
This panel shows all issues (that are assigned to a test)
of the selected project. If you click the external ID, the
issue opens in the external issue tracking system.
Custom Information
This panel shows customizable information about a
certain project. Users with the Manage projects
permission can add content like text, images or
hyperlinks to the panel. Click Edit Content to open the
HTML editor. Users without the Manage projects
permission will just see the content. The panel can be
used to show news, descriptions or any other kind of
information relevant to the project.
Introduction
This panel gives you a quick introduction to Silk Central.
Click the links under What's New? to get additional
information about the latest features of Silk Central. You
can also join the Micro Focus Community or contact the
Micro Focus SupportLine.
Issue Life Cycle
This panel shows the number of Open, Fixed, Verified,
Closed and Deferred issues for a defined issue tracking
profile. Select a Product from the list. To define an issue
tracking profile, click Issues in the menu, click Issue
Tracking Integrations and click New Profile. The panel
will only show data, if there is a profile defined.
Silk Central 15.5
| 41
Panel
Description
Issues Created per Tester
This panel shows the number of issues created by testers
as a bar graph. When printed or downloaded as a PDF,
the numbers will be shown in a table as well.
Manual Tests Assigned to Me
This panel shows all tests of the selected project that
were assigned to you.
If the manual test execution is organized with the help of
testing cycles, the list also includes all tests that are
assigned to No specific tester on the Manual Execution
Planning page. However, this is only true for testing
cycles you are assigned to as a tester. It is a typical
teamwork scenario that testers decide on their own which
test to execute.
If the manual test execution is organized with the help of
execution plans, the list also includes the tests from all
execution plans that have no tester assigned.
Click
(Continue Manual Test) to open the Manual
Testing window.
(View Manual Test Results) to open the view
Click
and see all data and attachments about the test.
Click
to get detailed information about the Test, the
Execution Plan or the Execution Plan Parent.
Right click a test and click
to download a manual
test (in Excel format) to execute it offline (multiple tests
can be selected with Ctrl+Click or Shift+Click). After you
execute the test, click the Upload Offline Manual Test
Results button to upload the results.
If you start a testing cycle (on the Manual Execution
Planning page) before its start date, the tests of this
testing cycle already display in the panel. You can make
those tests invisible in the panel until the start date is
reached: Click
in the header of the panel and check
Hide future testing cycles.
42
Offline Manual Testing Overview
This panel shows the tests that are downloaded by
testers and allows the Test Manager to abort offline
executions to free the license.
Planned vs. Actual Execution Time
This panel shows if the testers of a testing cycle are on
schedule with the test execution. If the actually used time
plus the remaining planned time is greater than the
capacity, the testing cycle is on risk to be not finished on
time.
Quality Goal Progress
This panel shows a graph with two bars for each value of
the selected quality goal. The upper bar shows the
number of tests that must be executed to meet the quality
goal. The lower bar shows the number of the Passed,
Failed, Not Executed, and N/A (not available) tests with
that quality goal value. If the lower bar is shorter than the
upper bar, too few tests are assigned to execution plans.
This means that the quality goal cannot be reached.
Select a Quality Goal from the list.
Report Subscription
This panel displays the results of a report subscription.
The report subscription must already be defined and you
| Silk Central 15.5
Panel
Description
need to select Provide for dashboard and external
access from the Edit Subscription dialog box to make it
available.
Requirements Coverage Status
This panel shows the requirement coverage of the
selected project, broken down into Passed, Failed, Not
Executed, and Not Covered requirements. Click
go to the Requirements Document View.
to
Status of Currently Running Manual Tests
This panel shows the status of all currently running
manual tests in the specified project. Test managers are
able to see which tests are currently blocked and they
can monitor the status of already executed tests in
running executions.
Testbook
This panel shows you real-time updates about all
activities that take place during manual testing. Activities
that are logged in the Testbook are starting and finishing
tests and editing running testing cycles. For more
information, see Testbook.
Testing Cycle Progress
This panel shows a burn-up chart of Passed, Failed, In
Progress, and Not Executed tests for the defined testing
cycle. It also shows the milestones (as diamonds), if you
have specified any. Select a Testing Cycle from the list.
Testing Cycle Result Summary
This panel shows the status of the selected testing cycle
and the progress status of the individual testers that are
assigned to the testing cycle. The bars show in the
following order: the number of Tests failed, Tests
remaining, and Tests passed. The tester with the most
failed tests displays on the top of the list. The numbers to
the right of the bars show the Tests completed (left
number) and the Tests assigned (right number). No
specific tester is treated and ordered like all other
testers. Click
to go to the Test Assignment view of
the Manual Execution Planning page.
Testing Cycle Timeline
This panel shows all testing cycles of the selected project
as bars on a timeline. When you click on a bar, you are
directed to the Manual Execution Planning page. The
bars have different colors, depending on the current
status of the testing cycle: blue (in progress), orange (not
yet started), gray (finished). Move your mouse over the
bars to get detailed information about the testing cycle.
Testing Progress Across Testing Cycles
This panel shows the time in hours for the Planned tests
(visualized by a line) and for the In Progress and the
Completed tests (both visualized by stacked areas). The
panel helps a test manager to predict if the testing team
will be able to finish the tests in time. The start date of the
chart is the start date of the first testing cycle. The end
date of the chart is the end date of the last testing cycle.
The panel does not show how long it actually took the
testing team to execute the tests.
Volatile Tests
This panel shows how often tests changed their status
within an execution plan. Tests without status changes
and test packages do not display in the panel. Tests
display according to the selected project and time span.
The panel makes test managers aware of such volatile
Silk Central 15.5
| 43
Panel
Description
tests, which indicate either an unstable test or a tested
area where bugs occur frequently.
Dashboard Panel Permissions
To view or edit the content of a certain dashboard panel, you need the following permissions:
Panel
Required permission
Assigned Issues
View tests and executions.
Custom Information
Manage projects required for editing.
No permission required for viewing.
Introduction
No permission required.
Issue Life Cycle
View project settings.
Issues Created per Tester
View tests and executions.
Manual Tests Assigned to Me
Execute tests.
Planned vs. Actual Execution Time
View testing cycles and configurations.
Quality Goal Progress
View quality goals.
Report Subscription
No permission required.
Requirements Coverage Status
View requirements.
Status of Currently Running Manual Tests
View tests and executions
Testbook
No permission required.
Testing Cycle Progress
View testing cycles and configurations.
Testing Cycle Result Summary
View testing cycles and configurations.
Testing Cycle Timeline
View testing cycles and configurations.
Testing Progress Across Testing Cycles
View testing cycles and configurations.
Volatile Tests
View tests and executions.
Adding a Report to a Dashboard Panel
Using any report available in the Reports unit, the Report Subscription panel of your dashboard allows
you to display an existing report. First, create and configure your report, and then add the panel to your
dashboard.
1. In the menu, click Reports > Details View.
2. Select a report in the Reports tree.
3. Click the Subscriptions tab.
4. Click Add Subscription. The Edit Subscription dialog box opens.
5. Give your subscription a name in the Name field.
6. To modify the subscription parameters, click Edit Parameters. The Edit Parameter dialog box opens.
Change the Value and click OK.
7. Select a schedule from the Schedule list. If the schedule you want does not exist, you need to create it.
8. Click Provide for dashboard and external access to make the report available in a dashboard panel.
9. Click OK. The new subscription is listed in the Subscriptions list.
10.In the menu, click Home > My Dashboard.
44
| Silk Central 15.5
11.Click Add Panel on the top left. The Add Panel dialog box appears, listing the available panels along
with a short description for each panel.
12.Select Report Subscription. The Configure Panel dialog box appears, listing all available report
subscriptions.
13.Select a report subscription from the list and click OK. The panel is added to your Dashboard.
Requirements
This section explains how to manage requirements in Silk Central.
The Requirements area enables you to manage and control the system requirements during
development. You can create, modify, and delete requirements, associate tests with requirements, track
the changes in the history, and generate tests directly from requirement lists. As with all Silk Central
functionality, the Requirements area is 100 percent Web enabled and accessible through a Web browser.
Managing Requirements
This section describes the tasks you can perform on requirements in Silk Central.
Creating Requirements
To create a new requirement:
1. In the menu, click Requirements > Details View .
2. In the Requirements tree, select a requirement. The newly created requirement will be placed on the
same hierarchical level.
3.
Click
(New Requirement) in the toolbar. The New Requirement dialog box appears.
4. Type a Name and a Description for the requirement.
Note: Silk Central supports HTML formatting and cutting and pasting of HTML content for
description fields.
5. Optional: Uncheck the Inherit from parent check boxes. In this case the child requirement will not
inherit the properties from the parent requirement. By default, all check boxes are checked.
Note: In the Details View on the Properties page and in the Document View, inherited
properties are marked with asterisks (*).
6. Select the appropriate Priority, Risk, and Reviewed status from the lists.
7. If custom requirements were defined, they are listed below the Reviewed list. Type in the
corresponding field any custom property data that you want to track with this requirement.
8. To finish creating a new requirement:
•
•
•
Click OK to create the requirement and to close the dialog box.
Click OK and New Requirement to create the requirement and to keep the dialog box open to enter
data for another requirement.
Click OK and New Child Requirement to create the requirement and to keep the dialog box open
to enter data for a child requirement.
Creating Child Requirements
To create a child requirement:
1. In the menu, click Requirements > Details View .
2. In the Requirements tree, select the project node or a requirement. The newly created requirement will
be placed hierarchically beneath that requirement.
Silk Central 15.5
| 45
3.
Click
(New Child Requirement) in the toolbar. The New Child Requirement dialog box appears.
4. Type a Name and a Description for the requirement.
Note: Silk Central supports HTML formatting and cutting and pasting of HTML content for
description fields.
5. Optional: Uncheck the Inherit from parent check boxes. In this case the child requirement will not
inherit the properties from the parent requirement. By default, all check boxes are checked.
Note: In the Details View on the Properties page and in the Document View, inherited
properties are marked with asterisks (*).
6. Select the appropriate Priority, Risk, and Reviewed status from the lists.
7. If custom requirements were defined, they are listed below the Reviewed list. Type in the
corresponding field any custom property data that you want to track with this requirement.
8. To finish creating a new child requirement:
•
•
•
Click OK to create the requirement and to close the dialog box.
Click OK and New Requirement to create the requirement and to keep the dialog box open to enter
data for another requirement.
Click OK and New Child Requirement to create the requirement and to keep the dialog box open
to enter data for a child requirement.
Editing Requirements
To edit the properties of a requirement:
1. In the menu, click Requirements > Details View .
2. In the Requirements tree, select a requirement.
3.
Click
(Edit) in the toolbar.
You can also right-click a requirement and click Edit or click the Properties tab and click Edit
Properties.
The Edit Requirement dialog box appears.
4. Edit the values displayed on the Edit Requirements dialog box as required.
5. Click OK to save your changes.
Note: For details regarding creating, editing, and deleting custom requirement properties, see
Custom Requirement Properties.
Marking Requirements as Obsolete
Deleting requirements destroys them permanently. Sometimes it is preferable to mark requirements as
obsolete. Obsolete requirements can be hidden, shown, and recovered.
To mark a requirement as obsolete:
1. In the menu, click Requirements > Details View .
2. In the Requirements tree, select a requirement.
3. Click
(Delete) in the toolbar or right-click the requirement and click Delete. A dialog box appears.
4. Click Yes.
Note: The Destroy permanently check box is unchecked by default.
Note: Obsolete requirements are displayed in italics in the Requirements tree.
To show obsolete requirements, right-click a random requirement in the Requirements tree and click
Show Obsolete Requirements.
46
| Silk Central 15.5
To hide obsolete requirements, right-click a random requirement in the Requirements tree and click Hide
Obsolete Requirements.
Recovering Obsolete Requirements
To recover an obsolete requirement:
1. In the menu, click Requirements > Details View .
2. If the obsolete requirements are hidden, right-click a random requirement in the Requirements tree and
click Show Obsolete Requirements.
3. Right-click on the obsolete requirement in the Requirements tree and click Recover.
Note: Obsolete requirements are displayed in italics in the Requirements tree.
To hide the obsolete requirements again, right-click a random requirement in the Requirements tree and
click Hide Obsolete Requirements.
Permanently Deleting Obsolete Requirements
To permanently delete an obsolete requirement:
1. In the menu, click Requirements > Details View .
2. If the obsolete requirements are hidden, right-click a random requirement in the Requirements tree and
click Show Obsolete Requirements.
3. In the Requirements tree, select an obsolete requirement.
4. Click
(Delete) in the toolbar or right-click the requirement and click Delete. A dialog box appears.
5. Click Yes to permanently delete the requirement.
Note: Obsolete requirements are displayed in italics in the Requirements tree.
To hide the obsolete requirements again, right-click a random requirement in the Requirements tree and
click Hide Obsolete Requirements.
Requirements Toolbar Functions
Requirements > Details View
Requirements > Document View
The requirements toolbar provides important commands for managing your requirements.
Note: Some commands in the requirements toolbar are also available through context menus in the
Requirements tree.
The following commands are included in the requirements toolbar:
Command
Icon
Description
Details View
Displays the Details View, which enables you to drill deeply into the
properties of a single requirement.
Document View
Displays the Document View, which shows selected properties of all
requirements in a single view.
New Requirement
Adds a new requirement to the active project.
New Child Requirement
Adds a new child requirement to the selected requirement.
Silk Central 15.5
| 47
Command
Icon
Description
Edit
Edits the selected requirement.
Delete
Marks the selected requirement as obsolete or destroys it permanently.
Obsolete requirements can be hidden, shown, and recovered.
Cut
Cuts a requirement from the Requirements tree and saves it to the
clipboard.
Copy
Copys a requirement from the Requirements tree to the clipboard.
Paste
Pastes a requirement from the clipboard to the Requirements tree.
Paste as Child
Pastes a requirement from the clipboard as a child requirement to the
currently selected requirement.
Move Up
Moves a requirement up within the Requirements tree.
Move Down
Moves a requirement down within the Requirements tree.
Find
Searches through all requirements in the active project based on
configurable parameters.
Replace
Replaces instances of found values with a new value.
New Filter
Creates a new filter for the Requirements tree.
Filters
Lists the available filters for the Requirements tree.
Edit Filter
Edits the selected filter.
Delete Filter
Deletes the selected filter.
Copy Filter
Copys the selected filter.
Show Changes
Shows recent changes to the requirements and their properties.
Acknowledge
Acknowledges changes to the requirements and their properties.
Show Direct Coverage
Toggles between direct and full coverage modes. This button is disabled in
the Details View.
Show Full Coverage
Download as PDF
Generates and downloads a PDF with all currently visible nodes of the
Requirements tree. This button is disabled in the Details View.
Requirements Tree
Requirements are displayed, organized, and maintained through a hierarchical tree structure, the
Requirements tree. Each node in the Requirements tree represents a requirement. Each requirement
can have any number of child requirements associated with it. The Requirements tree enables you to
organize requirements in any number of hierarchical levels.
Note: When the Requirements tree includes more elements than can be displayed at once without
impacting response time, elements are displayed in increments. Page number links at the bottom of
the tab allow you to browse through the elements included in the tree one page at a time. To display
all elements as a single list, select the [All] link.
48
| Silk Central 15.5
Collapsing or Expanding the Requirements Tree
To collapse or expand the Requirements tree:
1. In the menu, click Requirements > Details View .
2. Select the requirement folder in the Requirements tree and continue with one of the following options:
•
•
•
Click
to the left of the name of the requirement folder to expand the folder.
Click
to the left of the name of the requirement folder to collapse the folder.
Right-click on the folder and select Expand or Collapse. You can expand two, three, or all levels at
once by using the command in the context menu
Filtering the Requirements Tree
If you filter a subtree, only the selected node and the child nodes are shown. All other nodes are
temporarily hidden. This can be useful if you want to generate a PDF with a subset of all requirements.
To filter a subtree of the Requirements tree:
1. In the menu, click Requirements > Details View .
2. Right-click a requirement in the Requirements tree and click Filter Subtree.
Note: This automatically creates a custom filter in the filter list, which is placed in the toolbar. You
can save this filter by clicking
(Edit Filter), clicking Advanced, and entering a name for the
filter.
3. To disable the filter, select <No Filter> from the filter list in the toolbar.
Requirements Document View
Requirements > Document View
The Document View displays the status of all tests that are assigned to the active project, including the
number and percentage of Passed, Failed, Not Executed, and Not Covered tests. The Document
View displays this coverage status information in a “heat field” chart, with the following colors:
Color
Description
Green
Passed tests.
Red
Failed tests.
Orange
Tests that are not executed yet.
Gray
Test with other status.
Requirements that are not covered by tests are listed as Not Covered.
The Document View displays all custom requirement properties as columns.
Note: Test totals accumulate to the parent level, for all currently displayed tests. If you apply a filter to
the Requirements tree, the test totals are based on the filtered requirements only. For example, the
requirement totals include tests from all child requirements that are selected with the filter, and the
project totals include tests from all requirements that are selected with the filter.
The Document View individually saves the display settings for each user and each project.
Requirement Properties
Besides the given default properties, you can also create your own requirement properties in Silk Central.
These custom properties can be edited in the Edit Requirement dialog box just like the default properties.
Silk Central 15.5
| 49
To create custom properties for the active project, click Requirements > Requirement Properties in the
menu and click New Requirement Property.
Custom properties are displayed in the Requirements Details View on the Properties page and in the
Requirements Document View.
For additional information on custom requirement properties, see Custom Requirement Properties.
Replacing Requirement Properties
To replace the property value of one or more requirements:
1. In the menu, click Requirements > Details View .
2. Click
(Replace) in the toolbar or right-click a requirement and click Replace. The Replace dialog
box appears.
3. Select a requirement property from the Find in list.
This list contains all default and custom properties.
4. In the Find what area, define your search criteria.
The UI controls of the Find what area vary, based on the selected property. For example: If you select
the property Risk two lists appear, if you select the property Description a text field and two check
boxes appear.
5. In the Replace with area, enter the value that shall replace the identified data.
6. Optional: Check the Case sensitive check box to consider uppercase and lowercase letters.
7. Optional: Check the Match whole word only check box to include just complete standalone instances
of the string.
8. Click OK. The first requirement that meets the search criteria is highlighted in the Requirements tree.
9. Click one of the following:
•
•
•
•
•
•
Replace: Replaces the property value of the highlighted requirement.
Replace All: Replaces the property value of all requirements that contain the defined value.
Find Next: Highlights the next requirement that contains the defined value.
Find Previous: Highlights the previous requirement that contains the defined value.
New Replace: Opens the Replace dialog box again, where you can set new values.
Close: Closes the dialog box.
Note: If you click Replace all, all inherited properties will be overwritten. Child requirements also
lose their inheritance setting in this case. Use Replace only on a parent requirement if you want
the child requirements to inherit the new value.
Finding Requirement Properties
In the Requirements area, you can locate requirements that meet certain search criteria with the Find
command. You can also replace identified property data with alternate data that you specify with the
Replace command. Both commands offer Find Next and Find Previous functions that allow you to step
through all identified properties.
To find a requirement:
1. In the menu, click Requirements > Details View .
2. Select
on the toolbar to open the Find dialog box.
Note: This command can also be executed by right-clicking a requirement and selecting Find.
3. Select a requirement property from the Find in list.
This list contains all default and custom properties.
50
| Silk Central 15.5
4. In the Find what area, define your search criteria.
The UI controls of the Find what area vary, based on the selected property. For example: If you select
the property Risk two lists appear, if you select the property Description a text field and two check
boxes appear.
5. Click OK to begin your search. The first requirement that meets the search criteria will be highlighted in
the tree view. The first requirement that meets the search criteria will be highlighted in the tree view.
6. Click Find Next on the Find dialog box to advance to the next requirement in the list that meets your
search criteria. Click Find Previous on the Find dialog box to return to the previous requirement in the
list that meets your search criteria.
Note: When you reach the last or first requirement that meets the search criteria and respectively
click Find Next or Find Previous, the search starts from the beginning.
Requirement Properties Page
Requirements > Details View > Properties
The Requirement Properties page displays high-level information about the selected requirement or
project.
When requirements are synchronized with an external requirements management system, items are
sometimes marked with an exclamation mark (!). This means that the marked field is not mapped to the
external requirements management system. Use the property mapping feature to map property fields. If
you don't use the property mapping feature, only the name and the description of the requirements are
mapped. For more information, see Editing Property Mapping.
Item values that are marked with an asterisk (*) are values that are inherited from the parent requirement.
Click Edit Requirement Properties to edit the displayed properties.
The following table only applies to requirements that have a flag set.
Item
Description
Flagged By
Indicates who set the flag and when the flag was set.
Comment
Indicates the comments for the flag.
Clear Flag
Click to remove the flag.
The following table lists the properties of the selected requirement or project that are displayed on the
Properties page.
Property
Description
Requirement Name
Name of the requirement.
Requirement ID
Identifier of the requirement.
Description
Description of the requirement.
Priority
Priority that has been configured for the requirement.
Risk
Risk that has been configured for the requirement.
Reviewed
Current review status of the requirement. Yes or No.
Custom Properties
If custom properties have been configured for the
requirement, they are listed here.
Document
Source document (if any) from which this requirement
was derived.
Created On
Date on which this requirement was created.
Silk Central 15.5
| 51
Property
Description
Created By
Name of the user who created this requirement.
Changed On
Date on which this requirement was last updated.
Changed By
Name of the user who last updated this requirement.
Requirement Attachments
You can upload multiple files or links as attachments to requirements or delete attachments. When you cut
and paste requirements that have attachments, the attachments are automatically included with the copies.
The following attachment types are available:
•
•
•
Uploaded Files (.gif, .png, .jpg, .doc, .rtf, .txt, .zip, .xls, .csv, and more)
References to UNC paths
References to URLs, including StarTeam URLs
Attaching a File to a Requirement
To attach a file to a requirement:
1. In the menu, click Requirements > Details View .
2. Select the requirement in the Requirements tree.
3. Click the Attachments tab.
When requirements management integration has been enabled between a Silk Central project and a
Caliber project, the Attachments page includes an Open Caliber button, which enables you to manage
requirement attachments directly in Caliber.
4. Click Upload File. The Upload File dialog box appears.
5. Click Browse and select the file that you want to attach from your local file system.
6. Type a Description for the attachment.
7. Click OK. The attachment is uploaded to the server and associated with the selected requirement.
Note: Attaching files to a requirement may not work in Mozilla Firefox. Mozilla Firefox requires usage
of three slashes, for example file:///, for a file link, while other browsers require only two, for
example file://. Aditionally, Mozilla Firefox includes a security feature blocking links from remote
files to local files and directories. For more information, see http://kb.mozillazine.org/
Firefox_:_Issues_:_Links_to_Local_Pages_Don't_Work
Attaching a Link to a Requirement
To attach a link to a requirement
1. In the menu, click Requirements > Details View .
2. Select the requirement in the Requirements tree.
3. Click the Attachments tab.
When requirements management integration has been enabled between a Silk Central project and a
Caliber project, the Attachments page includes an Open Caliber button, which enables you to manage
requirement attachments directly in Caliber.
4. Click Attach Link. The Attach Link dialog box appears.
5. Type the URL in the Link field.
6. Type a Description for the attached link.
7. Click OK. The link is associated with the selected requirement.
52
| Silk Central 15.5
Viewing a Requirement Attachment
To view a requirement attachment:
1. In the menu, click Requirements > Details View .
2. Select the requirement in the Requirements tree.
3. Click the Attachments tab.
When requirements management integration has been enabled between a Silk Central project and a
Caliber project, the Attachments page includes an Open Caliber button, which enables you to manage
requirement attachments directly in Caliber.
A list of all attachments that are associated with the requirement opens. Each attachment name serves as
a link. File-attachment links open Save As dialog boxes, enabling you to download attachments to your
local file system. Link-attachments link directly to link destinations in newly spawned browser windows.
Deleting a Requirement Attachment
To delete a requirement attachment:
1. In the menu, click Requirements > Details View .
2. Select the requirement in the Requirements tree.
3. Click the Attachments tab.
When requirements management integration has been enabled between a Silk Central project and a
Caliber project, the Attachments page includes an Open Caliber button, which enables you to manage
requirement attachments directly in Caliber.
4. Click
in the Actions column of the attachment that you want to delete.
5. Click Yes on the confirmation dialog to delete the attachment from the project.
Note: Only one attachment at a time can be deleted.
Requirement Attachments Page
Requirements > Details View > Attachments
The Attachments page lists files and links that are attached to the selected requirement. The attachments
are displayed in the order in which they are uploaded, though the list of attachments can be sorted by
Name, Created On, and Created By properties.
Note: To display any attachments that are associated with child requirements of the selected
requirement, check the Include Child Attachments check box.
Note: The file icons indicate whether documents are directly attached to the selected requirement, or
whether they are attached to a child requirement of the selected requirement.
Single icon
The file is directly attached to the selected requirement.
Double icon
The file is attached to a child requirement of the selected requirement.
The Attachments page displays the following columns for each listed attachment:
Column
Description
Actions
Click
Attachment Icon
Depends on the type of the attachment.
Name
Name of the attachment.
to delete the attachment.
Silk Central 15.5
| 53
Column
Description
Size
Size of the attachment.
Description
Description of the attachment.
Created On
When the attachment was created.
Created By
User who created the attachment.
Working with Tests
This section describes how to use tests in the Requirements area.
Assigning Tests from Grid View to Requirements
To assign one or more tests from the test area Grid View to one or more requirements:
1. In the menu, click Tests > Details View .
2. Click
on the toolbar.
3. Select the tests that you want to assign to requirements.
You can use your keyboard's CTRL and SHIFT keys to select multiple tests using standard browser
multi-select functions.
4. Right-click the selected tests and select Save Selection.
5. In the menu, click Requirements > Details View .
6. Select the requirement to which you want to assign the selected tests.
7. Click the Assigned Tests tab.
8. Click Assign Saved Selection.
Note: Only tests that reside in the requirements test container are assigned. You can assign the
selected tests to more than one requirement but you cannot assign them into requirements in a
different project. The selection persists until you make a different selection or close Silk Central.
Assigning Tests to Requirements Manually
To manually assign tests to a requirement:
1. In the menu, click Requirements > Details View .
2. Select the requirement in the Requirements tree.
3. Click the Assigned Tests tab. All tests that are available for assignment are displayed in the Test
window.
4. If you have created a test filter, you can select it from the filter list above the Test window.
To create a new test filter, navigate to the Tests area and click New Filter on the toolbar.
5. Click
left of any test you want to assign to the currently selected requirement.
Clicking
left of a test container or test folder assigns the tests that are located in those containers or
folders to the selected requirement. Tests that are located within sub-folders of those containers and
folders are also assigned.
Tip: Right-click a node to expand and collapse it.
Locating Assigned Tests in the Tests Tree
To locate an assigned test in the Tests tree:
1. In the menu, click Requirements > Details View .
54
| Silk Central 15.5
2. Click
in the toolbar.
3. Select a requirement in the Requirements tree that has at least one test assigned to it.
4. Click the Assigned Tests tab.
5. In the Actions column of a test, click
to find out in which test folder or container the test is stored in.
The corresponding test folder or container is highlighted in the Tests window.
Removing Test Assignments
To remove a test assignment:
1. In the menu, click Requirements > Details View .
2. Click
in the toolbar.
3. Select a requirement in the Requirements tree that has at least one test assigned to it.
4. In the Actions column of the assigned test you want to remove, click .
5. Click Yes on the confirmation dialog box to confirm deletion of the assignment.
Note: To remove all test assignments from the selected requirement, click Remove All.
Generating Tests from Requirements Details View
You can generate tests directly out of the Requirements tree and assign tests to specific requirements.
The Requirements tree serves as a template for the test folder/test structure of the new Tests tree.
To generate a new test from the Details View:
1. In the menu, click Requirements > Details View .
2. Right-click the requirement or project node that you want to convert into a test and select Generate
Tests. The Generate Tests from Requirements dialog box appears. This dialog box enables you to
specify whether the leaves, which means the lowest-level nodes, of the selected requirements sub-tree
should be converted into tests or test folders and whether the tree should be generated into a new test
container or an existing container.
3. Enter a name for the new test container in the Enter Name field and select a product from the Select
Product list to create the container within the active Silk Central project.
The Select Product list is populated with the products that are configured by a project manager. For
detailed information, see the Administration topics in this Help or ask your project manager.
4. If you have defined a source control profile, select the source control profile you want to use for
managing the test sources from the Select Source Control Profile list.
For detailed information on source control profiles, see Source Control Profiles or ask your Silk Central
administrator.
5. To include all child requirements of the selected requirement in the test, check the Include Child
Requirements check box.
The check box is checked by default.
6. To have the new tests automatically assigned to the requirements from which they are created, check
the Assign newly generated tests to Requirements check box.
If this option is not selected, tests must be manually associated with requirements.
Note: This option is not available when checking Generate test folders from requirement tree
leaves.
7. Click OK to create the test.
The new test has the same structure as the Requirements tree.
8. A message box displays. Click Yes to view the test in the Tests area, or click No to remain in the
Requirements area.
Silk Central 15.5
| 55
Assigned Tests Page
Requirements > Details View > Assigned Tests
The Assigned Tests page lists all tests that are assigned to the selected requirement. If a test is assigned
to more than one execution plan and the Display in Execution Context check box is checked, the test is
displayed in a separate line of the grid for each execution plan.
All tests that are available for assignment are displayed in the right-hand Tests tree. To assign a test to the
selected requirement, double-click on the entry in the tree or click
to the left of the entry.
If you have created a test filter, you can select it from the filter list above the Tests tree. To create a new
test filter, navigate to the Tests area and click New Filter on the toolbar.
To automatically assign newly generated tests to the requirements from which they are generated, check
the Assign newly generated Tests to Requirements check box on the Generate Test from
Requirements dialog box.
The default view displays only those tests that are assigned directly to the selected requirement. Check the
Full Coverage check box to additionally display all tests that are assigned to child requirements of the
selected requirement. When Full Coverage is checked, tests that are not assigned to the selected
requirement, but are assigned to a child of the requirement, are displayed with an overlay over the testtype icon.
If you have copied a set of tests from Tests > Grid View to the clipboard, click Assign Saved Selection to
assign the entire set to the selected requirement. Click Remove All to remove all assigned tests from the
requirement.
To assign existing issues to one or more tests directly in the grid, right-click a test and click Assign
Existing Issue. You can select multiple tests with Ctrl+Click or Shift+Click.
The Assigned Tests page displays the following columns for each listed test:
Column
Description
Actions
You can perform the following actions on an assigned test:
•
Click
•
Click
to remove the assigned test from the requirement.
to locate the assigned test in the right-hand Tests tree.
Test
Name of the assigned test. Click to view and edit the test. For configuration testing,
the test is separately listed for each configuration.
Execution Plan
This column is only displayed if the Display in Execution Context check box is
checked. Name of the execution plan that includes the assigned test. For configuration
testing.
Execution Plan Parent
The configuration suite, folder, or testing cycle in the context of which the execution
plan is executed. Click to access the suite or folder in the Execution Plans tree. If the
execution plan is not included in a configuration suite or folder, nothing is displayed.
Status
Status of the assigned test in each execution plan to which the test is assigned. To
display the status of all runs of the displayed tests in each execution plan, check the
Display in Execution Context check box.
•
•
•
•
Passed
Failed
Not Executed
N/A
For tests or test packages that are included in a configuration suite, the status is an
aggregation of all statuses of all configurations within the suite:
56
| Silk Central 15.5
Column
Description
•
If the test is assigned only to the configuration suite, the status is Passed only if it
is passed in all configurations. If the status is not Passed in all configurations, the
status of the worst run is propagated, with the following top-down priority:
1.
2.
3.
4.
•
•
N/A
Not Executed
Failed
Passed
The status of a requirement that is assigned to the test is Failed if the test fails
in one or more of the configurations.
We do not recommend assigning the test to a configuration suite and one or more
simple execution plans. However, in this case, the aggregate of the configuration
statuses is one status, and the last statuses of the execution plans are other
statuses. The status that was executed last determines the last status of the test.
If the test is assigned to a simple execution plan only, the status is updated in
response to the status of the last test run.
Last Execution
Time and date of the last execution of the test.
Issues
This column is only displayed if the Display in Execution Context check box is not
checked. Issues that are associated with this test.
Coverage
This section describes how to cover your requirements with tests.
Coverage Modes
Silk Central provides two modes for coverage. Full coverage and direct coverage. The status of a
requirement in the full coverage mode considers the status of the child requirements and offers a
cumulative view of the tests that cover the requirement. If one or more child requirements have the status
Not Covered, then the full coverage status of the selected requirement is also Not Covered, even if the
coverage status of the requirement is Covered. The full coverage mode enables easy evaluation of
whether or not requirements are covered by tests.
The status of a requirement in the direct coverage mode is calculated based only on the status of the tests
that are directly assigned to the requirement. Child requirements are not considered in calculations.
Switching Between Coverage Modes
To switch between full- and direct-coverage modes:
1. In the menu, click Requirements > Details View .
2. Click
/
to respectively view direct coverage or full coverage.
Coverage Page
Requirements > Details View > Coverage
The Coverage page, which you can only access in Details View, displays basic properties of the selected
requirement or project. It also displays the status of all tests that are assigned to the requirement, including
the number and percentage of Passed, Failed, Not Executed, and Not Covered tests. A summary
of all assigned tests is listed under Total. Requirements that are not covered by tests are listed as Not
Covered.
Silk Central 15.5
| 57
The Details View page displays the same coverage status information in a “heat field” chart.
To view the status of all tests that are assigned to child requirements of the selected requirement in
addition to all tests that are directly assigned to the requirement, check the Full coverage check box.
Note: In both Details View and the Coverage page, test totals accumulate to the parent level. For
example, requirement totals include tests from child requirements and project totals include tests from
all requirements.
The Coverage page displays the following properties for each selected requirement or project:
Property
Description
Requirement Name
Name of the selected requirement or project.
Project Name
Priority
Priority that has been assigned to the selected requirement.
Risk
Risk that has been assigned to the selected requirement.
# Requirements (Calc.)
Total number of all covered requirements. Not included in this number are
uncovered requirements and folders that do not have a test assigned to
them. For example folders that inherit the coverage of their child
requirements but are not actually a requirement themselves.
# Requirements (Total)
Total number of all requirements beneath the selected entity, including
folders.
Requirement Status
Status of the selected requirement or project.
Project Status
•
•
•
•
Passed
Failed
Not Executed
Not Covered
# Requirements Passed
Total and percentage of requirements in the project that have tests that
have passed.
# Requirements Failed
Total and percentage of requirements in the project that have tests that
have failed.
# Requirements Not Executed
Total and percentage of requirements in the project that have tests that
have not been executed.
# Requirements Not Covered
Total and percentage of requirements in the project that are not covered by
tests.
Total
Total number of requirements in the project.
Requirement History
Silk Central provides a complete history of all changes that are made to requirements. History information
is read-only, and cannot be edited or permanently deleted.
on the toolbar, enables you to efficiently
The Recent Changes filter, which you can access by clicking
view and acknowledge the latest changes and additions that have been made to requirements.
Note: When you delete a requirement with the Destroy permanently option, you delete a
requirement that is marked as obsolete, or if you acknowledge all recent changes, a change history
entry is added to the history file of the project, to which the requirements belong.
58
| Silk Central 15.5
Viewing Recent Changes
To view recent changes to requirements:
1. In the menu, click Requirements > Details View .
2. Click
to filter out all requirements except those that have been changed since your last change
acknowledgement.
Note: The recent changes filter is selected automatically in the Filter list box.
3. When you have reviewed the changes, you can accept them by clicking
.
The acknowledge function resets the recent changes filter.
4. Click
again to remove filtering and see all requirements.
Tracking the History of a Requirement
To view a requirement’s history:
1. In the menu, click Requirements > Details View .
2. Select the requirement in the Requirements tree.
3. Click the History tab.
4. Optional: When requirements management integration between a Silk Central project and a Caliber
project is enabled, you can click Open Caliber in the History page to view the history of synchronized
requirements directly in Caliber.
The properties of all revisions that have been logged by Silk Central are displayed in tabular format.
Requirement History Page
Requirements > Details View > <Requirement> > History
The History page details the revision history of the selected requirement or project. The following actions
generate requirement history entries:
•
•
•
•
•
•
Adding a new requirement
Editing a requirement
Marking a requirement as obsolete
Adding an attachment to a requirement
Deleting an attachment from a requirement
Importing or updating a requirement through MS Word or MS Excel
For each change, the page displays the following columns:
Column
Description
Rev.
Revision number. 1-n.
Changed On
Date and time of the change.
Changed By
User that made the change.
Notes
Automatically generated description of the change. For
example, “deleted” or “created”.
Note: When the page includes more elements than can be displayed at once without impacting
response time, elements are displayed in increments. Page number links at the bottom of the page
Silk Central 15.5
| 59
allow you to browse through the elements included on the page one page at a time. To display all
elements as a single list, click the [All] link.
Requirement Change Notification
You can configure email notifications to alert you to changes that are made to requirement settings for
specified projects. For more information on change notification, see Change Notification.
Requirements Reports
This section describes the requirements-related reports that ship with Silk Central. Requirements reports
detail the status of functional requirements, for example compatibility requirements, GUI requirements, or
feature requirements, which must be met during development. Requirements may also relate to product
management objectives such as reliability, scalability, and performance. The requirement-management
reports help managers to determine if adequate test coverage is established to verify that system
requirements are met during development. When a report references a requirement that includes HTMLformatted content, that content is rendered in the report.
Status Reports
The following status reports are available for the Requirements area:
Report
Description
Requirements
Status Overview
Represents a grouped summary of all requirements by current requirement
coverage. Coverage is expressed by the statuses Passed, Failed, Not
Executed, and Not Covered.
Top-Level
Requirement
Coverage
Represents a listing of all top-level requirements. For each requirement the
number of child requirements, that are covered and not-covered by tests, is
displayed.
Represents a summary of all requirements by current requirement coverage. The
Status of
Requirements with returned group of requirements is restricted by the Priority parameter, which
Priority Higher than specifies the lowest requirement priority that is considered in the data.
'X'
Requirement Impact Displays the test details grouped by the execution plan that is associated to the
requirement. This report allows the user to gain insight into testing assets that may
Analysis Report
be impacted by a change to the requirement. The report contains the name,
status, date/time of last execution, manual testers, planned time, and issues of
each test. The following statuses are used:
Status
Description
Passed
The test passed.
Failed
The test failed.
N/A
The test is associated to a requirement but is not submitted for
execution.
Not Executed The test is associated to a requirement and is submitted for
execution but not executed yet.
Project
Requirement
Traceability Report
60
| Silk Central 15.5
Displays all requirements in a project along with their associated tests and issues.
The following statuses are used:
Status
Description
Passed
The test passed.
Report
Description
Status
Description
Failed
The test failed.
N/A
The test is associated to a requirement but is not submitted for
execution.
Not Executed The test is associated to a requirement and is submitted for
execution but not executed yet.
Progress Reports
The following progress reports are available for the Requirements area:
Report
Description
Requirements Coverage Across
Builds 'X' and 'Y'
Represents a summary of all requirements by current requirement
coverage. The returned group of requirements is restricted by the
Priority parameter, which specifies the lowest requirement
priority that is considered in the data.
Requirements Coverage Over the Represents a trend in requirements coverage by considering overall
requirements coverage over 'X' days.
Past 'X' Days
Specific Requirements Coverage
Over the Past 'X' Days
Represents a trend in requirements coverage by considering
specific requirements coverage over 'X' days.
Document Reports
The following document reports are available for requirements:
Report
Description
All Requirements
All requirements are represented with full requirement information.
Requirement with Child
Requirements
The selected requirement is shown with its requirement ID. Full details
regarding the child requirements of the requirement are displayed.
All Related Issues Report
The All Related Issues report provides a detailed list of all issues related to the assigned tests for a
requirement, and explains the relationship between requirements, the assigned tests, and issues that have
occurred.
Input Parameters
The input parameter for the All Related Issues report is the identifier of the requirement.
General Report Information
This section provides the following general information about the report:
Element
Description
Project Name
Name of the active project.
Report Description
Description of the report.
Report Executed By
User who executed the report.
Silk Central 15.5
| 61
Requirement Information
This section provides the following information about the requirement:
Element
Description
ID
Identifier of the requirement.
Name
Name of the requirement.
Description
Description of the requirement.
Nr. of Issues
Amount of issues related to the requirement or sub-requirements of the requirement.
Related Issues
Shows all issues related to the requirement or sub-requirements of the requirement in tabular form. The
table provides the following information for each issue:
Column
Description
ID
Identifier of the issue. If an identifier is provided by the issue tracking system, this external
identifier is used. The identifier is clickable if an external link is defined for the issue.
Synopsis
Meaningful short-description of the issue.
Status
Current status of the issue. If the status is provided by the issue tracking system, this
external status is used.
Assigned by Person who assigned the issue to the test.
Test ID
Identifier of the test in which the issue was discovered.
Test
Name of the test in which the issue was discovered.
Flags
Flags indicate that a requirement has changed or needs to be reviewed. Requirements with flags appear in
the requirements tree with flag icons. There is also a section in the requirement properties to view flag
information.
You can add and remove flags as needed and others will see the flag when they look at the requirement.
You can also flag a requirement and all of its children. There can only be one flag on an item at a time and
setting a flag on an item that already has a flag will overwrite the flag. Changes to the requirement flag are
maintained in the requirements change history.
If you are integrating with an external requirements management tool, you will also see flags from new or
updated external requirements. The following are scenarios about how flags are applied for integrated
requirements:
•
•
If you add a requirement to the requirements management tool after initial synchronization, then a
subsequent synchronization is performed, when the new requirement is added to Silk Central, it will
display with an added flag to indicate it was created during an update.
If you edit a requirement that has been synchronized to Silk Central, the requirement in Silk Central will
be flagged with a updated flag to indicate it was updated.
Setting a Flag
To set a flag on a requirement:
1. In the menu, click Requirements > Details View .
2. Select the requirement in the Requirements tree.
3. Right click the requirement and choose Flag > Set Flag . The Set Flag dialog box opens.
62
| Silk Central 15.5
4. Type a comment for the flag in the Comment text box.
5. To set the flag for all children of the currently selected requirement, click the Set flag on child
requirements check box.
6. Click Ok.
Note: The flag information is available on the Properties page of the requirement.
Clearing a Flag
To clear a flag from a requirement:
1. In the menu, click Requirements > Details View .
2. Select the requirement in the Requirements tree.
3. To clear a single flag: Right click the requirement and choose Flag > Clear Flag .
4. To clear the flag for all children of the selected requirement: Right click the requirement and choose
Flag > Clear Flag - Include Children . The flag information is removed from the Properties page of
the requirement.
Note: You can also clear the flag by clicking Clear Flag on the Properties page of the requirement.
Creating a Filter for Flagged Requirements
To create a filter for flagged requirements:
1. In the menu, click Requirements > Details View .
2. Click New Filter. The New Filter dialog box opens.
3. Select Requirements Property from the Selection Criteria list.
4. Select Requirement State from the Property list.
5. Select = from the Operator list.
6. Select one of the following values from the Value list:
None
No flag is selected
Flagged Manual
User manual added a flag to a requirement.
Flagged New
Requirement was created.
Flagged Updated
Requirement was updated.
Obsolete
Requirement is marked as obsolete.
7. Click Save and Apply.
Note: If child requirements are flagged, but one or more parent requirements are not flagged, the
full path to the flagged child requirements will display, but with the parent requirements disabled.
You cannot set or clear the flag for parent requirements that are in this state.
Requirements Import
Silk Central enables you to import requirements from Microsoft Word and Excel. You can import a
requirement into the Requirements area and then maintain all included requirements in Silk Central. The
import is a one-time event.
Importing Requirements from a Word File
Before you can import requirements, you need to create a requirements file in Word. For more information,
see Word Requirements File.
Silk Central 15.5
| 63
Silk Central uses the information stored in the Word file and in a mapping file to determine what data to
store and captures only the information that is mapped with certain styles. Silk Central uses a mapping file
to map the requirements in the Word file to the Silk Central requirements. A default mapping file named
RequirementsPropertiesDefaultMapping.xml is preselected for the import. You can choose your
own customized mapping file to map your requirements.
DOCX functionality: The functionality for .docx is the same as for .doc with the following improvements:
•
•
Images and any other embedded object (OLE) (for example: PDF, Excel) are detected and imported as
an attachment to a requirement.
Descriptions may contain hyperlinks.
To import requirements from a Word file into the Requirements unit:
1. In the menu, click Requirements > Details View .
2. Right-click the requirement that you want to use as the parent node of the imported requirements and
choose Import from Word.... The Import Requirements from Word File dialog box opens.
3. Select the mapping file from the Choose Mapping File list box. The default mapping file is
RequirementsPropertiesDefaultMapping.xml.
4. Optional: Edit the requirements mapping file.
5. Either type the fully qualified path of the requirements file into the Requirements File field or click
Browse to search for the requirements file.
6. Click OK. A message informs you if the import was successful. Click OK to close the message.
Updating Requirements from a Word File
Silk Central enables you to update requirements that were imported from Microsoft Word. You can change
the requirements in the Word document and then update them in the Requirements area. You can also
change the mapping file to change the mapping of the requirements in the Requirements area.
Note: You can only update a requirement for which a unique external ID is defined in the Word file
that has previously been imported. Silk Central requires this ID to identify which requirement needs to
be updated.
1. In the menu, click Requirements > Details View .
2. Right-click the parent node of the previously imported requirements (for example Imported from
file 'RequirementExample.docx') and choose Update from Word.... The Update
Requirements from Word File dialog box opens.
3. Select the mapping file from the Choose Mapping File list box. The default mapping file is
RequirementsPropertiesDefaultMapping.xml.
4. Either type the fully qualified path of the requirements file into the Requirements File field or click
Browse to search for the requirements file.
5. Click OK. A message informs you if the update was successful. Click OK to close the message.
Word Requirements File
Create a requirements file in Word to import requirements into Silk Central or to update them. In the
requirements file, define requirements and their hierarchy, along with their priorities, risks, review status,
and custom properties.
To map the requirements in your requirements file to the requirements in Silk Central, use an XML
mapping file. The mapping file maps the styles in the Word document to the requirement properties in Silk
Central. You can name the Word styles as you want, as long as you map them appropriately in your
mapping file.
If you want to be able to update the requirements, you must define a style for the external ID and assign a
unique external ID to each of the requirements in the requirement file. The following example shows a
sample requirement, two subrequirements, and the corresponding external IDs:
64
| Silk Central 15.5
Word file
Applied styles
Customer Account Management - Basics
ID_1
As user of the web shop I want to be
able to ...
Medium
High
No
Formatted with
Formatted with
Formatted with
"Description"
Formatted with
Formatted with
Formatted with
Word style "Heading 1"
Word style "ExternalID"
Word style
Customer Account Management Personal Details
ID_1.1
As user of the web shop I want to be
able to ...
Medium
Medium
No
Formatted with
Formatted with
Formatted with
"Description"
Formatted with
Formatted with
Formatted with
Word style "Heading 2"
Word style "ExternalID"
Word style
Formatted with
Formatted with
Formatted with
"Description"
Formatted with
Formatted with
Formatted with
Word style "Heading 2"
Word style "ExternalID"
Word style
Customer Account Management Shipping Details
ID_1.2
As user of the web shop I want to be
able to ...
Medium
Medium
No
Word style "Priority"
Word style "Risk"
Word style "Reviewed"
Word style "Priority"
Word style "Risk"
Word style "Reviewed"
Word style "Priority"
Word style "Risk"
Word style "Reviewed"
Importing Requirements from an Excel File
Before you can import requirements, you need to create a requirements file in Excel. For more information,
see Excel Requirements and Mapping File.
Silk Central uses the information stored in the Excel file and in a mapping file to determine what data to
store and captures only the information that is mapped with certain column names. Silk Central uses a
mapping file to map the requirements in the Excel file to the Silk Central requirements. A default mapping
file named RequirementPropertiesXlsxDefaultMapping.xml is preselected for the import. You
can choose your own customized mapping file to map your requirements.
Note: Importing attachments (images, graphs) is not supported.
To import requirements from an Excel file into the Requirements unit:
1. In the menu, click Requirements > Details View .
2. Right-click the requirement that you want to use as the parent node of the imported requirements and
choose Import from Excel.... The Import Requirements from Excel File dialog box opens.
3. Select the mapping file from the Choose Mapping File list box. The default mapping file is
RequirementPropertiesXlsxDefaultMapping.xml.
4. Optional: Edit the requirements mapping file. For more information, see Excel Requirements and
Mapping File.
5. Either type the fully qualified path of the requirements file into the Requirements File field or click
Browse to search for the requirements file.
6. Click OK. A message informs you if the import was successful. Click OK to close the message.
Updating Requirements from an Excel File
Silk Central enables you to update requirements that were imported from Microsoft Excel. You can change
the requirements in the Excel document and then update them in the Requirements area. You can also
change the mapping file to change the mapping of the requirements in the Requirements area.
Silk Central 15.5
| 65
Note: You can only update a requirement for which a unique external ID is defined in the Excel file
that has previously been imported. Silk Central requires this ID to identify which requirement needs to
be updated.
1. In the menu, click Requirements > Details View .
2. Right-click the parent node of the previously imported requirements (for example Imported from
file 'RequirementExample.xslx') and choose Update from Excel.... The Update
Requirements from Excel File dialog box opens.
3. Select the mapping file from the Choose Mapping File list box. The default mapping file is
RequirementPropertiesXlsxDefaultMapping.xml.
4. Either type the fully qualified path of the requirements file into the Requirements File field or click
Browse to search for the requirements file.
5. Click OK. A message informs you if the update was successful. Click OK to close the message.
Excel Requirements and Mapping File
Create a requirements file in Excel to import requirements into Silk Central or to update them. In the
requirements file, define requirements and their hierarchy, along with their priorities, risks, review status,
and custom properties.
To map the requirements in your requirements file to the requirements in Silk Central, use an XML
mapping file. The mapping file maps the columns in the Excel document to the requirement properties in
Silk Central.
Property Mappings
Click Edit Mapping on the Import Requirements from Excel File or Update Requirements from Excel
File dialog to map the requirements in your Excel file to Silk Central as follows:
•
•
•
•
•
•
Header Row: Specify the row in your Excel requirements file which contains the column names to be
used for mapping the properties.
First Data Row: Specify the row that contains the first requirement. This row and all rows below are
interpreted as requirements.
Separator Characters: Specify the characters that should be interpreted as separators within property
values. This is used for multi-list properties.
Name, Description: Specify the column names in the header row that are mapped to requirement
name and description, respectively.
External GUID: Specify the column name in the header row that contains the unique ID within your
requirements file for each requirement. These IDs can be used in External Parent GUID to create a
hierarchy of your requirements.
External Parent GUID: Specify the column name in the header row that contains the parent of a
requirement. In your requirements file, enter the parent's External GUID to specify the parent of a
requirement. If this cell does not contain data, the requirement is added directly to the generated root
requirement. The following rules apply:
•
•
•
•
•
66
| Silk Central 15.5
If a requirement has no parent ID set, it is added as a child to the generated root requirement
If a requirement has an invalid parent ID, it is added as a child to the generated root requirement
If a requirement has its own external ID set as parent ID, it is added as child to the generated root
requirement
• If two or more requirements have a circular dependency through their parent IDs, they are not
imported into Silk Central
Priority, Risk, Reviewed: Specify the column names in the header row that are mapped to the
localized values for these properties.
If you have defined custom properties, specify the column names in the header row for each of them to
be mapped correctly.
•
Save as: Specify the name of the file to be saved with your mapping information. This file is saved on
the application server in <Silk Central data directory>\OfficeImportMappingFiles
\requirements\xlsx\<client ID>, for example C:\ProgramData\SilkCentral
\OfficeImportMappingFiles\requirements\xlsx\1.
Sample Excel Requirements File
The following example shows a sample requirement, two subrequirements, and the
corresponding external IDs. This sample Excel requirements file matches the default
property mappings.
1
R
e
q
u
i
r
e
m
e
n
t
N
a
m
e
R
e
q
u
i
r
e
m
e
n
t
D
e
s
c
r
i
p
t
i
o
n
I
D
2
C
u
s
t
o
m
e
r
A
c
c
o
u
n
t
M
a
n
a
g
e
m
e
A
s
u
s
e
r
o
f
t
h
e
w
e
b
s
h
o
p
I
w
a
n
t
I
D
_
1
P
a
r
e
n
t
I
D
P
r
i
o
r
i
t
y
R
i
s
k
R
e
v
i
e
w
e
d
M
e
d
i
u
m
H
i
g
h
N
o
Silk Central 15.5
| 67
3
68
| Silk Central 15.5
n
t
B
a
s
i
c
s
t
o
b
e
a
b
l
e
t
o
.
.
.
C
u
s
t
o
m
e
r
A
c
c
o
u
n
t
M
a
n
a
g
e
m
e
n
t
P
e
r
s
o
n
a
l
D
e
t
a
i
l
s
A
s
u
s
e
r
o
f
t
h
e
w
e
b
s
h
o
p
I
w
a
n
t
t
o
b
e
a
b
l
e
t
o
.
.
.
I
D
_
1
.
1
I
D
_
1
M
e
d
i
u
m
M
e
d
i
u
m
N
o
4
C
u
s
t
o
m
e
r
A
c
c
o
u
n
t
M
a
n
a
g
e
m
e
n
t
S
h
i
p
p
i
n
g
D
e
t
a
i
l
s
A
s
u
s
e
r
o
f
t
h
e
w
e
b
s
h
o
p
I
w
a
n
t
t
o
b
e
a
b
l
e
t
o
.
.
.
I
D
_
1
.
2
I
D
_
1
M
e
d
i
u
m
M
e
d
i
u
m
N
o
External Requirements Management Tools
This section explains how to work with external requirements management tools.
Important: Before upgrading from Silk Central 15.0 or earlier to the current version, perform a
Synchronize All to synchronize all your requirements with your integrated requirements
management tools.
Synchronizing Requirements
Enabling synchronization of requirements between Silk Central and an external RMS enables Silk Central
to receive changes that occur in the external RMS whenever a synchronization is executed. If a project has
Silk Central 15.5
| 69
external RMS integration enabled, the master system for requirements is automatically the external
system. This means that synchronization is always from the external RMS tool to Silk Central.
Requirements can no longer be edited in Silk Central. An exception are newly created requirements that
don't exist in the external tool, which are uploaded to the external (master) system only if the option Enable
upload of requirements is enabled in Settings > Requirements Management .
Property mapping functionality allows you to map property fields between Silk Central and external
requirement tools. For example, a custom field in Silk Central called User might be equivalent to a
property field in Caliber called Field_2. The property mapping feature ensures that changes to
requirement-property fields are accurately refreshed between projects. If you don't use the property
mapping feature, only the name and the description of the requirements are mapped. For more
information, see Editing Property Mapping.
Requirements can be synchronized in one of several ways:
Manual
synchronization
Click Synchronize Changes at the root folder level on the Properties page to
synchronize only requirements that have changed since the last synchronization.
This option is not available for IBM Rational RequisitePro.
Forced manual
synchronization
Click Synchronize All at the root folder level on the Properties page to force
synchronization of all requirements.
Automatic
scheduled
synchronization
Based on globally defined Silk Central schedules.
Automatic online
synchronization
Changes to requirements are automatically propagated between tools. This option
is available for Caliber only. It requires Caliber client installation on the application
server and MPX enabled on the Caliber Server (refer to the Caliber Installation
Guide for detailed information on enabling MPX). To enable automatic
synchronization between Caliber and Silk Central, add the file ss.jar to the
application server at Program Files\Silk\Silk Central <version>\lib
and restart the application server. Contact customer care to obtain the file.
Requirement data is automatically updated in Silk Central when changes are
made in Caliber and traces in Caliber are updated when test assignment changes
are performed in Silk Central. This type of online synchronization is only available
when projects are configured with the current baseline.
Automatic synchronization of requirements between Silk Central and external requirements management
tools can be configured to occur based on global schedules. For details on configuring global schedules,
see the Administration topics in this Help.
Note: The Open Caliber buttons open whatever program is registered as the default program for
opening files of extension .crm. On some machines, this may be the requirement viewer, rather than
Caliber. This behavior can be changed by your administrator. The client program is called
caliberrm.exe. When properly configured, the program opens to the requirement that is selected
in Silk Central.
The binder icon on the project node of the Requirements tree indicates the status of RM integration for the
project:
No configuration
RM integration is not available.
Manual configuration Requirement import, upload, and synchronization can be done only by clicking
the corresponding buttons on the project node in Requirements >
Properties.
At the project level, the Properties page includes the following properties:
70
| Silk Central 15.5
>
Property
Description
System
The external tool with which integration has been enabled.
Status
Whether or not integration has been enabled.
Project Name
The name of the external project that the Silk Central project is associated with.
Requirement Types
The requirement types that are shared between projects.
Last Synchronization
Date and time of the last synchronization.
Last Synchronization Status
The status of the last synchronization including the number of created, updated, and
deleted items.
Note: When integration between Caliber and Silk Central with automatic online synchronization has
been enabled, the project node displays the current status of the online requirements change listener.
The three possible statuses for such projects are: Connected (synchronized), Reconnected
(synchronization recommended), and Disconnected.
Synchronizing Requirements Across Tools
Note: Use the property mapping feature to map property fields. If you don't use the property mapping
feature, only the name and the description of the requirements are mapped. For more information,
see Editing Property Mapping.
To synchronize requirements between Silk Central and an externally configured requirements
management tool
1. In the menu, click Requirements > Details View .
2. Select the Project node in the Requirements tree.
3. Click the Properties tab. The Properties page displays the properties of the selected tree-element.
4. Click Synchronize Changes.
5. Click Yes on the Synchronize Requirements confirmation dialog box to begin synchronization. A
dialog box opens when synchronization is complete, displaying synchronization statistics, including the
number of requirements that have been created, updated, and deleted.
6. Click OK to complete the synchronization. Any updates that were made to mapped requirements in
your externally configured requirements management tool are now reflected in the Requirements tree.
Synchronizing Requirements based on Schedules
You can configure global schedules to automatically synchronize requirements between Silk Central and
an external requirements management tool. To enable automatic synchronization between Caliber and Silk
Central, add the file ss.jar to the application server at Program Files\Silk\Silk Central
<version>\lib and restart the application server. To obtain the file, contact customer care.
To synchronize requirements based on globally defined schedules:
1. In the menu, click Project:<Project Name> > Project Settings .
Note: If you have not selected a project, a warning message opens, asking you to select a project.
Select the project for which you want to define the setting.
2. Click the Requirements Management tab.
3. Click Edit Schedule. The Edit Schedule dialog box opens.
4. Click the Global option button.
5. Select a pre-defined global schedule from the selection list.
6. Click OK.
Silk Central 15.5
| 71
Defining Email Notification for Automatic Synchronization Events
You can define an email notification to alert users when errors occur during automated synchronization of
requirements between Silk Central and external requirements management tools. All notification recipients
receive copies of the synchronization log files.
To define an email notification for automatic synchronization events:
1. In the menu, click Project:<Project Name> > Project Settings .
Note: If you have not selected a project, a warning message opens, asking you to select a project.
Select the project for which you want to define the setting.
2. Click the Requirements Management tab.
3. Click Edit Notification. The Edit Notification dialog box displays.
4. Check the Enable notification check box.
5. Select a user name from the Username list box.
6. If required, add additional email addresses for other recipients in the Other email addresses text box.
Use semicolons to separate multiple email addresses.
7. Click OK.
Caliber Integration
This section describes how to integrate Caliber with Silk Central.
Note: Caliber user defined attribute Multiple selection user list and Multiple selection group list
must be mapped to the Silk Central text attribute type and not list type.
Enabling Integration with Caliber
To enable integration with Caliber:
1. In the menu, click Projects > Project List.
2. Select the project to which you want to establish integration.
3. In the menu, click Project:<Project Name> > Project Settings .
Note: If you have not selected a project, a warning message opens, asking you to select a project.
Select the project for which you want to define the setting.
4. Click the Requirements Management tab.
5. Click New Integration.
Note: To enable creation and editing of unmapped requirements within the integrated
requirements, check the Allow internal requirements check box.
The New Integration dialog box opens.
6. Select Caliber from the list and click Next. The Edit Configuration dialog box opens.
7. Type a Name for the new profile.
This is the name that is displayed in lists where the profiles are available for selection.
8. Type the Hostname of the machine where the external server is installed.
9. Type valid Username and Password credentials for the requirements management server.
10.Click Test Connection to confirm that the host and user credentials you have entered are correct.
A Connection successful message box displays if the settings are correct. Click OK to continue.
Note: Consult your system administrator if you are not able to establish a connection.
11.Click OK.
12.From the Project list box, select the external project with which the Silk Central project is to be
integrated. The requirement types that are available with the selected project are automatically
72
| Silk Central 15.5
populated into the Requirement Types field. The baselines that are available with the selected project
are automatically populated into the Baseline field.
13.Select a Baseline from the external project that should be integrated with the Silk Central project.
Your selections are displayed on the Edit Configuration dialog box.
14.Click OK.
15.Select one or more requirement types from the external project that should be integrated with the Silk
Central project.
Use CTRL + Click to select multiple requirement types.
16.Click OK to save your settings.
Baseline Support for Caliber Integration
You can select the current baseline or existing user-defined baselines for Caliber integration. You cannot
import modified baselined requirements into Silk Central. Requirements that are not of the current baseline
can only be changed in Caliber if the version of the requirement that is used for the baseline is changed.
Such changes are only updated within Silk Central requirements when a manual or scheduled
synchronization is performed.
You can change a baseline after you import it into Silk Central. You can change the configured baseline to
a different user-defined baseline or the current baseline. After such a change, the next synchronization of
the baseline, either manual or scheduled, will update the Silk Central project and update, create, or delete
requirements as required. When a baseline is changed, a message displays that states that the changes
will take effect after the next synchronization.
Handling Test Assignments in Caliber
Assigned tests are displayed, managed, and created as traces (“Trace to”) of synchronized requirements in
Caliber.
The External Traceability for Silk Central must be enabled for a Caliber project within the Caliber
Administrator and the correct Silk Central front-end server must be configured. Click Edit for the Silk
Central External Traceability for correct project within the Caliber Administrator.
When a project is synchronized with a Silk Central project, the assigned tests of the synchronized Silk
Central requirements will display as traces ("Trace To") of the Caliber requirement. If you edit these
assignments in Silk Central, the changes will be reflected immediately in Caliber.
Copying Caliber-Integrated Projects
To manage Caliber baselines when copying Silk Central projects:
1. In the menu, click Project:<Project Name> > Project Settings .
Note: If you have not selected a project, a warning message opens, asking you to select a project.
Select the project for which you want to define the setting.
2. Click the Requirements Management tab.
3. Verify that the baseline you want to save is selected.
Note: If a baseline is changed, you must perform a synchronization to update the project
requirements with the baseline changes, before you can copy an associated Silk Central project.
The integration configuration is only copied if you select a baseline other than the current baseline.
If you select the current baseline, you need to specify if you want to keep the integration
configuration in the original project or move it to the copied project.
4. If the baseline that you want to save is not selected, click Edit Configuration. The Edit Configuration
dialog box displays.
5. Click Browse next to the Project name text box. The Browse Projects dialog box opens.
6. Select the baseline you want to save, then confirm your selection.
Silk Central 15.5
| 73
7. In the menu, click Projects > Project List . The Projects page displays, listing all existing projects and
project baselines.
8. Click
in the Actions column of the project you want to copy.
Note: For full details on copying a project, see the Administration topics in this Help.
The Copy Project dialog box displays.
9. Select the items you want to copy into the new project, then confirm your selection.
10.Apply the baseline that you want to continue working with to the Silk Central project.
Note: After copying a project, the original project and the copy are identical. Define on which you
will continue working on by applying the corresponding baseline.
Creating a Baseline for a Caliber-Integrated Project
To create a baseline of a Caliber-integrated Silk Central project:
1. Create a baseline of the Silk Central project. A Silk Central message box displays during the process,
asking if you want to enable the Caliber integration for the new baseline.
2. Click Yes. When the new baseline is created, the Baseline Project - Adapt Project Settings dialog
box opens.
3. Click Edit to change the requirements integration settings.
The Edit Configuration dialog box opens.
4. Click Browse next to the Project name text box. The Browse Projects dialog box opens.
5. Select a Caliber project, a baseline, and the requirement type for synchronization.
6. Click Ok to close the Browse Projects dialog box.
7. Click Ok to close the Edit Configuration dialog box.
8. Click Finish to close the Baseline Project - Adapt Project Settings dialog box.
Atlassian JIRA Agile Integration
Silk Central offers a requirements integration with Atlassian JIRA Agile, which is based on the project and
issue tracking system JIRA. All issue types (the generic object type in JIRA) can be synchronized. Since
Atlassian JIRA Agile offers the creation of custom issue types, you can specify a list of Atlassian JIRA Agile
issue types in Silk Central that you want to synchronize, such as for example Bug or Improvement.
Enabling Integration with Atlassian JIRA Agile
To enable integration with Atlassian JIRA Agile:
1. In the menu, click Projects > Project List.
2. Select the project to which you want to establish integration.
3. In the menu, click Project:<Project Name> > Project Settings .
Note: If you have not selected a project, a warning message opens, asking you to select a project.
Select the project for which you want to define the setting.
4. Click the Requirements Management tab.
5. Click New Integration.
Note: To enable creation and editing of unmapped requirements within the integrated
requirements, check the Allow internal requirements check box.
The New Integration dialog box opens.
6. Select Atlassian JIRA Agile from the list and click Next. The Edit Configuration dialog box opens.
7. Type a Name for the new profile.
74
| Silk Central 15.5
This is the name that is displayed in lists where the profiles are available for selection.
8. Enter the URL of your JIRA Agile server.
9. Type valid Username and Password credentials for JIRA Agile.
10.In the Issue Types field, specify the issue types that you want to synchronize, separated by semicolons
(;).
All issue types (the generic object type in JIRA) can be synchronized. Since Atlassian JIRA Agile offers
the creation of custom issue types, you can specify a list of Atlassian JIRA Agile issue types in Silk
Central that you want to synchronize, such as for example Bug or Improvement.
11.Click Test Connection to confirm that the host and user credentials you have entered are correct.
A Connection successful message box displays if the settings are correct. Click OK to continue.
Note: Consult your system administrator if you are not able to establish a connection.
12.Click Load. The Project list is populated with all the projects in JIRA Agile that you have permissions
for.
13.From the Project list, select the external project with which the Silk Central project is to be integrated.
14.Click OK to save your settings.
Atlassian JIRA Agile Property Mappings
The following properties have a default mapping between JIRA Agile and Silk Central:
•
•
User stories that are in JIRA Agile's Backlog are reflected in Silk Central by having the Sprint
property value set to Backlog. This enables you to easily search for them by creating a filter.
The default Priority values of JIRA Agile's user stories are mapped to Silk Central's Priority
property. If you are not using JIRA Agile's default Priority values, you can customize this mapping.
Viewing JIRA Agile Backlog Stories in Silk Central
1. In the menu, click Requirements > Details View.
2. Create a new filter with the following criteria:
• Selection Criteria: External Custom Attributes
• Property: Sprint
• Value: Backlog
3. Click Apply to apply the filter immediately or Save and apply to save the filter for future reuse.
Mapping JIRA Agile Priority values to Silk Central's Priority
The default Priority values of JIRA Agile's user stories are mapped to Silk Central's Priority property
as follows:
•
•
•
•
•
Blocker=SC_Priority_Critical
Critical=SC_Priority_High
Major=SC_Priority_Medium
Minor=SC_Priority_Low
Trivial=SC_Priority_Low
If you are not using JIRA Agile's default Priority values, or if you want to customize the mapping, your
Silk Central administrator should customize the settings as follows:
1. Stop the application server.
2. Open the file propertyMappings.properties with a text editor. This file is located in the JIRA Agile
plugin-file JIRAAgile.zip on the application server in the plugins folder.
3. Search for SC_Priority=Priority, beneath which you can customize the mapping of JIRA Agile's
Priority values to Silk Central's Priority.
Silk Central 15.5
| 75
Note: Silk Central Priority values require the prefix SC_Priority_.
4. Save and close the file
5. Re-start the application server.
IBM Rational DOORS Integration
This section describes how to integrate Silk Central and IBM Rational® DOORS® (DOORS).
Installing IBM Rational DOORS on the Front-End Server
To integrate Silk Central and DOORS, install the DOORS client on the Silk Central front-end server
machine. If you use more than one front-end server machine, you must install the DOORS client to the
same directory on each of the machines.
To install the DOORS client on the Silk Central front-end server machine:
1. In the menu, click Help > Tools .
2. Click Silk Central Add-In for IBM Rational DOORS to download the DOORS plug-in package.
The package contains two ZIP-Archives:
• DoorsRM.zip
• DoorsClientLibs.zip
3. Create a new folder with the name testmanager in the …\lib\dxl folder of your DOORS client
installation.
The default path for this folder is C:\Program Files (x86)\IBM\Rational\DOORS\<version>.
4. Extract all DOORS script files from DoorsClientLibs.zip to this folder.
The plug-in package DoorsRMPlugin.zip is automatically installed to the Plugins folder of your Silk
Central application server installation during the setup process. During startup of the application server,
this plug-in will be published to all front-end servers.
Enabling Integration with IBM Rational DOORS
To enable integration with DOORS:
1. In the menu, click Projects > Project List.
2. Select the project to which you want to establish integration.
3. In the menu, click Project:<Project Name> > Project Settings .
Note: If you have not selected a project, a warning message opens, asking you to select a project.
Select the project for which you want to define the setting.
4. Click the Requirements Management tab.
5. Click New Integration.
Note: To enable creation and editing of unmapped requirements within the integrated
requirements, check the Allow internal requirements check box.
The New Integration dialog box opens.
6. Select IBM Rational DOORS from the list and click Next. The Edit Configuration dialog box opens.
7. Type a Name for the new profile.
This is the name that is displayed in lists where the profiles are available for selection.
8. In the RM service URL text box, type the URL of the Silk Central DOORS requirement Web Service.
The default value should point to the correct location already. For example http://MySCTMHost:
19120/services/doorsrequirementsmanagement.
9. Type valid Username and Password credentials for the requirements management server.
76
| Silk Central 15.5
10.The default DOORS client installation path is displayed in the DOORS Installation Path text box. If this
path is not correct, click Browse to browse to and select the correct destination in the front-end server
directory structure.
11.Click Test Connection to confirm that the host and user credentials you have entered are correct.
A Connection successful message box displays if the settings are correct. Click OK to continue.
Note: Consult your system administrator if you are not able to establish a connection.
12.Click Browse next to the Project name text box to open the Browse Requirement Types dialog box.
From the Project text box, select the external project with which the Silk Central project is to be
synchronized.
The requirement types that are available with the selected project are automatically populated into the
Requirement types text box. Select the requirement types that are to be synchronized and click OK.
Use CTRL + CLICK to select multiple requirement types.
Your selections are now displayed on the Edit Configuration dialog box.
13.Click OK to save your settings.
Caution: As the DOORS application object is used for communication, and this object does not
support login data, but rather requires a running DOORS client, Silk Central starts each DOORS
client process with the provided login data and then uses that same data for all subsequent
application objects. Therefore only one set of DOORS login credentials is supported for
communication at one time. It is recommended that you use the same DOORS credentials for all
configurations so that integration tasks can be performed on the front-end server for all projects at
the same time. When a second set of credentials is used, the second set only works after all
sessions using of the first set of credentials have timed out.
IBM Rational RequisitePro Integration
The topics in this section describe the integration between IBM Rational RequisitePro and Silk Central.
Enabling Integration with IBM Rational RequisitePro
Note: You can only configure one IBM Rational RequisitePro integration per project.
To enable integration with IBM Rational RequisitePro:
1. In the menu, click Projects > Project List.
2. Select the project to which you want to establish integration.
3. In the menu, click Project:<Project Name> > Project Settings .
Note: If you have not selected a project, a warning message opens, asking you to select a project.
Select the project for which you want to define the setting.
4. Click the Requirements Management tab.
5. Click New Integration.
Note: To enable creation and editing of unmapped requirements within the integrated
requirements, check the Allow internal requirements check box.
6.
7.
8.
9.
The New Integration dialog box opens.
Select IBM Rational RequisitePro from the list and click Next. The Edit Configuration dialog box
opens.
Type a Name for the new profile.
This is the name that is displayed in lists where the profiles are available for selection.
Type the Project path (UNC) to the machine where the external server is installed.
Type valid UNC username and UNC password credentials for the machine where the external server
is installed.
Silk Central 15.5
| 77
10.Type valid Username and Password credentials for the requirements management server.
11.Click Test Connection to confirm that the host and user credentials you have entered are correct.
A Connection successful message box displays if the settings are correct. Click OK to continue.
Note: Consult your system administrator if you are not able to establish a connection.
12.Click Edit Packages and Requirement Types.
Your selections are then displayed on the Edit Configuration dialog.
Note: Only requirements of explicitly selected packages will be synchronized. Selecting a parent
package does not select the child packages of the parent.
The Browse Packages & Requirement Types dialog box opens. The packages and requirement
types that are available with the selected project are automatically populated into the Packages and
Requirement Types list boxes.
13.From the Packages list box, select one or more packages from the external project that should be
integrated with the Silk Central project.
Use CTRL + CLICK to select multiple packages.
14.From the Requirement types list box, select one or more requirement types from the external project
that should be integrated with the Silk Central project.
Use CTRL + CLICK to select multiple requirement types.
15.Click OK. The Browse Packages & Requirement Types dialog box closes.
16.Click OK to save your settings.
Rally Integration
Integrating the project management tool Rally enables you to define user stories which you can then use
as requirements in Silk Central. You can then create tests in Silk Central to cover these requirements. To
update the tests you have created with any changes to the corresponding user stories in Rally, synchronize
the requirements.
The following user story properties are synchronized from the Rally REST Service. You can use these
properties to help filter and categorize the user stories.:
Property
Description
Name
The name of the user story in Rally.
Rally ID
The identifier of the user story in Rally. This property is the External ID of the
requirement in Silk Central.
Description
The description of the user story in Rally.
Iteration
The iteration in Rally in which the user story is included.
Project
The project in Rally in which the user story is included.
Release
The project release in which the user story is included.
State
The state of progress of the user story in Rally. The following states are available:
•
•
•
•
Defined
In-Progress
Completed
Accepted
Plan Estimate (Story The estimated time in Rally for the user story to be completed. The time is
estimated in story points.
Points)
78
| Silk Central 15.5
Enabling Integration with Rally
To enable integration with Rally:
1. In the menu, click Projects > Project List.
2. Select the project to which you want to establish integration.
3. In the menu, click Project:<Project Name> > Project Settings .
Note: If you have not selected a project, a warning message opens, asking you to select a project.
Select the project for which you want to define the setting.
4. Click the Requirements Management tab.
5. Click New Integration.
Note: To enable creation and editing of unmapped requirements within the integrated
requirements, check the Allow internal requirements check box.
The New Integration dialog box opens.
6. Select Rally from the list and click Next. The Edit Configuration dialog box opens.
7. Type a Name for the new profile.
This is the name that is displayed in lists where the profiles are available for selection.
8. Type the URL.
9. Type valid Username and Password credentials for Rally.
10.Optional: If direct access to the Internet is restricted, and the Rally REST service is located in a
machine outside the scope of the internal network, use the Proxy Host and Proxy Port text boxes to
specify a proxy through which Silk Central can connect to Rally .
Note: To connect to Rally by using a proxy, you need to fill out both text boxes, Proxy Host and
Proxy Port.
11.Click Test Connection to confirm that the host and user credentials you have entered are correct.
A Connection successful message box displays if the settings are correct. Click OK to continue.
Note: Consult your system administrator if you are not able to establish a connection.
12.Click OK.
13.Click Load. The Project list box is populated with all the projects from all workspaces in Rally that you
have permissions for.
14.From the Project list box, select the external project with which the Silk Central project is to be
integrated.
15.Click OK to save your settings.
Generating Tests from External Requirements
From the RMSs currently shipped with Silk Central, only CaliberRDM supports generating tests. If you want
to use another RMS to generate tests, the RMS must be able to generate tests. The Silk Central plug-in
API includes a method to verify that the RMS is able to create tests. For more information, see
Requirements Plug-In API Interfaces.
To generate tests from external requirements:
1. Establish integration with the external requirement system.
For additional information, see Enabling Integration with Caliber.
2. Select the requirement in the Requirements tree from which you wish to generate tests.
Note: To be able to generate tests, the RMS plug-in needs to implement the RMTestProvider
interface, and the interface method isTestGenerationSupported needs to return true for the
type of the selected requirement.
Silk Central 15.5
| 79
3. Click Generate Tests. The Generate Tests dialog box displays.
4. Use SHIFT + CLICK or CTRL + CLICK to select the tests that you want to generate.
5. Click Generate All to generate all tests, or click Generate Selected to generate the selected tests. The
Tests tree displays.
6. Select the folder to which you want to add the generated tests.
Note: Tests that already exist in the selected destination folder are not created, but updated. No
tests in the folder are deleted.
7. Click OK.
Working with External Properties
This section explains how to work with external properties in Silk Central.
Editing External Properties
To edit external properties:
1. In the menu, click Requirements > Details View .
2. Select the requirement for which you intend to edit external properties.
3. Click the Properties tab. The Properties page displays the properties of the selected tree-element.
4. Click Edit External Properties.
The Edit External Properties dialog box displays. All properties of the external requirement are
displayed here. Edit all properties as required.
Note: Editable properties on this dialog box offer input fields and controls with which you can edit
the properties. If a mapping rule exists for an attribute, the attribute will be tagged with a trailing
asterisk (*).
5. Click OK to save your changes and close the dialog box.
Viewing External Properties
To view external properties:
1. In the menu, click Requirements > Details View .
2. Select the requirement.
3. Click the Properties tab. The Properties page displays the properties of the selected tree-element.
4. Click View External Properties. The View External Properties dialog box displays. All properties of
the external requirement are displayed here.
5. Close the dialog box.
Editing Property Mapping
The property-mapping functionality allows you to map property fields between Silk Central and external
requirements-management tools. For example, a custom requirement property in Silk Central called User
might be equivalent to a custom property in Caliber called User_ID. The property-mapping feature
ensures that requirement-property fields are accurately populated between projects during requirement
uploading and importing. If there are multiple requirement types, you must map each type separately.
Note: If you don't use the property mapping feature, only the name and the description of the
requirements are mapped.
To edit property mapping:
Note: The following applies for synchronizing properties with boolean values: since Silk Central does
not support the boolean data type, you need to create a single select list with the following two list
items:
80
| Silk Central 15.5
•
•
Name = Yes, Numeric Weight = 1
Name = No, Numeric Weight = 0
Note: When you map lists, requirement properties from both products need to have the same named
options for each list item, and they are case sensitive.
1. Select the project.
2. In the menu, click Project:<Project Name> > Project Settings .
Note: If you have not selected a project, a warning message opens, asking you to select a project.
Select the project for which you want to define the setting.
3. Click the Requirements Management tab.
4. Click Edit Property Mapping for the configured external tool. The Edit Property Mapping dialog box
opens.
5. Select an external requirement type from the Requirement types list. All custom requirements of that
type are then displayed below in the selection box.
6. Select the custom requirement property for which you are establishing mapping.
7. From the list box on the right, select the Silk Central custom property to establish mapping to the
external custom property you have selected.
8. Click Add Mapping to map the requirements. The results are displayed in the Custom property
mapping box.
9. The System property mapping box displays the two pre-configured mappings for requirement name
and description, which cannot be removed.
10.Click OK to save your changes.
Deleting Property-Mapping Value Pairs
To delete a property-mapping value pair:
1. Select the project.
2. In the menu, click Project:<Project Name> > Project Settings .
Note: If you have not selected a project, a warning message opens, asking you to select a project.
Select the project for which you want to define the setting.
3. Click the Requirements Management tab.
4. Click Edit Property Mapping for the configured external tool. The Edit Property Mapping dialog box
opens.
5. Select the property-mapping value pair in the Custom property mapping select box.
6. Click Remove Mapping.
7. Click OK to save your changes.
Disabling Requirements-Management Integration
To disable requirements-management integration configuration:
1. Select the project.
2. In the menu, click Project:<Project Name> > Project Settings .
Note: If you have not selected a project, a warning message opens, asking you to select a project.
Select the project for which you want to define the setting.
3. Click the Requirements Management tab.
4. Click the Disable Configuration button of the requirements-management tool for which you want to
disable integration.
All integration data and functionality is disabled, but not deleted from the project.
Silk Central 15.5
| 81
Removing Requirements-Management Integration
To remove requirements-management integration:
1. Select the project.
2. In the menu, click Project:<Project Name> > Project Settings .
Note: If you have not selected a project, a warning message opens, asking you to select a project.
Select the project for which you want to define the setting.
3. Click the Requirements Management tab.
4. Click Remove Configuration of the requirements-management tool for which you want to remove
integration.
This button is only enabled if the configuration is disabled.
The Remove External Association dialog box displays.
5. Click Yes.
All related data is removed from the database.
Tests
This section explains how to manage tests in Silk Central.
The Tests area enables you to maintain control over tests across the system development life-cycle. You
can create, schedule, and manage both automated tests and manual tests. You can upload and associate
files and links as attachments to test containers and tests. You can easily associate found issues with the
tests that led to their discovery. You can also track the full change history of the test in the area.
Tests Document View
Tests > Document View
The Document View provides a high-level view of the important information, the status, and the last
executions of all tests in the selected project.
For each test container, test folder, and test, the Document View displays the following columns:
Item
Description
Status
The status of the last test execution.
•
•
•
•
Passed
Failed
Not Executed
N/A
For test containers and folders, a status bar displays the number of tests with the
corresponding status.
82
Tests
Number of tests .
Planned Time
Roll up of Planned Time of the manual tests.
Assigned Issues
Number of Issues assigned to the test.
Last Execution
Time of the last execution of the selected test or project.
Last Build
Build on which the last execution was performed.
Changed On
Last time the selected test element was changed.
| Silk Central 15.5
Item
Description
Changed By
User that changed the selected test element for the last time.
Working with the Tests Tree
Tests > Details View
As with requirements, tests are displayed, organized, and maintained through a hierarchical tree structure,
the Tests tree. The Tests tree enables you to organize tests in any number of hierarchy levels. Each node
in the tree represents either a test, a test folder, or a test container.
In the Contents page you can view, cut, copy, and paste the child elements of any selected test element.
The page supports standard Windows Explorer style multi-select functionality.
Note: When the Tests tree includes more elements than can be displayed at once without impacting
response time, elements are displayed in increments. Page number links at the bottom of the tab
allow you to browse through the elements included on the tab one page at a time. To display all
elements as a single list, click the [All] link.
Expanding or Collapsing the Tests Tree
You can consolidate levels of the Tests tree or display all levels of the tree based on your viewing needs.
To collapse or expand levels of the Tests tree:
1. In the menu, click Tests > Details View .
2. Select the test container or test folder in the Tests tree and continue with one of the following options:
•
•
•
Click
to the left of the name of the test element to expand the element.
to the left of the name of the test element to collapse the element.
Click
Right-click on the element and select Expand or Collapse.
Cutting, Copying, Pasting, and Deleting Test Elements
The toolbar in the Tests area enables you to easily cut, copy, paste, and delete test elements within the
Tests tree, both within the current project and between projects. These editing functions simplify the
process of building and managing the tests of your project.
The data types that are copied along with tests and test folders are properties, attributes, parameters, and
attachments. Assignments, issues, runs, and history are not copied.
Tip: In the Contents page, you can view, cut, copy, and paste the child elements of any selected test
element. The page supports standard Windows Explorer style multi-select functionality. Before you
can paste a test element into the Contents page you must explicitly select an element within the
page to gain the application's focus.
Note: Containers cannot be copied or pasted.
To cut, copy, paste, or delete a test element:
1. In the menu, click Tests > Details View .
2. In the Tests tree, select the container, folder, or test that you wish to edit.
3. Click the appropriate toolbar button:
Button Description
Deletes the selected element from the tree.
Silk Central 15.5
| 83
Cuts the selected element from the tree and moves it to the clipboard.
Copies the selected element to the clipboard.
Pastes a copy of the element held on the clipboard to the same level of the currently selected
element.
Pastes a copy of the element held on the clipboard as a sub-node of the currently selected
element.
Note: The commands are also available through the context menu in the Tests tree.
Copying and Pasting a Test Element from One Project to Another
To copy and paste a test folder or test between projects:
1. In the menu, click Projects > Project List.
2. Select the source project.
3. In the menu, click Tests > Details View .
4. Click
to cut or
to copy the element to the clipboard.
5. In the menu, click Projects > Project List.
6. Select the destination project.
7. Select the destination container and folder.
8. Click
.
Note: The commands are also available through the context menu in the Tests tree.
Reordering Test Elements
To reorder a test, test folder, or test container:
1. In the menu, click Tests > Details View .
2. In the Tests tree, select the test element that you wish to reorder.
3. Click
to move the test element up one step or click
to move the test element down one step.
Setting a Test Node as Integration Default for External Agile Planning
Tools
To use the Web service calls to create tests in Silk Central through an external agile planning tool, set a
folder or container in the Tests tree as the integration default node, where the Web service will create the
test. If you do not specify the integration default node, an error message box displays.
To specify the integration default node in the Tests tree:
1. In the menu, click Tests > Details View .
2. In the Tests tree, select the folder or container which you want to set as the integration default node.
3. Right-click the folder or container and select Set as Integration Default.
Note: If an integration default node already exists, the default node is changed to the new node.
4. The integration default node is set to the selected node, enabling the agile planning tool to create tests
at this location.
Note: The integration default node is shown in the Properties page of the project, in which the
node is located.
84
| Silk Central 15.5
The integration default node is set to the selected node, enabling the agile planning tool to create tests at
this location.
Note: The integration default node is shown in the Properties page of the project, in which the node
is located.
Filtering on a Folder or Container
To filter on a folder or container:
1. In the menu, click Tests > Details View .
2. Right-click the folder or container in the tree that you want to filter and select Filter Subtree. The tree
displays only the contents of the selected folder or container and the hierarchy up to the root node of
the tree.
Note: To remove filtering and display all elements, select <No Filter> from the Filter list box on the
toolbar. Empty folders are not shown in the filtered sub-tree.
Test Properties Page
Tests > Details View > Properties
The Properties page offers detail on all properties and relevant information for the selected test, test
folder, test package, or test container. For test nodes, the following properties are configured when tests
are created:
Property
Description
Test Name
Name of the test.
Test ID
Database identifier of the test.
Description
Description of the test.
Note: Silk Central supports HTML formatting and
cutting and pasting of HTML content for
Description text boxes.
Status
For tests or test packages that are included in a
configuration suite, the status is an aggregation of all
statuses of all configurations within the suite:
•
If the test is assigned only to the configuration suite,
the status is Passed only if it is passed in all
configurations. If the status is not Passed in all
configurations, the status of the worst run is
propagated, with the following top-down priority:
1.
2.
3.
4.
•
N/A
Not Executed
Failed
Passed
The status of a requirement that is assigned to the
test is Failed if the test fails in one or more of the
configurations.
We do not recommend assigning the test to a
configuration suite and one or more simple execution
plans. However, in this case, the aggregate of the
configuration statuses is one status, and the last
Silk Central 15.5
| 85
Property
Description
•
86
statuses of the execution plans are other statuses.
The status that was executed last determines the last
status of the test.
If the test is assigned to a simple execution plan only,
the status is updated in response to the status of the
last test run.
Last Execution
Last time this test was executed. For tests that are part of
a running execution plan, the last execution is updated
based on the current test run.
Assigned Executions
Lists all execution plans that the selected test is assigned
to. For each execution plan in the list, the grid displays
the following columns:
Column
Description
Execution
Name of the execution plan. Click to
view or edit the execution plan.
Status
The status of the last run of the test in
the execution plan. The status is Not
Executed, if the test was not
executed in the last run of the execution
plan. For data-driven tests or test
packages, the status of all last runs is
displayed in a bar graph.
Last
Execution
Last time the test was executed as part
of the execution plan.
Execution
Plan Parent
The configuration suite, folder, or
testing cycle in the context of which the
execution plan is executed. Click to
access the suite or folder in the
Execution Plans tree. If the execution
plan is not included in a configuration
suite or folder, nothing is displayed.
Created On
Date and time the test was created.
Created By
Name of the user who created the test.
Changed On
Date and time the test was last changed.
Changed By
Name of the user who last changed the test.
Planned Time [hh:mm]
Planned execution time of the test. Only for manual tests.
Test Properties
Test properties that are specific to the test type.
Success Conditions
All success conditions that have been configured for the
test. For test package nodes, all success conditions
except the execution time-out are disabled and hidden.
Integration Default Folder
Shows the name of the default container or folder, where
tests from external RMSs are created.
| Silk Central 15.5
Test Contents Page
Tests > Details View > Contents
The Contents page displays the child elements of the selected project, test container, or folder in the
Tests tree. The page supports Standard Windows Explorer style multi-select functionality.
Tip: To drill down into the selected folder or container, press Enter or double-click the selected item.
Press Backspace or click
on the toolbar to navigate one level up.
Note: You cannot copy or paste a test container.
For each child element of the selected project, test container, or folder, the Contents page displays the
following columns:
Column
Description
Name
Name of the test element.
Changed On
Date the test element was last edited.
Changed By
User who last edited the test element.
Tip: As with test elements listed in the Tests tree, you can right-click the elements listed on the
Contents page to access context-relevant commands through a context menu. Commands that are
not available are grayed out. Before you can paste a test element into the Contents page you must
explicitly select an element within the page to gain the application's focus.
Note: When the Contents page includes more elements than can be displayed at once without
impacting response time, elements are displayed in increments. Page number links at the bottom of
the page allow you to browse through the elements included on the page one page at a time. To
display all elements as a single list, click the [All] link.
The Contents page supports the following keyboard functions (shortcuts) for test elements:
Key
Normal
SHIFT
CTRL
Up
Move selection up
Extend selection up
Move up
Down
Move selection down
Extend selection down.
Move down
Left
Deselect
Right
Deselect
A
Select All
X
Cut
C
Copy
V
Paste
Pos1
Select first item
Select up to first item
End
Select last item
Select down to last item
Del
Delete
F2
Edit
Keyboard Functions for Test Elements
The following mouse and keyboard combination functions are available. Following these functions, actions
like cut, copy, or paste can be performed on the selected nodes:
Silk Central 15.5
| 87
Keyboard
Function
Description
Click
Select a row and remember it as the current row.
Ctrl+Click
Toggle the selection status of the clicked row and remember it as the current row.
Shift+Click
Select the span from the currently-selected row to a newly selected row.
Ctrl+Shift+Click
When a row is already selected, this function adds the span from the current row to
the clicked row to the selection. If no row is currently selected, this function removes
the span from the current row to the clicked row from the selection and selects the
clicked row.
Note: Containers cannot be copied or pasted.
Test Toolbar Functions
Tests > Details View
The test toolbar provides important commands for managing your tests.
Note: The commands in the test toolbar are also available through context menus in the Tests tree.
The following commands are included in the test toolbar:
Command
88
Icon
Description
Document View
Displays the Document View, which shows selected properties of all test
elements in a single view.
Details View
Displays the Details View, which enables you to drill deeply into the
properties of a single test.
Grid View
Displays the Grid View, which shows all tests in a grid.
Up
Navigates one level up in the hierarchy of the navigation tree, regardless of
the current cursor focus.
New Test Container
Enables creation of new test containers.
New Child Test
Folder
Enables creation of new test folders as sub-nodes of the selected folder or
container.
New Child Test
Enables creation of new tests as sub-nodes of the selected folder or
container.
Edit
Edit the selected test element.
Create Version
Create a new version of the selected manual test.
Delete
Delete the selected test element.
Cut
Cut a test element from the Tests tree and save it to the clipboard.
Copy
Copy a test element from the Tests tree to the clipboard.
Paste
Paste a test element from the clipboard to the Tests tree.
Paste as Child
Paste a test element from the clipboard as a child element to the currently
selected test element.
| Silk Central 15.5
Command
Icon
Description
Move Up
Move a test element up within the Tests tree.
Move Down
Move a test element down within the Tests tree.
Find
Search through all test elements in the active project based on
configurable parameters.
Replace
Replace instances of found values with a new value.
New Filter
Create a new custom filter for the Tests tree.
Filters
Lists the available filters for the Tests tree
Edit Filter
Edit the currently selected custom filter.
Delete Filter
Delete the currently selected custom filter.
Copy Filter
Copy the currently selected custom filter.
Show Changes
Show recent changes to the tests.
Acknowledge
Acknowledge changes to the tests.
Download as XLSX
This function is enabled in the Document View and Grid View. In the
Document View, the action generates an Excel sheet that includes all
currently visible rows. In the Grid View, the action generates an Excel
sheet that includes all rows, not just the visible ones.
Test Reports
This section explains the test-related reports that ship with Silk Central. Test reports give you an overview
of the progress of your tests and the status of defects over a period of time or over a range of builds.
Status Reports
The following status reports are available for the Tests area:
Report
Description
Test Status Overview
Represents a status overview of all tests, structured by the statuses
Passed, Failed, Not Executed, and N/A.
Test Status Overview (per
test container)
Represents a status overview of all tests contained in a specific test
container, structured by the statuses Passed, Failed, Not Executed,
and N/A.
Tests per Component
Represents an overview of coverage of components by test; makes it
easier to see where testing activity is needed.
Tests (per test container)
Represents a success rate for each test container by listing the number of
passed tests.
Implemented Tests (per
component)
Represents an overview of coverage of components by tests that have the
Implemented attribute set to Yes.
Failed Tests (per
component)
Represents an overview of failed tests per component; makes it easier to
identify the most critical components in the environment.
Silk Central 15.5
| 89
Progress Reports
The following progress reports are available for the Tests area:
Report
Description
Test Progress Across Builds
'X' and 'Y'
Represents a trend in test progress resulting from viewing test statuses
in context with builds. The user must specify a build range consisting of
a start- and an end-build.
Manual Test Coverage since
Build <x> (cumulative)
Represents a trend in manual test progress, excluding all kind of
automated tests, resulting from viewing test statuses in context with
builds. The user must specify a starting build number which is used as
basis for calculating a cumulative progress.
Automated Test Coverage for Represents the automated test coverage resulting from viewing test
statuses in context with builds. The user must specify a version and a
Builds (non-cumulative)
product and the report shows the test coverage that could be achieved
with the automated tests per build.
Test Progress this Month
Represents a trend in test progress resulting from viewing test statuses
for the current month.
Specific Test Node Progress
Over the Past 'X' Days
Represents a trend in requirements coverage by considering a specific
test node over the past 'X' days.
Tests Created in the Past 'X'
Days (per component)
Represents a listing of new tests per component over the past 'X' days.
Assists in identifying components that lack testing activity.
Test Progress Over the Past
'X' Days
Represents a trend in test progress by considering test statuses over
the past 'X' days.
Percentage Testing Success
Over the Past 'X' Days (per
component)
Represents a percentage listing of successful tests per component over
the past 'X' days; assists in identifying the components in the
environment that are most critical.
Manual Test Reports
The following manual-test reports are available for the Tests area:
Report
Description
Planned vs. Actual
Execution Time of Manual
Tests (Summary)
Represents an overview of the deviation between planned and actual time
for execution of manual tests, viewed on a daily basis.
Historic Planned vs. Actual Represents an overview of planned and actually required execution time
for completed manual tests per user over a specific period of time.
Execution Time (per user)
Planned vs. Actual
Execution Time (status per
user)
Represents progress in terms of planned vs. actual hours of currently
pending manual tests per user. Manual tests are only considered if test
results have been entered by the user and are assigned to the user who
enters the results.
Manual Test Result
Document
An easily printable manual test case report for the latest results of all tests
assigned to the specified execution plan.
An easily printable manual test case report for the latest results of all tests
Manual Test Result
Document (Microsoft Word) assigned to the specified execution plan in a Microsoft Word document.
Manual Test Results by
Execution Plan
90
| Silk Central 15.5
An easily printable manual test case report for the latest results of all tests
assigned to the specified execution plan folder or testing cycle.
Baseline Comparison Report
Reports > Details View > <Active Project> > Test > Baseline Comparison > Baseline Comparison
The Baseline Comparison report compares a baselined project with the baseline and displays the number
of changed, deleted, and created tests.
Input Parameters
The input parameters for the Baseline Comparison report are the identifiers of the project and the baseline.
General Report Information
This section provides a description of the report and the name of the user who executed the report.
Project and Baseline Information
This section provides the information on the project and the baseline, including data related to the creation
of the baseline.
Project and Baseline Summary
This section provides a sum of the created, changed, and deleted tests in the baseline and the project, in
both tabular and graphical form.
Changes
This section provides a detailed list of all changed tests in the project and the baseline, with links to the
tests.
Test Run Comparison Report
Test run-comparison reports present an overview of the comparison between two runs of a test.
Note: Run-comparison reports are not suitable for the comparison of manual tests to automated
tests. When the name of the report includes (Last Two Runs), you can compare only the last two runs
of the execution plan or test.
The test run comparison report provides the following information:
•
•
•
•
•
•
•
•
Changes to the status of the test
Number of errors
Number of warnings
Context in which the test was executed
Execution duration of the assigned tests
Attributes and properties of the test
Parameters of the test
Success conditions for the test
General Report Information
This section provides the following general information about the report:
Element
Description
Project Name
Name of the active project.
Report Description
Description of the report.
Silk Central 15.5
| 91
Element
Description
Report Executed By
User who executed the report.
Test Information
This section provides the following information about the test:
Element
Description
ID
Identifier of the test.
Name
Name of the test.
Description
Description of the test.
Execution Information
This section provides the following information about each execution:
Element
Description
Execution ID
ID of each execution plan.
Execution Name
Name of each execution plan.
Run ID
ID of each execution plan run.
Product
Name of the product.
Version
Version of the product.
Build
Build of the product.
Test Run Comparison
This section identifies the following differences between the two runs:
Element
Description
Status
Status of each run.
Execution Timestamp
Timestamp of each run.
Duration
Duration of each run.
Errors
Number of errors in each test run.
Warnings
Number of warnings in each test run.
Previous Status
Status of each run previous to the last manual change.
Changed by
User who performed the last manual change to the status.
Change Comment
Describes the reason of the manual status change.
Attributes and Properties
This section identifies the attributes and properties of the two runs of the test at execution time.
Parameters
This section lists the parameters of the two runs of the test at execution time.
92
| Silk Central 15.5
Success Conditions
This section lists the conditions at execution time for each of the two runs to be considered successful. If a
condition is not satisfied, the test run is considered unsuccessful. Satisfied conditions are marked green,
while unsatisfied conditions are marked red.
Success Conditions
Use success conditions to determine whether a test is successful or not. You can assign one or more
success conditions to each test node or suite node in the Tests area. If a success condition is not met
during the execution of the test it is assigned to, the execution run is marked as Failed, except for the
execution time-out success condition, for which the test execution is marked as Not Executed. For a test
package, all success conditions except the execution time-out are disabled and hidden.
In Details View, when you select a node in the Tests tree, the Success Conditions table in the
Properties page of the node displays all success conditions that are configured for the selected node. The
table includes the name of each condition, whether or not the condition is active, the maximal value of the
condition, and whether or not the condition is inherited.
A success condition is only evaluated when it is active. To activate and deactivate success conditions see
Editing Success Conditions. The available types of success conditions differ depending on the test type.
The following success conditions are currently available in Silk Central:
Success Condition
Description
Errors Allowed
Maximal number of errors allowed for the test. This success
condition is active by default.
Warnings Allowed
Maximal number of warnings allowed for the test.
Execution Time-Out [s]
Maximal time-out allowed for the test in seconds.
Page Time: Avg. Page Time [s]
Maximal allowed average time to load a page.
Page Time: Max. Page Time [s]
Maximal allowed maximum time to load a page.
Transaction Response Time: Avg.
Trans(Busy)ok [s]
Maximal allowed average response time for a transaction in
the test.
Transaction Response Time: Max.
Trans(Busy)ok [s]
Maximal allowed maximum response time for a transaction in
the test.
The inheritance of success conditions is similar to inheritance of properties. Success conditions that are
assigned to a parent node are inherited throughout all sub-folders and child tests.
Editing Success Conditions
In Details View, when you select a node in the Tests tree, the Properties page of the node displays the
success conditions that are associated with the node. The Success Conditions table includes the name
of each condition, whether or not the condition is active, the maximal value of the condition, and whether or
not the condition is inherited.
Note: For test package nodes, all success conditions except the execution time-out are disabled and
hidden.
To edit the success conditions of a test:
1. In the menu, click Tests > Details View .
2. In the Tests tree, select a test container, test folder, or test.
3. Click the Properties tab. The Properties page displays the properties of the selected tree-element.
4. Click
to the right of the Success Conditions. The Edit Success Conditions dialog box displays.
Silk Central 15.5
| 93
5. Uncheck the Inherit from parent check box of any success condition you are editing.
6. Edit values as required.
7. Specify if conditions should be active or inactive by checking or un-checking their Active check boxes.
8. Click OK to save your settings.
Test Containers
This section describes how to use test containers.
Adding Test Containers
Note: We recommend to use test containers with caution, because they bind the product to the
source control profile.
To add a new test container:
1. In the menu, click Tests > Details View .
2. In the Tests tree, select the root node to which you want to add the new container as a sub-node.
Note: Containers cannot be nested, but you can add sub-folders to containers.
3. Click
on the toolbar or right-click on the node and choose New Test Container.
You can also right-click on the node and choose New Test Container.
A new container root node is added to the Tests tree and the New Test Container dialog box displays.
4. Type a Name and Description for the container.
Note: Silk Central supports HTML formatting and cutting and pasting of HTML content for
Description text boxes.
5. Select any pre-defined Product that is to be associated with this test container from the list box. For
details on adding a product profile, see the Administration topics in this Help.
6. Select a pre-defined source-control profile from the Source Control profile list box.
If you do not intent to check out any test sources for the test container, for example if you only have
manual tests, select ---.
Note: The Silk Central execution servers retrieve the program sources for the tests included in the
container from the defined source-control profile. The root node of the source control profile is set
in the root node of the test container.
7. Optional: Check the Clear working folder before each test execution check box.
If you check the check box, the source control profile working folder is cleared before a test execution is
performed. For example, the sources will be checked out before each execution. This check box is
unchecked by default.
8. To specify the default root path where the container is to be saved, click Browse... and navigate to the
location.
9. Optional: When Silk Central is integrated with Silk Performer® 7.1 or higher, you can define the Custom
data directory and Custom include directory.
In Silk Performer, the Include directory is divided into a System Include directory and a Custom
Include directory. The Data directory is divided into a System Data directory and a Custom Data
directory. For additional information, refer to the Silk Performer documentation.
10.The Hidden Test Properties portion of the dialog box allows you to specify the test property types that
are to be displayed on the test container’s Properties page, and the Properties pages of all test folders
within the container.
These settings do not affect the display of individual tests.
11.Click Edit to adjust the hidden test property settings. The Hidden Test Properties dialog box displays.
94
| Silk Central 15.5
12.Uncheck the check boxes of all test types for which you want to have properties displayed.
13.Click OK to save your settings and close the Hidden Test Properties dialog box.
14.Click Save to save your settings.
The new container is added to the Tests tree.
Adding Links to Containers
In the Tests tree, you can add a link to a test container in the same project. Linked test containers are
displayed in read-only mode at the position in the tree where the link is inserted.
To add a link to a test container:
1. In the menu, click Tests > Details View .
2. Right-click the node in the Tests tree under which you want the linked test container to display.
3. Choose New Link if you want to link the test container at the hierarchy level of the selected node, or
choose New Child Link to link the test container one level below the selected node. The Select Test
Container For Linking dialog box displays.
4. Select the test container that you want to reference.
Note: If the referenced test container and the container in which you add the link use different
source-control profiles, a confirmation dialog box displays, asking you if you really want to create
the link. Linking inside a test container to another test container with a different source-control
profile can lead to problems when you download or execute a test within the linked container. Click
No if you want to change the custom include directory of one of the containers first, or click Yes to
create the link anyway.
5. Click OK to confirm your selection.
The linked container is placed within the selected container as a read-only entity. Any changes to the
original test container will be reflected in the linked container.
Editing Test Containers
To edit the properties of a test container:
1. In the menu, click Tests > Details View .
2. In the Tests tree, select the test container that you want to edit.
3.
Click
in the toolbar.
You can also right-click on the test container and select Edit.
The Edit Test Container dialog box displays.
4. Edit the properties of the test container.
5. Click OK to apply your changes.
Test Folders
This section describes how you can use test folders to organize your tests.
Adding Test Folders
To add a new test folder:
1. In the menu, click Tests > Details View .
2. In the Tests tree, select the test element after which you want to add the new folder.
3. Click
on the toolbar.
Silk Central 15.5
| 95
You can also right-click on the element and choose New Test Folder to add the new folder after the
selected element or choose New Child Test Folder as a sub-node to the selected element.
Note: For test containers you can add test folders only as sub-nodes.
A new folder node is appended to the Tests tree and the New Folder dialog box displays.
4. Provide a name and description for the folder.
Note: Silk Central supports HTML formatting and cutting and pasting of HTML content for
Description text boxes.
5. Click OK to save your settings.
The new folder is added to the Tests tree.
Editing Test Folders
To modify test folder properties:
1. In the menu, click Tests > Details View .
2. Select the folder in the tree.
3.
Click
in the toolbar.
You can also right-click on the test folder and select Edit.
The Edit Test Folder dialog box displays.
4. Edit the name and description of the folder as required.
5. Click OK to accept your changes.
Sorting Test Folders
To move a folder up or down within the Tests tree:
1. In the menu, click Tests > Details View .
2. Select the folder in the tree.
3. Click
down.
on the toolbar to move the folder one step up in the tree or
to move the folder one step
Test Packages
Test packages provide support for the structure of third-party test types in Silk Central, and consist of a
package root as well as an arbitrary hierarchy of suite nodes and test nodes. Test packages also provide
users with detailed information about a test execution run. Test packages, suite nodes, and test nodes can
be individually assigned, along with their issues and attachments, to requirements. This functionality is
similar to the functionality of every other test. After a third-party test is converted into a test package, all
tests contained in the package can be run individually. Test nodes and suite nodes contained in a test
package are provided with an additional property, the External ID.
An advantage of test packages is that the structure can be maintained automatically with every test
execution. The structure of a test package can be updated according to the results of its runs. The file
<Silk Central installation folder>\wwwroot\silkroot\xsl\output.xsd contains an XML
schema for the structure of the output XML files of test packages.
Test packages enable the entire functionality of the individual tests, with the following exceptions:
•
•
•
96
| Silk Central 15.5
Test containers that contain test packages cannot be linked.
Test packages cannot be data-driven because they do not possess data-driven properties.
All success conditions except the execution time-out are disabled and hidden for test package nodes.
Note: Silk Performer tests, Silk Test Classic tests, and manual tests cannot be converted to test
packages, as the structure of these tests is supported in Silk Central by default.
The information that provides the internal structure of a test package is specific, and is no longer consistent
when you copy the test package. To reuse a test package, you have to copy the test package, revert the
copied package into the parent test, apply the test to your needs, and then convert the changed test to a
test package.
Creating a Test Package
To create a new test package out of a third-party test:
1. Run the test once to create the output.xml file, which contains the structure of the test package.
For additional information on executing a test, see Executing Individual Tests.
2. In the menu, click Tests > Details View .
3. In the Tests tree, right-click the test and choose Convert to Test Package. The selected test is
converted to a hierarchy representing the structure of the last execution result.
Using External IDs
You can use External IDs to uniquely identify test nodes and suite nodes in test packages. An External ID
is provided as a property for each test node and each suite node. The automatically generated External ID
identifies a unique test method by the fully qualified name of the class and the method with an "~"
prepended.
For JUnit tests, the following schema is used for the automatically generated External ID: ~<package
name>.<class name>#<method name>.
When refactoring JUnit test classes, the automatic generation of the External ID is not applicable, because
the result information of tests previous to the refactoring will be lost when creating a new test. In this case
the External ID for the test must be manually defined. The refactored method is re-identifiable, because
the External ID remains unchanged while moving a JUnit test or changing its name. The External ID can
be manually set in the source code as an annotation.
The following code example shows such an annotation for JUnit tests:
import java.lang.annotation.Retention;
import java.lang.annotation.RetentionPolicy;
@Retention(RetentionPolicy.RUNTIME)
public @interface ExternalId {
String externalId();
}
The annotation can be used in a JUnit test to annotate classes and test methods as shown:
import static org.junit.Assert.*;
import org.junit.Test;
import com.borland.runner.ExternalId;
@ExternalId(externalId="JUnit4test")
public class JUnit4test {
@Test
@ExternalId(externalId="MyExtId1")
public void test1() {
...
}
@Test
@ExternalId(externalId="MyExtId2")
public void test2() {
Silk Central 15.5
| 97
...
}
}
Be aware that using External IDs with JUnit runner 'org.junit.runners.Parameterized' is not supported for
test methods, because the External ID is not unique for repeated runs of a method with different
parameters. As a work around an External ID could be specified on class level, but must be omitted on
method level. An example follows:
@RunWith(Parameterized.class)
@ExternalId(externalId="parameterizedWithExtId")
public class TestCaseParameterizedWithExternalId {
@Parameters
public static Collection<Object[]> parameterFeeder() {
return Arrays.asList(new Object[][] {
{ "param_name1", "param_value1" }, // set of parameters per run, type
matching constructor must exist!
{ "param_name3", "param_value3" },
{ "param_name2", "param_value2" },
}
);
}
private String paramName;
private String paramValue;
public TestCaseParameterizedWithExternalId(String paramName, String
paramValue) {
this.paramName = paramName;
this.paramValue = paramValue;
}
@Test
public void testWithParams() {
System.out.println(String.format("run with parameter: name='%s',
value='%s'", paramName, paramValue));
}
}
Note: The setting of the External ID for a JUnit test is only possible for tests using JUnit 4.4 or
higher.
Reusing a Test Package
The information that provides the internal structure of a test package is specific, and is no longer consistent
when you copy the test package. To reuse a test package, you have to copy the test package, revert the
copied package into the parent test, apply the test to your needs, and then convert the changed test to a
test package.
To reuse the information in a test package:
1.
2.
3.
4.
In the menu, click Tests > Details View .
Right-click the test package that you want to reuse in the Tests tree and select Copy.
Select the node in the Tests tree to which you want to add the copied test package.
Right-click the selected node and select Paste, to add the copied package to the same level in the tree,
or select Paste as Child to add the copied test package as a sub-node to the selected node.
Caution: The information now contained in the copied test package is not consistent.
5. Right-click the copied package and select Revert Package to Test. The package information is
removed from the parent test.
98
| Silk Central 15.5
6. Edit the test to apply it to your needs.
For additional information, see Editing Tests.
7. Right-click on the edited test and select Convert to Test Package.
You now have a copy of the original test package with different properties.
Reverting a Test Package to the Test
Revert a test package to the original test to create a different test package out of the parent node.
Note: Reverting a test package to a test hides run result information at the test level. However, you
can still see this information in the timeline view or a result file.
To revert a test package to the original test:
1. In the menu, click Tests > Details View .
2. Right-click the test package in the Tests tree.
3. Click Revert Package to Test.
The test package is reverted to the original test.
Cleaning Up a Test Package
To clean up a test package:
1. In the menu, click Tests > Details View .
2. Right-click the test package in the Tests tree.
3. Click Clean Up Test Package.
All tests that were not executed during the last execution of the test package are removed from the test
package.
Test History
Silk Central provides a complete history of all changes that are made to tests. History information is readonly, and cannot be edited or permanently deleted.
The Recent Changes filter, which you can access by clicking
on the toolbar, enables you to efficiently
view and acknowledge the latest changes and additions that have been made to tests.
Note: When you delete a test element, a change entry is added to the history file of the project to
which the test element belongs.
Viewing Recent Changes
To view recent changes to tests:
1. In the menu, click Tests > Details View .
2. Click
to filter out all test elements except those that have been changed since your last change
acknowledgement.
Note: The recent changes filter is selected automatically in the Filter list box.
3. When you have reviewed the changes, you can accept them by clicking
The acknowledge function resets the recent changes filter.
4. Click
.
again to remove filtering and see all tests.
Silk Central 15.5
| 99
Note: All test changes generate time-stamped entries in the test history.
Tracking the History of a Test
To track a test element’s history:
1. In the menu, click Tests > Details View .
2. Select the test in the Tests tree.
3. Click the History tab.
The properties of the test are displayed in tabular format.
Test History Page
Tests > Details View > <Test Element> > History
The History page details the revision history of the selected test, test container, folder, or project. It also
includes an entry for every project baseline that includes the selected element, with links to the baseline
and the corresponding element in the baseline. If the selected element was created as part of a project
baseline, the first entry in the History page includes links to the original project and the corresponding
element in the original project. You can use the links only to access active projects or baselines. For more
information on project baselines, see the Administration topics in this Help.
For manual tests, the History page additionally includes an entry for each version of the selected manual
test, and allows you to create new versions, revert to a previous version, and view the changes between
two selected versions.
For each change, the page displays the following columns:
Column
Description
Actions
Only for version entries. For a version of a manual test,
the actions you can perform are View Version, Revert to
Version and Delete Version.
Version
Only for version entries. The version of the manual test.
Comment
A comment on the changes.
Created On
Date and time of the change.
Created By
User that made the change.
Note: When the page includes more elements than can be displayed at once without impacting
response time, elements are displayed in increments. Page number links at the bottom of the page
allow you to browse through the elements included on the page one page at a time. To display all
elements as a single list, click the [All] link.
Tests
This section describes how to manage tests in Silk Central.
Creating Tests
To create a new test:
1. In the menu, click Tests > Details View .
2. Select a container or folder node in the Tests tree where you want to insert a new test.
3. Click
(New Child Test) on the toolbar or right-click within the tree and choose New Child Test.
A new test node is appended to the tree view, and the New Test dialog box appears.
100
| Silk Central 15.5
4. Type a name and description for the test.
Note: Silk Central supports HTML formatting and cutting and pasting of HTML content for
Description text boxes.
5. Select the test type from the Type list.
6. Click Next and proceed to the appropriate topic for the selected test type in Configuring Test Properties.
Note: The well-defined public API of Silk Central enables you to implement a proprietary solution that
meets your automated test needs. Silk Central is open and extensible to any external tool that can be
invoked from a Java implementation or through a command-line call.
Note: Throughout the test configuration process and across all test types, Inherit from parent check
box options are provided where applicable, enabling you to accept settings of any existing parent
entity.
Editing Tests
To edit a test:
1. In the menu, click Tests > Details View .
2. Select the test or the test package that you want to edit.
3.
Click
(Edit) on the toolbar.
You can also click the Properties tab and click Edit or right-click the test or test package and select
Edit.
The Edit Test dialog box appears.
Note: Silk Central supports HTML formatting and cutting and pasting of HTML content for
Description text boxes.
4. Edit the name and description of the selected test.
If the selected test is a test package, the Update Package Structure on Result check box is available.
Check the Update Package Structure on Result check box if you want to update the structure of the
test package according to the results of the test execution run.
5. Configure the properties of the test or the test package according to the test type as described in
Configuring Test Properties.
Executing a Trial Run of a Test
You can perform a trial run of a test to check if the test works as intended.
To perform a trial run of a test:
1. In the menu, click Tests > Details View .
2. Right-click the test that you want to try out in the Tests tree.
3. Select Try Run Test.
4. The Go To Activities dialog box displays. Click Yes if you want to analyze the results on the Activities
page, or click No if you want to remain on the current Web page.
For additional information, see Activities.
Note: Check the Don't show this dialog again (during this login session) check box if you
don’t want to be asked about switching to the Activities page again in the future. This setting will
be discarded when you log out of Silk Central.
Configuring Test Properties
This section describes how to configure the test properties for each available test type.
Silk Central 15.5
| 101
Finding Test Properties
The Find command in the Tests area enables you to locate test property values that meet specified search
criteria. Use the Next, Previous, First, and Last functions to step through the results of a search for a
specified property value. Find is enabled across all Silk Central plug-ins and functional categories.
Note: Data-driven test property values can be found using the Find command.
Note: When the Tests tree is constrained by a filter, Find is only executed against those tests that
are presented in the Tests tree after filtering.
To find a specific test property value:
1. In the menu, click Tests > Details View .
2. Click
on the toolbar. The Find dialog box opens.
3. From the Category list box, select the functional category or Silk Central plug-in across which you want
to search.
Tip: When you define a custom plug-in property, it is automatically added to the list.
4. From the Find in list box, select the property within which the query should search for the value.
The properties available in this list vary based on the selected category.
5. In the Find what text box, type the alphanumeric string the query should search for.
Optional settings are available for qualifying the query further. Check the check boxes of those that are
appropriate:
6. Choose the location in the Tests tree where the search should begin.
The following options are available:
Option Button
Description
Start from selection Specifies that the search begins from the currently selected test element.
Start from top
Specifies that the search begins from the root of the Tests tree.
Find in subtree only Specifies that the search runs only in the sub-tree which has the currently
selected element of the Tests tree as its root node.
7. Check the appropriate check boxes to further qualify the query.
The following check boxes are available:
Check Box
Description
Case sensitive
Specifies that the string is searched case-sensitively.
Note: When using a case sensitive SQL Server, case-insensitive
searching is not supported for the following fields:
•
•
•
•
Match whole
word only
Test description
Manual step description
Manual step action description
Manual step expected results
Specifies that search results only include complete standalone instances of the
query string.
Include read-only Specifies that search results include text strings that cannot be directly edited
because they are inherited from another test, referenced from a linked test
values
container, or called from a data source in the course of data-driven testing.
8. Click Find to begin the search and advance to the first test container, test folder, or test returned by the
query.
102
| Silk Central 15.5
9. If your query returns multiple test elements, you are presented with options to advance through the
elements.
Note: The Find command allows you to search test elements where the search string is an
inherited value.
Replacing Test Properties
The Replace command enables you to replace identified property values with new values. Replace is
enabled across all Silk Central plug-ins and functional categories.
Note: Data-driven test property values cannot be replaced using the Replace command.
Note: When the Tests tree is constrained by a filter, Replace is only executed against those tests
that are presented in the Tests tree after filtering.
To replace an identified test property value:
1. In the menu, click Tests > Details View .
2. Click
on the toolbar.
The Replace dialog box opens.
3. From the Category list box, select the functional category or Silk Central plug-in across which you want
to search.
Tip: When you define a custom plug-in property, it is automatically added to the list.
4. From the Find in list box, select the property within which the query should search for the value.
The properties available in this list vary based on the selected category.
5. In the Find what text box, type the alphanumeric string the query should search for.
Optional settings are available for qualifying the query further. Check the check boxes of those that are
appropriate:
6. In the Replace with text box, type the alphanumeric string with which you want to replace the found
values.
7. Click Find to begin the search and advance to the first test container, test folder, or test returned by the
query. Or click Replace all to replace all instances of the queried string with the replacement string.
8. If your query returns multiple test elements, you are presented with options to advance through the
elements.
Note: The Replace command does not allow you to search test elements where the search string
is an inherited value.
Configuring Silk Test Classic Plan Test Properties
To configure the properties of a test, you must first follow the steps described in Creating Tests or Editing
Tests.
To configure the properties of a Silk Test Classic plan test:
1. On the New Test dialog box, select Silk Test Classic Plan from the Type list box and then click Next.
The Plan Properties dialog box opens.
2. In the Plan file text box, type the fully qualified name of the test plan file to be executed.
Click Browse to browse for the file.
3. In the Silk Test Classic project file text box, type the name of the Silk Test Classic project containing
the file and environmental settings.
Click Browse to browse for the project file.
Silk Central 15.5
| 103
4. In the Option set text box, type the fully qualified name of the option set file containing environmental
settings.
Click Browse to browse for the option set file.
5. In the Data file for attributes and queries text box, type the default path of the test plan initialization
file.
Click Browse to browse for the test plan initialization file.
6. In the Test plan query name text box, type the fully qualified name of the saved test plan query.
7. Click Finish.
Configuring TestPartner Test Properties
To configure the properties of a test, you must first follow the steps described in Creating Tests or Editing
Tests.
To configure TestPartner test properties:
1. On the New Test dialog box, select TestPartner Test from the Type list box.
2. Click Next. The Test Properties - Select Test Script dialog box opens.
3. Click Browse.
The Choose File dialog box opens. The assets available in this dialog box are based on the Project
Path defined in the associated TestPartner source control profile.
4. Select a script from the list and click OK.
Note: To add multiple TestPartner tests, see Adding Multiple TestPartner Tests.
5. In the Playback Options text box, type in the name of a predefined TestPartner playback option or
leave the default value of System Defaults.
6. Click Finish.
Adding Multiple TestPartner Tests
To add multiple TestPartner tests, you must first follow the steps described in Creating Tests.
To add multiple TestPartner tests:
1. On the New Test dialog box, select TestPartner Test from the Type list box.
2. Click Next. The Test Properties - Select Test Script dialog box opens.
3. Click Browse.
The Choose File dialog box opens. The assets available in this dialog box are based on the Project
Path defined in the associated TestPartner source control profile.
4. In the Playback Options text box, type in the name of a predefined TestPartner playback option or
leave the default value of System Defaults.
Note: The import gives the defined playback option to all imported scripts. If you need to change
the playback option for any scripts, edit the test after the import.
5. Click Next.
The Test Properties - Select Scripts dialog box opens.
6. In the TestPartner Scripts text box, select the scripts to import by clicking CTRL + Click.
7. Click Finish.
Configuring .Net Explorer Test Properties
To configure the properties of a test, you must first follow the steps described in Creating Tests or Editing
Tests.
104
| Silk Central 15.5
To configure .NET Explorer test properties:
1. On the New Test dialog box, select .NET Explorer Test from the Type list box and then click Next.
The .NET Explorer Test Properties dialog box opens.
2. Browse to and select the .NET Explorer script to apply to the test.
The script is a .nef file.
3. Browse to and select the NetExplorer.exe executable that executes the selected script file.
For example C:\Program Files\MyCustomSPFolder\DotNET Explorer\NetExplorer.exe.
4. In the Test case text box, type the name of the .NET Explorer script to execute.
If this text box is left blank, all test cases within the script are executed.
Note: The test cases InitTestCase and EndTestCase are always executed.
5. Click Finish.
Configuring JUnit Test Properties
To configure the properties of a test, you must first follow the steps described in Creating Tests or Editing
Tests.
To configure JUnit test properties:
1. On the New Test dialog box, select JUnit Test from the Type list box and then click Next.
The JUnit Test Properties dialog box opens.
2. In the Test class field, type the fully qualified name of the JUnit test class. If the field is left blank, all
tests in the classpath will be executed.
3. Optional: In the Test method field, type the name of the appropriate test method.
The method must be available in the test class. If the Test method field is left blank, all tests that are
included in the suite will be executed.
4. Optional: Set the Java home directory to the installation path of the Java Runtime Environment (JRE).
The path must be valid on the execution server on which the test runs.
Note: JUnit tests can be executed in JRE 1.5 and newer. If you use an older JRE, messages
containing java.lang.UnsupportedClassVersionError or Unrecognized option: javaagent will display in the Messages tab.
5. Specify a valid Java Classpath to use on the execution server.
We recommend to use a relative classpath. The relative classpath is then expanded to the full classpath
on the execution server. By using a relative classpath, changes on the location of the source control
profile do not require additional changes to the classpath.
The relative classpath must point to the root node of the test container containing the JUnit test, for
example JUnit_tests. The relative classpath on the execution server is then expanded to include the
working folder of the source control profile, for example C:\temp, and the test file names, for example
JUnit4Test.jar.
You can also use a fully qualified classpath. The fully qualified classpath must point to the archive or
folder in which the test classes reside. Further, junit.jar must be added to the classpath, with the
appropriate JUnit version, as the following examples show:
• C:\MyApps\main.jar;C:\MyApps\utils.jar
• ${apps_home}\main.jar;${apps_home}\utils.jar
6. Optional: In the JVM options field, you can specify the command-line options and environmental
variables that can affect the performance characteristics of the JVM. You can specify multiple options,
but you have to type them in the right order. For example, to use the client VM and set the maximum
size of the heap to 512MB, type -client -Xmx512m.
Silk Central 15.5
| 105
7. Optional: In the Coverage path field, type the JAR libraries or the specific class files to monitor for code
coverage information.
We recommend using the relative coverage path from the test container root node, which is then
expanded on the execution server. You can also use a fully qualified path. Use semicolons to separate
multiple jar files, as the following examples show:
•
•
C:\MyApps\main.jar;C:\MyApps\utils.jar
${apps_home}\main.jar;${apps_home}\utils.jar
Note: The coverage path setting is disregarded if the Record external AUT Coverage check box
is checked.
8. Check the Record external AUT Coverage check box to get code coverage for the application under
test that is defined for the execution plan in the Code Analysis Settings portion of Silk Central >
Execution Planning > Code Analysis .
If the check box is not checked, code coverage is recorded from the executing virtual machine. By
default, the check box is not checked.
9. Click Finish.
Note: Parameters are passed to the Java process as system properties, for example Dhost_under_test=10.5.2.133. Use the System.getProperty() method to access the
system properties. For example, to access the previously passed host_under_test, use
System.getProperty(“host_under_test”);.
Configuring Manual Test Properties
To configure the properties of a test, you must first follow the steps described in Creating Tests or Editing
Tests.
To configure manual test properties:
1. On the New Test dialog box, select Manual Test from the Type list box.
2. In the Planned time text box, type the expected amount of time for this manual step to execute and
then click Next.
The Add Manual Test Step dialog box displays.
Note: Manual test steps are automatically timed in seconds from the moment you begin execution.
These values are available in Detail view, not Step-by-Step view.
3. Specify a name, an action description, and the expected results for the first step of the manual test.
Note: Silk Central supports HTML formatting and cutting and pasting of HTML content for
Description text boxes.
4. Click OK.
5. Optional: Click New Step to add additional steps to your manual test.
Configuring NUnit Test Properties
To configure the properties of a test, you must first follow the steps described in Creating Tests or Editing
Tests.
Note: We recommend that you add the .\bin folder of your NUnit installation to the system path.
Click Start > Control Panel > System > Advanced > Environment Variables to add a path like C:
\Program Files\NUnit 2.2\bin to the system environment variable PATH.
To configure NUnit test properties:
1. On the New Test dialog box, select NUnit Test from the Type list box and then click Next.
The NUnit Properties dialog box displays.
106
| Silk Central 15.5
2. Click Browse to locate and select the NUnit assembly from which you want to pull a test.
3. Type the working directory in the NUnit Directory text box.
This directory is the local path to the file nunit-console.exe, such as C:\Program Files\NUnit
2.2\bin.
4. In the NUnit Options text box, type one or more NUnit console command-line options to specify how
NUnit tests are specified.
For example, to define that the Flex4TestApp NUnit test, located in SilkTest.Ntf.Test.Flex,
should be executed, set the fixture option as follows:
/fixture:SilkTest.Flex.Flex4TestApp
Note: When you add multiple options, you have to separate the options by writing one option in
each line in the text box.
5. Click Finish.
Configuring Silk Performer Test Properties
To configure the properties of a test, you must first follow the steps described in Creating Tests or Editing
Tests.
To configure Silk Performer test properties:
1. On the New Test dialog box, select Silk Performer Test from the Type list and click Next.
The Test Properties - Select Project dialog box opens.
2. Click Browse to select a Silk Performer project that has been saved to your file system and click Next.
3. On the Test Properties - Select Workload dialog box, select one of the workload profiles that has
been defined for the project from the Workload list.
4. Click Finish to create the test case.
Silk Central is fully integrated with Silk Performer.
Configuring Silk Test Classic Test Properties
To configure the properties of a test, you must first follow the steps described in Creating Tests or Editing
Tests.
To configure Silk Test Classic test properties:
1. On the Test Properties - Select Test Script dialog box, click Browse and select the test script file
from either the defined Silk Test Classic project or the source control directory.
Express the source control directory as a relative path to the root node defined in the test container.
2. Click Next.
The Test Properties - Select Testcase dialog box opens.
Note: If the Silk Test Classic script is a data-driven .g.t file, for example
SilkTestScript1.g.t, then data sources are completely controlled within the script file and not
through the data-driven properties of Silk Central. The Data-driven check box is checked by
default when you use a data-driven script file. For more information about data-driven Silk Test
Classic tests, refer to the Silk Test Classic documentation.
3. Select a test case from the available test cases in the defined script file or specify a custom test case.
4. Optional: Type additional execution arguments into the Test data text box.
These arguments are processed by Silk Test Classic during the execution of the test.
5. Define whether the test should provide a TrueLog.
Silk Central 15.5
| 107
Note: When running your tests with the Open Agent, this setting must be turned on both in Silk
Central and in Silk Test, otherwise no TrueLog will be provided. For more information, refer to the
Silk Test Classic documentation.
6. If required, specify an option set file.
7. Click Finish to create the Silk Test Classic test.
Note: If you possess Silk Test Classic test cases that require more than one hour to complete,
adjust the time-out settings for Silk Central. Otherwise, Silk Central assumes an error has occurred
and terminates the execution. For details about time-out settings, see the Administration topics in
this Help.
8. To import multiple Silk Test Classic testcases at the same time, select Silk Test Classic Multitestcase import from the Type list box in the New Test dialog box and click Next. Follow the steps
described above to complete the task.
Configuring Silk Test Workbench Test Properties
To configure the properties of a test, you must first follow the steps described in Creating Tests or Editing
Tests.
To configure Silk Test Workbench test properties:
1. On the Test Properties - Select Scripts dialog box, select one or more scripts from the Silk Test
Workbench Test list box.
2. In the Playback Options text box, type in the name of a predefined Silk Test Workbench playback
option or leave the default value of System Defaults.
Note: A playback option must be set for a Silk Test Workbench test. The delete option on a Silk
Test Workbench test will reset the playback option to the default value of System Defaults.
3. Click Finish.
Configuring Windows Scripting Test Properties
To configure the properties of a test, you must first follow the steps described in Creating Tests or Editing
Tests.
To configure Windows scripting test properties:
1. On the New Test dialog box, select Windows Scripting Test from the Type list box and then click
Next.
The Windows Scripting Properties dialog box opens.
2. Click Browse and select a Windows scripting test script.
3. Specify the location of any required additional parameters in the Switches text box.
Note: You may add other switches to be passed to the script. For more details on the switches
that can be used, see Windows Script Host Tests and refer to the MS Scripting Host
documentation.
4. Click Finish.
Configuring Process Executor Test Properties
To configure the properties of a test, you must first follow the steps described in Creating Tests or Editing
Tests.
To configure process executor test properties:
1. On the New Test dialog box, select ProcessExecutor Test from the Type list box and then click Next.
The ProcessExecutor Test Properties dialog box opens.
108
| Silk Central 15.5
2. In the Executable Name text box, type the fully qualified name of the executable.
3. In the Argument List text box, type all arguments of the process executor test method.
Note: Multiple arguments must be on separate lines in the text box.
4. Set the Working Folder. This is the folder where the executable is executed.
During execution of the executable the following two environment variables can be used:
Environment Variable
Description
SCTM_EXEC_RESULTSFOLDER All files in this folder are saved as result files in Silk Central. If an
output.xml file is created during execution in this directory, it is
processed by Silk Central.
SCTM_EXEC_SOURCESFOLDER This is the folder where all source files used during the execution are
located.
Example
The following example contains a ProcessExecutor test type that runs the Windows
Script Host from the command line with the /c switch and two parameters:
•
•
•
•
/c - command that specifies that the command line should terminate after execution.
cscript - Windows Script Host.
parareadwrite.js - the jscript file named parareadwrite.js
%SCTM_EXEC_RESULTSFOLDER% - the Silk Central variable that contains the
location of the Result folder on the execution server machine. Files stored in this
location are automatically uploaded to Silk Central and available in the Files tab of
the Test Run. In this example, the parareadwrite.js script produces an
output.xml file that is written to the Result folder and uploaded back to Silk
Central.
Configuring MSTest Properties
To configure the properties of a test, you must first follow the steps described in Creating Tests or Editing
Tests.
Note: The MSTest plugin supports the test type unit tests only. Results of other test types are
ignored.
To configure MSTest properties:
1. On the New Test dialog box, select MSTest Test from the Type list.
2. Click Next. The MSTest Test Properties dialog box appears.
3. You can run a test container, a test list, a test class, or a single test method:
•
To run a test container, click Browse next to the Test file field and select a .dll file. You can
constrain the run by typing in just a Test class or both a Test class and a Test method.
Silk Central 15.5
| 109
•
To run a test list, click Browse next to the Test file field and select a .vsmdi file (Visual Studio Test
Meta Data). Type a name in the Test list name field. You can constrain the run by typing in both a
Test class and a Test method.
4. Click Finish.
Note: To run MSTest on an execution server, a Visual Studio distribution or the Visual Studio Test
Agent have to be installed. Add the folder that contains MSTest.exe to your path variable and restart
the execution server. The default path is: C:\Program Files (x86)\Microsoft Visual
Studio <version>\Common7\IDE. Currently MSTest distributed with Microsoft Visual Studio/
Visual Studio Test Agent 2010, 2012, 2013 is supported.
Working With Tests in Grid View
The Grid View in the Tests area complements the Document View and Details View by facilitating the
filtering, sorting, and grouping of large numbers of tests. Grid View eases identifying match points between
tests and finding specific test information. Standard Windows keyboard shortcuts can be used, making it
easy to select and manipulate specific sets of tests within Grid View. You can execute trial runs of tests
and access tests from Grid View. You can also create execution plans through multi-selecting tests within
Grid View.
Grid View offers a number of view-customization features that can help you better manage large numbers
of tests. You can display or hide columns, adjust the width of columns, and move columns around using
drag-and-drop. To enhance performance when you have numerous tests, page views are broken into
views of 50 tests each. You can advance through pages using the First, Last, Next, and Previous. Or you
can enter a page number into the Page text box and press Enter to access the specified page. Sorting,
grouping, and filtering functions are available through context-menu commands to help you better organize
your tests, group tests, and identify matching points between tests. All of your view-customization
preferences are saved along with your project and will be available to you the next time you visit Grid
View.
Accessing Tests from Grid View
You can access a test in Tests view directly from the Grid View.
To access a test's Properties page from Grid View:
1. In the menu, click Tests > Grid View .
2. Click on the Name of the test that you want to access.
Alternatively, right click the row of the test and select Go to test.
Creating an Execution Plan in Grid View
To create an execution plan in Grid View:
1. In the menu, click Tests > Grid View .
2. Select the tests you want to assign to your execution plan, by using the multi-select feature of the Grid
View.
3. Right-click the tests and choose Create Execution Plan. The New Execution Plan dialog box
displays.
4. Enter the specifications of your new execution plan.
Note: All selected tests must be in the same container. If not, the execution plan is not created and
an error message displays. The test container is preselected in the New Execution Plan dialog box
and can not be altered.
Modifying Properties and Attributes for Multiple Tests
To modify property or attribute values for multiple tests:
110
| Silk Central 15.5
1. In the menu, click Tests > Grid View .
2. Select the tests for which you want to edit the properties or attributes.
3. Right click and select Multi-Edit. The Multi-Edit dialog box opens. This dialog lets you set the value of
the selected property or attribute to the same value for all selected tests.
Tip: Right-clicking on a cell of a specific property or attribute column pre-selects this property or
attribute in the Multi-Edit dialog box.
4. Select Properties or Attributes from the Category list.
5. Select the Name of the property or attribute to modify.
6. Select the Value of the property or attribute that will apply to all selected tests.
7. Click OK. The selected property or attribute value is applied to all selected tests.
Displaying and Hiding Columns in Grid View
To display and hide columns in Grid View:
1. In the menu, click Tests > Grid View .
2. Right-click a column header.
3. Expand the Columns submenus to view all the columns that are available in the project.
4. Check the check boxes of all the columns you want to have displayed in Grid View. Your columndisplay preferences will be saved and displayed each time you open the active project.
Grouping Tests in Grid View
Beyond simply sorting by column, you can chunk tests into groups to facilitate viewing. Groups are based
on commonly-shared values within the column that the grouping is based on.
To group tests in Grid View:
1. In the menu, click Tests > Grid View .
2. Right-click the header of the column that the sort is to be based on and select Group by This Field.
The tests are organized into groups based on commonly-shared values within the column you have
selected.
Removing Grouping of Tests in Grid View
To remove the grouping of tests in Grid View:
1. In the menu, click Tests > Grid View .
2. Right-click any column.
3. Uncheck the Show in Groups check box.
Sorting Tests in Grid View
To sort tests in Grid View:
1. In the menu, click Tests > Grid View .
2. Right-click the header of the column you want the tests to be sorted by.
3. Select Sort Ascending to have the tests sorted in ascending order or select Sort Descending to have
the tests sorted in descending order. Your sort preferences are saved and displayed each time you
open the active project.
Reordering Columns in Grid View
To reorder columns in Grid View:
Silk Central 15.5
| 111
1. In the menu, click Tests > Grid View .
2. Select the column header of the column you want to move.
3. Drag the column to the desired position and release it. Your column-order preferences are saved and
displayed each time you open the active project.
Resizing Columns in Grid View
To adjust the width of a column in Grid View:
1. In the menu, click Tests > Grid View .
2. Select the vertical column-header divider of the column you want to adjust.
3. Drag the column boundary to the desired position and release it. Your column-width preferences are
saved and displayed each time you open the active project.
Filtering Tests in Grid View
You can filter the test list based on column values. You can specify the following:
•
•
•
Filter strings to be applied to text-based data fields.
Calendar filters for date-based fields, using Before, After, or On operators.
Numerical operators for number-based fields. >, <, and =.
Filtering Text-Based Values in Grid View
To filter text-based values in Grid View:
1. In the menu, click Tests > Grid View .
2. Right-click the header of the text-based column that the filter is to be based on.
3. Expand the Filters submenu on the context menu to display the Filters text box.
4. Type the text string into the text box.
5. Press Enter. All tests that match the filter criteria, for example, in the case of test names, all test names
that include the specified string, are then dynamically displayed in the filtered list.
Filtering Date-Based Values in Grid View
To filter date-based values in Grid View:
1. In the menu, click Tests > Grid View .
2. Right-click the header of the date-based column that the filter is to be based on.
3. Hold your cursor over Filter on the context menu to display the Before, After, and On submenu.
4. Hold your cursor over After to define a date before which (and including) all tests should be excluded.
Hold your cursor over Before to define a date after which (and including) all tests should be excluded.
Hold your cursor over On to exclude all tests except those that have the specified date. The calendar
tool displays.
5. Select a date using the calendar tool or click Today to specify today's date.
Tip: You must explicitly click a date on the calendar tool or click Enter to activate date-based
filtering changes.
All tests that match the filter criteria are dynamically displayed in the filtered list.
Filtering Number-Based Values in Grid View
To filter number-based values in Grid View:
1. In the menu, click Tests > Grid View .
112
| Silk Central 15.5
2. Right-click the header of the number-based column that the filter is to be based on.
3. Expand the Filters submenu on the context menu to display the >, <, and = operators.
4. Enter a number in the > text box to define a number less than which (and including) all tests should be
excluded. Enter a number in the < text box to define a number greater than which (and including) all
tests should be excluded. Enter a number in the = text box to exclude all tests except those that have
the specified number.
Note: Number values are rounded to two decimal places.
5. Press Enter. All tests that match the filter criteria are dynamically displayed in the filtered list.
Filtering Boolean Values in Grid View
To filter boolean values in Grid View:
1. In the menu, click Tests > Grid View .
2. Right-click the header of the boolean-based column that the filter is to be based on.
3. Expand the Filters submenu on the context menu to display the available values.
4. Click one of the Yes or No option buttons. All tests that match the filter criteria are dynamically
displayed in the filtered list.
Filtering Values Using a Predefined List in Grid View
To filter values using a predefined list in Grid View:
1. In the menu, click Tests > Grid View .
2. Right-click the header of the column that has a predefined filter value, for example NodeType, that the
filter is to be based on.
3. Expand the Filters submenu on the context menu to display the available values.
4. Check the check boxes of the filter values that you are interested in. All tests having one of the selected
criteria will be displayed.
Removing Specific Grid View Filters
Note: You can identify filtered columns by their titles, which are displayed in bold, italic text. Hiding a
column removes all filters that have been applied to the column.
To remove a specific Grid View filter:
1. In the menu, click Tests > Grid View .
2. Right-click the header of the column that has the filter you want to remove.
3. Uncheck the Filters check box.
Removing All Grid View Filters
Note: You can identify filtered columns by their titles, which are displayed in bold, italic text. Hiding a
column removes all filters that have been applied to the column.
To remove all Grid View filters:
1. In the menu, click Tests > Grid View .
2. Right-click any column header and select Reset Filters.
Restoring Default Grid View Settings
Restoring default Grid View settings resets all user-defined settings for the current project. The userdefined settings are the following:
Silk Central 15.5
| 113
•
•
•
•
•
•
Column order
Column width
Shown and hidden columns
Applied filters
Sorting
Grouping
To restore the default Grid View settings:
1. In the menu, click Tests > Grid View .
2. Right-click any column header and select Reset View.
Assigning Existing Issues to Tests in Grid View
To assign existing issues to one or more tests:
1. In the menu, click Tests > Grid View .
2. Right-click on a test. You can select multiple tests with Ctrl+Click or Shift+Click.
3. Click Assign Existing Issue, select a Profile and enter an Issue ID.
Working with Manual Tests
Steps Page
Tests > Details View > <Manual Test> > Steps
Tests > Libraries of Shared Steps > <Shared Steps Object> > Steps
The Steps page lists all manual test steps that are included in the selected test or shared steps object. The
page supports standard Windows Explorer style multi-select functionality.
To create a new shared steps object, select the steps you want to share and click
.
The page includes the following toolbar items:
Toolbar Item
Description
Add a new test step to the end of the list.
Insert a new test step before the selected step.
Add a call to a shared steps object to the end of the list.
Add a call to shared steps from a library before the
selected step.
Delete the selected test steps from the list.
Cut the selected test step from the list and move it to the
clipboard.
Copy the selected test steps to the clipboard.
Paste a copy of the test steps held on the clipboard to the
row above the selected in the list.
Move the selected test step one position up in the list.
Moves the selected test step one position down in the list.
114
| Silk Central 15.5
Toolbar Item
Description
Opens the Attachments dialog box, where you can
perform the following actions:
Upload File
Upload and attach a file to the selected
test step.
Attach Link Attach a link to the selected test step.
Delete
Delete the file or link.
When steps of the test or shared steps object call a
shared steps object in a library, click here to view the
original steps. The resolved steps are marked with an
arrow, and you can access them by clicking on their
name. You cannot edit steps while this view is enabled.
View steps called from a shared steps object in a library
as a single step. Enable this view to edit test steps.
Create a shared steps object out of the selected steps.
Detach calls from other shared steps objects. Copies all
steps in the calls you have selected in the grid into the
manual test or shared steps object.
The Steps page supports the following keyboard functions (shortcuts) for test elements:
Key
Normal
-
Move up
+
Move down
SHIFT
CTRL
A
Select All
X
Cut
C
Copy
V
Paste
Ins
Insert
Del
Delete
The steps are displayed in a grid with the following columns:
Column
Description
Order
Number of the step in the execution sequence.
Name
Name of the test step.
Action Description
Action you must perform to execute the test step.
Expected Results
Expected result of the test step.
Attachments
Amount of links or files that are attached to the test step.
The Edit Step view shows the details of the selected test step and allows you to edit the name, action
description, expected results, and step properties of the test step.
The following buttons are available in the Edit Step view:
Silk Central 15.5
| 115
Button
Description
OK and New Step
Click when you are finished with editing the current step
and you wish to save your changes and add a new step
after the current.
OK
Click when you are finished with editing the current step
and you wish to save your changes.
Reset
Click to revert your changes.
Editing Manual Test Steps
Edit the manual test steps of a test or a shared steps object in the Steps page.
To edit a manual test step:
1. For a shared steps object, click Tests > Libraries of Shared Steps in the menu. For a manual test,
click Tests > Details View in the menu.
2. Select the node whose steps you want to edit in the Tests or Libraries tree.
3. Click the Steps tab.
4. Click on the test step that you want to edit. The details of the test step are shown in the Edit Step view.
5. Edit the name, action description, expected results, and step properties of the test step in the
corresponding text boxes.
Note: You can insert values from data sources into manual test steps in the form of parameters.
Note: Silk Central supports HTML formatting and cutting and pasting of HTML content for
Description text boxes.
6. Perform one of the following actions to finish editing the test step:
•
•
•
Click OK and New Step to save your changes and add a new step after the current one.
Click OK to save your changes.
Click Cancel to revert your changes.
Using External Tools to Create Manual Tests
You can use the open interface of Silk Central to create manual tests outside of Silk Central’s user
interface. You can create your own solutions and automatically create manual tests by using Silk Central’s
Web Service calls.
The following calls in the tmplanning Web Service assist you in creating manual tests:
•
•
•
•
•
•
•
•
getTestContainers
addManualTest
getCustomStepPropertyNames
getChildNodes
getNodeDetails
addNode
updateNode
startExecution
For a detailed explanation of these Web Service calls, see Available Web Services.
116
| Silk Central 15.5
Converting Manual Tests to Automated Tests
You can convert a manual test to one of the supported automated test types, Silk Performer, Silk Test
Classic, NUnit, and JUnit, and all installed plug-ins. The process carries manual test parameters over to
the automated test, and adds automated parameters to the new automated test.
The manual test parameters that are carried over to automated tests are:
•
•
•
•
•
•
•
Name
Description
Assigned requirements
Assigned execution plans
Assigned issues
Attachments
Test steps
Converting Manual Tests to Automated Tests
To convert a manual test to an automated test:
1.
2.
3.
4.
In the menu, click Tests > Details View .
Right-click the manual test in the Tests tree and select Automate with....
Select the automated test type from the list.
For information on filling out the dialog, see the appropriate topic in Configuring Test Properties.
Converting Automated Tests to Manual Tests
You can convert an automated test to a manual test. This is useful for example if you have an automated
test that you want to convert to another test type, for instance from Silk Test Classic to Silk4J. In this case
you would convert the Silk Test Classic test to a manual test, and then automate it with Silk4J.
Note: Limitations: Automated test to a manual test conversion only works for standard automated
test, which excludes package nodes, data-driven nodes, and linked nodes.
1. In the menu, click Tests > Details View .
2. Right-click the test in the Tests tree and select Convert to Manual Test.
3. Confirm the message.
Caution: Test type-specific properties are discarded. If an automated test is currently running, test
results are discarded after the test run completes.
Printing Manual Tests
To print manual tests:
1.
2.
3.
4.
In the menu, click Tests > Grid View .
Use Ctrl + Click or Shift + Click to select the manual tests that you want to print.
Right-click the selection and choose Show Test Details. The Manual Test Document dialog box opens.
Click Print.
Tip: To print a single manual test, you can also right-click the test in the Tests tree and select Print.
Silk Test Classic Tests
When you observe running Silk Test Classic executions on the Activities page, the currently running
execution plan offers a hyperlink that opens a Details View. This view allows you to closely monitor the
state of the currently running execution plan. For Silk Test Classic test executions, the center component of
this view consists of two parts: The upper part shows general information about the test, script, test case,
Silk Central 15.5
| 117
and test data. The lower part shows all output messages generated by Silk Test Classic, along with their
severity.
Silk Central’s Silk Test Classic interface offers a reliable means of automating Silk Test Classic users.
Each test case of a Silk Test Classic script executes within its own test execution and produces its own
results.
In previous versions of Silk Central, Silk Test Classic invocation was implemented through a command-line
interface. The new interface works using interprocess communication. You can specify whether or not Silk
Central’s Silk Test Classic interface should be used by configuring test-container settings.
For all Silk Test Classic test parameters that are not defined through Silk Test Classic test properties in the
Silk Central GUI, the Silk Test Classic default settings are used, for example from partner.ini.
You can define the following Silk Test Classic test properties:
Test
Property
Description
Test script
The test script, with file extension .t or .g.t, is defined relative to the test container’s root
node in the source control profile. This setting is required for all Silk Test Classic tests.
Testcase
You can select the test case from a list box or type it manually. If the test is not defined as
data driven, the test case is required.
Test data
Optional: If several arguments are passed to Silk Test Classic, they have to be separated
by a comma (,). If a String argument is passed to Silk Test Classic, the argument must
be set in quotation marks (“). When test data is more complex, we recommend that you
use parameters in the test data, for example${ParameterName}. Parameters are
replaced automatically within test executions.
Attention: This field has a maximum length of 2000 characters.
Data driven When a Silk Test Classic test requires input data from an external datasource, this flag
must be enabled. Default execution mode for data-driven tests is plan-based. When you
use script-based execution mode for a data driven test, change the DataDrivenScriptMode
setting in the Silk Test Classic element of SccExecServerBootConf.xml.
Option set
Optional: By default, Silk Central closes all open Silk Test Classic option set files. To
specify an option set file, specify the file name relative to the test container’s root node in
the source control profile.
When the custom test case field is already populated, the Silk Test Classic test was automatically created,
using the export functionality within Silk Test Classic. When you use the custom field to specify the test
case, you can terminate the test case name with a parenthesis "()". Inside the parenthesis, you can specify
test data, including parameters.
Note: Specifying data in the custom field will override the values of the Test data property.
Test Attributes
Attributes are administrator-created characteristics that can be applied to tests. You can filter the Tests
area for the tests with a specific attribute and assign all such tests to execution plans. Examples include a
platform attribute that can be applied to product components and a priority attribute that can be applied to
tests.
Test Attributes Page
Tests > Details View > <Test Element> > Attributes
The Attributes page in Details View displays all project attributes that are assigned to the selected test.
For each attribute, the Attributes page includes the following columns:
118
| Silk Central 15.5
Column
Description
Actions
Actions you can perform on the attribute. Delete or Edit.
Attribute
Name of the attribute.
Value
The value of the attribute that is assigned to the test.
Type
Attribute type.
Inherited
Whether the attribute is inherited from a parent.
Note: Inheritance of attributes is similar to inheritance of properties and success conditions. Attributes
that are assigned to a parent node are inherited throughout all sub-folders and child tests.
Assigning Attributes to Tests
To assign an attribute to a test:
1.
2.
3.
4.
5.
In the menu, click Tests > Details View .
Select the test to which you want to assign an attribute.
Click the Attributes tab.
Click Add Attribute. The Add Attributes dialog box appears.
Click
(Add Attribute 'Importance') in the Add column of the attribute that you want to assign.
Based on the attribute type you have selected, an Edit Attribute dialog box appears, where you can
specify which of the available attribute values you want to assign to the test.
6. Select an attribute value and click OK to assign the attribute to the test.
Editing Test Attributes
To edit a test attribute:
In the menu, click Tests > Details View .
Select the test for which you want to edit an assigned attribute.
Click the Attributes tab.
Click the Edit Attribute button of the attribute you are editing. The Edit Attribute dialog box displays.
The available options in the Edit Attribute dialog box vary depending on the attribute type that you
have selected.
5. Select the required value and click OK to save your settings.
1.
2.
3.
4.
Deleting Attributes from Tests
To delete an attribute from a test:
1.
2.
3.
4.
In the menu, click Tests > Details View .
Select the test from which you want to delete an assigned attribute.
Click the Attributes tab.
Click the delete icon of the attribute you want to delete. The Delete Attribute confirmation dialog box
displays.
5. Click Yes to delete the attribute.
Note: Inherited attributes cannot be deleted.
Test Parameters
Parameters are freely configurable input values that can be assigned to different test types and used in a
variety of ways. They help to define tests by defining test data.
Silk Central 15.5
| 119
Silk Performer
These tests use pre-defined parameters that represent the project attributes that are
defined in a selected Silk Performer test.
JUnit, Silk4J
Any JUnit test class can access a custom parameter of the underlying test as a Java
system property; the launcher passes these parameters to the executing virtual
machine using the -D VM argument. Within the test the values of the parameter can be
accessed using System.getProperty("myParam").
Silk4NET
For Silk4NET each parameter will be set as an environment variable. Within the test
the value of the parameter can be accessed using
Environment.GetEnvironmentVariable("myParam").
Silk Test
Classic
Parameters serve as symbols within test data properties. You can also use parameters
to parameterize input data for manual test steps. To enable Silk Test Classic to use a
parameter that has been set for a test in Silk Central, use the GetArgs() function.
Parameters are only passed once for each individual session or test.
External
Processes
For any test type where the execution takes place in an external process (WSH,
Process Executor, NUnit, JUnit, MSTest, DotNetExplorer), each parameter will be set
as an environment variable for the process. This is also the case if the parameter name
matches the name of an operating system variable, so that the value of the system
variable will be replaced by the parameter value, except when the parameter value is
an empty string.
Silk Test
Workbench
The parameter needs to be defined with the same name in the Silk Test Workbench
test, to be set when being executed in Silk Central.
Configuration
testing
You can override the test parameters in an execution plan. For additional information,
see Execution Plan Parameters.
Custom test
types
For details on custom test types, refer to the Silk Central API Help.
Test Parameters Page
Tests > Details View > <Test Element> > Parameters
In Details View, the Parameters page displays the test parameters that are assigned to the selected test.
For each parameter, the page display the following columns:
Column
Description
Actions
The actions that you can perform on the parameter. Delete and Edit.
Parameter
Name of the assigned parameter.
Value
The selected parameter value for this test.
Type
•
•
•
•
•
•
Inherited
Indicates if the parameter has been inherited from a parent.
String
Number
Float
Boolean
Password
Character
Note: Test parameters that are contained within a property of a test, for example test-data for Silk
Test Classic tests, are listed at the top of the Parameters page. Unused parameters are appended to
the bottom of the list and grayed out, analogous to a disabled state.
120
| Silk Central 15.5
Note: When the Parameters page includes more elements than can be displayed at once without
impacting response time, elements are displayed in increments. Page number links at the bottom of
the tab allow you to browse through the elements included on the page one page at a time. To display
all elements as a single list, select the [All] link.
Creating Custom Parameters
To create a custom parameter:
1. In the menu, click Tests > Details View .
2. Select the test node for which you want to create a new parameter.
3. Click the Parameters tab.
4. Click Add Custom Parameter. The Set Custom Parameter dialog box displays.
5. Provide a name for the parameter.
6. In the Type list box, select the parameter type.
• String
• Number
• Float
• Boolean
• Password
• Character
7. Define the parameter value that you want to assign to the selected test.
Note: Values for parameters of type String must be set in quotation marks (“) if you want to use
the parameter in Silk Test Classic executions.
8. Click OK.
Note: Parameters are automatically assigned to all sub-folders and child tests of the nodes to
which they’ve been assigned.
The parameter now displays in the Parameters page of the selected node.
Adding Predefined Parameters to Silk Performer Tests
To add a predefined parameter to a test:
1. In the menu, click Tests > Details View .
2. In the Tests tree, select the test node to which you want to add a predefined parameter.
3. Click the Parameters tab.
4. Click Add Predefined Parameter.
Note: The Add Predefined Parameter button is only available for Silk Performer tests, when the
Project property is already defined.
The Add Predefined Parameter dialog box appears, which lists all of the project attributes that are
available in the project file.
5. To add any of the listed parameters, click the corresponding add icon.
6. On the dialog box that appears, specify the actual value for the parameter.
7. Click Save to add the parameter to the active Tests tree node.
Editing Predefined Parameters
To edit a predefined parameter:
1. In the menu, click Tests > Details View .
Silk Central 15.5
| 121
2. Select the test node for which you are editing an existing parameter.
3. Click the Parameters tab.
4. In the parameter you want to edit, click Edit. The Set Custom Parameter dialog box displays.
5. Edit the parameter values as required.
Note: Inherited parameters cannot be edited. Uncheck the Inherit from parent check box to
enable editing of the parameter’s Value setting. Parameter Name and Type settings cannot be
edited.
Deleting Predefined Parameter Assignments
To delete a predefined parameter assignment:
1. In the menu, click Tests > Details View .
2. In the Tests tree, select the test node for which you are deleting the assignment of an existing
parameter.
3. Click the Parameters tab.
4. Click Delete in the Actions column of the parameter that you want to delete.
Note: Inherited parameters cannot be deleted. Uncheck the Inherit from parent check box on the
Set Parameter dialog box to enable deletion of an inherited parameter.
5. Click Yes on the Delete Parameter dialog box to delete the parameter.
Parameters within Parameter Values
You can use parameter values that contain parameters. The evaluation result of such parameter values is
shown in a bold font in the GUI. The following example shows how to use such a parameter:
parameterA := aaa
parameterB := bbb + ${parameterA}
Evaluated values:
parameterA = aaa
parameterB = bbb + aaa
Parameter Notations
The following parameter notations are supported:
For all tests:
${<parameter>}
All characters are allowed for parameter names, except $, {, }, and #.
Deprecated notation for manual tests:
#<parameter>#
For manual tests, the following characters are allowed for parameter names: 0-9, a-z, A-Z, and _.
Additional notation for Silk Test Classic tests:
$<parameter>
For Silk Test Classic tests, the following characters are allowed for parameter names: 0-9, a-z, A-Z, and _.
Parameter-Token Replacement Upon Execution
Any string input for a property of a test may contain placeholders in the following form: $
{parametername}. parametername must match the name of a parameter defined or inherited for the
test. At execution time, the placeholder is replaced by the value entered for the parameter with the denoted
122
| Silk Central 15.5
name. This makes recurring strings in properties more customizable and facilitates the editing of common
definitions.
When Silk Central finds a parameter with the notation ${<parameter>}, it first checks if the parameter is
included in the defined parameters, and if not, it checks if the parameter is an environmental variable.
For example, if the value of a JUnit classpath property is junit.jar;${MyWorkingDir}/myclasses
and the parameter MyWorkingDir has the value C:/Temp/MyWorking, the resultant effective property
value is junit.jar;C:/Temp/MyWorking/myclasses.
Note: The value of a parameter may also contain other parameter placeholders, which allows nesting
based on the same principle.
Test Parameters Page - Silk Test Workbench
Tests > Details View > <Test Element> > Data Set
When passing parameters from a Silk Central test to a Silk Test Workbench test, these parameters must
be defined as input parameters in the Silk Test Workbench script and they must have the same name in
Silk Central as in the script. The following data types should be used:
Silk Central
Silk Test Workbench
String
Text
Number
Number (Long)
Number
Number (Long Long)
Number
Enumeration
Float
Number (Double)
Boolean
Boolean (True/False)
Associating Requirements with Tests
This section explains how to assign requirements to tests.
Assigning Requirements to Tests
To manually assign requirements to tests:
1. In the menu, click Tests > Details View .
2. In the Tests tree, select the test to which you want to assign requirements.
3. Click the Assigned Requirements tab.
Note: If you have created a requirements filter, you can select it from the filter list above the
Requirements tree. To create a new requirements filter, click Requirements > Details View in
the menu and click
on the toolbar.
All requirements that are available for assignment are displayed in the Requirements tree.
4. Click Assign All Filtered to assign all filtered requirements to the selected test, or click
to the left of
a requirement to assign a single requirement to the selected test. Assigning all filtered requirements is
only enabled if a filter is selected and if you have either Manage requirements or Manage tests and
executions permission.
Note: Newly generated tests can automatically be assigned to the requirements from which they
are generated by checking the Assign newly generated tests to requirements check box on the
Generate Tests from Requirements dialog box. This is the default behavior.
Silk Central 15.5
| 123
Sorting Assigned Requirements
To sort the assigned requirements:
1. In the menu, click Tests > Details View .
2. In the Tests tree, select a test.
3. Click the Assigned Requirements tab.
4. Click the column header of the property by which you want to sort the requirements.
A small upward or downward pointing arrow indicates both which column the sort is based and the
direction of the sort, ascending or descending.
5. If required, click the column header again to reverse the direction of the sort.
Locating Assigned Requirements
To locate assigned requirements in the Available Requirements tree:
1. In the menu, click Tests > Details View .
2. In the Tests tree, select a test.
3. Click the Assigned Requirements tab.
4. In the Actions column of a requirement, click
to find out in which node in the Available
Requirements tree the requirement is stored in.
The corresponding parent-requirement node is expanded and the assigned requirement is highlighted.
Removing Requirement Assignments
To remove a requirement assignment:
1. In the menu, click Tests > Details View .
2. In the Tests tree, select a test that has at least one requirement assigned to it.
3. Click the Assigned Requirements tab.
4. In the Actions column of the assigned requirement, click
.
5. Click Yes on the confirmation dialog box to confirm deletion of the assignment.
Note: To remove all requirement assignments from the selected test, click Remove All.
Test Assigned Requirements Page
Tests > Details View > <Test Element> > Assigned Requirements
The Assigned Requirements page lists the requirements that have been assigned to the selected test or
project, and allows you to assign additional requirements. The Available Requirements tree lists all
requirements that can be assigned.
Note: If you have created a requirements filter, you can select it from the filter list above the
Requirements tree. To create a new requirements filter, click Requirements > Details View in the
menu and click
on the toolbar.
For each assigned requirement, the page displays the following columns:
124
Column
Description
Actions
Actions that you can perform on the selected requirement. Remove Requirement,
Locate, and View Description.
Requirement
Name of the assigned requirement. Click to open the Requirements > Properties page.
| Silk Central 15.5
Column
Description
Priority
Priority of the requirement.
Risk
Potential risk associated with the requirement.
Reviewed
Review status of the requirement.
Working with Test Attachments
This section describes how to work with attachments in the Tests area.
Attaching Files to Test Elements
To attach a file to a test element:
1. In the menu, click Tests > Details View .
2. In the Tests tree, select a container, folder, or test.
3. Click the Attachments tab.
4. Click Upload File. The Upload File dialog box appears.
5. Click Browse to select a file from your local file system.
6. Optional: Enter a Description for the attachment.
7. Click OK to upload the attachment to the server and associate it with the selected element.
Note: Attaching files to a test element may not work in Mozilla Firefox. Firefox requires usage of three
slashes, for example file:///, for a file link, while other browsers require only two, for example
file://. Additionally, Firefox includes a security feature blocking links from remote files to local files
and directories. For more information, see http://kb.mozillazine.org/
Firefox_:_Issues_:_Links_to_Local_Pages_Don't_Work.
Attaching Links to Test Elements
To attach a link to a test element:
1. In the menu, click Tests > Details View .
2. In the Tests tree, select a container, folder, or test.
3. Click the Attachments tab.
4. Click Attach Link. The Attach Link dialog box appears.
5. Type the URL in the Link field.
6. Optional: Type a Description for the attached link.
7. Click OK to associate the link with the selected element.
Viewing Test Attachments
For a selected test element, the Attachments page lists the attached files and links. The attachments are
by default displayed in the order in which they are uploaded, but you can sort the attachments by columns.
To display the attachments that are associated with child elements of the selected element, check the
Include Child Attachments check box.
To view a test attachment:
1. In the menu, click Tests > Details View .
2. In the Tests tree, select the element for which you want to view an attachment.
3. Click the Attachments tab.
4. Click on the name of the attachment.
Silk Central 15.5
| 125
The name of each listed attachment serves as a link. File-attachment links open a Save As dialog box,
enabling you to download the attachment to your local file system. Link-attachments link directly to the
link destinations in a new browser window.
Deleting Attachments from Test Elements
To delete an attachment from a test element:
1.
2.
3.
4.
In the menu, click Tests > Details View .
In the Tests tree, select the element from which you want to delete an attachment.
Click the Attachments tab.
In the Actions column of the attachment you want to delete, click .
5. Click Yes on the confirmation dialog box to delete the attachment from the project.
Note: Only one attachment at a time can be deleted.
Test Attachments Page
Tests > Details View > <Test Element> > Attachments
The Attachments page lists all files and links that have been uploaded as attachments to the selected test
containers, folders, and tests. Check the Include Child Attachments check box to additionally display all
attachments of child tests, folders, and test containers of the selected node. For each listed attachment,
the page displays the following columns:
Column
Description
Actions
Actions that can be taken on the attachment. Delete.
Name
Name of the attachment.
Size
Size of the attached file.
Description
Description that has been defined for the attachment.
Created On
When the attachment or link was uploaded.
Created By
User who uploaded the attachment.
Assigned Execution Plans
Viewing Assigned Executions
To view the executions that are assigned to a test:
1. In the menu, click Tests > Details View .
2. Select the test for which you want to view the assigned executions.
3. Click the Properties tab. The complete list of executions that are assigned to the selected test is
displayed in the Assigned Executions grid.
Test Runs Page
Tests > Details View > <Test> > Runs
The Runs page is available on test nodes in Details View and offers a listing of test execution results for
the selected test.
The data grid representation of the Runs page facilitates the filtering, sorting, and grouping of large
numbers of test runs.
For each run, the page displays the following columns:
126
| Silk Central 15.5
Column
Description
Actions
Actions that you can perform on the test run.
New Issue
Click to open the New Issue dialog box and create a new issue for
the test.
Assign Existing
Issue
Assign an issue from an externally-configured issue-tracking system
to the test.
Status
Status of the execution. For tests that are part of a running execution plan, the status is
updated in response to the current status of the test run. If the current run is aborted, the
status is reset to the status before the run.
Status Reason
The reason why a specific test run has the status Passed, Failed or Not Executed.
Run ID
The ID of the test run. Click to open the Test Run Results dialog box. If the test is running,
click to view details of the execution.
Run Type
The Run Type column shows the test type during each run. The test type might change
between two runs, for example when you convert the test from manual to automated.
Start Time
Time the run started. If the test is a manual test and currently running, Silk Central adds
(Running) to the date and time.
Duration
Duration of the test run in h/mm/ss.
Execution Plan
The name of the assigned execution plan, or Unassigned Tests if the execution was a
try-run or results were uploaded. Click to open the execution plan.
Executed By
The execution server from which the test was run.
Issues Found
Displays the amount of issues that are assigned to the test run. When no issues are
assigned to the test run, the column is empty. Click on the link to access the issue in the
Issues page of Tests > Details View.
Errors
Number of errors that were generated during the run.
Warnings
Number of warnings that were generated during the run.
Version
Version that the test was run against.
Build
Build number that the test was run against.
Execution Plan
Parent
The configuration suite, folder, or testing cycle in the context of which the execution plan is
executed. Click to access the suite or folder in the Execution Plans tree. If the execution
plan is not included in a configuration suite or folder, nothing is displayed.
Run Comment
For Silk Performer test runs, Silk Performer uses this column to add information to the test
run when uploading results. For all other test types, you can use this column to add
information to the run.
To compare two or more test runs, use Ctrl or Shift to select the two runs. Right click on your selection
and click Compare Test Results or Reports > Test Run Comparison .
Test Issues Page
Tests > Details View > <Test Element> > Issues
The Issues page enables you to enter and track issues related to the selected test, container, or folder.
New Issue
Click to assign a new issue to the selected test. This button is only displayed if the
currently selected object is a test.
Silk Central 15.5
| 127
Assign Existing
Issue
Click to assign an issue from an external issue tracking system to the selected test.
This button is only displayed if the currently selected object is a test.
Update Issue
States
Click to update issues states.
For each issue, the page displays the following columns:
Column
Description
Actions
Actions that can be performed on the issue. Click
delete the issue. External issues will not be deleted.
to
Issue ID
ID that has been automatically assigned to the issue.
Click to edit the issue.
Assigned Test
Test that has been assigned to the issue. This column is
only displayed if the currently selected object is a
container or a folder.
Synopsis
Synopsis of the issue.
Status
Status of the issue.
External ID
Indicates if the issue is tracked by an external issue
tracking system. Click an external issue number to link
directly to the external issue tracking system.
Priority
The priority of the issue as defined in the external issue
tracking system. The following issue tracking systems
support this feature: Atlassian JIRA, Bugzilla, Silk Central
Issue Manager, and StarTeam.
Test Run
The ID of the test run that the issue is assigned to. Click
on the ID to access the Details page of the Test Run
Results dialog box in the Executions area.
Created On
When the issue was created.
Created By
User who created the issue.
Profile
Name of the issue tracking profile, as defined in Silk
Central > Settings > Issue Tracking .
Data-Driven Tests
Data-driven tests are tests that are derived from values in an existing data source, such as a spreadsheet
or a database. Before you can work with data-driven tests, you need to configure a data source.
Creating Data-Driven Tests
To create a data-driven test:
1. In the menu, click Tests > Details View .
2. Create a new test.
For more information, see Creating Tests.
3. Click the Properties tab of the newly created test.
4.
Click
(Edit) next to Data-driven Properties. The Data-driven Properties dialog box appears.
5. Select a preconfigured data source from the Data Source list.
128
| Silk Central 15.5
Note: Your data source may contain up to 100 rows. If it contains more than 100 rows, you need
to enter a query on the Data-driven Properties dialog box that returns 100 rows at most. This
prevents generating more than 100 tests out of one data source.
6. Click Next to continue.
7. Select a data set from the Data Set list.
In the case of Excel data sources, this is a worksheet name. In the case of database data sources, this
is a table name.
8. Check the Each data row is a single test check box to have each row in your data set considered to
be a separate test, or do not check this check box to create a single test for all data rows of your data
set.
9. Optional: Enter a SQL query in the Filter query field to filter your data set based on an SQL-syntax
query.
Note: Only simple WHERE clause queries are supported.
10.Check the Enable data-driven properties check box to enable data-driven functionality.
11.Click Finish to save your settings.
Note: Data-driven property settings are visible in the lower portion of each test’s Properties page.
Note: To use the data-driven test functionality of Silk Central with Silk Performer scripts, data
sources with column names matching the corresponding Silk Performer project attributes must be
used in conjunction with AttributeGet methods.
Adding a Data Source Value to a Manual Test Step
To add a data source value to a manual test step:
1. In the menu, click Tests > Details View .
2. Create a new data-driven test.
Select Manual as the test type and configure test steps.
Note: To view the values included in your data source, click the Data Set tab of the test.
3. Click the Steps tab.
4. Select the test step that should reference the data source value.
5. In the Action description text box, enter a parameter that references the relevant column in your data
source, using the syntax ${<column name>}.
For example, if you want a test step to retrieve password parameters from a spreadsheet that has a
column called Password, you would write the parameter as ${Password}. When you execute the
manual test step, the parameter is replaced by an actual value in the corresponding data-driven data
source.
Downloading CSV Data From a Data Source
To download CSV data from a data source:
1. In the menu, click Tests > Details View .
2. Select a test that relies on the data source from which you want to download data.
3. Click the Properties tab.
4. In the Actions column of either the data source or the data set, depending on which entity contains the
data you want to download, click Download.
5. Specify the location on your local system to where the data is to be downloaded.
6. Click OK to download the data in CSV format.
Silk Central 15.5
| 129
Editing Data-Driven Properties
To edit data-driven properties:
1. In the menu, click Tests > Details View .
2. Select the test that has the property you want to edit.
3. Click the Properties tab.
4. In the Actions column of the property you are editing, click
5. Edit the property as required.
.
6. Click OK to save your changes.
Removing Data-Driven Properties
Remove all data-driven properties when the data-driven properties are no longer relevant, and when you
want to delete a data source.
1. In the menu, click Tests > Details View .
2. In the Tests tree, select the node from which you want to remove the data-driven properties.
3. Click the Properties tab.
4. In the Actions column of the Data-driven Properties section, click
removed from the node.
. All data-driven properties are
Note: The data-driven properties are also removed from all sub-nodes that inherit the properties of
the node.
Single and Multiple Data-Driven Test Instances
When planning data-driven tests, you should first be aware of the following two different data-driven test
types that are available in Silk Central:
Single datadriven test
instance
A single test result is generated for all data rows of your data source. This means that
the test is only successful if the execution with every single data row is successful. If the
execution with one data row fails, the whole test is marked as failed.
Multiple datadriven test
instance
Each data row of your data source is represented by a test of its own. This means that
each data row produces a failed or passed test result. For example, if your data source
is a spreadsheet with four rows, you will have the original test you created as a parent
test in addition to four new child tests, one for each of the data rows.
Note: Your data source may contain up to 100 rows. If it contains more than 100 rows, you need to
enter a query on the Data-driven Properties dialog box that returns 100 rows at most. This inhibits to
generate more than 100 tests out of one data source.
Note: The parent test created in this process does not have parameters associated with it, since it
only represents a structuring instance for its child tests and no longer functions as an actual test. All
values found in the data source will be listed on the parent test’s Data Set page.
Note: When assigning a parent test to a requirement, links to requirements are only inherited when
using single data-driven test instances.
Note: You can not assign the parent test of a multiple data-driven test instance to a setup or cleanup
test execution, as such a parent node is treated as a folder. You can assign one of its child nodes
though, and you can also assign a single data-driven test instance to a setup or cleanup test
execution.
Worksheet Handling
If your data source is a Microsoft Excel worksheet, you should follow these guidelines to ensure a
successful and maintainable data-driven test setup:
130
| Silk Central 15.5
•
•
•
Make your column names self-describing. This will make the data source setup in Silk Central easier to
maintain.
If you use multiple worksheets, use consistent column names across the worksheets. This will make it
easier for you to apply filters for selecting columns for your data source setup.
Use certain columns as “key” columns. Key columns will allow you to maintain your data source file,
while Silk Central is still able to identify specific data rows due to the value in the key column, despite
changes in row orders. Values within a key column should be unique.
Data Import Considerations
When importing data rows from an external data source, Silk Central does not account for row sorting
functionality used in the external data source. Due to this, the order of data rows in Silk Central might differ
from the row order in the external data source. Silk Central also ignores any format settings that have been
applied in the external data source. For example, if you formatted date cells in an Excel worksheet to
display the date in a certain way, Silk Central will ignore this setting and import any date values in the base
format "YYYY.MM.DD HH:MM:SS.M".
Note: Your data source may contain up to 100 rows. If it contains more than 100 rows, you need to
enter a query on the Data-driven Properties dialog box that returns 100 rows at most. This inhibits to
generate more than 100 tests out of one data source.
Test Data Set Page
Tests > Details View > <Test> > Data Set
The Data Set page lists all data that is defined for data-driven testing with the selected test.
The Filter query row at the top of the list displays the filter value that is defined for this data set. The
values of the configured data set are displayed below this row.
For each data set, the page displays the following columns:
Column
Description
Actions
Actions that can be performed on the
data set or filter. Edit and Delete.
Property
The name of the data set or filter.
Value
The value of the filter or data set for
the selected test.
Inherited
Indicates whether or not the data set
or filter was inherited from a parent
test container or test.
Note: When the page includes more elements than can be displayed at once without impacting
response time, elements are displayed in increments. Page number links at the bottom of the page
allow you to browse through the elements included on the page one page at a time. To display all
elements as a single list, click the [All] link.
Libraries
This section provides information regarding the usage of libraries in Silk Central.
Shared Step Libraries
Shared step libraries (libraries), are collections of test steps which are shared between tests in multiple
projects. Sharing the steps reduces the amount of steps that a test engineer needs to maintain.
Libraries are displayed, organized, and maintained through a hierarchical tree structure, called the
Libraries tree. The Libraries tree enables you to organize shared steps in any number of hierarchy levels.
Silk Central 15.5
| 131
You can edit or delete any node in the tree. Right click on a node in the tree to cut it, or to copy and paste it
to another location. Use the Visibility page to define for which projects the selected library is visible. When
you create a new call to a shared steps object from a project that has visibility on the library, the library is
displayed in the Call to Shared Steps dialog box.
To view the properties of a node in the Libraries tree, select the node and click the Properties tab. To
create, edit, or view step properties for a library node in the Libraries tree, select the node and click the
Step Properties tab. To create, edit, or view the shared steps included in a shared steps object in the
Libraries tree, select the shared steps object and click the Steps tab. The Usages page of each shared
step object in the tree lists tests and other shared step objects that are calling the selected object, allowing
you to estimate the impact of a change to the object.
When you create a baseline of a project, the baselined tests call the same shared steps objects as the
original tests.
The root node of the Libraries tree is called Shared Steps Libraries and cannot be edited.
Note: Objects in the Libraries unit can be created, edited, and viewed by the Test Manager, Tester,
and SuperUser roles. The Test Manager and SuperUser roles can additionally delete objects from the
Libraries unit. Users with the roles Project Manager, Analyst, or Reporter can view objects in the
Libraries unit.
Creating a Shared Step Library
1. In the menu, click Tests > Libraries of Shared Steps.
2. In the Libraries tree, select the root node, which is called Shared Steps Libraries.
3. In the toolbar, click
to create a new library.
Note: You can also right click on the root node and click New Library.
Library Properties Page
Tests > Libraries of Shared Steps > Properties
The Properties page displays the following properties of the selected node in the Libraries tree:
Property
Description
Name
The name of the node.
ID
The identifier of the node.
Description
A description of the contents of the
node.
Created On
Date and time this node was created.
Created By
Name of the user who created this
node.
Changed On
The date and time this node was last
changed.
Changed By
Name of the user who last changed
this node.
Planned Time [hh:mm]
Estimated execution. Only for shared
steps objects.
Step Properties Page
Tests > Test Step Properties
132
| Silk Central 15.5
Tests > Libraries of Shared Steps > <Library> > Step Properties
The Step Properties page lists all properties that can be populated into manual test steps across the
active project. To create a new step property, click New Property.
Step Property
Description
Actions
The actions that can be performed on the property are
Delete, Move Up, and Move Down.
Name
Name of the step property.
Library Visibility Page
Tests > Libraries of Shared Steps > Visibility
On the Visibility page, you can make the selected library visible to all projects or limit its visibility to a
selection of specific projects. To change the visibility of a the selected library to a project, click Edit
Visibility.
When a baseline of a project that calls shared steps objects is created, the libraries that include the shared
steps objects are by default visible to the new project baseline. For more information on project baselines,
see the Administration topics in this Help.
For each project, the page shows the following properties:
Property
Description
Project
The name of the project.
ID
The identifier of the project.
Description
A description of the project.
Is Active
Whether the project is active or not.
Has Usages
Whether the project uses objects
from the selected library or not.
Edit Visibility Dialog Box
The Edit Visibility dialog box displays the projects that can be assigned to the library by the current user.
The dialog box includes the following items:
Item
Description
All Projects
Click this option button to assign all
projects to the library.
Selected Projects
Click this option button to assign
selected projects from the list to the
library.
Select All
Click to assign all listed projects to
the library.
Deselect All
Click to unassign all listed projects
from the library.
Note: Projects that are currently using the library are grayed out and you cannot unassign them from
the library.
Silk Central 15.5
| 133
Shared Steps Objects
A shared steps object is a collection of manual test steps, included in a library, that can be used by multiple
tests in multiple projects.
Calling Shared Steps
To reduce the effort for maintaining the same test steps in various tests and projects, you can add shared
steps from a library as a single step to a test or shared steps object.
You can only add a call to all steps in a shared steps object, not to a selection of them. When a call to a
shared steps object is added, all shared steps are displayed as a single step in the calling test or shared
steps object and you can add additional steps before and after the called steps. The initial shared steps are
only displayed during execution of the referencing test. The shared steps object cannot be deleted. To
delete the shared steps object, you first have to remove all calls to it.
The name of the shared steps object, whose steps are called, is displayed as the name of the step in the
Steps page. Click on the name to access the called shared steps object.
Adding a Call to Shared Steps
To add a call to a shared steps object:
1. In the menu, click Tests > Details View to add the shared steps to a test or click Tests > Libraries of
Shared Steps to add the shared steps to another shared steps object.
2. In the corresponding tree, click on the node to which you want to add the shared steps.
3. Click the Steps tab.
4. To add the shared steps to the end of the steps list, click
. To insert it above the selected step, click
. The Call to Shared Steps dialog box opens.
5. Select the shared steps node, whose steps you want to add, from the tree.
Note: For a test, the tree displays only the libraries that are visible to the active project. For more
information, see the Visibility Page.
6. Click Ok.
Call to Shared Steps Dialog Box
The Call to Shared Steps dialog box enables you to browse shared steps objects in the Libraries tree. To
open the dialog box, choose a manual test in the Tests tree or a shared steps object in the Libraries tree,
click the Steps tab and click
.
To search for existing libraries, folders, and shared steps objects in the Libraries tree, type the name you
are searching for in the Find text box of the dialog box and press Enter. The search is case-insensitive
and not limited to entire words. Libraries and folders returned by the search are displayed with their entire
sub-tree.
Creating a Shared Steps Object
You can create a shared steps object in the Steps page of any manual test or shared steps object.
To create a shared steps object:
1. For a shared steps object, click Tests > Libraries of Shared Steps in the menu. For a manual test,
click Tests > Details View in the menu.
2. Navigate to the Steps page of the manual test or shared steps object that includes the steps you want
to share.
134
| Silk Central 15.5
3. Select the steps with CTRL + CLICK or SHIFT + CLICK.
4. Click
. The Create Shared Steps dialog box opens.
5. Enter a name for the new shared steps object in the Name field.
6. Choose the location where you want to place the new shared steps object in the Libraries tree.
7. Click OK. The shared steps object is created and the selected steps are replaced by a call to the
shared steps object.
Detaching Shared Steps from Libraries
To make a manual test or a shared steps object independent of other shared steps objects, detach the
steps from the libraries that contain the shared steps objects. All called steps are then copied into the
manual test or shared steps object.
To detach the shared steps included in a manual test or a shared steps object:
1. For a shared steps object, click Tests > Libraries of Shared Steps in the menu. For a manual test,
click Tests > Details View in the menu.
2. In the corresponding tree, click on the node in which you want to resolve the shared steps.
3. Click the Steps tab.
4. Select the calls that you want to resolve in the grid with CTRL + CLICK or SHIFT + CLICK.
5. Click
and confirm the resolving in the message box.
Editing Manual Test Steps
Edit the manual test steps of a test or a shared steps object in the Steps page.
To edit a manual test step:
1. For a shared steps object, click Tests > Libraries of Shared Steps in the menu. For a manual test,
click Tests > Details View in the menu.
2. Select the node whose steps you want to edit in the Tests or Libraries tree.
3. Click the Steps tab.
4. Click on the test step that you want to edit. The details of the test step are shown in the Edit Step view.
5. Edit the name, action description, expected results, and step properties of the test step in the
corresponding text boxes.
Note: You can insert values from data sources into manual test steps in the form of parameters.
Note: Silk Central supports HTML formatting and cutting and pasting of HTML content for
Description text boxes.
6. Perform one of the following actions to finish editing the test step:
•
•
•
Click OK and New Step to save your changes and add a new step after the current one.
Click OK to save your changes.
Click Cancel to revert your changes.
Steps Page
Tests > Details View > <Manual Test> > Steps
Tests > Libraries of Shared Steps > <Shared Steps Object> > Steps
The Steps page lists all manual test steps that are included in the selected test or shared steps object. The
page supports standard Windows Explorer style multi-select functionality.
To create a new shared steps object, select the steps you want to share and click
.
Silk Central 15.5
| 135
The page includes the following toolbar items:
Toolbar Item
Description
Add a new test step to the end of the list.
Insert a new test step before the selected step.
Add a call to a shared steps object to the end of the list.
Add a call to shared steps from a library before the
selected step.
Delete the selected test steps from the list.
Cut the selected test step from the list and move it to the
clipboard.
Copy the selected test steps to the clipboard.
Paste a copy of the test steps held on the clipboard to the
row above the selected in the list.
Move the selected test step one position up in the list.
Moves the selected test step one position down in the list.
Opens the Attachments dialog box, where you can
perform the following actions:
Upload File
Upload and attach a file to the selected
test step.
Attach Link Attach a link to the selected test step.
Delete
Delete the file or link.
When steps of the test or shared steps object call a
shared steps object in a library, click here to view the
original steps. The resolved steps are marked with an
arrow, and you can access them by clicking on their
name. You cannot edit steps while this view is enabled.
View steps called from a shared steps object in a library
as a single step. Enable this view to edit test steps.
Create a shared steps object out of the selected steps.
Detach calls from other shared steps objects. Copies all
steps in the calls you have selected in the grid into the
manual test or shared steps object.
The Steps page supports the following keyboard functions (shortcuts) for test elements:
136
Key
Normal
-
Move up
+
Move down
SHIFT
CTRL
A
Select All
X
Cut
| Silk Central 15.5
Key
Normal
SHIFT
CTRL
C
Copy
V
Paste
Ins
Insert
Del
Delete
The steps are displayed in a grid with the following columns:
Column
Description
Order
Number of the step in the execution sequence.
Name
Name of the test step.
Action Description
Action you must perform to execute the test step.
Expected Results
Expected result of the test step.
Attachments
Amount of links or files that are attached to the test step.
The Edit Step view shows the details of the selected test step and allows you to edit the name, action
description, expected results, and step properties of the test step.
The following buttons are available in the Edit Step view:
Button
Description
OK and New Step
Click when you are finished with editing the current step
and you wish to save your changes and add a new step
after the current.
OK
Click when you are finished with editing the current step
and you wish to save your changes.
Reset
Click to revert your changes.
Usages Page
Tests > Libraries of Shared Steps > <Shared Steps Object> > Usages
The Usages page displays the tests and shared steps objects that use the selected shared steps object.
To access the usages page of a shared steps object, select the shared steps object in the Libraries tree
and click the Usages tab.
For each call to the selected shared steps object, the Usages page displays the following properties:
ID
Identifier of the calling test or shared steps object. Hidden
by default.
Name
The name of the calling test or shared steps object. Click
on the name to access the test or shared steps object.
The icon in front of the name indicates if the calling object
is a test or another shared steps object.
Created On
Date and time the calling test or shared steps object was
created.
Created By
Name of the user who created the calling test or shared
steps object.
Silk Central 15.5
| 137
Project ID
Identifier of the project in which the calling test resides.
Hidden by default. Empty if the calling object is another
shared steps object.
Project Name
Name of the project in which the calling test resides.
Empty if the calling object is another shared steps object.
Versions
A version of a shared steps object or a manual test is a revision of the element in a certain state. The
version contains the information included in the element and the individual steps of the element at the
creation time of the version. Attachments, parameters, and data sets are not included in the version for
manual tests.
You can manually create versions of shared steps objects or manual tests or revert to previous versions.
All versions of a shared steps object or a manual test are listed in the History page of the element. When
you copy a project, the versions are also copied.
Creating a Version
To be able to revert a set of changes you want to apply to a shared steps object or a manual test, create a
version of the element.
To create a version of a shared steps object or a manual test:
1. For a shared steps object, click Tests > Libraries of Shared Steps in the menu. For a manual test,
click Tests > Details View in the menu.
2. Select the shared steps object in the Libraries tree, or the manual test in the Tests tree.
3. Click
in the toolbar.
This action is only enabled if the shared steps object or the manual test was changed.
The Create Versions dialog box opens.
4. Optional: Enter a comment on the version in the Comment text box.
5. Click Ok. The new version is shown in the History page.
Viewing a Version
To see if a specific version of a shared steps object or a manual test applies to your testing needs, view the
details of the version.
To view the details of a version of a shared steps object or a manual test:
1. For a shared steps object, click Tests > Libraries of Shared Steps in the menu. For a manual test,
click Tests > Details View in the menu.
2. Select the shared steps object in the Libraries tree, or the manual test in the Tests tree.
3. Click the History tab.
4. Right click on the version of which you want to see the details.
5. Click View version <ID>.
6. The View Version dialog box opens. If the version includes attachments, you can view the attachments
by clicking on their number in the Attachments column of the Steps section.
Note: Use the arrows to change the version number and view additional versions.
Comparing Versions
To view the differences between two versions of a shared steps object or a manual test, compare the
versions.
138
| Silk Central 15.5
To compare two versions of a shared steps object or a manual test:
1. For a shared steps object, click Tests > Libraries of Shared Steps in the menu. For a manual test,
click Tests > Details View in the menu.
2. Select the shared steps object in the Libraries tree, or the manual test in the Tests tree.
3. Click the History tab.
4. Select the two versions you want to compare with CTRL + CLICK.
5. Right click on the selection.
6. Select Compare Versions. The Compare Versions dialog box opens, displaying all the added,
changed, and removed content.
Note: Use the arrows to change the version numbers and compare additional versions.
Reverting to a Previous Version
To undo changes to a shared steps object or a manual test, revert to a previous version.
To revert a shared steps object or a manual test to a previous version:
1. For a shared steps object, click Tests > Libraries of Shared Steps in the menu. For a manual test,
click Tests > Details View in the menu.
2. Select the shared steps object in the Libraries tree, or the manual test in the Tests tree.
3. Click the History tab.
4. Right-click on the version to which you want to revert the shared steps object to.
5. Click Revert to Version <ID>.
6. The shared steps object or manual test is reverted to the selected version and a new version is created
in the History page. Attachments, parameters, and data sets are not reverted for manual tests.
Library History Page
The History page displays the history of the selected shared steps object.
The History page includes an entry for each version of the selected shared steps object, and allows you to
create new versions, view version details, revert to a previous version, and view the differences between
versions.
To display only versions in the History page, and no other entries, right click on the Version column,
select Filter and type 0 in the > text box.
The page shows the following items for each listed entry:
Item
Description
Actions
Only for version entries. The actions you can perform on
a selected version are View Version, Delete Version
and Revert to Version.
Version
Only for version entries. The version of the shared steps
object.
Comment
A comment on the changes.
Created On
Date and time this history entry was created.
Created By
Name of the user who created this history entry.
Windows Script Host Tests
Windows Script Host (WSH) is part of the Windows platform and creates an environment for hosting
scripts. When a script is to be run at the execution server, WSH plays the role of host. It makes objects and
Silk Central 15.5
| 139
services available for the script and provides a set of guidelines within which the script is executed. Among
other things, WSH manages security and invokes the appropriate script engine.
The following online WSH resources might be of value to you:
•
•
•
http://labmice.techtarget.com/scripting/WSH.htm
http://www.winguides.com/links.php?guide=scripting
Downloadable Script Interpreters: http://aspn.activestate.com/ASPN/
Supported Script Languages
WSH is language-independent for WSH-compliant scripting engines. Natively, the Windows platform
supports Visual Basic Scripts, with file extension .vbs, and scripts written in the Java Script language, with
file extension .js.
For other scripting languages, a dedicated script interpreter must be installed on the execution server. For
example, if you install a Perl interpreter on an execution server, this will register a Perl scripting engine at
the WSH environment for the extension .pls. Whenever a file with extension .pls is passed to the WSH
tool, with the executable cscript.exe, it will invoke the appropriate interpreter because of the file
extension. So the client of WSH, in this case the Silk Central Execution Server, does not need to know
about the installation of the Perl interpreter.
Note: After installing a script interpreter, for example Active Perl, try to execute a script locally on the
execution server by calling the WSH command line tool with a sample script before executing the
script in Silk Central. To do so, open a command shell on the execution server and type cscript
<somescript>, where <somescript> is the path to a script of your choice that is available on your
execution server. This is exactly what Silk Central will call when executing a WSH test on an
execution server. If the script is executed, then the scripting engine has been registered successfully.
The following scripting languages are WSH compatible:
Scripting Language
File Extension
Perl
.pls
Python
.py, .pyw
REXX
.REXX
TCL
.tcl
WSH Test Properties
140
Property
Description
Script
You can define any file where a script engine is registered for the script language the file
contains. Script files under source control are deployed automatically to execution servers,
comparable to test sources for other test types.
Switches
You can enter and pass the following settings to cscript.exe during the execution of the
test:
| Silk Central 15.5
//B
Batch mode suppresses all non-command-line console UI requests from the
script. We recommended that you use this option to prevent a script from
waiting for user input during unattended executions at the execution server.
//U
We recommend to that you use unicode for redirected I/O from the console.
//T:nn
Time-out, in seconds. The maximum time the script can run, by default = no
limit. This option is used to prevent excessive execution of scripts. It sets a
timer. When execution time exceeds the specified value, Cscript interrupts
the script engine using the IActiveScript::InterruptThread
method and terminates the process. There is a callback hook. If the time-out
Property
Description
is invoked, the OnTimeOut function is called to permit cleanup. Although it
is possible to create infinite loops using this feature, it is more useful than
harmful.
//logo
Displays an execution banner at execution time that is visible at the
beginning of the log.txt log file. This is the default setting.
//nologo
Prevents display of the execution banner at execution time.
//D
Enables active debugging.
//E:engine
Use the engine to execute a script.
//Job:xxxx
Execute a WSF job.
//X
Execute the script in debugger.
Using Parameters in WSH Tests
Parameters that are defined for a WSH test automatically add a name and value pair to the command line
as an additional argument and set the parameters as environment variables for the called process. This
functionality allows you to access all parameters defined for your test within the WSH script.
For example a WSH test is defined with myscript.js as script and //B as switch. Additionally the test
requires a parameter called IPAddress with the value 192.168.1.5 and another parameter called Port
with the value 1492. The resulting command line for the WSH execution in this example is:
csript myscript.js //B IPAddress=192.168.1.5 Port=1492
Viewing Information Returned from WSH
To collect results of a WSH execution, the WSH script must generate a file called output.xml in the
current working directory of the WSH test. All files residing in this directory are stored in the database and
are downloadable through the list of files for the test execution. Files are excluded from storage when their
extensions are defined under the file extensions to ignore in results property in the Projects area.
Note: The current working directory is dynamically created for each WSH execution. Do not use an
absolute path when creating the file. Any relative path used will correctly refer to the current working
directory.
Any information that a script writes to the WSH standard output goes into the log.txt text file that resides
in the current working directory. This file is stored in the database and can be viewed as it is included in the
file list of the test execution.
The following example shows how to print log information from a script:
WScript.Echo "This info will be written to the log.txt file"
The XML structure of output.xml begins with an element ResultElement that defines an attribute named
TestItem, which specifies the name of the ResultElement.
The ResultElement must contain an element named ErrorCount, optionally an element named
WarningCount, and a list of Incident elements.
The ErrorCount and WarningCount elements must contain a positive number or zero. The ErrorCount and
WarningCount of the top-level ResultElement are used for evaluating success conditions, which determine
if a test has passed or failed. The XML file might contain additional elements that are not visible in the Silk
Central GUI. The output.xml file is however stored in the database and is viewable as it is included in
the file list of the executed test.
Silk Central 15.5
| 141
The Incident element represents an event that happened during the execution of the WSH test. Message
and Severity are shown in the messages list of test executions in the Silk Central GUI. An Incident element
must contain a Message and a Severity element.
The Severity element must hold one of the following values:
•
•
•
•
Info
Warning
Error (or Exception)
Failure
You can store additional information in the result file. The ResultElement may contain any number of subResultElements, so information can be easily grouped. Sub-ResultElements make the result file easier to
read. For compatibility reasons related to unit tests, JUnit and NUnit, ResultElement can be named
TestSuite or Test.
The ResultElement may contain the following additional elements:
•
•
•
•
•
FailureCount, which is treated the same way as error count
RunCount, if a test is run multiple times
Timer, for example for the duration of the test
WasSuccess, for compatibility with NUnit result files
Asserts, for compatibility with NUnit result files
The Incident element may contain a list of Detail elements.
The Detail element represents detailed information about an Incident. It must define a TestName element
and an Info element. The TestName is used to give detailed information about where the Incident
happened. The Info element holds detailed information about the Incident, for example a stack trace.
Note: Up through Silk Central 8.1, the value of the Message and Info elements had to be URL
encoded (ISO-8859-1). Since version 8.1.1, URL encoding is no longer allowed.
Sample Result File
<ResultElement TestItem="WshOutputTest">
<ErrorCount>1</ErrorCount>
<WarningCount>1</WarningCount>
<Incident>
<Message>some unexpected result</Message>
<Severity>Error</Severity>
<Detail>
<TestName>function main()</TestName>
<Info>some additional info; eg. stacktrace</Info>
</Detail>
</Incident>
<Incident>
<Message>some warning message</Message>
<Severity>Warning</Severity>
<Detail>
<TestName>function main()</TestName>
<Info>some additional info; eg. stacktrace</Info>
</Detail>
</Incident>
</ResultElement>
Java Script Sample
The following script was used to generate the sample result file. To try this script save it
with the extension .js.
function dumpOutput(dumpFile)
142
| Silk Central 15.5
{
dumpFile.WriteLine("<ResultElement TestItem=\"WshOutputTest
\">");
dumpFile.WriteLine(" <ErrorCount>1</ErrorCount>");
dumpFile.WriteLine(" <WarningCount>1</WarningCount>");
dumpFile.WriteLine(" <Incident>");
dumpFile.WriteLine("
<Message>some unexpected result</
Message>");
dumpFile.WriteLine("
<Severity>Error</Severity>");
dumpFile.WriteLine("
<Detail>");
dumpFile.WriteLine("
<TestName>function main()</
TestName>");
dumpFile.WriteLine("
<Info>some additional info; eg.
stacktrace</Info>");
dumpFile.WriteLine("
</Detail>");
dumpFile.WriteLine(" </Incident>");
dumpFile.WriteLine(" <Incident>");
dumpFile.WriteLine("
<Message>some warning message</
Message>");
dumpFile.WriteLine("
<Severity>Warning</Severity>");
dumpFile.WriteLine("
<Detail>");
dumpFile.WriteLine("
<TestName>function main()</
TestName>");
dumpFile.WriteLine("
<Info>some additional info; eg.
stacktrace</Info>");
dumpFile.WriteLine("
</Detail>");
dumpFile.WriteLine(" </Incident>");
dumpFile.WriteLine("</ResultElement>");
}
function main()
{
var outFile;
var fso;
fso = WScript.CreateObject("Scripting.FileSystemObject");
outFile = fso.CreateTextFile("output.xml", true, true);
outFile.WriteLine("<?xml version=\"1.0\" encoding=\"UTF-16\"?
>");
dumpOutput(outFile);
outFile.Close();
WScript.Echo("Test is completed");
}
main();
WScript.Quit(0);
Visual Basic Script Sample
The following Visual Basic script also generates the sample result file, and saves it as
Output.xml. To try this script save it with the extension .vbs.
WScript.Echo "starting"
Dim outFile
Dim errCnt
Dim warningCnt
outFile = "output.xml"
errCnt = 1 ' retrieve that from your test results
warningCnt = 1 ' retrieve that from your test results
Silk Central 15.5
| 143
Set FSO = CreateObject("Scripting.FileSystemObject")
Set oTX = FSO.OpenTextFile(outFile, 2, True, -1) ' args: file,
8=append/2=overwrite, create, ASCII
oTX.WriteLine("<?xml version=""1.0"" encoding=""UTF-16""?>")
oTX.WriteLine("<ResultElement TestItem=""PerlTest"">")
oTX.WriteLine(" <ErrorCount>" & errCnt & "</ErrorCount>")
oTX.WriteLine(" <WarningCount>" & warningCnt & "</
WarningCount>")
oTX.WriteLine(" <Incident>")
oTX.WriteLine("
<Message>some unexpected result</Message>")
oTX.WriteLine("
<Severity>Error</Severity>")
oTX.WriteLine("
<Detail>")
oTX.WriteLine("
<TestName>function main()</TestName>")
oTX.WriteLine("
<Info>some additional info; eg.
stacktrace</Info>")
oTX.WriteLine("
</Detail>")
oTX.WriteLine(" </Incident>")
oTX.WriteLine(" <Incident>")
oTX.WriteLine("
<Message>some warning message</Message>")
oTX.WriteLine("
<Severity>Warning</Severity>")
oTX.WriteLine("
<Detail>")
oTX.WriteLine("
<TestName>function main()</TestName>")
oTX.WriteLine("
<Info>some additional info; eg.
stacktrace</Info>")
oTX.WriteLine("
</Detail>")
oTX.WriteLine(" </Incident>")
oTX.WriteLine("</ResultElement>")
Test Export, Update, and Import
The Silk Central/Excel integration allows you two distinct options for modifying your tests. These include:
•
•
Export and update: this option allows you to create your tests in Silk Central, export to Excel to make
the changes, and then update them back into Silk Central.
Import: this options allows you to create tests in excel and then import them into Silk Central.
In both scenarios, you will need to a mapping file to synchronize the columns between the two products.
Note: Currently, Silk Central supports only Microsoft Excel 2007 (.xslx) files for import, and the import
is limited to manual tests.
Export, Update, and Import Rules
The following business rules apply during the export-update and import processes:
General Rules
•
•
•
•
•
•
144
| Silk Central 15.5
If a test row in Excel does not have a TestID or a ParentNodeID, then it is considered to be a new
test and is created in a new folder under the test container from which the import functionality was
executed.
You can add existing TestIDs to update tests on update, and you can add existing SharedStepIDs to
add new shared steps on import/update.
Data-driven tests are not supported with export-update and import functionality. Enabled data-driven
tests will not be exported.
New automated tests are not added during import and update, but existing ones are modified during an
update.
If a test is moved to a different folder hierarchy in Excel, the move is ignored during update.
If a test is missing in Excel (it was deleted), the test is not deleted during update.
•
•
•
•
•
If a test is moved from the Silk Central container after an export, no changes will occur to it during the
update.
Import uses Parent column for (new) folder names.
Update uses ParentID column for folders for new tests (or creates a folder with date/time syntax if not
specified).
Cannot use A-Z as customized column name….these are reserved for Excel's A-Z, which can be used
in mapping.
Cannot have blank rows in Excel.
Shared steps
•
•
•
•
Are added for import and update.
Are deleted and reordered for update.
Will not be updated.
If the Excel SharedStepID does not exist in Silk Central, it will not be added.
Test Export and Update
This section describes how to export and to update tests from Microsoft Excel into Silk Central.
Use the export-update to Excel functionality if you want to perform bulk edits on existing tests.
Note: The following fields are not editable in Excel: Status, TestType, StepID, and StepOrder.
Export and Update Overview
The following is a high level overview for exporting and updating:
•
•
•
•
•
Select the container or folder.
Export to Excel.
Make changes in Excel.
Verify/create the mapping file.
Update back into Silk Central.
Exporting a Test to Excel
1. In the menu, click Tests > Details View .
2. Right click a test container or test folder that includes the tests that you want to export.
3. Select Export to Excel... The Export Test to Excel File dialog box displays.
4. Select the mapping file from the Choose Mapping File list box.
The default mapping file is TestPropertiesDefaultMapping.xml. For information about creating
customized mapping files, see Test Mapping File.
5. Optional: Click Edit Mapping to edit the test mapping file.
6. Click OK.
7. Click Save on the File Download dialog box to save the file.
Test information is saved into the Excel file for you to edit.
Updating a Test from Excel
Before you can update a test from Excel, you first need to export the test from Silk Central.
1. In the menu, click Tests > Details View .
2. Right click a test container or folder that includes the tests that you want to update.
Silk Central 15.5
| 145
3. Select Update from Excel... The Update Test from Excel File dialog box opens.
4. Select the mapping file that you want to use from the Choose Mapping File... list.
5. To edit the mapping file, click Edit Mapping.
6. Click Browse to select the Excel file in the Test File (.xlsx) field.
7. Click OK.
Test Import
This section describes how to import tests from Microsoft Excel into Silk Central.
Silk Central enables you to import tests from Microsoft Excel (Excel) into any container or folder in the
Tests area and then maintain and execute all included tests in Silk Central. The import is a one-time event.
Before you can import tests, you need to create a test file in Excel. For more information, see Test File.
Silk Central uses the information stored in the Excel file and in a mapping file to determine what data to
store. Silk Central uses a mapping file to map the tests in the Excel file to the tests in the Tests area. A
default mapping file named TestPropertiesDefaultMapping.xml is preselected for the import. You
can choose your own customized mapping file to map your tests. For more information about mapping
files, see Test Mapping File.
Importing a Test from an Excel File
To import a test from an Excel file into the Tests area:
1. In the menu, click Tests > Details View .
2. In the Tests tree, right-click the folder or container that you want to use as the parent node of the
imported test and choose Import from Excel File. The Import Test from Excel File dialog box opens.
3. Select the mapping file from the Choose Mapping File list box.
The default mapping file is TestPropertiesDefaultMapping.xml. For information about creating
customized mapping files, see Test Mapping File.
4. Optional: Click Edit Mapping to edit the test mapping file.
5. Either type the fully qualified path of the test file into the Test File text box or click Browse to search for
the test file.
6. Click OK. A message informs you if the import was successful.
7. Click OK to close the message.
Test File
You can create a test file in Excel to import tests into Silk Central. In the test file, you can define all tests
and test steps, along with their properties, attributes, and parameters.
To map the tests in your test file to the tests in Silk Central, use an XML mapping file. The mapping file
defines the location of the elements in your test file to Silk Central. You can give the items included in the
test file any name you like, as long as you map them appropriately in your mapping file. For more
information about mapping files, see Test Mapping File.
Define the following items for a test and a test step in the test file:
146
Item
Description
Test
Define the name of the test. Optionally, you can also define a description for the test, the
estimated duration of the test, and the path to the test from the root folder. If you define no
path, the test is added directly into the root folder. Additionally, you can define properties,
attributes, and parameters for the test.
| Silk Central 15.5
Item
Description
Test
Step
Define the name of the test step. Optionally, you can also define the action that is performed in
the test step, and the result that you expect of the test step. Additionally, you can define test
step properties for the test step.
Note: Currently, Silk Central supports only .xslx files for import, and the import is limited to manual
tests.
Mapping File
The mapping file is used during the update process of export-update and during the import process when
data is coming into Silk Central from Excel.
Editing the Test Mapping File
To edit the test mapping file:
1. In the menu, click Tests > Details View .
2. In the Tests tree, right-click the folder or container that you want to use as the parent node of the
imported test and choose Import from Excel File. The Import Test from Excel File dialog box opens.
3. Click Edit Mapping. The Edit Mapping dialog box opens.
4. Edit the variables of the test file in the text boxes.
Note: For information on the variables included in the test file, see Test File.
5. Optional: Edit the name of the mapping file.
6. Click OK to save your changes or click Cancel to cancel your changes.
Test Versioning
Silk Central creates new versions of tests during the import and update processes.
When you perform an update or import from Excel into Silk Central, two new versions of the test tree are
created. The versioning process will record a snapshot before and after the import/update process.
Export-Update
There are two versioning options during the export-update process:
•
•
Tests will contain default comments to note that they were updated from excel if they are added or
modified.
You can also manually enter your own comment on the Update Test from Excel File dialog box during
the update. This will apply for all of the test cases.
Import
Tests will contain default comments of Created.
Integrating Silk Central into Rally
To use the project management tool Rally with Silk Central, you have to integrate Silk Central into Rally.
A mashup is shipped with Silk Central, that enables you to display user-story related test-coverage
information from Silk Central in Rally. You can link each test in Silk Central to one or more user stories in
Rally. To link tests to a user story, assign an attribute with the value of the formatted user-story ID in Rally
to each test.
Silk Central 15.5
| 147
Creating a Custom HTML App in Rally
Create a custom app in Rally using HTML or Javascript to display user-story related test-coverage
information.
To create a custom HTML app:
1. Navigate to the tab in Rally where your custom app should reside.
2. Click Customize Page and click Add App. The App Catalog displays.
3. Click Custom HTML under Custom and click Add This App.
4. Enter a title and switch to Silk Central.
5. In the menu, click Help > Tools .
6. Click Rally Iteration Status Mashup and copy the HTML code.
7. Switch back to Rally and paste the HTML code into the HTML field.
8. Configure the script in the field to match your Silk Central environment:
•
•
•
•
•
Check if the valid script source is set, for example <script type="text/javascript"
src="http://localhost:19120/silkroot/script/sctm-toolkit.js"></script>.
Check if the valid URL for Silk Central is set, for example var SCTM_URL = "http://
localhost:19120/".
Check if a valid Silk Central project ID is set, for example var SCTM_PROJECT_ID = 0.
Check if a valid attribute name is set, for example var SCTM_ATTRIBUTE_FOR_RALLY_US =
"rallyattr".
Make sure usage of the FormattedID from Rally is enabled, var USE_FORMATTED_ID = true.
9. Click Save. Your custom HTML app in Rally is created.
Linking User Stories from Rally to Tests
To link Rally user stories to Silk Central tests:
1. Select the project in Silk Central that contains the tests you want to link the Rally user stories to.
2. In the menu, click Project:<Project Name> > Project Settings .
Note: If you have not selected a project, a warning message opens, asking you to select a project.
Select the project for which you want to define the setting.
3. Click the Attributes tab.
4. Click New Attribute. The New Attribute dialog box displays.
5. Type rallyattr in the Name field.
6. Select Text from the Type list.
7. Click OK to create the new attribute.
8. Assign the new attribute to each test that you want to link user stories from Rally to.
9. Set the value of the attribute to be the value of the FormattedID of the appropriate Rally user story for
each test. If you assign multiple stories to a single test, separate the IDs with a comma and put no
whitespace characters between them. For example, US10,US12,US14.
Screen Capturing
You can enable screen capturing for a test element or an execution plan. The screenshots are added to
the result files in the Files page and the Timeline page of the Test Run Results dialog box. You can then
analyze the screenshots, for example if errors have occurred during tests.
The Screen Capturing setting in the Deployment page of an execution plan can override the setting for a
specific test element, which is included in the execution plan.
148
| Silk Central 15.5
Enabling Screen Capturing
To enable screen capturing for a test:
1. In the menu, click Tests > Details View .
2. In the Tests tree, select a container, folder, or test.
3. Click the Parameters tab.
4. Click Add Custom Parameter. The Set Custom Parameter dialog box opens.
5. In the Name text box, type captureScreen.
6. From the Type list box, select String.
7. In the Value text box, type one of the following:
•
onError, if you want to add a screenshot to the result files when an error occurs during the
execution of the execution plan.
Any other string or nothing, if you do not want to add a screenshot to the result files.
•
Video Capturing
You can enable video capturing for a test element or an execution plan. The videos are added as a WMV
video file to the result files in the Files page of the Test Run Results dialog box. You can then analyze the
videos, for example if errors have occurred during tests.
The Video Recording setting in the Deployment page of an execution plan can override the setting for a
specific test element, which is included in the execution plan.
Note: Video capturing is currently enabled only for execution servers with Microsoft Windows as their
operating system. To use video capturing on a Windows Server 2008 execution server, you need to
install the following server features:
•
•
Desktop Experience
Quality Windows Audio Video Experience
To use video capturing on a Windows Server 2012 execution server, you need to install the following
server features:
•
•
Desktop Experience
Media Foundation
Attention: The process of capturing videos is very CPU-intensive. Use this functionality only when
needed. To use this functionality you require a system with sufficient CPU power, for example a
system with multiple CPUs.
Capturing a video for each individual test case in a suite is supported out of the box for JUnit 4 tests and
Silk Test Classic Plan tests. To use this feature for other test types, use the methods in the
TestCaseStartFinishSocketClient interface. For additional information, see Indicating Start and
Finish for Video Capturing.
Enabling Video Capturing
To enable video capturing for a test:
1. In the menu, click Tests > Details View .
2. In the Tests tree, select a container, folder, or test.
3. Click the Parameters tab.
4. Click Add Custom Parameter. The Set Custom Parameter dialog box opens.
5. In the Name text box, type recordVideo.
Silk Central 15.5
| 149
6. From the Type list box, select String.
7. In the Value text box, type one of the following:
•
•
•
always, if you want to add a video to the result files on every execution of the execution plan.
onError, if you want to add a video to the result files when an error occurs during the execution of
the execution plan.
Any other string or nothing, if you do not want to add a video to the result files.
Execution Planning
This section explains how to manage execution plans, including assigning tests, scheduling test runs,
setting up dependencies, configuring dynamic hardware-provisioning with keywords, and configuring a
deployment environment.
The Execution Planning area enables you to maintain control over test executions during development
and testing. The area enables you to configure execution plans, schedule execution plans, assign tests to
execution plans, set up execution plan dependencies, configure execution-server deployment, and
configure dynamic hardware-provisioning with keywords. Execution plans are displayed, organized, and
maintained through a hierarchical tree structure, the Execution Plans tree. Each execution plan may have
any number of child tests associated with it. The Execution Plans tree enables you to organize execution
plans within folders, in any number of hierarchy levels.
Execution Planning Toolbar Functions
Execution Planning > Details View
Execution Planning > Document View
The executions toolbar provides important commands for managing your execution plans.
Note: Some commands in the execution planning toolbar are also available through context menus in
the Execution Plans tree.
The following commands are included in the execution planning toolbar:
Command
150
Icon
Description
Details View
Displays the Details View, which enables you to drill deeply into the
properties of a single element of the Execution Plans tree.
Document View
Displays the Document View, which shows selected properties of all
executions in a single view.
New Child Folder
Add a new folder to the selected project or folder. This command is
disabled for execution plans that are assigned to a testing cycle.
New Child Testing Cycle
Add a new testing cycle to the selected project or folder.
New Child Configuration
Suite
Add a new configuration suite to the selected project or folder. This
command is disabled for execution plans that are assigned to a
testing cycle.
New Child Execution Plan
Add a new execution plan to the selected project, folder, or
configuration suite. This command is disabled for execution plans that
are assigned to a testing cycle.
Edit
Open the selected element of the Execution Plans tree for editing.
| Silk Central 15.5
Command
Icon
Description
Delete
Deletes the selected element of the Execution Plans tree. This
command is disabled for execution plans that are assigned to a
testing cycle.
Cut
Cut an element of the Execution Plans tree and save it to the
clipboard. This command is disabled for execution plans that are
assigned to a testing cycle.
Copy
Copy an element of the Execution Plans tree to the clipboard. This
command is disabled for execution plans that are assigned to a
testing cycle.
Paste
Paste an element from the clipboard to the Execution Plans tree.
This command is disabled for execution plans that are assigned to a
testing cycle.
Paste as Child
Paste an element from the clipboard as a child to the currently
selected element of the Execution Plans tree. This command is
disabled for execution plans that are assigned to a testing cycle.
Run
Start the execution of the tests that are assigned to the execution
plan. This command is disabled for execution plans that are assigned
to a testing cycle.
New Filter
Create a new custom filter for the Execution Plans tree.
Filters
Lists the available filters for the Execution Plans tree
Edit Filter
Edit the currently selected custom filter.
Delete Filter
Delete the currently selected custom filter.
Copy Filter
Copy the currently selected custom filter.
Download as PDF
This function is enabled only in the Document View. The action
generates a PDF that includes all currently visible nodes of the
Execution Plans tree.
Execution Planning Document View
Execution Planning > Document View
The Execution Planning area offers two views of execution properties: Document View and Details
View. Document View provides a high-level, read-only view of the defined properties and characteristics
of the latest run of all execution plans, folders, and configuration suites in the selected project. Use the
Document View to plan the execution of your execution plans. You can use filters to obtain an executionduration estimate of the filtered execution-plan subset.
The Document View displays the following columns for a selected element in the Execution Plans tree:
Column
Description
Status
The cumulated test statuses of the latest run of the execution plan, or
the cumulated test statuses of all contained execution plans, for a
folder or configuration suite. If you apply a filter to the Execution
Plans tree, the test status totals are based on the filtered execution
plans only.
Silk Central 15.5
| 151
Column
Description
Assigned Tests
Total number of assigned tests. If you apply a filter to the Execution
Plans tree, the amount of the assigned tests is based on the filtered
execution plans only.
Build
Build that is used when the execution plan is executed.
Version
Version that is used when the execution plan is executed.
Product
Product that the associated test container is based on.
Priority
For automated execution plans, when more than one execution plan
is queued but only one execution server is available, the Priority
determines which execution plan is executed first.
Last Execution
Last time the execution plan was started.
Planned Time
Total planned time for all manual tests. If you apply a filter to the
Execution Plans tree, the planned time is based on the filtered
execution plans only.
Duration
Duration of the latest run of an execution plan, or in case of a folder
or configuration suite, the cumulated durations of the latest runs of all
contained execution plans. If you apply a filter to the Execution
Plans tree, the duration is based on the filtered execution plans only.
Next Execution
Next scheduled execution.
Test Container
Test container containing the tests that can be assigned to this
execution plan.
Note: Execution plan totals accumulate to the parent level, for all currently displayed execution plans.
If you apply a filter to the Execution Plans tree, the execution plan totals are based on the filtered
execution plans only. For example, the execution plan totals include execution runs from all child
execution plans that are selected with the filter, and the project totals include execution runs from all
execution plans that are selected with the filter.
Manual Execution Planning
To access this page, click Execution Planning > Manual Execution Planning.
A typical challenge of planning your manual testing is that there are too many tests and not enough
resources. It is important to execute the tests with the most benefit. To support you here, the Manual
Execution Planning page is divided into two views:
Test Selection
Select manual tests and schedule them in testing cycles.
Test Assignment Plan the execution of manual tests in detail. Determine which manual tester has to
execute which tests in a certain testing cycle.
To access the Test Selection view, click Execution Planning > Manual Execution Planning.
To access the Test Assignment view, click Test Assignment on the top right of the Manual Execution
Planning page. To get back to the Test Selection view, click Test Selection on the top left.
Test Selection
The Test Selection view is the initial view shown when you enter the Manual Execution Planning page.
Here you can narrow down the list of manual tests with filters and quality goals, create and edit testing
cycles, and assign the filtered manual tests to testing cycles.
The Test Selection view is divided into three areas:
152
| Silk Central 15.5
•
•
•
The Filter Criteria area on the left side. With the filters you can narrow down the tests shown in the
next area.
The Matching Tests area in the middle. This list shows all available tests. When you apply filters, just
the filtered tests are shown.
The Testing Cycles area on the right side. Here you can assign tests from the list in the middle to a
testing cycle.
Filter Criteria
The Filter Criteria area has three boxes:
Filter Summary Lists all filters applied to the page.
Click
Tests Filter
next to a filter to remove the filter from the list.
Contains a list with all test filters of the current project.
Select a test filter. The filtered tests are shown in the Matching Tests area.
Quality Goals/
Assignment
Progress
Shows a list of the quality goals in the project and the values of the quality goals.
Select one or more quality goal values. The filtered tests are shown in the Matching
Tests area.
Each quality goal value has an Assignment Progress bar. The bar shows the number
of tests that are already assigned and the number of tests that are not yet assigned to
an execution plan.
Attention: These numbers include manual and automated tests.
Move the mouse over a bar to show:
•
•
•
•
The number of Total matching tests.
The number of Tests to reach goal.
The number of Already assigned tests.
The number of Not yet assigned tests.
If Already assigned tests is greater than Tests to reach goal an exclamation point
appears. This means that more tests are assigned than required.
Attention: These numbers include manual and automated tests.
Note: You can only select one single test filter and one goal value per quality goal.
If you select multiple quality goal values (from different quality goals) or a quality goal value and a test filter,
only those tests that match all criteria are shown in the Matching Tests area.
Matching Tests
The Matching Tests area shows the manual tests that match the selected filter criteria. By default, no
quality goals or filters are selected so all manual tests display in the grid.
Select filters and quality goal values in the Filter Criteria area to narrow down the list of manual tests.
The caption of the Matching Tests grid shows:
•
•
The number of the currently selected tests.
The total planned time of the currently selected tests.
You can perform the following actions in the grid:
Silk Central 15.5
| 153
•
•
•
•
•
•
To assign a manual test to a testing cycle, drag the test onto the header of a testing cycle.
To assign a manual test to a manual tester, drag the test onto the tester in the testing cycle.
Right-click on a column to sort, to group and to filter manual tests, to add or remove columns and to
reset filters or the view.
Right-click on a manual test to show the test details or to print the manual test.
You can select multiple tests with Ctrl+Click or Shift+Click.
You can multi-assign tests to different testing cycles/testers. The column Assigned shows a green
check mark if the test is assigned at least once.
•
Click
to show the test details.
•
Click
to show the test in the Tests Details View.
Testing Cycles
The Testing Cycles area lists all testing cycles of the current project. It is the central part of the Manual
Execution Planning page and displays on both the Test Selection and on the Test Assignment view.
The testing cycles are ordered chronologically.
Click New Testing Cycle on the top of the Testing Cycles area to create a new testing cycle. Click Show/
Hide Testing Cycles if you want to hide testing cycles. Hiding testing cycles helps you to keep the
Testing Cycles area tidy and to enhance the performance. It is especially useful when you have lots of
testing cycles.
In the header of a testing cycle, click
•
•
•
•
•
•
•
•
•
to perform the following actions:
Edit Testing Cycle
Edit Assigned Testers
Edit Milestones
Import Tests from Execution Plan
Duplicate Testing Cycle
Hide Testing Cycle
Delete Testing Cycle
Start Testing Cycle
Finish Testing Cycle
In a testing cycle, click on a manual tester to display the assigned tests in the Assigned Tests area.
Click on the header of a testing cycle to select it. The tests that are assigned to the testing cycle (but not to
a specific manual tester) are listed in the Assigned Tests area.
If the Assigned Tests area is not displayed, click Test Assignment on the top right.
The testing cycle boxes show:
•
•
•
•
•
•
154
| Silk Central 15.5
The name of the testing cycle.
The start and end dates.
A burn-down chart that visualizes the testing progress. It shows how likely it is that all tests will be
finished by the end of the testing cycle. Move your mouse over one of the bars to show the number of
tests that are not completed.
The percentage of the capacity that is covered. This percentage is calculated as follows: The sum of
planned time of the assigned tests divided by the capacity sum of the manual testers. This percentage
displays both for the testing cycle and each individual tester. If a testing cycle or a manual tester is
overloaded with tests, the green box turns into red. Move the mouse over this percentage to get
detailed information.
The number of assigned tests and the completed tests for both the testing cycle and each individual
tester. Move the mouse over these numbers to get detailed information.
The manual testers that are assigned to each testing cycle. Click on the number of the assigned testers
to expand or collapse the detailed information.
Creating Testing Cycles
Note: You can also create new testing cycles in the Execution Planning Details View and
Document View.
To create a testing cycle:
1. In the menu, click Execution Planning > Manual Execution Planning. The Manual Execution
Planning page displays.
2. In the Testing Cycles area, click New Testing Cycle. The New Testing Cycle dialog box appears.
3. Enter a Name for the testing cycle.
4. Optionally enter a Description.
5. Click
next to Start date to set the start date of the testing cycle.
6. Click
next to End date to set the end date of the testing cycle.
7. In hh:mm format, enter the amount of time you want to provide for the testing cycle (Capacity).
This capacity will be replaced by the sum of the tester capacities as soon as you add a tester to the
testing cycle.
8. Click OK. The testing cycle is added to the Testing Cycles area.
Adding Manual Testers to a Testing Cycle
After you have created a testing cycle, you may want to add manual testers and capacity to it.
You can also add manual testers in the Execution Planning Details View. In the menu, click Execution
Planning > Details View. Click a testing cycle on the left side and click Add/Remove Testers on the
Properties page.
To add manual testers to a testing cycle:
1. In the menu, click Execution Planning > Manual Execution Planning. The Manual Execution
Planning page displays.
2. In the header of a testing cycle in the Testing Cycles area, click
Edit Assigned Testers dialog box appears.
> Edit Assigned Testers. The
3. Click Add/Remove Testers. The Add/Remove Testers dialog box appears.
4. Select the user group you want to use from the Available list.
5. Select one or more users from the Available list.
You can select multiple users with CTRL + CLICK or SHIFT + CLICK.
6. Click Add or Add All to add users to the Selected list.
7. Click OK. The users are added to the list of testers.
8. Define a capacity for each user of the testing cycle in the Capacity field using the hh:mm format.
9. Click Close. The testing cycle Capacity is updated with the cumulative value of the capacity for each
manual tester.
Editing Assigned Testers
You can add/remove manual testers to/from testing cycles and define the capacity for each individual
tester.
To edit assigned testers:
1. In the menu, click Execution Planning > Manual Execution Planning. The Manual Execution
Planning page displays.
2. In the Testing Cycles area, in the header of a testing cycle, click
Edit Assigned Testers dialog box appears.
> Edit Assigned Testers. The
Silk Central 15.5
| 155
3. Click Add/Remove Testers. The Add/Remove Testers dialog box appears.
4. Select the user group you want to use from the Available list.
5. Add or remove testers:
•
Select one or more users in the Available list and click Add or Add All.
•
Select one or more users in the Selected list and click Remove or Remove All.
You can select multiple users with CTRL + CLICK or SHIFT + CLICK.
6. Click OK. The users are now added to or removed from the Assigned Testers list.
7. Define a capacity for each user of the testing cycle in the Capacity field using the hh:mm format.
8. Click Close. The testing cycle Capacity is updated with the cumulative value of the capacity for each
manual tester.
You can also edit assigned testers in the Details View. In the menu, click Execution Planning > Details
View. Click a testing cycle on the left side and click Add/Remove Testers on the Properties page.
Adding Milestones
A milestone is a target that must be reached by a specified date. Milestones are useful when the capacity
of the testers is not spread evenly over the testing cycle. These milestones are represented by marks on
the burn-up charts (on the dashboard) dispersed according to the date and capacity.
The following is an example of milestones within the context of a testing cycle:
•
•
•
At least 20 percent of the tests must be completed by September 13th.
At least 50 percent of the tests must be completed by September 15th.
100 percent of the tests must be completed by September 19th (end of the testing cycle).
To add a milestone:
1. In the menu, click Execution Planning > Manual Execution Planning. The Manual Execution
Planning page displays.
2. In the Testing Cycles area, in the header of a testing cycle, click
Milestones dialog box appears.
> Edit Milestones. The Edit
3. Click Add Milestone, define a due date and a percentage of completed tests, and click OK.
4.
To edit a milestone, click
. To delete a milestone, click
.
5. Add additional milestones and click Close.
Note: If you duplicate a testing cycle or if you edit the start and end date, make sure the milestones
are still within the defined period of the testing cycle.
Assigning Tests to Testing Cycles
To assign tests to a testing cycle:
1. In the menu, click Execution Planning > Manual Execution Planning. The Manual Execution
Planning page displays.
2. Click a test in the Matching Tests area and drag it onto the header of a testing cycle.
You can select multiple tests with Ctrl+Click or Shift+Click.
The tests are added to the testing cycle.
Note: You can assign a test several times to different testing cycles/testers. The column Assigned in
the Matching Tests area shows a green check mark if the test is assigned at least once.
156
| Silk Central 15.5
Assigning Tests to Manual Testers
Note: Before you can assign tests to manual testers, you need to add manual testers to the testing
cycle.
Assign tests to manual testers to distribute the workload among the testers.
You can assign a test several times to different testing cycles/testers. The column Assigned in the
Matching Tests area shows a green check mark if the test is assigned at least once.
You can also assign tests to manual testers in the Test Assignment view. Click Test Assignment on the
top right. Click a test in the Assigned Tests area and drag it onto a manual tester in a testing cycle.
To assign tests to manual testers:
1. In the menu, click Execution Planning > Manual Execution Planning. The Manual Execution
Planning page displays.
2. In a testing cycle, click Tester(s) assigned to expand the list of manual testers.
3. Click a test in the Matching Tests area and drag it onto a manual tester in a testing cycle.
You can select multiple tests with Ctrl+Click or Shift+Click.
The tests are added to the manual tester.
Importing Tests from Execution Plan
You need the Manage testing cycles and configurations permission to import tests from an execution
plan.
To import tests from an execution plan:
1. In the menu, click Execution Planning > Manual Execution Planning. The Manual Execution
Planning page displays.
2. In the Testing Cycles area, in the header of a testing cycle, click
> Import Tests from Execution
Plan. The Select Execution Plan dialog box appears.
3. Select an execution plan and click OK. All tests of the execution plan are assigned to No specific
tester of the testing cycle.
Duplicating Testing Cycles
You need the Manage testing cycles and configurations permission to duplicate a testing cycle.
To duplicate a testing cycle:
1. In the menu, click Execution Planning > Manual Execution Planning. The Manual Execution
Planning page displays.
2. In the Testing Cycles area, in the header of a testing cycle, click
> Duplicate Testing Cycle. The
Duplicate Testing Cycle dialog box appears. The properties (Name, Description, Start Date, End
Date and Capacity) are duplicated and filled in the fields.
3. Optional: Choose how you want to copy the test assignment. For example, you can choose not to copy
Passed tests, enabling you to re-run the testing cycle only with Failed and Not Executed tests.
4. Click OK. The testing cycle is duplicated with all assigned tests and testers.
Hiding Testing Cycles
You can hide testing cycles on the Manual Execution Planning page to keep the page tidy and to
enhance the performance. This is especially useful when you have lots of testing cycles.
To hide a testing cycle:
1. In the menu, click Execution Planning > Manual Execution Planning. The Manual Execution
Planning page displays.
Silk Central 15.5
| 157
2. In the Testing Cycles area, click Show/Hide Testing Cycles. The Visible Testing Cycles dialog box
appears.
3. Uncheck all testing cycles that shall be hidden and click OK.
4. To quickly hide a certain testing cycle, you can also click
Hide Testing Cycle.
in the header of a testing cycle and click
5. To show a hidden testing cycle, again click Show/Hide Testing Cycles and mark the testing cycle.
If you hide a testing cycle on the Manual Execution Planning page, you can still see it in the Execution
Plans tree in the Details View and in the Document View as well as in the dashboard panels and in the
reports. The visibility settings are done per user. Every user can define which testing cycle to display and
which to hide.
Starting Testing Cycles
Note: Before starting a testing cycle, verify that the start date of the testing cycle corresponds with the
current date. If not, ensure that you are able to start the testing cycle on a different date.
To start a testing cycle:
1. In the menu, click Execution Planning > Manual Execution Planning. The Manual Execution
Planning page displays.
2. In the Testing Cycles area, in the header of a testing cycle, click
> Start Testing Cycle.
A testing cycle can only be started once. If the testing cycle is already started, this action is disabled. A
running testing cycle displays Testing Progress between the start and end date. A testing cycle that
has not been started yet displays Not Yet Started. A finished testing cycle displays Finished.
The assigned manual tests are distributed to the manual testers. The testers are notified by email and the
tests will display in their Manual Tests Assigned to Me panel on their dashboard.
You can still change a running test, assign additional tests, remove tests, or move tests between testers
after a testing cycle has started.
Finishing Testing Cycles
Note: Before finishing a testing cycle, verify that the end date of the testing cycle corresponds with
the current date. If not, ensure that you are able to finish the testing cycle on a different date.
To finish a testing cycle:
1. In the menu, click Execution Planning > Manual Execution Planning. The Manual Execution
Planning page displays.
2. In the Testing Cycles area, in the header of a testing cycle, click
> Finish Testing Cycle.
If the testing cycle is not yet started, this action is disabled. A testing cycle that is not running displays
Not Yet Started between the start and end date. A running testing cycle displays Testing
Progress. A finished testing cycle displays Finished.
3. The Finish Testing Cycle dialog box appears. Select the action you want to perform for tests that have
not been executed and click Finish. The selected status change will only be applied to non-executed
tests for which no status reason has been set.
Note: Finished testing cycles are locked. You cannot add/remove tests or testers to/from a finished
testing cycle. You can copy a test from a finished testing cycle by dragging it onto another testing
cycle or tester.
158
| Silk Central 15.5
Deleting Testing Cycles
Note: You can also delete testing cycles in the Execution Planning Details View and Document
View. Right-click on a testing cycle and click Delete.
To delete a testing cycle:
1. In the menu, click Execution Planning > Manual Execution Planning. The Manual Execution
Planning page displays.
2. In the header of a testing cycle of the Testing Cycles area, click
> Delete Testing Cycle.
3. Click Yes on the Deletion Confirmation dialog box.
Test Assignment
To access this page, click Execution Planning > Manual Execution Planning . On the top right, click
Test Assignment.
The Test Assignment view is the second view of the Manual Execution Planning page. Here you can
organize the manual tests that are assigned to the selected testing cycle.
Testing Cycles
The Testing Cycles area lists all testing cycles of the current project. It is the central part of the Manual
Execution Planning page and displays on both the Test Selection and on the Test Assignment view.
The testing cycles are ordered chronologically.
Click New Testing Cycle on the top of the Testing Cycles area to create a new testing cycle. Click Show/
Hide Testing Cycles if you want to hide testing cycles. Hiding testing cycles helps you to keep the
Testing Cycles area tidy and to enhance the performance. It is especially useful when you have lots of
testing cycles.
In the header of a testing cycle, click
•
•
•
•
•
•
•
•
•
to perform the following actions:
Edit Testing Cycle
Edit Assigned Testers
Edit Milestones
Import Tests from Execution Plan
Duplicate Testing Cycle
Hide Testing Cycle
Delete Testing Cycle
Start Testing Cycle
Finish Testing Cycle
In a testing cycle, click on a manual tester to display the assigned tests in the Assigned Tests area.
Click on the header of a testing cycle to select it. The tests that are assigned to the testing cycle (but not to
a specific manual tester) are listed in the Assigned Tests area.
If the Assigned Tests area is not displayed, click Test Assignment on the top right.
The testing cycle boxes show:
•
•
•
•
The name of the testing cycle.
The start and end dates.
A burn-down chart that visualizes the testing progress. It shows how likely it is that all tests will be
finished by the end of the testing cycle. Move your mouse over one of the bars to show the number of
tests that are not completed.
The percentage of the capacity that is covered. This percentage is calculated as follows: The sum of
planned time of the assigned tests divided by the capacity sum of the manual testers. This percentage
displays both for the testing cycle and each individual tester. If a testing cycle or a manual tester is
Silk Central 15.5
| 159
•
•
overloaded with tests, the green box turns into red. Move the mouse over this percentage to get
detailed information.
The number of assigned tests and the completed tests for both the testing cycle and each individual
tester. Move the mouse over these numbers to get detailed information.
The manual testers that are assigned to each testing cycle. Click on the number of the assigned testers
to expand or collapse the detailed information.
Moving Tests from One Testing Cycle to Another
You can move tests from one testing cycle to another testing cycle. That might be useful if you cannot
finish all tests in time and you want to move those tests to the next testing cycle.
To move tests from one testing cycle to another testing cycle:
1. In the menu, click Execution Planning > Manual Execution Planning. The Manual Execution
Planning page displays.
2. Click Test Assignment on the top right. The Manual Execution Planning page switches into the Test
Assignment view.
3. In the Testing Cycles area on the left side, click on the header of a testing cycle.
4. In the Assigned Tests area, click the test you want to move and drag it onto another testing cycle.
You can select multiple tests with Ctrl+Click or Shift+Click.
Moving Tests from One Tester to Another
You can move tests from one manual tester to another with free capacity to distribute the workload within a
testing cycle.
To move a test from one manual tester to another manual tester:
1. In the menu, click Execution Planning > Manual Execution Planning. The Manual Execution
Planning page displays.
2. Click Test Assignment on the top right. The Manual Execution Planning page switches into the Test
Assignment view.
3. In the Testing Cycles area on the left side, click on a manual tester. The tests that are assigned to the
manual tester are shown in the Assigned Tests area.
4. Click the test you want to move and drag it onto another manual tester.
You can select multiple tests with CTRL + CLICK or SHIFT + CLICK.
Removing Tests from Testing Cycles
To remove tests from a testing cycle:
1. In the menu, click Execution Planning > Manual Execution Planning. The Manual Execution
Planning page displays.
2. Click Test Assignment on the top right. The Manual Execution Planning page switches into the Test
Assignment view.
3. In the Testing Cycles area on the left side, click on the header of a testing cycle. The tests that are
assigned to the testing cycle are shown in the Assigned Tests area.
4.
Click
to remove a test from the testing cycle.
You can select multiple tests with CTRL + CLICK or SHIFT + CLICK.
Note: You cannot remove tests from a finished testing cycle. You can copy a test from a finished
testing cycle by dragging it onto another testing cycle or tester.
160
| Silk Central 15.5
Removing Tests from Manual Testers
To remove tests from a manual tester:
1. In the menu, click Execution Planning > Manual Execution Planning. The Manual Execution
Planning page displays.
2. Click Test Assignment on the top right. The Manual Execution Planning page switches into the Test
Assignment view.
3. In the Testing Cycles area on the left side, click on a manual tester. The tests that are assigned to the
manual tester are shown in the Assigned Tests area.
4. You can remove tests from the testing cycle or remove them from just the manual tester but keep them
in the testing cycle:
•
•
To remove a test from the manual tester and the testing cycle: click
.
To remove a test from the manual tester but keep it in the testing cycle: click a test in the Assigned
Tests area and drag it onto No specific tester in the Testing Cycles area.
You can select multiple tests with CTRL + CLICK or SHIFT + CLICK.
Note: You cannot remove tests from a manual tester who is assigned to a finished testing cycle. You
can copy a test from a finished testing cycle by dragging it onto another testing cycle or tester.
Assigned Tests
The Assigned Tests area shows the assigned tests of the currently selected testing cycle or manual
tester.
The caption of the Assigned Tests grid shows:
•
•
The name of the currently selected testing cycle.
The name of the currently selected tester.
You can perform following actions in the grid:
•
•
•
•
•
•
To assign a manual test to a different testing cycle, drag the test onto the header of the testing cycle.
To assign a manual test to a (different) manual tester, drag the test onto the tester in a testing cycle.
Click on a column header's context menu trigger to sort, to group and to filter manual tests, to add or
remove columns, and to reset filters or the view.
Right-click on a manual test to show the test details, to specify configurations for the test, or to remove
the test from the testing cycle.
You can select multiple tests with CTRL + CLICK or SHIFT + CLICK.
Click
to remove a test from the testing cycle.
•
Click
to show the test details.
•
Click
to view the manual test results.
•
Click
to show the test in the Tests Details View.
To remove a test from a manual tester but not from the testing cycle, drag the test to No specific tester
in the testing cycle.
To change the execution order, click the Order field, type in an order number, and press Enter.
•
•
Note: You should assign tests from only one test container to a testing cycle. Otherwise, order
numbers are not unique. If you want to assign tests of multiple test containers, you can group the
tests by the Test Container column.
Note: If you apply a filter or a quality goal value in the Filter Criteria area, the tests in the Assigned
Tests grid that do not match the filter are disabled.
Silk Central 15.5
| 161
Manual Configuration Testing
You can execute a manual test with different software and hardware configurations.
To assign configurations to a manual test:
1. In the menu, click Execution Planning > Manual Execution Planning. The Manual Execution
Planning page displays.
2. Click Test Assignment on the top right. The Manual Execution Planning page switches into the Test
Assignment view.
3. Right-click a test in the Assigned Tests area.
You can select multiple tests with CTRL + CLICK or SHIFT + CLICK.
4. Click Specify Configurations. The Specify Configurations dialog box displays.
5. Optionally click New Configuration and enter a name.
To edit and organize your configurations in greater detail, click Execution Planning > Configurations.
6. Check one or more configurations. For each test/configuration combination, an instance of the test is
added to the Assigned Tests grid.
Note: If you uncheck a configuration, the instance for this test/configuration combination will be
removed from the currently selected tester. However, instances assigned to other testers will not
be removed.
7. Click OK.
You can assign the new test instances to different manual testers and testing cycles.
Walkthrough
This walkthrough shows you features of Manual Execution Planning using an example. The assumptions
for the example include:
•
•
•
•
The requirements are fully documented and categorized according to a Risk property.
575 manual tests are fully documented, assigned to requirements, and categorized according to an
Importance attribute which defines the necessity for executing a specific test.
Quality goals, which are also called project exit criteria, have been defined based on the requirements
property Risk and the test attribute Importance. These quality goals specify the levels of testing
required.
The only tests to plan are the ones that best fulfill the quality goals.
Overview (Walkthrough)
The Manual Execution Planning page consists of four areas presented on two screens. On the first
screen, the Test Selection screen, you can select and schedule your tests for a testing cycle. On the
second screen, the Test Assignment screen, you can assign the tests of the selected testing cycle to the
testers who will execute them.
The Test Selection screen is divided into three areas:
•
•
•
162
| Silk Central 15.5
The Filter Criteria area on the left side. With the filter capabilities, you can narrow down the tests
shown in the next area.
The Matching Tests area in the middle. This list shows all available tests. When you apply filters, just
the filtered tests are shown.
The Testing Cycles area on the right side. Here you can assign tests from the list in the middle to a
certain testing cycle, which is a defined time period.
To access the Test Assignment screen, click Test Assignment >>> on the top right. This screen is
divided into two areas:
•
•
The Testing Cycles area on the left side. This is the same area as on the Test Selection screen, it is
shown on both screens.
The Assigned Tests area on the right side. This list shows the tests, which have been added to the
currently selected testing cycle. Here you can drag the tests from the list to the Testing Cycles area
and drop them on a tester.
Creating a Testing Cycle (Walkthrough)
The first step is to create a testing cycle. A testing cycle is a defined period in time consisting of a start
date, an end date, and a list of manual testers. We will name our testing cycle Week 21 - Team A.
1. In the menu, click Execution Planning > Manual Execution Planning.
2. In the Testing Cycles area on the right side, click New Testing Cycle. The New Testing Cycle box
appears.
3. Enter a name for the testing cycle, in our case Week 21 - Team A.
4. Optionally enter a description.
5. Click
next to Start date to set the start date of the testing cycle.
6. Click
next to End date to set the end date of the testing cycle.
7. In hh:mm format, enter the amount of time that you want to provide for this testing cycle (Capacity), in
our case, we entered 35:00.
Silk Central 15.5
| 163
8. Click OK.
Our testing cycle now appears in the Testing Cycles area. It shows that currently no testers are assigned.
The next step is to assign testers.
Adding Manual Testers (Walkthrough)
The next step is to add manual testers to our testing cycle. We are also going to define the capacity each
manual tester has for this testing cycle.
1. In the header of our testing cycle Week 21 - Team A, click
Assigned Testers dialog box appears.
> Edit Assigned Testers. The Edit
2. Click Add/Remove Testers. The Add/Remove Testers dialog box appears.
3. Select a user group from the Available list.
4. Select one or more users from the user group in the Available list.
5. Click Add or Add All to add users to the Selected list.
6. Click OK. The users are now added to the list in the Edit Assigned Testers dialog box.
7. For each user that was added, provide a capacity for the testing cycle in the Capacity field using the
hh:mm format.
8. Click Close.
Now our testing cycle shows the available resources, both for the whole testing cycle as well as for each
manual tester. A burn-down chart displays the assigned tests that are not yet completed. After we have
created our testing cycle and added manual testers, we can determine which tests need to be done in the
next step.
164
| Silk Central 15.5
Selecting Tests and Scheduling (Walkthrough)
This topic describes how to assign tests to our testing cycle. The goal is to select those tests that best
cover the defined quality goals. One of the quality goals is based on the requirement risk. The typical
practice is to test things with high risk first.
1. In the Filter Criteria area on the left side, under Quality Goals, check the Requirement Risk check
box. The list of Matching Tests is narrowed down to the tests that are critical.
2. In the Matching Tests area, right click on a column to sort, filter or group tests. That helps to select the
tests that should be scheduled.
3. Select one or more tests, drag them to the Testing Cycle area on the right side and drop them to our
testing cycle. When adding tests to a testing cycle, the indicator for already used resources is updated.
Move the mouse over this indicator for detailed information about the overall capacity, the planned time,
and the time left.
4. After scheduling all tests with a critical risk, schedule those with a high risk. After that, schedule those
with a medium risk, and so on.
The tests assigned to our testing cycle have moved to the No specific tester row. In the next step, we will
assign tests to manual testers.
Silk Central 15.5
| 165
Assigning Tests to Manual Testers (Walkthrough)
Now we are going to assign the tests in our testing cycle to manual testers.
1. Click Test Assignment >>> on the top right. The Test Assignment screen appears.
2. In the Testing Cycles area on the left side, click on the No specific tester row in our testing cycle. All
tests that are not assigned to a tester appear in the Assigned Tests area on the right side.
3. Select one or more tests, drag them to the Testing Cycles area on the left side and drop them to a
manual tester. When assigning tests to a manual tester, the resource indicator is updated. Move the
mouse over this indicator to see detailed information about the capacity, the planned time, and the time
left.
4. When you are finished assigning tests to manual testers, click
> Start Testing Cycle to start the
tests.
When the testing cycle is started, each manual tester is informed through email about the tests that are
assigned. You can add a test inbox, (Manual Tests Assigned to Me), to your personal dashboard. All the
tests that are assigned to you are listed there.
Configuration Testing
Configuration testing is the process of testing a system with each of the supported software and hardware
configurations.
The Execution area supports configuration testing by allowing reuse of the assigned tests. You can create
configuration suites with a set of assigned tests, and all execution plans that you add to the configuration
166
| Silk Central 15.5
suite will also have the set of tests assigned. You can also create configuration suites from existing
execution plans and copy and paste or cut and paste execution plans in the Execution tree into a
configuration suite. Silk Central enables you to add or remove parameters, keywords, and manual testers
to or from the configurations. When you create a configuration suite out of an existing execution plan, all
the results of the execution plan are preserved in the configuration suite. If you copy-paste an execution
plan into an existing configuration-suite, these results are not preserved.
Each execution plan in the configuration suite is displayed in an editable grid. You can view the execution
plans or configurations that contain a specific test in the Properties tab of the test. You can also view the
execution plans or configurations that are associated with a specific requirement in the Assigned Tests
tab of the requirement.
To define configurations for automated tests, use the Configurations Suite Configurations page. To
define configurations for manual tests use the Configurations page.
Creating a Configuration Suite
To create a configuration suite:
1. In the menu, click Execution Planning > Details View or Execution Planning > Document View.
2. Right-click the root node or a folder in the Execution tree and select New Child Configuration Suite
or click
in the toolbar. The New Configuration Suite dialog box displays.
3. Type a Name and Description for the new configuration suite.
4. Select a Test Container from the list box.
5. Select a Version and Build from the list boxes, or check the Read from Build Information File check
box to read the version and build from a file.
6. Optional: In the Source Control Label field you can specify that earlier versions of automation files,
instead of the latest versions, are fetched from the source control system.
Note: The Source Control Label property is only enabled if the associated test container uses a
source control profile that supports versioning.
7. Click OK.
Creating a Configuration Suite from an Execution Plan
To create a configuration suite from an existing execution plan:
1. In the menu, click Execution Planning > Details View.
2. Right-click the execution plan, from which you want to create a configuration suite, in the Execution
tree and select Convert to Configuration Suite. Silk Central creates a new configuration-suite node,
with the same name as the selected execution plan, in the Execution tree and adds the execution plan
as a configuration sub-node to the configuration suite.
When you create a configuration suite out of an existing execution plan, all the results of the execution plan
are preserved in the configuration suite. If you copy-paste an execution plan into an existing configurationsuite, these results are not preserved.
Adding Parameters to a Configuration
To add a predefined parameter to a configuration:
1. In the menu, click Execution Planning > Details View.
2. In the Execution tree, select the configuration node to which you want to add a parameter.
3. Click the Configurations tab.
4. Click Add/Remove Parameters. The Add/Remove Parameters dialog box opens. The Assigned
parameters list box on the right side of the dialog box lists all of the parameters that are defined for the
configuration.
Silk Central 15.5
| 167
5. Select parameters in the Select or enter parameters list box that reflect your execution environment
requirements.
Use CTRL + CLICK or SHIFT + CLICK to select multiple parameters using standard browser multiselect functions.
6. To add any of the parameters listed in the Select or enter parameters list box, select the parameter
and click >.
7. To create a new parameter, type the name of the parameter in the Enter parameters text box, and
press Enter or click >.
Tip: The Enter Parameters text box is auto-complete enabled. When you enter alphanumeric
characters into this field, the field is dynamically updated with an existing parameter that matches
the entered characters. The text box is disabled when multiple parameters are selected in the
Select parameters or Assigned parameters list boxes.
8. Click OK. The Add/Remove Parameters dialog box closes and a new column is added to the grid for
each new parameter.
Removing Parameters from a Configuration
To remove a predefined parameter from a configuration:
1. In the menu, click Execution Planning > Details View.
2. In the Execution tree, select the configuration node from which you want to remove a parameter.
3. Click the Configurations tab.
4. Click Add/Remove Parameters. The Add/Remove Parameters dialog box opens. The list box on the
right side of the dialog box lists all of the parameters that are defined for the configuration.
5. To remove a parameter from the list box, select the parameter and click <.
6. Click OK. The Add/Remove Parameters dialog box closes and the column of the removed parameter
is removed from the grid.
Assigning Keywords to a Configuration
To assign keywords to a configuration:
1. In the menu, click Execution Planning > Details View.
2. In the Execution Plans tree, select the configuration suite that you want to edit.
3. Click the Configurations tab.
4. Click into the Keywords column of the configuration that you want to add a keyword to. The Assign
Keywords dialog box opens.
5. Select keywords in the Select keywords list box that reflect your execution environment requirements.
Use CTRL + CLICK or SHIFT + CLICK to select multiple keywords using standard browser multi-select
functions.
Tip: The Enter keywords text box is auto-complete enabled. When you enter alphanumeric
characters into this field, the field is dynamically updated with an existing keyword that matches
the entered characters. The text box is disabled when multiple keywords are selected in the Select
keywords or Assigned keywords list boxes.
Tip: For automated execution plans, if you only have a few execution servers and do not require
hardware provisioning, it might be enough to use only the default, reserved keywords that are
created for each execution server. In such cases, it is not necessary that you select additional
keywords.
6. Click > to move the keyword into the Assigned keywords list box.
Note: For automated execution plans, the execution servers that match the assigned keywords
are listed below in the dynamically-updated Matching execution servers list box. This list
168
| Silk Central 15.5
updates each time you add or remove a keyword. Click on the name of an execution server in the
list to access the execution servers in Administration > Execution Servers .
7. Click OK to save the keywords and close the Assign Keywords dialog box.
Removing Keywords from a Configuration
To remove keyword assignments from a configuration:
1. In the menu, click Execution Planning > Details View.
2. In the Execution Plans tree, select the configuration suite that you want to edit.
3. Click the Configurations tab.
4. Click into the Keywords column of the configuration that you want to remove a keyword from. The
Assign Keywords dialog box opens.
5. Select the no longer needed keywords in the Assigned keywords list.
Use Ctrl+Click or Shift-Click to select multiple keywords.
6. Click < to remove the keyword assignments.
7. Click OK to save the keywords and close the Assign Keywords dialog box.
Note: Keywords that are not in use anymore are automatically deleted from the system.
Adding Manual Testers to Configurations
For configurations that include manual tests, the Configurations page enables you to assign users as
manual testers to a selected configuration. You can assign multiple manual testers to the configuration.
To assign a manual tester to a configuration:
1. In the menu, click Execution Planning > Details View.
2. In the Execution Plans tree, select the configuration suite that you want to edit.
3. Click the Configurations tab.
4. Click into the Manual Testers column of the configuration that you want to add a manual tester to. The
Manual Testers dialog box opens.
5. In the Available list box, select the user group of which the tester is a member. The list box is
populated with all members of the user group.
6. Select the name of the user you want to assign as a manual tester.
7. Click Add to add the user to the Selected list box; or click Add All to add all of the group’s members
and testers.
8. Click OK to close the Manual Testers dialog box.
Removing a Tester Assignment from a Configuration
To remove a tester assignment from a configuration:
1. In the menu, click Execution Planning > Details View.
2. Select the configuration node from which you want to remove a tester assignment.
3. Click the Configurations tab.
4. Click into the Manual Testers column of the configuration that you want to remove a manual tester
from. The Manual Testers dialog box opens.
5. From the Selected list, select the name of the assigned user that you want to remove.
6. Click Remove to remove the user from the Selected list; or click Remove All to remove all tester
assignments.
7. Click OK to close the Manual Testers dialog box.
Silk Central 15.5
| 169
Configurations Suite Configurations Page
To access this page, click Execution Planning > Details View > <Configuration Suite> >
Configurations.
The Configurations tab displays the configurations that are included in a configuration suite. The grid
provides data for the automated generation of child execution plans.
Each configuration that you add to the grid results in a new execution plan, which is executed with the
configuration suite.
To define a new configuration, click New Configuration. To add or remove a parameter, click Add/
Remove Parameters.
For each listed configuration, the page displays the following columns:
Column
Description
Actions
•
•
Click
Click
to delete the configuration.
to duplicate the configuration.
Name
The name of the configuration. Click on the name to change it.
Keywords
The list of the execution keywords that are assigned to the configuration.
Click on the link to change the list.
Manual Testers
The list of the manual testers that are assigned to the configuration. Click on
the link to change the list.
Parameters
The grid can have multiple parameter columns. Click Add/Remove
Parameters to add or remove parameters from the grid. To add a value to a
parameter, click the field and type in the value.
Configurations Page
To access this page, click Execution Planning > Configurations.
The Configurations page shows a list of the defined configurations in a grid. You can use these
configurations for manual tests only. To define configurations for automated tests, see Configurations Suite
Configurations Page.
To define a new configuration, click New Configuration. To add or remove a parameter, click Add/
Remove Parameters.
For each listed configuration, the page displays the following columns:
Column
Description
Actions
•
•
170
Click
Click
to delete the configuration.
to duplicate the configuration.
Name
The name of the configuration. Click on the name to
change it.
Keywords
The list of the execution keywords that are assigned to
the configuration. Click on the link to change the list.
Parameters
The grid can have multiple parameter columns. Click
Add/Remove Parameters to add or remove parameters
| Silk Central 15.5
Column
Description
from the grid. To add a value to a parameter, click the
field and type in the value.
Working with the Execution Plans Tree
Execution Planning > Details View
Folders, execution plans, configuration suites, and testing cycles are displayed, organized, and maintained
through a hierarchical tree structure, the Execution Plans tree. You can use any number of hierarchy
levels within the tree.
Note: When the Execution Plans tree includes more elements than can be displayed at once without
impacting response time, the elements are displayed in increments. Page number links at the lower
part of the tree allow you to browse through the elements included on the tree one page at a time. To
display all elements as a single list, click the [All] link.
Expanding or Collapsing the Execution Plans Tree
You can consolidate levels of the Execution Plans tree or display all levels of the hierarchy based on your
viewing needs.
To collapse or expand levels of the Execution Plans tree:
1. In the menu, click Execution Planning > Details View.
2. Select a folder in the Execution Plans tree and continue with one of the following options:
•
•
•
Click
to the left of the name of the folder to expand the folder.
to the left of the name of the folder to collapse the folder.
Click
Right-click on the folder and select Expand or Collapse.
Editing Elements of the Execution Plans Tree
To edit an existing execution plan element:
1. In the menu, click Execution Planning > Details View.
2. In the Execution Plans tree, select the execution plan, folder, or configuration suite you want to edit.
3. Click
on the toolbar or right-click the element and select Edit. A dialog box displays.
4. Edit the element by modifying the criteria in the dialog box.
For execution plans, if there are no runs and no tests assigned to the execution plan, you can choose
an alternative test container for the execution plan from the Test Container list box.
5. Click OK to save the edited element.
Copying Elements of the Execution Plans Tree
To copy and paste an execution plan, a folder, or a configuration suite:
1. In the menu, click Execution Planning > Details View.
2. In the Execution Plans tree, select the element that you want to copy.
3. Click
on the toolbar or right-click the element and select Copy .
4. Select the target folder where the element is to be pasted.
5. Click
on the toolbar or right-click the target node and select Paste. The Execution Plans tree is
updated with a copy of the pasted element. All assigned tests, filters, and scheduling parameters are
copied along with the element.
Silk Central 15.5
| 171
Deleting Elements of the Execution Plans Tree
To delete an execution plan, a folder, or a configuration suite:
1. In the menu, click Execution Planning > Details View.
2. In the Execution Plans tree, select the element that you want to delete.
3. Click
on the toolbar or right-click the element node and select Delete.
4. Click Yes on the deletion confirmation dialog box to remove the element from the Execution Plans
tree.
When deleting an element of the Execution Plans tree, the run results of the assigned tests are also
deleted. The test run results may still appear in reports, because they are stored in the database, which is
not immediately updated after the deletion of the element.
Filtering the Execution Plans Tree
Follow the steps below to filter the Execution Plans tree so that only the selected node and child nodes
are visible. This is useful if you want to print a sub-set of execution plans to a PDF.
1. Create a custom filter that defines the execution plans that you want to view.
2. Select a folder or configuration suite in the tree view, right click and select Filter Subtree.
Printing Assigned Manual Tests
For each execution plan in the Execution Plans tree, you can print a document that includes information
about all manual tests that are assigned to the execution plan. You can print this document to PDF or a
local printer.
To print information about all manual tests that are assigned to an execution plan:
1. In the menu, click Execution Planning > Details View.
2. In the Execution Plans tree, right click the execution plan and click Print Assigned Manual Tests.
The Manual Test Document dialog box opens.
3. To print the assigned manual test information to a local printer, click Print. To save the information as a
PDF document, click Download as PDF.
4. Click Close to close the Manual Test Document dialog box.
Execution Plan Properties Page
Execution Planning > Details View > <Execution Tree Element> > Properties
The Properties page lists basic properties that are relevant to the selected project, folder, execution plan,
or configuration suite.
Property
Description
Execution Plan Name/Configuration Suite Name/
Folder Name
Name of the element in the Execution Plans tree.
Execution Plan ID/Configuration Suite ID/Folder ID
Database identifier of the element.
Description
Description of the element.
Note: Silk Central supports HTML formatting and
cutting and pasting of HTML content for
Description text boxes.
172
| Silk Central 15.5
Property
Description
Test Container
The test container with witch the execution plan or
configuration suite is associated. Click to access the test
container in the Tests area.
Version
Version that is used when the execution plan is executed.
Build
Build that is used when the execution plan is executed.
Priority
For automated execution plans, when more than one
execution plan is queued but only one execution server is
available, the Priority determines which execution plan is
executed first.
Silk Test Classic AUT Host NameSource Control
Label
Hostname of the application under test. For Silk Test
Classic execution plans only.
Tests
The tests associated with this execution plan or
configuration suite.
Source Control Label
Not existing for configuration suites. In the Source
Control Label text box you can optionally specify that the
execution plan is of an earlier version than the latest
version. The label must refer to a version in the source
control system that the test container is associated with. If
this text box is left blank, the latest version of the
execution plan will be fetched.
The Source Control Label property is only enabled if the
associated test container uses a source control profile
that supports versioning.
Make sure to have enough free disk space on the
execution server or servers when working with multiple
versions of source files. Each version will be saved in its
own folder on every execution server.
Status of last run
The cumulated test statuses of the latest run of the
execution plan, or the cumulated test statuses of all
contained execution plans, for a folder or configuration
suite.
Last Execution
Last time an execution of the element was started.
Duration
Duration of the latest run of an execution plan, or in case
of a folder or configuration suite, the cumulated durations
of the latest runs of all contained execution plans.
In the simplest case, automated tests on a single
execution server or only manual tests, the duration is the
time displayed for the latest run on the Runs page. If the
last execution involved both automated and manual tests,
only the automated or manual tests will be considered,
depending on which test was executed later. If the
execution plan contains multiple tests, the duration is
measured from the time when the first test begins
executing and ends when the last test completes
execution. This includes the overhead time, which is
needed for stopping/starting tests between executions.
Next Execution
Next time this element will be executed.
Silk Central 15.5
| 173
Property
Description
Created On
Date and time the element was created.
Created By
Name of the user who created the element.
Changed On
Date and time the element was last changed.
Changed By
Name of the user who last changed element.
Testing Cycle Properties Page
Execution Planning > Details View > <Testing Cycle> > Properties
The Testing Cycles Properties page is available when you select any testing cycle from the Execution
Plans tree and then click Properties.
Click Edit Properties to display the Edit Testing Cycle dialog box where you can edit the Name,
Description, and Planned Time of the testing cycle.
The following table displays the available testing cycle properties.
Property
Description
Testing Cycle Name
Name of the testing cycle. Edit this value in the Edit Testing Cycle dialog box.
Testing Cycle ID
Unique ID of the testing cycle.
Description
Description of the testing cycle. Edit this value in the Edit Testing Cycle dialog box.
Status of Last Run
Status is an aggregate of the last run of all test statuses within the execution plans of the
testing cycle: Passed, Failed, Not Executed, or N/A.
Start Time of Last Run
Start time of the last run.
Testing Cycle Start
Date
The scheduled start date for the testing cycle.
Testing Cycle End
Date
The scheduled end date for the testing cycle.
Capacity [hh:mm]
Amount of time that you expect the testing cycle to take. Edit this value in the Edit Testing
Cycle dialog box.
If you assign manual testers to the testing cycle, the value for Capacity is the sum of the
Capacity for each manual tester.
Planned Time [hh:mm] Cumulative planned time of all manual tests within all assigned execution plans of the
testing cycle.
Time Left [hh:mm]
This is the remaining time available after subtracting Planned Time from Capacity.
Created On
Date that the testing cycle was created.
Created By
User that created the testing cycle.
Changed On
Date that the testing cycle was last modified.
Changed By
User that last modified the testing cycle.
Assigned Manual Testers
This section lists all of the manual testers included in the cycle.
174
Property
Description
Tester
Name of the tester.
| Silk Central 15.5
Property
Description
Capacity
Enter the amount of time that this tester is available for the testing cycle in hh:mm format.
The sum of all capacity values for each tester will be the testing cycle Capacity value.
Add/Remove Testers
Click to display the Manual Testers dialog box which you use to add testers to the testing
cycle.
Managing Execution Plans, Folders, and Configuration Suites
An execution plan is a collection of assigned tests that are stored in a single test container. An execution
plan can be run at configurable schedules and deployed on specified execution servers.
The process of adding and editing execution plans is the same for both automated execution plans and
manual execution plans.
Creating Execution Plans
To create an execution plan:
1. In the menu, click Execution Planning > Details View.
2. Select a folder or the project node in the Execution Plans tree.
3. Click
(New Child Execution Plan) on the toolbar or right-click the folder, testing cycle, or node and
click New Child Execution Plan. The New Execution Plan dialog box appears.
4. Type a name and description for the execution plan.
Note: Silk Central supports HTML formatting and cutting and pasting of HTML content for
Description text boxes.
5. Select a test container from the Test Container list.
Note: You can assign only one test container to an execution plan. Only tests from this test
container can be executed.
The latest version and build that are defined within the product that the container belongs to are
populated automatically in the Version and Build lists.
6. Select a product Version and Build from the lists.
These are used when a new run of this execution plan is started. Alternatively, you can check the Read
from Build Information File check box. In this casethe version and build are read from the build
information file on the application server at the beginning of each run. If a build information file is
available on the execution server, this file is used by default for the test run, overriding the settings on
the New Execution Plan dialog box.
7. Select a Priority for the execution plan from the list.
The priority parameter specifies the lowest priority that is considered in the data.
8. Optional: In the Source Control Label field you can specify that earlier versions of automation files,
instead of the latest versions, are fetched from the source control system.
Note: The Source Control Label property is only enabled if the associated test container uses a
source control profile that supports versioning.
9. Click OK to update the Execution tree with the newly created execution plan.
Creating an Execution Plan in Grid View
To create an execution plan in Grid View:
1. In the menu, click Tests > Grid View .
2. Select the tests you want to assign to your execution plan, by using the multi-select feature of the Grid
View.
Silk Central 15.5
| 175
3. Right-click the tests and choose Create Execution Plan. The New Execution Plan dialog box
displays.
4. Enter the specifications of your new execution plan.
Note: All selected tests must be in the same container. If not, the execution plan is not created and
an error message displays. The test container is preselected in the New Execution Plan dialog box
and can not be altered.
Test Status Calculation
Each execution plan has one of the following status conditions:
Status
Condition
Passed
All considered test execution plans have the status Passed.
Failed
At least one considered test execution plan has the status Failed, but none of the
execution plans has the status Not Executed.
Not Executed At least one considered test has the status Not Executed.
A test gets its status from the result of the latest execution plan run. If you manually change the status of
the latest execution plan run, the test status changes also.
Note: If the latest execution plan run is deleted, the status of the test resets to the status of the latest
existing execution plan run. If the deleted execution plan run was the only existing execution plan run,
the status of the test is set to N/A, as if the test was newly created.
Execution Plan Parameters
To apply a specific configuration to an execution plan, you can override the parameters that you have
assigned to a test in the Parameters page of the execution plan. For additional information on test
parameters, see Test Parameters.
Creating an Execution Plan Parameter
To add a new parameter to an execution plan:
1. In the menu, click Execution Planning > Details View.
2. In the Execution tree, select the execution plan to which you want to add a new parameter.
3. Click the Parameters tab.
4. Click New Execution Plan Parameter. The New Execution Plan Parameter dialog box displays.
5. Type the Name and Value for the new parameter into the corresponding text boxes.
6. Click Save to add the parameter to the execution plan.
Note: You cannot create execution plan parameters with the same name as an existing test
parameter, which is included in the execution plan.
Overriding a Test Parameter
If multiple parameters of different types but with the same name exist in tests, you can override only one of
them. Only the values of parameters with the same type and name are replaced with the overriding value
during execution.
To override a test parameter in an execution plan:
1. In the menu, click Execution Planning > Details View.
2. In the Execution tree, select the execution plan in which you want to override a test parameter.
3. Click the Parameters tab.
176
| Silk Central 15.5
4. In the Actions column of the parameter that you want to override, click
Parameter Value dialog box displays.
5. Type the new Value into the text box.
6. Click OK.
Note: Click
. The Set Execution Plan
in the Actions column of the parameter to undo the override.
Removing an Execution Plan Parameter
Note: You cannot remove test parameters in an execution plan. You can only remove execution plan
parameters.
To remove an execution plan parameter:
1.
2.
3.
4.
In the menu, click Execution Planning > Details View.
In the Execution tree, select the execution plan from which you want to add a new parameter.
Click the Parameters tab.
Click
.
Execution Parameters Page
Execution Planning > Details View > <Execution Plan> > Parameters
The Parameters page displays the parameters of all tests that are assigned to the execution plan. You can
override the parameters of the tests for the execution plan. For configuration testing, you can create
multiple execution plans that include the same tests and you can then define different configurations in the
Parameters page. Parameters from different tests that have the same name and type are displayed only
once in the page. If multiple parameters from different tests have the same name, you can only override
one of these parameters.
Click New Execution Plan Parameter to define a new execution plan parameter that is used for the
execution of all tests that are included in the execution plan. New execution plan parameters are always of
the type string and you cannot define a different type.
The page displays the following columns for each parameter:
Column
Description
Actions
Actions you can perform on the parameter. Click
edit the parameter value, or click
changes.
to undo your
Name
Name of the parameter.
Type
A parameter can have one of the following types:
•
•
•
•
•
•
Value
to
String
Number
Float
Boolean
Password
Character
The parameter value.
Setup and Cleanup Tests
The pre-test setup and post-test cleanup functionality of Silk Central enables you to define a setup test and
a cleanup test for each execution plan. Setup tests are typically built upon scripts or manual procedures
Silk Central 15.5
| 177
that prepare testing environments in anticipation of tests. Cleanup tests typically include scripts or manual
procedures that restore test environments to their original state following tests. When setup tests are
aborted, regular tests do not execute, however cleanup tests do execute to restore the testing environment
to its original state.
You must create your setup and cleanup tests before you can assign them to execution plans. Any test can
serve as a setup or cleanup test, except parent tests of multiple data-driven test instances. They require no
special configuration and can be either automated or manual. The only requirement is that they perform the
required setup and cleanup processes within your test environment. In the case of automated tests these
are scripts that perform required setup and cleanup tasks. In the case of manual tests, these are manual
setup and cleanup tasks.
Note: The challenge in executing setup and cleanup tests is preventing their results from being
aggregated with the results of the regular tests that they support. Silk Central addresses this concern
by running setup and cleanup tests, both automated and manual, in independent execution plans,
thereby isolating actual test results from incidental performance fluctuations that may be caused by
setup and cleanup tests.
Combining Automated and Manual Tests
Silk Central supports exeuction plans that include combinations of automated tests and manual tests. For
such execution plans, Silk Central withholds execution of regular tests, both automated and manual, until
setup tests are complete. Silk Central also ensures that all regular tests are complete before cleanup tests
are run.
When manual tests are combined with automated tests, automated tests, on all execution servers, do not
begin until the setup processes are complete. In the case of manual setup tests, regular automated tests
begin only after manual setup routines are complete.
Configuring Setup and Cleanup Executions
To define a test as a setup or cleanup test:
1. In the menu, click Execution Planning > Details View.
2. Click the execution plan for which you want to configure a setup or cleanup test.
3. Click the Setup/Cleanup tab.
4. Choose between a setup or cleanup test:
•
To define a setup test, click Edit in the Setup Test section. The Edit Setup Test dialog box
appears.
•
To define a cleanup test, click Edit in the Cleanup Test section. The Edit Cleanup Test dialog box
appears.
5. Select a test in the Tests tree.
6. Click OK.
The configured test displays in the corresponding section of the Setup/Cleanup page.
Execution Setup/Cleanup Page
Execution Planning > Details View > <Execution Plan> > Setup/Cleanup
Note: This page is not displayed for execution plans that are assigned to a testing cycle.
The Setup/Cleanup page lists the setup and cleanup tests that are defined for this execution plan.
Note: When failed tests are rerun, the corresponding setup/cleanup routines are also rerun. Setup/
cleanup tests are not run with Try Run test runs because such executions do not rely on execution
plans.
178
| Silk Central 15.5
Setup Test
In the Setup Test section, the page displays the following items:
Item
Description
Actions
Delete and View Description.
Test
Type and name of the configured
setup test.
Edit
Opens the Edit Setup Test dialog
box where you can select a setup
test. You cannot assign a test to the
same execution plan as both a setup
test and a regular or cleanup test.
Assigned tests can come from any
test container within your project. It is
therefore possible to assign tests that
have associated products and source
control profiles that vary from their
host execution plans.
Cleanup Test
In the Cleanup Test section, the page displays the following items:
Item
Description
Actions
Delete and View Description.
Test
Type and name of the configured
cleanup test.
Edit
Opens the Edit Cleanup Test dialog
box where you can select a cleanup
test. You cannot assign a test to the
same execution plan as both a setup
test and a regular or cleanup test.
Assigned tests can come from any
test container within your project. It is
therefore possible to assign tests that
have associated products and source
control profiles that vary from their
host execution plans.
Configuring Deployment Environments
Adding a Silk Test Classic AUT Host
For execution plans that run Silk Test Classic tests, you may have a setup where the Silk Test Classic
agent is on a different computer than the execution server. In this case, you can define the location of the
Silk Test Classic agent, the Silk Test Classic AUT (Agent Under Test) Hostname.
To add a a Silk Test Classic AUT host to the selected execution plan or edit the host:
1.
2.
3.
4.
In the menu, click Execution Planning > Details View.
Select the execution plan to which you want to assign the Silk Test Classic AUT host.
Click the Deployment tab.
In the Silk Test Classic AUT Hostname section, click Edit. The Edit Silk Test Classic AUT
Hostname dialog box displays.
Silk Central 15.5
| 179
5. In the Hostname text box, type the name of the computer where the Silk Test Classic agent runs.
Proper configuration of option files is required. For details on the command-line option -m, refer to the
Silk Test Classic documentation.
6. Click OK to add the Silk Test Classic AUT host to the selected execution plan.
Adding Manual Testers
For execution plans that include manual tests, the Deployment page enables you to assign users as
manual testers to a selected execution plan. You can assign multiple manual testers to the execution plan
To assign a manual tester to an execution plan:
1. In the menu, click Execution Planning > Details View.
2. In the Execution Plans tree, select the execution plan that you want to edit.
3. Click the Deployment tab.
4. Click Edit in the Manual Testers section. The Manual Testers dialog box appears.
5. In the Available list box, select the user group of which the tester is a member. The list box is
populated with all members of the user group.
6. Select the name of the user you want to assign as a manual tester.
7. Click Add to add the user to the Selected list box; or click Add All to add all of the group’s members
and testers.
8. Click OK to close the Manual Testers dialog box.
Removing a Tester Assignment from an Execution Plan
To remove a tester assignment from the selected execution plan:
1. In the menu, click Execution Planning > Details View.
2. Select the execution plan for which you are removing a tester assignment.
3. Click the Deployment tab.
4. Click Edit in the Manual Testers section. The Manual Testers dialog box appears.
5. From the Selected list, select the name of the assigned user that you want to remove.
6. Click Remove to remove the user from the Selected list; or click Remove All to remove all tester
assignments.
7. Click OK to close the Manual Testers dialog box.
Dynamic Hardware Provisioning with Keywords
The hardware-provisioning technology of Silk Central helps you manage test environments that include
numerous execution servers. Rather than having to configure a one-to-one static execution-server
assignment for each automated execution plan, keywords enable Silk Central to automatically select the
most appropriate execution server for each execution plan. This is done through dynamic comparison of
each execution plan's keyword list with the keyword lists of all active execution servers.
Keywords typically describe your execution environment requirements, for example platform, operating
system, and pre-installed applications. There are different uses for keywords, depending on whether the
execution plan is executed automatically or manually.
180
Automated
execution plans
When an automated execution plan is executed, Silk Central compares the
execution plan's keywords with the keywords of all available execution servers. The
execution is then run on the first-identified execution server that has a matching
keyword list.
Manual execution
plans
For manual execution plans, the manual tester can reflect the test environment by
using keywords.
| Silk Central 15.5
If you require an automated execution plan to be run on multiple execution servers, create a copy of the
execution plan and assign additional keywords to the execution plan that match other execution servers.
Reserved Default Keywords
If you do not require hardware provisioning to execute automated execution plans, you can use the
reserved keywords that are created automatically for each execution server. In such cases, it is not
necessary that you manually assign keywords to your execution servers. Instead, you can configure a oneto-one static execution-server assignment for each execution plan.
A reserved keyword is assigned automatically to each newly created execution server. Reserved keywords
are structured in the following form: #<execution server name>@<location name>.
Reserved keywords are only available when assigning keywords to execution plans. They are neither
available or applicable when assigning keywords to execution servers.
In addition to the reserved keywords that are set up automatically for each defined execution server,
reserved keywords are also set up for each execution server type:
#PHYSICAL
Limits execution-server provisioning to physical execution servers.
#VIRTUAL
Limits execution-server provisioning to virtual execution servers.
Keywords and Virtual Execution Servers
Keywords are assigned to virtual execution servers in the same way that they are assigned to physical
execution servers. When you configure at least one virtual execution server, the #VIRTUAL keyword is
dynamically created and made available for assignment to all execution plans. If you prefer that an
execution occur on a virtual machine, select the #VIRTUAL keyword for the execution plan. When an
execution plan has neither the #VIRTUAL and #PHYSICAL keywords, the execution may occur on either a
virtual or a physical execution server, assuming the settings of the execution environments are the same.
When a test's keywords match multiple virtual execution servers, the first matching virtual execution server
that is identified is selected.
Folder Execution
The execution plans can be combined into execution folders, where a folder can include execution
subfolders and execution plans. The options for an execution plan execution are also available for an
execution folder execution.
When executing a folder, the contained subfolders and execution plans are treated as follows:
Keywords of Executed Folder
Keywords of Contained Execution
Plan/Subfolder
Execution of Contained Execution
Plan/Subfolder
Has no keywords
Has no keywords
An execution plan without keywords
obtain status NOT EXECUTED after
execution
Has no keywords
Has keywords
Execution servers are assigned
based on the execution plan/
subfolder keywords
Has keywords
Has no keywords
Execution servers are assigned
based on the folder keywords
Has keywords
Has keywords
Execution servers are assigned
based on the folder keywords
Note: When a folder is executed manually and there are no keywords assigned, or no execution
server exists for the assigned keywords, these execution plans are marked as Not Executed.
Silk Central 15.5
| 181
Creating New Keywords
To create new keywords:
1.
2.
3.
4.
In the menu, click Execution Planning > Details View.
In the Execution Plans tree, select the execution plan that you want to edit.
Click the Deployment tab.
In the Execution Environment section of the page, click Edit. The Assign Keywords dialog box
appears. All keywords that have been defined for your execution environment are listed here.
Note: The default reserved keywords for each execution server, #<execution
name>@<location name>, are included in the list.
5. Type an alphanumeric keyword into the Keyword text box that describes the required environment for
the execution plan.
For example, the keyword might be the name of the platform, operating system, or pre-installed
applications. The following characters can not be used in keywords: #$?*\,;'".
Note: Keywords are case insensitive. For example, “Vista” and “vista” are handled as the same
keyword.
6. Press Enter.
The new keyword is now available for assignment.
Assigning Keywords to Execution Plans
To assign keywords to execution plans:
1.
2.
3.
4.
In the menu, click Execution Planning > Details View.
In the Execution Plans tree, select the execution plan that you want to edit.
Click the Deployment tab.
In the Execution Environment section of the page, click Edit. The Assign Keywords dialog box
appears. All keywords that have been defined for your execution environment are listed here.
Note: The default reserved keywords for each execution server, #<execution
name>@<location name>, are included in the list.
5. Select a keyword in the Select or enter keywords list or directly enter a new keyword.
Select multiple keywords with Ctrl+Click or Shift+Click.
Tip: The Select or enter keywords field is auto-complete enabled. When you enter alphanumeric
characters, the field is dynamically updated with an existing keyword that matches the entered
characters. The field is disabled when multiple keywords are selected in the Select or enter
keywords or Assigned keywords lists.
Tip: If you only have a few execution servers and do not require hardware provisioning, it might be
enough to use only the default, reserved keywords that are created for each execution server. In
such cases, it is not necessary that you select additional keywords.
6. Click > to move the keyword into the Assigned keywords list. Click < to remove keywords from the list.
You can also double-click keywords to move them from the one list to the other.
Note: The execution servers that match the assigned keywords are listed below in the
dynamically-updated Matching execution servers list. This list updates each time you add or
remove a keyword. Click on the name of an execution server in the list to access the execution
servers in Administration > Execution Servers .
7. Click OK to save the keywords and close the Assign Keywords dialog box.
Removing Keywords from Execution Plans
To remove execution plan keyword assignments:
182
| Silk Central 15.5
1. In the menu, click Execution Planning > Details View.
2. In the Execution Plans tree, select the execution plan that you want to edit.
3. Click the Deployment tab.
4. In the Execution Environment section of the page, click Edit. The Assign Keywords dialog box
appears. All keywords that have been defined for your execution environment are listed here.
Note: The default reserved keywords for each execution server, #<execution
name>@<location name>, are included in the list.
5. Select the no longer needed keywords in the Assigned keywords list.
Use Ctrl+Click or Shift-Click to select multiple keywords.
6. Click < to remove the keyword assignments.
7. Click OK to save the keywords and close the Assign Keywords dialog box.
Note: Keywords that are not in use anymore are automatically deleted from the system.
Execution Deployment Page
Execution Planning > Details View > <Execution Plan> > Deployment
The Deployment page displays all of the hardware-provisioning keywords that are defined for this
execution plan. These keywords are used to describe the execution environment requirements for the
execution plan. An execution server only matches the selected automated execution plan if it has all
keywords assigned the execution plan requires. The Deployment page also displays the users who are
assigned to execute manual tests, as well as the Silk Test Classic AUT hosts that are assigned to execute
Silk Test Classic tests.
Note: New execution servers are set-up in Administration > Execution Servers. For details on how
to set-up an execution server, see the Administration topics in this Help.
Execution Environment
Note: This section is not displayed for execution plans that are assigned to a testing cycle.
The Deployment page displays the following items in the Execution environment section:
Item
Description
Assigned keywords
Lists the keywords that are assigned to the execution
plan.
Automated
execution plans
Keywords are used to automatically
identify an appropriate execution
server for each test execution.
Manual
execution plans
Keywords are used by the manual
tester to reflect the test
environment.
Edit
Click to edit the execution plan's keywords.
Matching execution servers
Lists the active execution servers that have keyword lists
that match the keywords list of this execution plan. All
keywords in the keywords list of the execution plan must
be included in the keyword list of the execution server.
Click on the name of an execution server in the list to
access the execution server list in Administration >
Execution Servers .
Silk Central 15.5
| 183
Manual Testers
Lists all manual testers who are assigned to this execution plan or folder. Click Edit to edit the list of
manual testers.
Code Analysis Settings
Details code-analysis settings that are defined for this execution plan. Click Active/Inactive to enable or
disable code analysis for this execution plan.
Video Recording
Note: This section is not displayed for execution plans that are assigned to a testing cycle.
Defines whether a video is recorded during the execution of the execution plan. This setting overrides the
video recording settings of the individual tests that are assigned to the execution plan. You can select one
of the following values:
Value
Description
---
Video recording is disabled, except for those assigned tests where the recordVideo is set.
Never
Video recording is always disabled, even for those assigned tests where the recordVideo is
set.
Always
Records a video on every execution of the execution plan.
On Error Records a video when an error occurs during the execution of the execution plan.
Screen Capturing
Note: This section is not displayed for execution plans that are assigned to a testing cycle.
Defines whether a screenshot is captured during the execution of the execution plan. This setting overrides
the screen capturing settings of the individual tests that are assigned to the execution plan. You can select
one of the following values:
Value
Description
---
Screen capturing is disabled, except for those assigned tests where the captureScreen
parameter is set.
Never
Screen recording is always disabled, even for those assigned tests where the
captureScreen parameter is set.
On Error Captures a screenshot when an error occurs during the execution of the execution plan.
Execution Stop Condition
Defines whether the execution stops if a test fails or if a test is not executed. This setting is especially
useful if it makes no sense to keep a set of tests running if even one test fails. Use this setting to save
resources and to be notified earlier if a test fails. You can select one of the following values:
184
Value
Description
---
The execution proceeds, even if a test is not executed or fails.
On Error
The execution stops with the first failed test.
Not Executed
The execution stops with the first not executed test.
On Error or Not Executed
The execution stops with the first failed or not executed test.
| Silk Central 15.5
Note: If an execution is stopped, the results of the successfully executed tests are preserved.
Note: Test packages (with all subordinated tests) will always be executed to the end. They will not be
stopped intermittently. However, data-driven tests will be stopped as soon as a subordinated test
fails.
Silk Test Classic AUT Hostname
Lists all Silk Test Classic AUT hosts that are defined for this execution plan. Click Edit to edit the list of Silk
Test Classic AUT hosts.
Configuring Execution Dependencies
An execution dependency allows you to configure the automatic execution of one execution plan based on
the results of another execution plan. For example, If execution plan 'A' fails, automatically execute
execution plan 'B'.
Adding Dependent Execution Plans
To add a dependent execution plan:
1. In the menu, click Execution Planning > Details View.
2. Select the execution plan that will act as the master execution plan.
3. Click the Dependencies tab.
4. Click Add dependent Execution Plan. The Add dependent Execution Plan dialog box appears.
5. From the Condition list, select the condition that is to trigger the dependent execution plan.
•
•
•
•
Any
Passed
Failed
Not Executed
The Any status means that the dependent test execution will trigger no matter what the status of the
previous test execution is.
6. Select an execution plan from the Execution Plans tree.
7. Specify where the dependent execution plan is to be deployed.
Option
Description
As specified in
the dependent
Execution Plan
Automated tests assigned to the dependent execution plan will be executed on
the execution server specified for the dependent execution plan on the
Deployment page. Manual tests assigned to the dependent execution plan will
be assigned to the users specified for the dependent execution plan on the
Deployment page.
Same as
<selected
execution plan’s
execution server>
Automated tests assigned to the dependent execution plan will be executed on
the execution server specified for the master execution plan on the Deployment
page. Manual tests assigned to the dependent execution plan will be assigned to
the users specified for the master execution plan on the Deployment page.
Select a pre-configured execution server and/or a manual tester from the list
Specific:
Execution Server/ boxes. Automated tests assigned to the dependent execution plan will be
executed on the specified execution server. Manual tests assigned to the
Manual Tester
dependent execution plan will be assigned to the specified manual tester. If only
a specific manual tester is defined and no server, only manual tests will be
executed. If only a specific execution server is defined and no manual tester, only
automated tests will be executed.
Silk Central 15.5
| 185
8. Click OK to create the dependency.
Note: Silk Central will not allow you to create cyclical execution dependencies. You can select
conditions to fulfill for manual tests. For example, if the selected condition is Failed and all
manual tests passed, but some automated tests failed, only automated tests assigned to the
dependent execution plan are executed.
Editing a Dependency
Note: To edit an existing dependency, you must select the master execution plan, which is the
definition for which a specific condition will trigger the execution of the dependent execution plan. You
cannot edit dependency settings from the dependent execution plan.
To edit a previously configured dependency:
1. In the menu, click Execution Planning > Details View.
2. In the Execution Plans tree, select the execution plan that you want to edit.
3. Click the Dependencies tab.
4. In the Dependent Execution Plans section, click
plan. The Edit Dependency dialog box opens.
in the Actions column of the dependent execution
5. From the Condition list, select the condition that is to trigger the dependent execution plan.
•
•
•
•
Any
Passed
Failed
Not Executed
The Any status means that the dependent test execution will trigger no matter what the status of the
previous test execution is.
6. Specify where the dependent execution plan is to be deployed.
Option
Description
As specified in
the dependent
Execution Plan
Automated tests assigned to the dependent execution plan will be executed on
the execution server specified for the dependent execution plan on the
Deployment page. Manual tests assigned to the dependent execution plan will
be assigned to the users specified for the dependent execution plan on the
Deployment page.
Same as
<selected
execution plan’s
execution server>
Automated tests assigned to the dependent execution plan will be executed on
the execution server specified for the master execution plan on the Deployment
page. Manual tests assigned to the dependent execution plan will be assigned to
the users specified for the master execution plan on the Deployment page.
Select a pre-configured execution server and/or a manual tester from the list
Specific:
Execution Server/ boxes. Automated tests assigned to the dependent execution plan will be
executed on the specified execution server. Manual tests assigned to the
Manual Tester
dependent execution plan will be assigned to the specified manual tester. If only
a specific manual tester is defined and no server, only manual tests will be
executed. If only a specific execution server is defined and no manual tester, only
automated tests will be executed.
Deleting a Dependency
To delete a dependency:
1. In the menu, click Execution Planning > Details View.
2. Select the master execution plan from which you want to delete a dependency.
186
| Silk Central 15.5
3. Click the Dependencies tab.
4. In the Dependent Execution Plans section, click
plan.
in the Actions column of the dependent execution
5. Click Yes on the Delete Dependency dialog box to delete the dependency.
Execution Dependencies Page
Execution Planning > Details View > <Execution Plan> > Dependencies
Note: This page is not displayed for execution plans that are assigned to a testing cycle.
The Dependencies page lists dependent execution plans and master execution plans of the selected
execution plan.
The page is divided into two parts. For the selected execution plan, the page shows both the Master
Execution Plans, which are the execution plans for which a specific condition triggers the selected
execution plan, and the Dependent Execution Plans, which are the execution plans that will be triggered
if the selected execution plan results in a specific condition.
Master Execution Plans
For each execution plan in the list, the page displays the following columns:
Column
Description
Name
Name of the master execution plan that the selected
execution plan is dependent upon.
Condition
Condition of the master execution plan that must be met
for the selected execution plan to be triggered.
Dependent Execution Plans
For each execution plan in the list, the page displays the following columns:
Column
Description
Name
Name of the dependent execution plan that the selected
execution plan serves as the master of.
Condition
Condition of the selected execution plan that must be met
for the dependent execution plan to be triggered.
Execution Server / User(s)
Execution server where the dependent execution plan is
to be run or, in the case of a manual test execution,
manual tester who is to perform the manual test.
Actions
Actions that can be performed on the selected
dependency. Edit Settings and Delete Dependency.
Execution Notifications Page
Execution Planning > Details View > <Execution Element> > Notifications
The Notifications page includes check boxes which allow you to check whether you want to be notified
based on the outcome of the execution.
Notification only works if an email server has been configured by your administrator. You also have to
specify an email address for your account in User: <User Name> > User Settings .
Silk Central 15.5
| 187
Check Box
Description
Execution finishing successfully
Check to receive a notification email each time an
execution run finishes successfully.
Execution finishing with not passed tests
Check to receive a notification email each time an
execution finishes with status not executed or
failed.
Execution finishing with changed number of not
passed tests
Check to receive a notification email each time the
number of failed or not executed tests changes in
comparison to the previous run, when an execution
finishes.
Assigned Tests
This section describes how to assign tests to execution plans.
Assigning Tests from Grid View to Execution Plans
The tests that are assigned to the selected execution plans are listed on the Assigned Tests page.
To assign one or more tests from Grid View to one or more execution plans:
1. In the menu, click Tests > Grid View .
2. Select the tests you want to assign to execution plans.
You can select multiple tests with Ctrl+Click or Shift+Click.
3. Right-click the selected tests and click Save Selection.
4. In the menu, click Execution Planning > Details View.
5. Select the execution plan to which you want to assign the selected tests.
6. Click the Assigned Tests tab.
7. Click Assign Saved Selection.
Note: Only tests that reside in the test container of the execution plan are inserted. You can insert
the selected tests to more than one execution plans. You can not insert them into requirements in
a different project. The selection persists until you make a different selection or close Silk Central.
Manually Assigning Tests to Execution Plans
The tests that are assigned to the selected execution plans are listed on the Assigned Tests page.
To manually assign tests to an execution plan:
1. In the menu, click Execution Planning > Details View.
2. Select the execution plan to which you want to assign the selected tests.
3. Click the Assigned Tests tab.
4. Click the Manual assignment option. All tests of the test container which is associated with the
selected execution are displayed in the Tests tree. If you have created a test filter, you can select it
from the filter list above the Tests tree. To create a new test filter, click Tests in the menu and click
(New Filter) in the toolbar.
5. In the tree, click
on the left of the test that you want to assign to the execution plan.
Clicking the assign arrow of a folder or the top-level container assigns all child tests of that parent to the
selected execution plan.
Tip: Right-click a node to expand and collapse it.
188
| Silk Central 15.5
Assigning Tests to Execution Plans through a Filter
The tests that are assigned to the selected execution plans are listed on the Assigned Tests page.
You have to create a filter with the category Test before you can perform the following steps. See Creating
Filters for details. Alternatively select an existing filter.
To use a filter to assign one or more tests to an execution plan:
1. In the menu, click Execution Planning > Details View.
2. Select the execution plan to which you want to assign tests.
3. Click the Assigned Tests tab.
4. Click the Assignment by filter option.
5. Choose a filter from the list.
Note: If you assign tests to an execution plan in Tests > Grid View , the test assignment type is
automatically set to Manual Assignment, but the previously-filtered tests remain in the Assigned
Tests page.
Locating Tests Assigned to Execution Plans
To locate manually assigned tests in the Tests tree:
1. In the menu, click Execution Planning > Details View.
2. Select the execution plan for which you want to locate the assigned tests.
3. Click the Assigned Tests tab.
4. Optional: Select Manual assignment, if it is not selected.
5. In the Actions column of a test, click
to find out in which test folder or container the test is stored in.
The corresponding parent folder is expanded in the Tests tree and the assigned test is highlighted in blue.
Removing Test Assignments
To remove a manually assigned test:
1. In the menu, click Execution Planning > Details View.
2. Select the execution plan from which you want to remove the assignment.
3. Click the Assigned Tests tab.
4. In the Actions column of the assigned test, click
.
Repeat this step for all assignments that you want to delete.
Tip: To remove all assigned tests, click Remove All.
Execution Assigned Tests Page
Execution Planning > Details View > <Execution Element> > Assigned Tests
Note: This page is not displayed for execution plans that are assigned to a testing cycle.
The Assigned Tests page lists all tests that are assigned to the selected execution plan or configuration
suite. Use this page to assign additional tests to the execution plan or configuration suite, to remove tests
from the execution plan or configuration suite, or to change the execution order of the assigned tests.
If you have created a test filter, you can select it from the filter list above the Tests tree. To create a new
test filter, navigate to the Tests area and click New Filter on the toolbar.
Silk Central 15.5
| 189
Note: All changes in this page are immediately applied.
Note: When you access the page from a sub-element of a configuration suite, the page is read-only.
The page includes the following items:
Item
Description
Manual assignment
Click to manually assign tests to the execution plan or configuration suite.
Use tree order
Check to set the execution order of the assigned tests to follow the execution
order in the Tests area.
Synchronize Current Runs
Click to synchronize the list of assigned tests with the most current test
assignment.
Assign Saved Selection
Click to assign a selection of tests from Tests > Grid View.
Assignment by filter
Click to automatically assign tests to the execution plan or configuration suite
based on a pre-defined filter. The available filters are listed in the list box.
Assigned Tests
Amount of tests that are assigned to the execution plan or configuration suite.
Time Left in Testing Cycle
[hh:mm]
This field is available when an execution plan is in a testing cycle. It indicates
the hours remaining in a testing cycle after subtracting the combined planned
time of all tests from the Available Time in the testing cycle.
Note: Planned Time is for manual tests only.
Planned Time
The estimated time to execute all tests in the execution plan or configuration
suite. For configuration suites, the Planned Time is the sum of the planned
times of all the configurations in the suite.
Note: Planned Time is for manual tests only.
Assigned Tests List
For each assigned test, the page displays the following columns:
Order
The execution order of the test. Uncheck the Use tree order
check box to change the execution order. Click in the text box,
type the new order of the test, and then press Enter to
confirm the change. Each change in each of the text boxes
must be confirmed by pressing Enter. If you change the
orders of multiple tests without pressing Enter each time, just
the last change before pressing Enter is taken.
Actions
You can perform the following actions on the assigned tests
when the Manual assignment option button is clicked:
Action
Description
Remove the selected test from the list.
Locate the selected test in the test tree.
190
| Silk Central 15.5
Test
Name of the test. Click to access the test in the Tests area.
Status
Status of the last run of the test in the context of the execution
plan or the configuration suite. When the test is executed
outside of the context of the execution plan or configuration
suite, the displayed status remains unchanged. If the test has
Item
Description
not yet been executed in the context of the execution plan or
configuration suite, the status is N/A.
For tests or test packages that are included in a configuration
suite, the status is an aggregation of all statuses of all
configurations within the suite:
•
If the test is assigned only to the configuration suite, the
status is Passed only if it is passed in all configurations. If
the status is not Passed in all configurations, the status of
the worst run is propagated, with the following top-down
priority:
1.
2.
3.
4.
•
•
Test
N/A
Not Executed
Failed
Passed
The status of a requirement that is assigned to the test is
Failed if the test fails in one or more of the
configurations.
We do not recommend assigning the test to a configuration
suite and one or more simple execution plans. However, in
this case, the aggregate of the configuration statuses is one
status, and the last statuses of the execution plans are
other statuses. The status that was executed last
determines the last status of the test.
If the test is assigned to a simple execution plan only, the
status is updated in response to the status of the last test
run.
Last
Execution
Date and time of the last run of the test in the context of the
execution plan or configuration suite. When the test is
executed outside of the context of the execution plan or
configuration suite, the displayed time and date remain
unchanged.
Planned
Time
The estimated time for the execution of the test.
Note: Planned Time is for manual tests only.
Shows all tests in the Tests tree that are available for assignment to the
selected execution plan or configuration suite. Double-click a test or use
to
assign the tests to the execution plan or configuration suite. For information
about inserting multiple tests from the Tests area to the execution plan or
configuration suite, see Assigning Tests from Grid View to Execution Plans.
Schedules
In the Schedule page, once you have defined the tests that are to be included in an execution plan, a
folder, or a configuration suite, you can define the schedule, by which the execution plan, folder, or
configuration suite is to be executed.
Three scheduling options are available:
Silk Central 15.5
| 191
•
•
•
None
Global
Custom
Note: You can define schedules for execution plans, folders, or configuration suites. If a schedule is
defined for a folder or a configuration suite, all execution plans that are included in the selected folder
or configuration suite will be executed at the specified schedule. All execution plans, folders, or
configuration suites with no keywords assigned get the status Not Executed when executed in a
schedule. The scheduling options for parts of a project copy or baseline are set to none to prevent
losing the last execution status. For more information on copies and baselines of projects, see the
Administration topics in this Help.
Definite Runs
Definite runs enable you to define times at which tests will be executed regardless of configured schedules.
Creating a Custom Schedule
To create a custom schedule for a selected execution plan, folder, or configuration suite:
1. In the menu, click Execution Planning > Details View.
2. Select the execution plan, folder, or configuration suite for which you want to configure a custom
schedule.
Note: To save an edited version of a global schedule as a custom schedule, click Edit while the
global schedule is selected in the list box. This enables you to edit the global schedule and save
the result as a custom schedule.
3. Click the Schedule tab.
4. Click the Custom option to enable the scheduling controls.
5. Click Edit.
6. Click
next to the From field and use the calendar tool to specify the time and date when the
execution schedule should begin.
7. Specify the Interval at which the tests should be executed.
8. In the Run section, specify when the schedule should end.
Select one of the following options:
•
•
•
Click Forever to define a schedule with no end.
Click n Time(s).
Click
next to the until field and use the calendar tool to specify the time and date when the
execution schedule should end.
9. Optional: Click Add Exclusion to define times when scheduled elements should not be executed.
10.Optional: Click Add Definite Run to define times when unscheduled executions should be executed.
11.Click Save to save your custom schedule.
Specifying Global Schedules
Silk Central offers the possibility of defining global schedules, which can be reused in Silk Central for the
scheduling of tests. Global schedules can speed up the process of scheduling tests, since the need to
define individual schedules for each test is reduced to only those tests that require special scheduling.
To select a pre-defined schedule that is globally available throughout Silk Central:
1. In the menu, click Execution Planning > Details View.
2. Select the execution plan, folder, or configuration suite for which you want to configure a schedule.
3. Click the Schedule tab.
192
| Silk Central 15.5
4. Click the Global option button.
5. Select the required pre-defined schedule from the list box.
Details of the pre-defined schedule are displayed in a read-only calendar view. To save an edited
version of a global schedule as a custom schedule, click Edit.
Note: You can configure global schedules in Administration > Schedules.
Specifying No Schedule
To specify that no schedule should be defined for an execution plan, a folder, or a configuration suite:
1. In the menu, click Execution Planning > Details View.
2. Select the execution plan, folder, or configuration suite, for which you want to define that it is not to be
executed based on schedules.
3. Click the Schedule tab.
4. Click the None option button.
Schedule Exclusions
A schedule exclusion is a regularly occurring time period during which executions should be suspended,
for example during a weekly planned system downtime or during weekends. You can add as many
exclusions to a schedule as you need. Exclusions enable you to define weekdays and time-of-day intervals
during which tests are not to be executed, regardless of configured schedules. For example, you may not
want tests to be executed on weekends.
Adding Exclusions
Note: You must have administrator rights to edit global schedules. To define a scheduling exclusion
for a global schedule, navigate to Administration > Schedules.
To add an exclusion to a custom schedule:
1. In the menu, click Execution Planning > Details View.
2. Select an execution plan, folder, or configuration suite, for which you want to add a scheduling
exclusion.
3. Click the Schedule tab.
4. Click the Custom option to enable the scheduling controls.
5. Click Add Exclusion.
6. On the Configure Schedule Exclusion page, select the weekdays on which tests should be
suppressed.
7. Define the specific time intervals on those days during which execution should be suppressed.
8. Click OK. Your exclusion settings are now listed on the Schedule page.
9. Click Save to add the exclusion to the current schedule, or continue adding additional exclusions.
Editing Exclusions
To edit an exclusion:
1. In the menu, click Execution Planning > Details View.
2. Select the execution plan, folder, or configuration suite, for which you want to edit a previously
configured exclusion.
3. Click the Schedule tab.
4. In the Actions column of the exclusion, click
.
Silk Central 15.5
| 193
5. Edit the exclusion as required and click OK.
6. Click Save.
Deleting Exclusions
To delete an exclusion:
1. In the menu, click Execution Planning > Details View.
2. Select the execution plan, folder, or configuration suite, for which you want to delete a previously
configured exclusion.
3. Click the Schedule tab.
4.
In the Actions column of the exclusion, click
.
Definite Runs
A definite run is a run of an execution plan, a folder, or a configuration suite, that you schedule to run at a
specific time, independent of the schedule that is configured for the execution plan, folder, or configuration
suite. You can add as many definite runs to a schedule as you need.
Adding Definite Runs
Note: You must have administrator rights to edit global schedules. To define a definite run for a global
schedule, navigate to Administration > Schedules.
To add a definite run to a custom schedule:
1. In the menu, click Execution Planning > Details View.
2. Select the execution plan, folder, or configuration suite, for which you want to add a definite run.
3. Click the Schedule tab.
4. Click the Custom option to enable the scheduling controls.
5. Click Add Definite Run.
6. On the Configure Definite Run page, click
and select the date and time when the execution plan,
folder, or configuration suite, should definitely be run.
7. Click OK. Your definite run settings are listed on the Schedule page.
8. Click Save to add the definite run to the current schedule, or continue adding definite runs.
Editing Definite Runs
To edit a definite run:
1. In the menu, click Execution Planning > Details View.
2. Select the execution plan, folder, or configuration suite, for which you want to edit a previously
configured definite run.
3. Click the Schedule tab.
4. In the Actions column of the definite run, click
.
5. Edit the definite run criteria as required and then click Save.
Deleting Definite Runs
To delete a definite run:
1. In the menu, click Execution Planning > Details View.
2. Select the execution plan, folder, or configuration suite, for which you want to delete a previously
configured definite run.
194
| Silk Central 15.5
3. Click the Schedule tab.
4.
In the Actions column of the definite run, click
.
Schedule Page
Execution Planning > Details View > <Execution Element> > Schedule
Note: This page is not displayed for execution plans that are assigned to a testing cycle.
The Schedule page is used to define schedules for execution plans, folders, configuration suites, and
report subscriptions.
The page provides the following schedule types:
Schedule Type
Description
None
Click this option button so that the asset is not executed
based on a schedule. All schedules included in a copy or
baseline of a project are initially set to None.
Global
Click this option button to select a pre-defined schedule
from the list box for the asset. Selecting a global schedule
includes the schedule exclusions and definite runs which
are defined in the global schedule. For information on
defining global schedules, see the Administration topics
in this Help. Selecting a global schedule displays the
schedule details below the Custom option button.
Custom
Click this option button to define a custom schedule for
the execution plan, folder, or configuration suite. Click
Edit to edit the custom schedule in the fields below.
For each selected schedule type, the page displays details. For a custom schedule, the details are
editable.
Caution: If tests assigned to an asset are not executed, the reason might be that the asset is still
executing because of an earlier schedule, and the schedule interval is shorter than the duration of the
execution. In this case, either increase the schedule interval, improve the performance of the
executed tests, or remove tests from the execution plan. To view the application server logfile, click
the Application Server Log tab in Administration > Log Files .
Schedule Details
The page displays details for the selected schedule type, which are editable for a custom schedule.
Item
Description
From
Specifies when the execution schedule begins. Click
next to the specified date to change the date and time.
Interval
Specifies the interval at which the tests are executed.
Adjust schedule to daylight savings
Check this check box to automatically have your
schedule adjust to daylight savings time.
Note: Daylight adjustment only works for intervals
of two-hour multiples to avoid duplicate runs when
setting time back one hour.
Run
Specifies when the execution ends:
Silk Central 15.5
| 195
Item
Description
Forever
Click this option button to specify that the
execution should not stop executing.
Time(s)
Click this option button and select a number
from the list box to define a specific number
of executions.
Until
Click this option button to pick a specific time
at which test executions are to end. Click
next to the specified date to change the date
and time.
Exclusion
The exclusions that are defined for the schedule. To add
an exclusion, click Add Exclusion.
Definite Runs
The definite runs that are defined for the schedule. To
add a definite run, click Add Definite Run. Click
in
the action column of a selected definite run to access the
calendar tool and specify when the definite run is to take
place.
Executing Tests Assigned to Execution Plans
This section explains how to run tests that are assigned to execution plans with Silk Central.
You can run individual execution plans, folders, and configuration suites. In all cases you can define
whether all assigned tests, or only tests matching certain status criteria should be executed. After an
execution plan including automated tests is started, it is put in the central execution queue and an
appropriate execution server is chosen to accomplish automated execution of the tests, based on the
matching keywords and the server availability.
Starting Execution Plans
To run an execution plan independent of a schedule:
1. In the menu, click Execution Planning > Details View.
2. In the Execution Plans tree, select the execution plan, folder, or configuration suite that you want to
execute.
3.
Click
(Run) on the toolbar. The Run dialog box appears.
4. Define which tests you want to execute in the Run dialog box.
5. If the execution plan does not contain pending manual tests, the Go To Activities dialog box displays.
Click Yes to view the details of the execution plan runs in the Activities page, or click No if you want to
remain on the current Web page.
Note: Check the Don't show this dialog again (during this login session) check box if you do
not want to be asked about switching to the Activities page again in the future. This setting will be
discarded when you log out of Silk Central.
Run Dialog Box
Execution Planning > Details View > <Execution Element> > Run
Execution Planning > Document View > <Execution Element> > Run
196
| Silk Central 15.5
The Run dialog box enables you to specify which tests you want to execute based on filter criteria and to
specify which product build the test should be run against. To open the Run dialog box, select an executon
plan or an execution folder and click Run on the toolbar.
Item
Description
All tests
Select this option to execute all tests.
Tests...
Select this option to only execute tests that meet one of
the following options:
Option
Description
With status
Failed
Check to re-execute all tests in the
selected execution plan, that have the
status Failed.
Not run
with
build ...
Check to re-execute all tests in the
selected build that are not executed in
the selected build. Tests that are
executed in the selected or a later build
are not re-executed.
Tests that have had issues fixed since their last run
Select this option to only execute those tests that have
had issues advanced to the Fixed state since the test's
last execution.
Set build for execution plan
Select a past build from the Set build for execution plan
list box to have the test run against a specific past build.
This field defaults to the current build. Note that this
option is not available if the execution plan is configured
to read the build number from a build information file. If
an execution folder contains execution plans with
different product versions assigned to each, the build
cannot be selected for the execution of the execution
folder.
Run type
Choose Run as specified to run all selected tests with
their own test type, or choose Run automated tests
manually to re-run all selected tests manually.
Go to Activities page
Check this check box to advance to the Activities page
after you define tests for execution.
Manually Executing Automated Tests
Automated tests might sometimes deliver unexpected results because of environmental issues. When such
a test fails in a system, and you want to verify if the failure is caused by a system component, or you know
that the problem is caused by a currently dysfunctional system component, you can re-run the automated
test manually.
To run an automated test manually, perform the following steps:
1. In the menu, click Execution Planning > Details View.
2. In the Execution Plans tree, select the execution plan, folder, or configuration suite that you want to
execute.
3.
Click
(Run) on the toolbar. The Run dialog box appears.
4. Define which tests you want to execute.
5. Select Run automated tests manually in the Run type list box. All selected tests are then treated as
manual tests, and the Current Run page opens.
Silk Central 15.5
| 197
Manual Testing
The manual testing functionality of Silk Central allows testers to efficiently execute manual tests. The
Manual Testing window provides an intuitive, easy-to-use UI with just the information that is relevant to
the manual tester in the execution process.
Manual testers have quick access to the Manual Testing window via the dashboard panel Manual Tests
Assigned to Me. For more information on the dashboard and on panels, see Dashboard. The Manual
Testing window is structured as follows: In the overview area, it lists the tests that are contained by the
selected execution plan or testing cycle. Beneath, in the test steps area, it displays the list of steps that are
configured for the selected test. Manual testers can process the steps from the top to the bottom.
As a manual tester, you can tick off tests and test steps when you have executed them successfully, write
a result text, create and assign issues, and attach result files. Additionally, you can capture screen images
and record videos to illustrate how you executed a test or test step, or to show an issue that occurred
during the testing process.
The integrated timer shows you, how long it took you to execute a test and a bar visualizes the testing
progress. The Testbook (which is a panel you can add to your dashboard) shows you real-time updates
about all activities that take place during manual testing within a project.
Manual Testing Window
To open the Manual Testing window, click Home > My Dashboard in the menu, and then click
(Continue Manual Test) in the panel Manual Tests Assigned to Me. If this panel does not display on
your dashboard, you have to add it. For more information on the dashboard and on panels, see
Dashboard.
You can also access the Manual Testing window on the Activities page (in the menu, click Tracking >
Activities) in the Current Executions grid, or on the Current Run page.
The Manual Testing window shows two areas:
•
•
The overview area on the top.
The test steps area on the bottom.
Overview Area
The overview area is the area on the top of the Manual Testing window.
The overview area shows:
Item
Button
Description
Execution plan or testing
cycle
The name of the execution plan or testing cycle that contains the
tests.
Edit Settings
Click the button to edit the following settings:
•
•
•
You can configure if the next test/step should automatically be
selected when the status of a test/step is changed.
You can configure which additional test information shall display in
the overview area.
You can hide or display certain actions (like the Edit version and
build action).
These settings can be defined individually for each user.
Finish
198
| Silk Central 15.5
Click Finish to finish the run. This option displays only if you open a
test that is unassigned or that is assigned to an execution plan. It
Item
Button
Description
does not display if you open a test that is assigned to a testing cycle.
Select the action you want to perform for tests that have not been
executed and click Finish. The selected status change will only be
applied to non-executed tests for which no status reason has been
set.
Passed
Click the button to mark the status of the currently selected test as
Passed and automatically select the next test. This is the default
setting of the button.
Failed
Click the button to mark the status of the currently selected test as
Failed and automatically select the next test.
Test name
The list that appears shows all tests of the execution plan or testing
cycle and their current status. Click on a test or press the Up and
Down keys to navigate through the tests and their steps. If you
specified to run a test with a certain configuration, the configuration
name displays next to the test name in parenthesis. For more
information, see Manual Configuration Testing. Click
test in the Details View of the Tests area.
to show the
Requirements Assigned
Click the button to view the requirements that were assigned to the
test. The button displays only if there is at least one requirement
assigned. The number beside the button shows how many
requirements were assigned.
Issues Assigned
Click the button to view the issues that were assigned to the test. The
button displays only if there is at least one issue assigned. The
number beside the button shows how many issues were assigned.
The Issues dialog box shows both the issues that were assigned to
the test and the issues that were assigned to the test steps.
Attachments Assigned
Click the button to view the attachments that were assigned to the
test. The button displays only if there is at least one attachment
assigned. The number beside the button shows how many
attachments were assigned.
Block/Unblock
Click the button to set the test to blocked/unblocked. Setting a test to
blocked is useful to indicate that the test cannot be continued due to
certain restrictions, for example a problem with the IT infrastructure.
Test Status
The status of the test. It can be set automatically or manually. Click
beside the status icon to select a status. For more information,
see Statuses of Tests and Test Steps.
Edit Version and Build
Click the button to edit the version and the build. For more
information, see Editing Version and Build.
Capture Screen
Click the button to capture an image of your screen and to attach it to
the test. The captured image will be added to the attachment list. For
more information, see Capturing Screen Images.
Record Video
Click the button to record a video of the actions on your screen and to
attach it to the test. The video will be added to the attachment list and
you can save it to your local file system. For more information, see
Recording Videos.
Attach Result File
Click the button to attach a result file to the test. For more information,
see Attaching Result Files.
Silk Central 15.5
| 199
Item
Button
Description
Assign or Create Issue
Click the button to create a new issue and attach it to the test or to
assign an existing issue. For more information, see Assigning or
Creating Issues.
Start Code Analysis
Click the button to start the analyzing process. The Start Code
Analysis dialog box displays. Select a Profile and enter one or more
Hostnames. If coverage information already exists for this test, you
can replace it by checking the checkbox. Click Start Code Analysis
to actually start the process. When you click Stop Code Analysis,
Silk Central stores the code analysis information to the test run.
Synchronize Test Run
Click the button to synchronize a test run with an adapted test. If you
started to execute a test and you decide to make changes to this test
in the Tests unit in the meantime, you can synchronize the test run
with the adapted test.
Note: To close a dialog box, click anywhere outside or click
(Close).
Test Steps Area
The test steps area is below the overview area on the Manual Testing window.
The test step area shows:
Item
Edit Used Time
Butto
n
Description
Click the button to manually enter how long it took you to execute the test. When
you open the Manual Testing window or if you select another test, the timer
automatically starts. The flashing colon indicates that the timer is running. Click
to pause the timer, click
to start the timer. The figures on the left side show
the actually used time, the figures on the right side show the planned time.
200
Progress Bar
Visualizes the testing progress. The progress bar shows how many steps you
have already executed.
Post Message to
Testbook
Click the button to post a message to the Testbook.
Passed
Click the button to mark the status of the currently selected test step as Passed
and automatically select the next step. This is the default setting of the button.
Failed
Click the button to mark the status of the currently selected test step as Failed
and automatically select the next step. This is the default setting of the button.
Show/Hide Details
Click the button to expand a test step and to display detailed information like the
Action Description or the Expected Results as well as all buttons and the
result field.
Step name
The name of the test step. Step names with the status Not Executed are bold.
Issues Assigned
Click the button to view the issues that are assigned to the test step. The button
displays only if there is at least one issue assigned. The number beside the
button shows how many issues are assigned.
Attachments Assigned
Click the button to view the attachments that are assigned to the test step. The
button displays only if there is at least one attachment assigned. The number
beside the button shows how many attachments are assigned.
| Silk Central 15.5
Item
Butto
n
Description
Step Status
The status of the step. Click
beside the status icon to select a status. Silk
Central will automatically calculate a test status based on the step statuses. For
more information, see Statuses of Tests and Test Steps.
Result field
Enter result text into the field. Click anywhere outside to save the text.
Capture Screen
Click the button to capture an image of your screen and to attach it to the test
step. The captured image will be added to the attachment list. For more
information, see Capturing Screen Images.
Record Video
Click the button to record a video of the actions on your screen and to attach it to
the test step. The video will be added to the attachment list and you can save it to
your local file system. For more information, see Recording Videos.
Attach Result File
Click the button to attach a result file to the test step. For more information, see
Attaching Result Files.
Assign or Create Issue
Click the button to create a new issue and attach it to the test step or to assign an
existing issue. For more information, see Assigning or Creating Issues.
Note: To close a dialog box, click anywhere outside or click
(Close).
Tip: You can use the keyboard when you work on a test: To change the status of the selected test
step, use the shortcuts Ctrl+Shift+A (for passed) and Ctrl+Shift+S (for failed). These combinations
can easily be pressed with one hand. Press the Up and Down keys to navigate through the tests and
their steps, press Right to expand a step and Left to collapse it. To close a dialog box, press Esc.
Capturing Screen Images
When you execute tests in the Manual Testing window, you can capture images of your screen. The
captured images will be attached to the test or test step. This is especially helpful when a test step fails and
you want to outline when, where, and how the issue occurred.
Make sure that you have a Java Runtime Environment (JRE) installed and that the application is allowed to
run. Otherwise you will not be able to capture screen images. You can download the JRE from http://
www.oracle.com/technetwork/java/javase/downloads/index.html.
To capture a screen image:
1. Open the Manual Testing window. For more information, see Manual Testing Window.
2. Click
(Show Details) on the left side to expand a test step.
3.
Click
(Capture Screen) . The Screen Capturing functionality starts.
4. Perform one of the following actions:
•
•
•
Draw a rectangle with your mouse to select the area that shall be captured.
Press Enter to take a capture of the entire screen. If you have more than one monitor, the screen of
all monitors will be captured.
Press Esc to cancel.
The Screen Capturing window appears.
5. Edit the screen capture as desired. You can add text and graphical items like arrows and rectangles. In
the editor, you can use the keyboard to perform the following actions:
•
Press the arrow keys to move objects (like rectangles or arrows) around. Hold down Shift and press
the arrow keys to precisely adjust the position.
Silk Central 15.5
| 201
•
•
•
Select an object with the Move tool and press Backspace or Delete to remove the object.
If you use the text tool, you can press Shift+Enter to confirm the input or press Esc to cancel.
Press Ctrl+C to copy the screen capture to the clipboard.
6. Click Upload. The screen capture is attached to the test step.
7. To view the attached screen capture, click
files appears.
8. You can delete attached files by clicking
(Open).
. The Attachments dialog box with a list of all attached
(Delete Result File) or open the files by clicking
Note: In this dialog box, you can only delete files you have attached during the current test run.
You cannot delete files that were assigned to the test before the testing cycle/execution plan was
started.
Note: You can perform the task described in this topic both on test level and on step level.
Recording Videos
When you execute tests in the Manual Testing window, you can record videos of the testing process. This
is especially helpful when a test step fails and you want to outline when, where, and how the issue
occurred.
The video will be attached to the test step where you started the recording from. For example: If you start
the recording from step two and you continue with step three and four while the recording is yet running,
the video will still be attached to step two.
Make sure that you have a Java Runtime Environment (JRE) installed and that the application is allowed to
run. Otherwise you will not be able to record videos. You can download the JRE from http://
www.oracle.com/technetwork/java/javase/downloads/index.html.
Note: Video recording is only supported on Microsoft Windows client machines.
To record a video:
1. Open the Manual Testing window. For more information, see Manual Testing Window.
2. Click
(Show Details) on the left side to expand a test step.
3.
Click
starts.
(Record Video). The Video Recording window appears and the recording automatically
4. When you are done, click Stop Video Recording.
5. Enter a Result filename and click Upload File to attach the video to the test step. You can also click
Save File to save it to your local computer.
6. Click Close.
7. To view the attached video, click
appears.
. The Attachments dialog box with a list of all attached files
8. You can delete attached files by clicking
(Open).
(Delete Result File) or open the files by clicking
Note: In this dialog box, you can only delete files you have attached during the current test run.
You cannot delete files that were assigned to the test before the testing cycle/execution plan was
started.
Note: You can perform the task described in this topic both on test level and on step level.
202
| Silk Central 15.5
Attaching Result Files
When you execute tests in the Manual Testing window, you can attach result files to each test step.
To attach a result file:
1. Open the Manual Testing window. For more information, see Manual Testing Window.
2. Click
(Show Details) on the left side to expand a test step.
3.
Click
(Attach Result File). The system file manager opens.
4. Browse for the file that you want to attach and confirm. The file is attached to the test step.
5. To view the attached file, click . The Attachments dialog box with a list of all attached files appears.
6. You can delete attached files by clicking
(Open).
(Delete Result File) or open the files by clicking
Note: In this dialog box, you can only delete files you have attached during the current test run.
You cannot delete files that were assigned to the test before the testing cycle/execution plan was
started.
Note: You can limit the size of the result files that testers are allowed to upload. For more information,
see Setting the Maximum Size of Step Result Files.
Note: You can perform the task described in this topic both on test level and on step level.
Assigning or Creating Issues
When you execute tests in the Manual Testing window, you can assign issues to each test step.
To assign an issue:
1. Open the Manual Testing window. For more information, see Manual Testing Window.
2. Click
3.
Click
(Show Details) on the left side to expand a test step.
(Assign or Create Issue). The Assign or Create Issue dialog box appears.
4. If you want to assign an existing issue, click Assign existing issue and type the issue number in the
Issue ID field.
5. If you want to create a new issue, click Create new issue. Enter information about the issue in the
fields and select values from the lists.
6. Click OK. The issue is assigned to the test step.
7. To view the assigned issue, click
8. If you click
. The Issues dialog box with a list of all attached issues appears.
(Open Issue), you are directed to an external issue tracking tool or to Issue Manager. To
delete an issue, click
(Delete Issue).
Note: In this dialog box, you can only delete issues you have assigned during the current test run.
You cannot delete issues that were assigned to the test before the testing cycle/execution plan
was started.
Note: When you create a new issue, Silk Central automatically creates links to all result files that are
currently assigned to the step or to the test. These links display in the description of the issue in your
issue tracking tool. This way, you can directly download result files out of your issue tracking tool.
Note: You can perform the task described in this topic both on test level and on step level.
Silk Central 15.5
| 203
Editing Version and Build
To edit the version and the build in the Manual Testing window, click
overview area. If the button does not display, click
(Edit Version and Build) in the
(Edit Settings) and enable the action.
The tests of a testing cycle might not be done with only one build, but with several ones. This is especially
probable if you have long testing cycles with many tests. For example: The tests 1 and 2 of a testing cycle
are executed with build 315, test 3 of the same testing cycle is executed with build 316.
The configured build and version are stored for each test and display in all relevant grids within Silk
Central.
When you set a build for a test, this build is automatically set for all tests ...
•
•
•
that are assigned to you or that are not assigned to any specific tester, and
that have not yet been executed (tests that have the status Not Executed), and
that belong to the same project and product.
So you do not have to set the same build again and again for each test that you are executing
subsequently.
Statuses of Tests and Test Steps
When you set the status of a test step in the Manual Testing window, the status of the test changes. The
following table shows how Silk Central calculates the test status depending on the statuses of the test
steps:
Status
Description
Passed
If all steps are passed, the test status is set to Passed. No status
reasons from test steps are propagated to a test's status.
Failed
If all steps are executed and at least one step is failed, the test status is
set to Failed. The status reason of the first failed test step is used as
the failed status reason for the test.
Not Executed
As long as all steps are not executed, the test status is set to Not
Executed. The status reason of the first not-executed test step is used
as the not executed status reason for the test.
If you change the status of at least one step, the test status is set to In
Progress.
In Progress
Until every step is executed, the test status is set to In Progress.
You can also set the test status manually. In the overview area of the Manual Testing window, or in the
test steps area of a test step, click
(Select Status) beside the status icon and select a status. See
Status Reasons for detailed information about defining reasons for each status.
Apart from the test's status, you can also set a test to being blocked. Setting a test to blocked is useful
to indicate that the test cannot be continued due to certain restrictions, for example a problem with the IT
infrastructure.
Note the following:
•
•
•
204
| Silk Central 15.5
A manually set test status overwrites the automatically calculated one.
If you change a step status afterwards, the test status is calculated again.
You can manually set a test status back to Not Executed. However, Silk Central will never
automatically set back the test status to Not Executed.
•
You can manually set a test status to In Progress, even if you do not change any step status.
Printing Manual Tests
You can print a form of each test and fill in the result, the used time, the status, and other information by
hand.
To print a manual test:
1. In the menu, click Home > My Dashboard.
2. In the panel Manual Tests Assigned to Me, click
column. The Manual Test Results View appears.
(View Manual Test Results) in the Actions
3. Click Print or Download as PDF.
Testbook
The Testbook is a dashboard panel that gives you real-time updates about all activities that take place
during manual testing. It shows you who did what and when in the different testing cycles and execution
plans. The Testbook simplifies the coordination and collaboration among testers and test managers.
You can filter the entries by user, action, and testing cycle. The panel shows the activities of just one
(Configure) in the header of the panel. To view
project. To configure a project for the panel, click
activities in other projects, you can add more panels. For more information on panels, see Dashboard.
For each entry the user name is displayed and (if available) the full name. For organizations that do not
use meaningful user names, the full name of a user is better recognizable for the other users within a team.
On the Manual Testing window, you can post a message to the Testbook by clicking
.
Entries older than 60 days are deleted automatically. To change this default setting, open the file Conf
\AppServer\TMAppserverHomeConf.xml and edit the following setting:
<MaximumActivityLogLifeTimeInDays>60</MaximumActivityLogLifeTimeInDays>
The following activities are logged in the Testbook:
Icon
Activity
Icon
Activity
Testing cycle started
Test added
Testing cycle finished
Test started
Testing cycle removed
Test finished
Milestone added
Test reassigned
Milestone edited
Test removed
Milestone removed
Message posted
Offline Manual Testing
Offline Manual Testing allows you to download tests and complete them offline. It also allows you to upload
your results back to Silk Central.
Silk Central 15.5
| 205
Testers use the Manual Tests Assigned to Me panel to download manual tests and upload results back
to Silk Central. Test Managers use the Offline Manual Testing Overview panel to view and manage
downloaded tests.
Note: A Manual Testing license is checked out when a test is downloaded for offline execution. The
license is checked back in when results are uploaded.
Downloading Manual Tests for Offline Execution
This topic will show you how to download tests and enter the Status, Reason and Results while you are
offline.
1. Go to Home > My Dashboard. Ensure that the Manual Tests Assigned to Me panel is visible.
2. Select one or more tests. Right click your selection and choose Download Selected Manual Tests for
Offline Execution. You can also select a single test and choose Download all Manual Tests of the
Related Execution Plan for Offline Execution.
Tip: Make use of the Rows per page setting and the sorting and filtering capabilities to receive
the list of tests that you need to select.
3. In the Download Manual Tests for Offline Execution dialog box, specify how you want the tests to be
organized in Excel:
• Create a separate worksheet for each test with a list of steps
• Create a single worksheet with a list of tests without steps
4. Click Download. Download and save the Excel file.
5. Open the file and, depending in which format you downloaded the Excel file, enter the Status and the
Result or Used Time for each step or for each test.
6. Save the file.
Uploading Offline Manual Test Results
Once your downloaded manual tests are complete, use the following procedure to upload the results to Silk
Central.
1. Go to Home > My Dashboard. Ensure that the Manual Tests Assigned to Me panel is visible.
2. Click Upload Offline Manual Test Results. The Upload Offline Manual Test Results dialog box
displays.
3. Click Choose File and browse to your Excel file. The Open dialog box displays.
4. Select the file to upload and click Open.
5. Click Upload. A dialog box will display indicating the status of the upload.
6. Click OK.
Analyzing Test Runs
This section describes how you can analyze test runs with Silk Central.
Analyzing Manual Test Results
When you have a test run in either a finished or unfinished context, use the Manual Test Results view to
provide an easy to read result view for manual tests including all information like attached issues and
attachments. All of this information is immediately visible. You can print and download a PDF version as
well.
The Manual Test Results view contains a tree view on the left and a details view on the right. The tree
view is based on context of the selection in which the result view was opened. For example, if you selected
a test cycle, you could see all the assigned testers and their tests. Selecting a specific node updates the
details view with the appropriate information of the selection.
206
| Silk Central 15.5
To open the Manual Test Results view, click the View Manual Test Results icon ( ) of a test in nearly
all contexts where you view manual tests. This includes manual execution planning, dashboard panels,
activities pages, and the execution Runs grid and test Runs grid.
Analyzing Automated Test Results
View the test results of an execution plan run for an enhanced root cause analysis or compare the results
of multiple runs to visualize distinctions of test statuses.
The Test Results view and the Run Comparison view provide an easy to read results overview with full
drill-down capabilities. All information is included, like result files, thumbnail screenshots, messages, and
stacktraces. This allows you to quickly analyze the root cause of failed test runs, especially because you
can also compare the results of multiple runs side-by-side.
For example, you may be interested in performing the following tasks:
•
•
•
Analyze the runs of all configurations within a configuration suite or within execution plans which
represent configurations
Compare runs of the same execution plan, for example to find out if any test statuses have changed
Show all failed tests of an execution plan at once
To analyze the results of automated test runs:
1. In the execution Runs grid or the Activities > Last Executions grid, select one or more executions.
2. Click the View automated test results icon to analyze the results of a single execution, or right-click
your selection and choose Compare Automated Test Results to compare multiple executions.
3. Click the icon at the top of the page or a specific status icon to access detailed information like result
files, thumbnail screenshots, messages, and stacktraces.
Tip: Use the Show failed tests only check box to narrow down the displayed results.
Comparing Test Results of Multiple Test Runs
Compare the results of multiple runs of one test to visualize distinctions of test statuses.
The Test Results view provides an optimized results overview with full drill-down capabilities. All
information is included, like result files, thumbnail screenshots, messages, and stacktraces. This allows
you to quickly analyze the root cause of failed test runs, especially because you can compare the results of
multiple runs side-by-side.
1. In the Test Runs grid ( Tests > Details View > <Test> > Runs ), select two or more runs.
2. Right-click your selection and choose Compare Automated Test Results to compare multiple test
runs.
3. Click the icon at the top of the page or a specific status icon to access detailed information like result
files, thumbnail screenshots, messages, and stacktraces.
Tip: Use the Show failed tests only check box to narrow down the displayed results.
Changing the Status of a Test Run
To manually change the status of a test run:
1. In the menu, click Execution Planning > Details View.
2. In the Execution Plans tree, select the execution plan that you want to edit.
3. Click the Runs tab.
4. Select the execution plan run. The test section of the Runs page lists the test runs.
5. Click on the Run ID of the test.
The Test Run Results dialog box displays.
Silk Central 15.5
| 207
6. Click the Details tab.
7. Click Change Status. The Change Status dialog box opens.
8. Select the new status for the test run from the New Status list box.
9. Type an explanation for the manual status change in the Comment text box.
Note: Inserting a comment is mandatory.
10.Click OK to confirm the status change.
Note: Status changes produce history changes. To view the history of all status changes for the test
run, click the Messages tab in the Test Run Results dialog box.
Viewing Test Run Details
To view the details of a test run:
1. In the menu, click Execution Planning > Details View.
2. Select an execution plan in the Execution Plans tree.
3. Click the Runs tab.
4. In the Test Runs grid at the bottom, click the Run ID of the test for which you want to see details. The
Test Run Results dialog box appears.
5. Click the Details tab.
Deleting Test Run Results
To delete the results of a specific test run:
1. In the menu, click Execution Planning > Details View.
2. In the Execution Plans tree, select the execution plan that you want to edit.
3. Click the Runs tab.
4. In the Actions column of the test run for which you want to delete results, click
.
5. Click Yes on the subsequent confirmation dialog box to complete the deletion.
Deleting Runs and Result Files of Execution Plans
You can decide if you want to delete runs (including result files as well as all other items and information
that belong to the run) or if you want to delete just the result files of the runs. Result files can be files that
require a lot of storage in the database, like videos or screen images. By deleting just the result files, you
can clean up your database and free up storage space, but at the same time you keep all the essential
information about your runs.
To delete runs or result files:
1. In the menu, click Execution Planning > Details View.
2. Right-click on an execution plan, a folder, a configuration suite, or a project in the Execution Plans tree
and select Delete Runs or Result Files.
3. The Delete Runs or Result Files dialog box appears. Select what you want to delete:
•
•
Click All runs (including result files) to delete all runs with all result files.
Click Result files of all runs to delete just the result files but not the runs themselves.
4. Check Within the time span from ... to ... to delete just the runs or result files of a certain time period.
5. Check Keep last run to delete all runs (within the time span, if specified) except the last run.
6. Click OK.
208
| Silk Central 15.5
Note: Runs of tagged builds will not be deleted with this action. To delete runs of tagged builds, untag
the build in Administration > Products, Version, and Builds > Products.
Note: If there are many items to be deleted, there may be a slight delay for the UI to update while the
items are removed from the database.
Note: If you right-click the project node to delete all runs or result files of the project, the runs or result
files of all unassigned tests will be deleted as well, even though unassigned tests do not display in the
Execution Plans tree.
Execution Plan Run Results
Tracking > Activities > Last Executions > Run ID
The Execution Plan Run Results dialog box lists the details of an execution plan run.
You can also access the dialog box from Execution Planning > Details View. Select the execution plan
for which you want to see details, click the Runs tab, right click on the run and choose View details.
The dialog box shows detailed information about the following items:
Item
Description
Execution Plan Name
Name of the execution plan.
Execution Plan ID
Unique identifier of the execution plan.
Execution Plan Run ID
Identifier of the execution plan run.
Start Time
Time the run was started.
Duration
Time consumed to execute all included tests. Includes
the duration of the setup and cleanup test and the time
consumed to fetch automation files and code coverage,
launch execution tools, and other tasks. For manual
executions this is the time between starting and finishing
the execution.
Execution Server
Execution server assigned to the execution plan.
Warnings/Errors
Amount of warnings and errors generated during the run.
Status
Displays the number of passed, failed and not executed
tests in a bar graph.
Version/Build
Version and build of the product specified for the run.
These either are set by the user for this execution plan, or
are read from the build information file at execution time.
If the build is tagged, it is marked bold and with .
Silk Test Classic AUT Host Name
Name of the Silk Test Classic AUT (Agent Under Test)
Host.
Setup Test
The test that prepared the testing environment in
anticipation of the test. Click on the name of the test to
view or edit it. Click on the ID of the test run to open the
Test Run Results dialog box.
Cleanup Test
The test that restored the testing environment to its
original state following the test. Click on the name of the
test to view or edit it. Click on the ID of the test run to
open the Test Run Results dialog box.
The Execution Plan Run Results dialog box provides additional information about the files included and
the messages generated during the execution plan run. It also lists all the assigned tests for the execution
plan.
Silk Central 15.5
| 209
For manual tests click Manual Test Results to get a read-only version of the Current Runs page, with
detailed information on the manual test.
The Assigned Tests section lists all tests that are assigned to this execution plan. Click on the name of a
test to view or edit it, or click on the Run ID of a test to open the Test Run Results dialog box.
Test Run Results
Execution Planning > Details View > Runs > <Execution Plan> > Assigned Tests > <Run ID>
The Test Run Results dialog box lists run details of a test. You can access the dialog box from the
following locations:
•
•
•
Tests > Details View > <Test> > Runs > <Run ID>
Execution Planning > Details View > Runs > <Execution Plan> > Assigned Tests > <Run ID>
Tracking > Activities > Last Executions > <Run ID> > Assigned Tests > <Run ID>
The Test Run Results dialog box displays the following tabs:
Tab
Description
Details
Shows the details of the test run, including its Duration, Execution Path, the
Execution Plan Run ID of the execution plan run that included the test run, any
Warnings/Errors, and the run comment, if a comment is added to the run. This tab
also allows you to change the status of the test run. This option is useful if you need
to manually overrule the status of a test run.
When a manual status change is performed, the details of the change are reflected
in this tab's Status, Status Changed On, Status Changed By, Previous Status,
and Status Change Comment fields.
Timeline
The Timeline tab shows a grid that allows easy result and error analysis of test runs
by combining the following:
•
The structure of the test suite if an output.xml file is available including
failure/error/warning count.
•
Incidents from the output.xml file.
•
•
Log entries and messages.
Result files.
The entries are listed chronologically and the view contains check boxes allowing
you to filter the different types of items.
You can also access this tab from the Analyze Results and Analyse Errors
actions in the Test Run grids.
Note: The tab is displayed for all test types except for manual tests and Silk
Test Workbench tests.
Specific
Only displayed for Silk Test Classic, Silk Performer, and manual tests. This tab
includes details that are specific to the selected test type. For example, when a Silk
Test Classic test is selected, this view includes the selected test case, test data, and
any warnings that were displayed during the test run.
Files
Lists all files that were generated by this test run, along with file sizes. The names of
Silk Test Classic .rex files act as download links. Once downloaded, these files can
be viewed directly in a text editor.
The upper table lists files that are associated with the test, such as result files or
manually uploaded files for manual tests. The lower table lists files that are
associated with the execution plan, for example execution log files or code analysis
results.
210
| Silk Central 15.5
Tab
Description
Click Download All Files to download all result files generated by the test run, as a
zipped package.
For Silk Test Workbench, click the result.stwx file to open Silk Test
Workbench in context of the result file.
For Silk Test Workbench, click the error.png to see the last screenshot for a
Visual Test when a playback error occurs.
Messages
Lists all messages that were generated by this test run, along with the severity of
the messages.
Messages that are associated with an execution plan as a whole, and not to one of
the individual tests, can be viewed in Executions > Activities > Messages
Success Conditions
Only displayed for automated tests. This tab shows all the success conditions that
are defined for the test in Tests > Details View > <Test> > Properties during the
test planning process, and the result values from the execution run. Success
conditions are used to determine if a test is Passed or if it has Failed.
Data Driven
Only displayed for data-driven tests using the option of having a single test for all
data rows of the data set. This tab lists the status of each instance (data row) run of
the test. Clicking an instance brings up another instance of the Test Run Results
dialog box with run details of the selected instance.
Attributes
Any attributes that are configured for the test.
Parameters
Any parameters that are configured for the test.
The following table lists the UI elements that are used to step through the test results of an execution run.
These elements are only visible when accessing the Test Run Results dialog box from an execution plan.
Item
Description
Skip Passed
Used to determine which test run results should be
displayed when browsing using the Previous Result and
Next Result buttons. Checking this option only displays
tests with a status other than Passed.
< Previous Result
Jumps to the result details of the previous test in the
selected execution plan run.
Next Result >
Jumps to the result details of the next test in the selected
execution plan run.
Viewing Execution Activities for Data-Driven Tests
To view execution activities for data-driven tests:
1. In the menu, click Execution Planning > Details View.
2. Select an execution plan that is based on a data-driven test.
3. In the menu, click Tracking > Activities.
4. Click the Run ID of the relevant execution plan.
5. In the Assigned Tests table, click the Run ID of a data-driven test.
Note: If you are running a multiple data-driven test, you will see one test for each data row in your
data source.
The results page for that particular test opens.
Silk Central 15.5
| 211
6. Click the Data Driven tab. Here you can view all instances of the test that were executed.
Note: The test’s data-driven properties are listed on the Details page in the Data-driven
Properties table.
7. Click an instance name to view test run details for that specific instance.
Note: If you are working with multiple data-driven test instances, a separate instance will be
created for each data row in your data source.
8. Click the Parameters tab to view the data source values that were used during this specific test run.
Execution Runs Page
Execution Planning > Details View > <Execution Plan> > Runs
The Runs page shows statistics regarding all the runs of the selected execution plan.
For configuration suites, the page displays all runs of the included configurations.
For testing cycles, the page displays all runs of the included execution plans and folders.
The page is split into two separate sections, one listing the execution plan runs, and the second listing the
test runs for the execution plan run selected in the first section.
The grids are customizable: You can display or hide columns, adjust the width, and drag the columns
around to change their order. Click on the columns to sort, group or filter the content in the grids.
To open the Execution Plan Run Results dialog box, right-click on a run and choose View Details. To
compare multiple execution plan runs, use Ctrl+Click or Shift+Click to select the runs. Right-click on your
selection and select Compare Automated Test Results.
The execution plan runs section lists the runs of the selected execution plan. Use the menu bar on the
bottom of this section to define how many rows to display per page and to navigate through the pages. The
page shows the following columns for each run:
Column
Description
Actions
Actions that you can perform on the execution plan.
ID
212
| Silk Central 15.5
Delete Runs
Click to delete the results of this run.
When you delete the results for
selected runs, Silk Central removes
the runs from the Runs page. The
runs are grayed out until the
background process completes the
deletion. Alternatively, press
Delete to delete the test run
results. For tagged builds, you have
to verify that you want to remove the
results.
View Manual
Test Results
(only for
manual tests)
Click to analyze the results of a
single manual test run on the
Manual Test Results page.
View
automated test
results (only
for automated
tests)
Click to analyze the results of a
single automated test run on the
Test Results page.
The identifier of the execution plan.
Column
Description
Execution Plan
The name of the execution plan that was executed. This
column is only displayed for configuration suites.
Status
Status summary of the run. A bar lists the amount of
passed, failed, and not executed tests. The run status of
each assigned test is shown in the second section of the
page.
Run ID
Identifier of the execution plan run. Click to access the
results of the run.
Keywords
Keywords assigned to the execution plan.
Executed By
Name of the execution server on which the run was
executed. For manual tests the name of the person who
executed the run is listed.
Product
The application under test.
Version
The version is either set by the user for this execution
plan, or is read from the build information file at execution
time. This information can be set in Administration >
Products, Versions, and Builds > Products.
Build
The build is either set by the user for this execution plan,
or is read from the build information file at execution time.
This information can be set in Administration >
Products, Versions, and Builds > Products . If the
build is tagged, it is marked bold and with .
Start Time
Time the run started.
Duration
Time consumed to execute all included tests. Includes
the duration of the setup and cleanup test and the time
consumed to fetch automation files and code coverage,
launch execution tools, and other tasks. For manual
executions this is the time between starting and finishing
the execution.
Errors
Number of errors that occurred in the run.
Warnings
Number of warnings that occurred in the run.
Start Type
Shows how the test run was started. Manually, through a
Web Service, or from a schedule.
Starter Name
Name of the schedule, tester, or Web Service user.
Start Scope
The scope specified in the Run dialog box.
Execution Plan Parent
The name of the execution plan parent.
Run Comment
You can use this column to add information to the run. To
edit the comment, right-click on the run and select Edit
Run Comment.
The Test Runs section lists the test runs for the selected execution plan run. Use the menu bar on the
bottom of this section to define how many rows to display per page and to navigate through the pages. The
page shows the following columns for each run:
Silk Central 15.5
| 213
214
Column
Description
Actions
Actions that you can perform on the test run.
View or
download
results
If the test, to which the run belongs,
is of a test type that generates result
files, click on the icons to view or
download the result files.
New Issue
Click to open the New Issue dialog
box and create a new issue for the
test.
Assign
Existing Issue
Assign an issue from an externallyconfigured issue-tracking system to
the test.
View Manual
Test Results
Click to view the Current Run page
in read-only mode.
Status
Status summary of the run. For a single test a single
status is shown. A bar lists the amount of passed, failed,
and not executed tests for a test package or suite node.
Status Reason
The reason why a specific test run has the status
Passed, Failed or Not Executed.
Run ID
Identifier of the test run. Click to open the Test Run
Results dialog box.
ID
Identifier of the test. This column is hidden by default.
Test
Name of the test. Click to access the test in Tests >
Details View. The icon corresponds to the test type.
Version
The version the run was executed against.
Start Time
Date and time the run started.
Duration
Duration of the test run.
Executed By
Name of the execution server on which the run was
executed. For manual tests the name of the person who
executed the run is listed.
Issues Found
Displays the amount of issues that are assigned to the
test run. When no issues are assigned to the test run, the
column is empty. Click on the link to access the issue in
the Issues page of Tests > Details View.
Errors
Number of errors that occurred in the run.
Warnings
Number of warnings that occurred in the run.
Build
The build the run was executed against.
Run Comment
For Silk Performer test runs, Silk Performer uses this
column to add information to the test run when uploading
results. For all other test types, you can use this column
to add information to the run. To edit the comment, rightclick on the run and select Edit Run Comment.
| Silk Central 15.5
Current Run Page
Execution Planning > Details View > <Execution Plan> > Current Run
Note: The Current Run page displays the active manual test run, until the test run is finished. For
manual tests that are assigned to a testing cycle, this page is renamed to Run page. In such a case,
the Run page continues to display the run, after the run is finished.
To access the Current Run page of an execution plan, select the execution plan in the Execution Plans
tree and click the Current Run tab.
The Current Run page shows information about the active manual test run. The page features two grid
views, Assigned Tests and Test Steps. Assigned Tests shows information about the active manual test
run, and Test Steps shows information for each of the steps in the manual test. You can filter the test runs
in the Assigned Tests view by selected columns. When multiple runs of a manual test are in progress, the
one first started is shown. The Test Details and Step Details views show additional information.
The grids are customizable: You can display or hide columns, adjust the width, and drag the columns
around to change their order.
Click Reload to refresh the Current Run page. Click Close to go back to the page you came from.
Execution Plan Run Details
This area displays detailed information about the run like the ID, the name, the version and build, and so
on. The area is collapsed by default. Click the arrow on the top-right corner to expand it.
Assigned Tests
This area provides the following information for the manual test run:
Columns
Description
Actions
Actions that can be performed during the run. Some of
these actions are not available for data-driven tests. The
following actions can be performed:
New Issue
Create a new issue for the test.
Assign Existing
Issue
Assign an issue from an externallyconfigured issue-tracking system
to the test.
Continue
Manual Test
Click to open the Manual Testing
window.
#
The order of the test in the execution plan run.
ID
The identifier of the test. This column is hidden by default.
Test
The name of the test. Click on the name to view the test,
or to perform an action on the test.
Status
The current status of the test.
Status Reason
The reason why a specific test run has the status
Passed, Failed or Not Executed.
Blocked
Shows if the test is blocked/unblocked.
Executed By
The user that last worked on this test execution. For
example entering step results, adding attachments, and
so on.
Silk Central 15.5
| 215
Columns
Description
Used Time [hh:mm]
The actual execution time. Click the field to note how long
it actually took to execute the test. Type in the time in the
hh:mm format. If you type in just a number, it will be
considered to be hours. When the run or testing cycle is
finished, the entered time will be displayed in the
Duration column.
Version
The version the run was executed against.
Build
The build the run was executed against.
Test Steps
This area provides the following information for each test step:
Columns
Description
Actions
Actions that can be performed during the run.
New Issue
Click to display the New Issue dialog
box allowing you to associate an issue
with the current step.
Assign
Existing
Issue
Click to open the Assign Existing
Issue dialog box which allows you to
associate an existing issue with the
current step.
#
Order of the step in the test.
Step Name
Name of the step. Click to access the step in Tests >
Details View > Steps.
Status
Execution status of the step.
Reason
The reason why a specific test step has the status
Passed, Failed or Not Executed.
Result
Result of the step.
Tip: You can hide the Test Steps view by clicking on the arrows in the top-right corner.
Test Details
This area displays the following information for the selected manual test: The Test Name, the Planned
Time, the Description, and the assigned Issues and Attachments.
Click the links to open the issues or download the attachments.
Step Details
This area displays the following information for the selected step: The Step Name, the Action
Description, the Expected Result, the Result as well as the Result Files and the Issues that were
attached to the selected test.
Click the links to open the issues or download the result files.
Tip: You can hide the Step Details view by clicking on the arrows in the top-right corner.
216
| Silk Central 15.5
If other execution plan runs are started while the Current Run page is open, a note displays, stating that
newer runs are available. You can see information on those runs in the Activities page.
For automated tests, the Current Run page shows the progress of the execution.
Working with Silk Performer Projects
Silk Performer is fully integrated with the test and execution functionality of Silk Central. Silk Performer
projects can be integrated into Silk Central tests and directly executed through Silk Central. This allows for
powerful test-result analysis and reporting. It also enables unattended testing, which means tests are run
automatically by Silk Central based on pre-configured schedules.
Refer to the Silk Performer Help for details on configuring the integration of Silk Performer with Silk
Central.
Silk Performer project files can be directly opened in Silk Performer from Silk Central, where scripts and
settings can be edited. Edited Silk Performer projects can subsequently be checked back into Silk Central
to make them available for future test executions.
Silk Central provides information on execution plan run properties during Silk Performer test executions.
Use the AttributeGet methods to access execution plan run properties in the Silk Performer script. You
can access the following properties in the script:
•
•
•
•
•
•
•
•
•
#sctm_execdef_name
#sctm_execdef_id
#sctm_product
#sctm_version
#sctm_build
#sctm_keywords
#sctm_test_results_dir
#sctm_test_name
#sctm_test_id
Note: The term Project is used differently in Silk Performer than it is in Silk Central. A Silk Performer
project, when uploaded to Silk Central, becomes the core element of a Silk Central test. Silk Central
projects are high-level entities that may include multiple Silk Performer projects, tests, execution
plans, and requirements.
Downloading Silk Performer Projects
Whereas opening a Silk Performer project may involve checking out a Silk Performer project from a
source-control tool, editing the project in Silk Performer, and checking the project back into Silk Central,
downloading a project involves downloading a copy of a project and working with it independently of Silk
Central. Changes you make to downloaded projects are not automatically migrated back to Silk Central.
To download a Silk Performer project:
1.
2.
3.
4.
5.
In the menu, click Tests > Details View .
In the Tests tree, select a Silk Performer test.
Click the Properties tab.
Scroll down to the Silk Performer Test Properties section.
Click . A file download dialog box displays, asking you to confirm that you wish to download the
specified Silk Performer project to your local system.
6. Click Save to open the file in Silk Performer. If not already open in the background, Silk Performer is
invoked.
7. The Select Target Directory dialog box displays, loaded with the default directory path to which the
specified Silk Performer project will be saved. If you approve of the specified pathname, click OK,
otherwise click Browse to specify an alternate path.
Silk Central 15.5
| 217
Note: Even if you have configured source-control integration, you will not be prompted to check
out the Silk Performer project from your source-control system because you are working with this
file independently of Silk Central.
Note: Silk Performer projects utilized by Silk Central can also be downloaded directly from the Silk
Performer user interface. For additional information, refer to the Silk Performer documentation.
Opening Silk Performer Projects
To open a Silk Performer project from Silk Central:
1. In the menu, click Tests > Details View .
2. In the Tests tree, select a Silk Performer test.
3. Click the Properties tab.
4. Scroll down to the Silk Performer Test Properties section.
5. Click . A file download dialog box displays, asking you to confirm that you wish to open the specified
Silk Performer command file (.spwbcmd) in Silk Performer.
6. Click Open to open the file in Silk Performer. If not already open in the background, Silk Performer is
invoked. The Select Target Directory dialog box opens, loaded with the default directory path to which
the specified Silk Performer project will be saved.
7. If you approve of the specifed pathname, click OK, otherwise click Browse to specify an alternate path.
8. If you have configured source-control integration for Silk Central, for example StarTeam, you are
presented with a login screen for your source-control client. Enter valid user connection settings and
click OK to continue.
Note: Silk Performer projects utilized by Silk Central can also be opened directly from Silk
Performer. For additional information, refer to the Silk Performer documentation.
Executing Attended Silk Performer Tests
Attended tests are Silk Performer tests that are executed manually in Silk Performer and are not executed
automatically based on a pre-defined schedule in Silk Central.
Note: To use Silk Central's data-driven test functionality with Silk Performer scripts, data sources with
column names matching the corresponding Silk Performer project attributes must be used in
conjunction with AttributeGet methods (password attributes cannot be passed and will always use
the values that are specified in the script).
To execute an attended test run in Silk Performer:
1. In the menu, click Tests > Details View .
2. In the Tests tree, select a Silk Performer test.
3. Click the Properties tab.
4. Scroll down to the Silk Performer Test Properties section.
5. Click . A file download dialog box displays, asking you to confirm that you wish to run the specified
Silk Performer command file (.spwbcmd).
6. Click Open to open the project in Silk Performer. If not already open in the background, Silk Performer
is invoked. The Select Target Directory dialog box displays, loaded with the default directory path to
which the specified Silk Performer project will be saved.
7. If you approve of the specified pathname, click OK, otherwise click Browse to specify an alternate path.
The Silk Performer Workload Configuration dialog box opens with all of the workload settings that
are associated with the Silk Performer project.
8. Edit the workload settings as required and click Run to begin the test and monitor the test results with
Silk Performer.
218
| Silk Central 15.5
Note: Clicking Run without editing any workload settings executes the Silk Performer test in
exactly the same way as if the test had been executed directly from Silk Central as an unattended
test.
Editing Silk Performer Test Properties
Note: To use the data-driven test functionality of Silk Central with Silk Performer scripts, you have to
use data sources with column names that match the corresponding Silk Performer project attributes in
conjunction with AttributeGet methods.
To edit Silk Performer test properties:
1.
2.
3.
4.
5.
6.
In the menu, click Tests > Details View .
In the Tests tree, select a Silk Performer test.
Click the Properties tab.
Scroll down to the Silk Performer Test Properties section.
Click Edit Silk Performer Test Properties.
Proceed with the configuration of your Silk Performer test.
Analyzing Silk Performer Test Results
Performance Explorer enables in-depth analysis of Silk Performer test results. The Analyze Results option
downloads only selected results, in contrast to “Downloading result packages”. To assist you in analyzing
the results of your optimization efforts, Performance Explorer even allows you to compare statistics from
multiple test runs side-by-side in cross load-test reports.
The results of tests that are run using Silk Central can be automatically loaded into Performance Explorer
through commands on the Runs page in the Tests area.
For full details on using Performance Explorer and integrating Performance Manager with Silk Central,
refer to the Performance Explorer documentation.
To open Silk Performer test results in Performance Explorer:
1.
2.
3.
4.
In the menu, click Tests > Details View .
Select the test you are interested in viewing.
Click the Runs tab.
Click in the Actions column of the test execution for which you want to download results. A File
Download dialog box displays, showing you the name of the Performance Explorer command
file, .sppecmd, that you are about to download.
5. Click Open to open the results in Performance Explorer. Alternatively, you can click Save to save the
results locally.
6. If not already open in the background, Performance Explorer now opens, connected directly to your Silk
Central installation, and fetches the results of the selected execution run.
Note: To prepare for a cross load-test report that compares the results of multiple executions in a
single report, you may download the results of additional executions from the Runs page.
Additional execution results are displayed in the existing instance of Performance Explorer on the
Performance Explorer Silk Central tab. For additional details on cross load-test reports, refer to the
Performance Explorer documentation.
Downloading Silk Performer Test Result Packages
Downloading result packages is the ideal option if you want to analyze the complete results set of a test
run, or if you want to download the complete results set for offline analysis. Because result packages often
include large TrueLog On Error files, result packages can be compressed and downloaded to your local
hard drive as .lrz files. Downloading results locally can also be useful when you are working from a slow
Internet connection.
Silk Central 15.5
| 219
To download Silk Performer test results:
1.
2.
3.
4.
In the menu, click Tests > Details View .
In the Tests tree, select a Silk Performer test.
Click the Runs tab.
Click in the Actions column of the test execution for which you want to download results. A File
Download dialog box displays, showing you the name of the compressed results package file, .ltz
that you are about to download.
5. Click Open to open the results in Performance Explorer. Alternatively, you can click Save to save the
results locally.
6. If not already open in the background, Performance Explorer now opens. You are presented with an
Import Project dialog box that indicates the target directory to which the results will be saved. Click OK
to accept the default path, or click Browse to select an alternate path. The downloaded results are then
displayed in Performance Explorer.
Note: If you accept the default projects directory where result packages are typically stored, which
we generally recommend, then the results will be stored with all otherSilk Performer results and
will be readily accessible through the Performance Explorer Add Loadtest Results command.
Uploading Silk Performer Test Results
Once you have completed running an attended test in Silk Performer, you can upload the test results to
Silk Central and associate the results with a test.
To upload results from an attended Silk Performer test:
1. Run an attended Silk Performer test.
For additional information, see Executing Attended Silk Performer Tests.
2. When the test is complete, select Upload Results to Silk Central from the Results menu.
The Login screen of the Upload Results to Silk Central wizard displays.
3. Enter your Password and click Next.
Note: Because this is an attended test, the wizard already knows the appropriate hostname and
username of the test to which these results are to be uploaded.
4. If not already selected by default in the project list, select the Silk Central project to which you want to
upload the Silk Performer results.
5. If not already selected by default in the tree list, select the test to which you want to upload the results.
Click Next.
Note: You can right-click in the tree and use the commands on the context menu to create a new
test, child test, test folder, or child test folder to which the results can be saved.
6. On the subsequent screen you can specify Version and Build numbers for the assigned Product to
which the uploaded results belong. Also specify the Silk Performer test result status, for example
Passed, Failed.
Note: If any errors occurred during the test run, the test result status is set to Failed by default.
7. Click Finish to upload the results. The uploaded results are displayed in Tests > Details View > <Silk
Performer Test> > Runs.
Silk Test Classic Tests
This section describes how to execute tests in Silk Test Classic.
Automated Execution of Silk Test Classic Tests
All tests within an execution plan use the same Silk Test Classic instance for tests. The Silk Test Classic
GUI is opened once with the first Silk Test Classic test execution and is closed automatically after the last
220
| Silk Central 15.5
Silk Test Classic test execution. Each Silk Test Classic test execution produces its own results. If for any
reason the Silk Test Classic GUI closes during a test, it will reopen automatically with the next Silk Test
Classic test execution.
Automated Execution of Data-Driven Silk Test Classic Testcases
If the data driven check box is checked in Silk Test Classic test properties, each Silk Test Classic test will
be repeated once for each data row in the external datasource. By default, plan-based execution mode is
used for data driven tests. This means that the results of all data rows will be listed under a single node in
the .res result file. If execution mode is switched to script-based data driven in
SccExecServerBootConf.xml, a result node will be created in the .res result file for each data row.
Specifying Agent Under Test (AUT)
When a Silk Test Classic agent cannot run on the same machine as the Silk Central execution server, for
example when tests are run on platforms other than Windows, the hostname and port may be specified by
the Silk Test Classic AUT Hostname setting in the Deployment page of an execution plan. If the setting
has not been defined, Silk Test Classic default values are used, for example from partner.ini. The
syntax for AUT is hostname:port. The agent must be started manually prior to test execution and
configured to listen at the specified port. By default, the TCP/IP protocol is used for communication
between Silk Test Classic instances and Silk Test Classic agents. Ensure that both programs have been
configured to use the same protocol.
Note: Be careful when you have multiple execution servers assigned to an execution plan as Silk
Test Classic agents can only work with one Silk Test Classic instance at a time.
Silk Test Classic Time-out Settings
If you have Silk Test Classic test cases that require more than 1 hour to complete, you must adjust the
time-out settings in Silk Central. Otherwise, Silk Central assumes that something has gone wrong in the
execution and terminates Silk Test Classic. For details about setting the Silk Test Classic time-out, see the
Administration topics in this Help.
Silk Test Classic Logs
The RMS log file in Silk Test Classic is used to log data for each test case as test runs progress. Three
types of data records are written to this file: status, memory and user records. By monitoring this file, the
RMS Remote Agent has a means of determining the progress of each test run.
You can write your own comments into the user records of the log file by executing the PrintToRMSLog
4Test function.
Examples:
PrintToRMSLog ("Error", "An intended error")
PrintToRMSLog ("Info", "testcase sleep1 started")
PrintToRMSLog ("Warning", "TestCase 1 started a second time")
Definition of user function in rms.inc:
PrintToRMSLog (STRING sMessageType, STRING sUserMessage)
Writes to the log file in the following format:
U|{sTestCaseName}|{sScriptName}|{sArgStr}|{sUserMessage}|{sMessageType}
Tracking
The Tracking area provides project-level information including Activities, Cross-Project Activities,
Project Overview Report, and Quality Goals.
Silk Central 15.5
| 221
Activities
This section explains how to manage upcoming, current, and recently-executed test runs.
Deleting Last Executions Runs
To delete a run from the Last Executions list:
1. In the menu, click Tracking > Activities.
2. In the Last Executions area of the Activities page, right-click the test run you want to delete and
select Delete Run Results.
3. Confirm the deletion by clicking OK.
Displaying or Hiding Columns on the Activities Page
To display or hide columns on the Activities page:
1. In the menu, click Tracking > Activities.
2. Right-click a column header.
3. Expand the Columns submenus to view all the columns that are available in the project.
4. Select the check boxes of all the columns that you want to have displayed. Your column-display
preferences will be saved and displayed each time you open the active project.
Entering Issues From the Activities Page
New issues can be entered directly on the Activities page.
To enter an issue from the Activities page:
1. In the menu, click Tracking > Activities.
2. In the Last Executions area, click the Run ID of the relevant execution plan to view test-execution
results.
Each test associated with the execution run is listed in the Assigned Tests table at the lower part of the
view.
3. In the Actions column of the test to which you want to associate the issue, click New Issue.
4. Proceed with defining the issue.
Filtering Test Runs on the Activities Page
You can filter the views on the Activities page based on column values. You can specify filter strings to be
applied to:
•
•
•
Text-based data fields.
Calendar filters (using Before, After or On operators) for date-based fields.
Numerical operators (>, <, and =) for number-based fields.
Filtering Text-Based Values on the Activities Page
1. In the menu, click Tracking > Activities.
2. Right-click the header of the text-based column that the filter is to be based on.
3. Expand the Filter submenu on the context menu to display the Filter text box.
4. Enter a text string into the text box.
5. Press Enter. All entries that match the filter criteria are dynamically displayed in the filtered list.
222
| Silk Central 15.5
Filtering Date-Based Values on the Activities Page
1. In the menu, click Tracking > Activities.
2. Right-click the header of the date-based column that the filter is to be based on.
3. Hold your cursor over Filter on the context menu to display the Before, After, or On submenu.
4. Choose from the following:
a) Hold your cursor over After to define a date before which (and including) all entries should be
excluded.
b) Hold your cursor over Before to define a date after which (and including) all entries should be
excluded.
c) Hold your cursor over On to exclude all entries except those that have the specified date.
The calendar tool displays.
5. Select a date using the calendar tool (or click Today to specify today's date).
Tip: You must explicitly click a date on the calendar tool or press Enter to activate date-based
filtering changes.
All entries that match the filter criteria are dynamically displayed in the filtered list.
Filtering Number-Based Values on the Activities Page
1. In the menu, click Tracking > Activities.
2. Right-click the header of the number-based column that the filter is to be based on.
3. Expand the Filter submenu on the context menu to display the > (greater than), < (less than), and =
(equals) operators.
4. Choose from the following:
a) Enter a number in the > text box to define a number less than which (and including) all entries
should be excluded.
b) Enter a number in the < text box to define a number greater than which (and including) all entries
should be excluded.
c) Enter a number in the = text box to exclude all entries except those that have the specified number.
Note: Number values are rounded to two decimal places.
5. Press Enter. All entries that match the filter criteria are dynamically displayed in the filtered list.
Filtering Boolean Values on the Activities Page
1. In the menu, click Tracking > Activities.
2. Right-click the header of the boolean-based column that the filter is to be based on.
3. Expand the Filter submenu on the context menu to display the available values.
4. Click one of the Yes or No option buttons. All entries that match the filter criteria are dynamically
displayed in the filtered list.
Filtering Values Using a Predefined List on the Activities page
1. In the menu, click Tracking > Activities.
2. Right-click the header of the column that has a predefined filter value that the filter is to be based on.
3. Expand the Filter submenu on the context menu to display the Filter text box.
4. Check the check boxes of the filter values that you want to use. All entries that have one of the selected
criteria will be displayed.
Silk Central 15.5
| 223
Grouping Test Runs on the Activities Page
Beyond simply sorting by column, you can chunk entries into groups to facilitate viewing. Groups are based
on commonly-shared values within the column that grouping is based on.
Applying Groups to Test Runs on the Activities Page
To group entries on the Activities page:
1. In the menu, click Tracking > Activities.
2. Right-click the header of the column that the sort is to be based on.
3. Select Group by This Field.
Entries are then organized into groups based on commonly-shared values within the column you have
selected.
Removing Grouping from Test Runs on the Activities Page
To remove grouping:
1. In the menu, click Tracking > Activities.
2. Right-click any column.
3. Uncheck the Show in Groups check box.
Removing Activities Filters
Note: Hiding a column removes all filters that have been applied to the column.
To remove one or more filters:
1. In the menu, click Tracking > Activities.
2. Right-click the header of the column that has the filter you want to remove.
Note: You can identify filtered columns by their titles, which are displayed in bold, italic text.
3. Do one of the following:
a) To remove a specific filter: Uncheck the Filter check box.
b) To remove all filters: Select Reset Filters.
Reordering Columns on the Activities Page
To reorder columns on the Activities page:
1. In the menu, click Tracking > Activities.
2. Select the column header of the column you want to move.
3. Drag the column to the desired position and release it.
Your column-order preferences will be saved and displayed each time you open the active project.
Resizing Columns on the Activities Page
To adjust the width of columns on the Activities page:
1. In the menu, click Tracking > Activities.
2. Select the vertical column-header divider of the column you want to adjust.
3. Drag the column boundary to the desired position and release it.
Your column-width preferences will be saved and displayed each time you open the active project.
224
| Silk Central 15.5
Restoring Default Activities Page View Settings
Restoring default view settings resets all user-defined settings, which are column order, column width,
shown/hidden columns, applied filters, sorting, and grouping, for the current project.
To restore default view settings:
1. In the menu, click Tracking > Activities.
2. Right-click any column header.
3. Select Reset View.
Sorting Test Runs on the Activities Page
To sort test runs on the Activities page:
1. In the menu, click Tracking > Activities.
2. Right-click the header of the column you want the test runs to be sorted by.
3. Select Sort Ascending to have the test runs sorted in ascending order or select Sort Descending to
have the test runs sorted in descending order. Your sort preferences will be saved and displayed each
time you open the active project.
Activities Page
Tracking > Activities
The Activities page offers a centralized location from which you can manage upcoming, current, and
recently executed test runs for a project. The grid views on the Activities page offer filtering, sorting, and
grouping options that are configurable for each user separately. You can display or hide columns, adjust
the width of columns, and move columns around using click and drag.
The Activities page is split into three sections: Next Executions, Current Executions, and Last
Executions. The grid views can be resized by dragging the separators between the views.
Context-sensitive menu commands are available for each test run. These commands enable you to link
directly to listed execution plans, continue manual tests, manage test-run results, and more.
The Activities page makes it easier to identify match points between execution plans and to find specific
execution plan information. Standard Windows keyboard shortcuts can be used to select test run entries,
making it easy to select and manipulate specific sets of execution plans and test results. Sorting, grouping,
and filtering functions are available through context-menu commands to help you better organize and
group test runs. All of your view-customization preferences are saved along with your project and will be
available to you each time you visit the Activities page.
Note: Data on the Activities page is not automatically refreshed. Click Reload near the paging
buttons at the lower part of each view to refresh the page's contents.
Note: You can use Ctrl + Click to select multiple queued executions and abort them all with one
click.
Next Executions
The Next Executions view lists the execution plans that are scheduled to run in the future. To enhance
performance when you have numerous execution plans, only the upcoming 50 execution plans are
displayed. You can access additional future execution plans by using the available filtering features. To edit
an execution plan, right-click the execution plan and choose Go to Execution Plan or click on the arrow to
the left of the name of the execution plan. This takes you to the Executions area where you can view and
edit the details of the execution plan.
By default, all execution plans are sorted by Start Time. Columns in the Next Executions view can not be
sorted or grouped.
Silk Central 15.5
| 225
Next Executions view can be collapsed and expanded by clicking the double-arrow button on the righthand side of the view's title bar.
For each execution plan, the Next Executions view displays the following columns:
Column
Description
ID
Identifier of the scheduled execution plan. This column is
hidden by default.
Execution Plan/Folder
Name of the scheduled execution plan or folder.
Keywords
Keywords that are assigned to the scheduled execution
plan.
Manual Testers
For manual tests, this column contains the name of the
manual tester that is assigned to the test. This column is
blank when no manual testers are assigned to the test.
Priority
The priority that has been assigned to the execution plan.
Start Time
Scheduled start time of the test run.
Execution Plan Parent
The configuration suite, folder, or testing cycle in the
context of which the execution plan is executed. Click to
access the suite or folder in the Execution Plans tree. If
the execution plan is not included in a configuration suite
or folder, nothing is displayed.
Current Executions
The Current Executions view lists the execution plans that are currently running (both automated and
manual test runs).
To abort an execution plan that is currently in progress, click Abort in the Actions column of the execution
plan. To view or edit an execution plan, right-click the execution plan and select Go to Execution Plan or
click on the arrow to the left of the name of the execution plan. To view the execution's progress, right-click
the automated execution plan and select View Details or click the execution plan's Run ID/Task ID link.
As long as a manual test remains open, the corresponding execution plan remains in the list of Current
Executions with a status of Pending. Click Continue Manual Test in the Actions column to open the
Manual Testing window.
To view the results of a manual test, right-click the manual execution plan and select View Details, or click
the execution plan's Run ID/Task ID link, to open the Results for Execution Plan page. From there, click
the name of the manual test in the Assigned Tests section to open the Results dialog box. Detailed
results of the manual test are displayed there. Back on the Results for Execution Plan page, click
Manual Test Results to go to Manual Test view , where information about the status of the assigned
manual test is available.
Page views of current executions are broken into views of 20 execution plans each. You can advance
through pages using First, Last, Next, and Previous located in the lower part of the Current Executions
view. Or you can type a page number into the Page text box and press Enter.
For each execution plan, the Current Executions view displays the following columns:
Column
Description
Actions
You can perform the following actions on the execution
plan:
Abort
226
| Silk Central 15.5
Click to cancel the current execution.
Alternatively, press Delete. When you
Column
Description
abort executions, these executions are
grayed out until the background process
completes the deletion.
Note: If the execution is part of
a testing cycle the abort action
is disabled. The
icon and
the entry in the context menu
are grayed out and such runs
are ignored when you abort
multiple runs.
Continue
Manual
Test
Click to open the Manual Testing
window.
View
Manual
Test
Results
Click to view the Current Run page in
read-only mode.
ID
Identifier of the execution plan. This column is hidden by
default.
Execution Plan
Name of the execution plan.
Run ID/Task ID
Manual tests receive a Run ID when they are executed.
When the manual test is completed, the Run ID carries
over to the Last Executions view. Automated tests
receive a Task ID when they are executed. The Task ID
is not carried over to the Last Executions view.
Completed execution plans receive a Run ID in the Last
Executions view.
Status
Status of the active execution plan or manual test. For
automated tests, the status is indicated with a text-based
value. For manual tests, the status is indicated with a
colored histogram. Automated-test statuses are
described textually and can be filtered. Manual tests can
be filtered by checking relevant properties on the Filter
submenu.
Keywords
Keywords that are assigned to the execution plan.
Executed By
•
•
For manual tests, this column displays the users who
are assigned to perform the manual test. This column
is blank when no manual testers are assigned to the
test.
For automated executions, this column displays the
name of the execution server.
Priority
For automated execution plans, when more than one
execution plan is queued but only one execution server is
available, the Priority determines which execution plan is
executed first.
Start Time
Time when the execution plan run started.
Silk Central 15.5
| 227
Column
Description
Time Left
Amount of time remaining until the test is complete. For
manual tests that do not have an estimated time, this
column has a value of unknown.
Start Type
Shows how the test run was started.
•
•
•
•
Manually
Through a Web Service
From a schedule
From a dependency
Starter Name
Name of the schedule, tester, or Web Service user.
Start Scope
The scope defined in the Run dialog box.
Execution Plan Parent
The configuration suite, folder, or testing cycle in the
context of which the execution plan is executed. Click to
access the suite or folder in the Execution Plans tree. If
the execution plan is not included in a configuration suite
or folder, nothing is displayed.
Last Executions
The Last Executions view lists all past execution plan runs. This list can be filtered and sorted, for
example by start time.
To view or edit an execution plan, right-click the execution plan run and choose Go to Execution Plan, or
click on the arrow to the left of the name of the execution plan. To display the Results for Execution Plan
page of an execution plan run, right-click the run and select View Details, or click the Run ID link of the
execution plan. This page shows details for the selected execution plan run and includes any files and
messages that were generated during the execution. To open the Results dialog box of a test, click on the
Run ID of the test in the Assigned Tests portion of the Results for Execution Plan page.
To compare execution plan runs, use Ctrl + Click to select multiple runs. Right click on your selection
and click Compare Automated Test Results for automated tests, or Reports > Run Comparison ... for
manual tests.
Right-click on an execution plan and click Run Execution Plan to run the execution plan. Silk Central
considers all tests that are currently assigned to the execution plan, not the originally assigned tests of the
selected execution plan run.
To delete an execution plan run, right-click a run entry and choose Delete Results or click Delete in the
Actions column of the run.
Test-result page views are broken into views of 20 test results each. You can advance through pages
using First, Last, Next, and Previous at the bottom of the Last Executions view. Or you can enter a page
number into the Page text box and press Enter.
The Last Executions view can be collapsed/expanded by clicking the double-arrow button on the righthand side of the view's title bar.
For each execution plan, the Last Executions view displays the following columns:
Column
Description
Actions
You can perform the following actions on the execution plan:
Delete
228
| Silk Central 15.5
Click to delete the execution plan run results.
When you delete executions, these executions
Column
Description
are grayed out until the background process
completes the deletion. Alternatively, press
Delete to delete the execution plan run. For
tagged builds, you have to verify that you want to
remove the results.
View
Manual
Test
Results
Click to view the Current Run page in read-only
mode.
ID
The identifier of the executed execution plan. Unassigned tests
have an ID value of N/A. This column is hidden by default.
Execution Plan
Name of the executed execution plan. Click the button beside the
name to view the execution plan in the Execution Planning unit.
Run ID
ID assigned to the test run. Click the link to view details of the test
run.
Status
Displays the number of passed, failed and not executed tests in a
bar graph. Filtering, sorting, and grouping are not available for the
column.
Keywords
Keywords that were assigned to the execution plan at execution
time.
Executed By
•
•
For manual tests, this column displays the users who are
assigned to perform the manual test. This column is blank
when no manual testers are assigned to the test.
For automated executions, this column displays the name of
the execution server.
Start Time
Time when the execution plan run started.
Duration
Time consumed to execute all included tests. Includes the
duration of the setup and cleanup test and the time consumed to
fetch automation files and code coverage, launch execution tools,
and other tasks. For manual executions this is the time between
starting and finishing the execution.
Product
The product under test. This column is hidden by default.
Version
The version that either is set by the user for this execution plan,
or is read from the build information file at execution time. This
column is hidden by default.
Build
The build that either is set by the user for this execution plan, or is
read from the build information file at execution time. If the build is
tagged, it is marked bold and with .
Start Type
Shows how the test run was started. Manually, through a Web
Service, or from a schedule.
Starter Name
Name of the schedule, tester, or Web Service user.
Start Scope
The scope specified in the Run dialog box.
Execution Plan Parent
The configuration suite, folder, or testing cycle in the context of
which the execution plan is executed. Click to access the suite or
Silk Central 15.5
| 229
Column
Description
folder in the Execution Plans tree. If the execution plan is not
included in a configuration suite or folder, nothing is displayed.
Cross-Project Activities Page
Tracking > Cross-Project Activities
The Cross-Project Activities page enables a user with SuperUser privileges to see all execution related
activities across projects. It provides all the options the Activities page offers, and additional options
across projects. This allows some conclusion about the execution queue. The SuperUser can remove
executions from the queue to resolve bottlenecks.
The Cross-Project Activities page is visible to the SuperUser only. The page is split into the same three
sections as the Activities page: Next Executions, Current Executions, and Last Executions. All three
sections include an additional column with the Project ID.
Item
Description
Project ID
The ID of the project to which the execution plan belongs
to.
Project Overview Report
Silk Central > Tracking > Project Overview Report
The Project Overview Report contains a high-level overview of the status of the selected project.
Quality Goals
Quality goals (exit criteria) are a definable set of testing metrics that the project must meet in order for the
quality to be considered acceptable. Each Silk Central project can contain one or more quality goals. Silk
Central uses quality goals as a primary means to implement risk based testing, allowing you to plan, to
test, and to report on only the most important tests in a given testing cycle.
In Silk Central, a quality goal is comprised of the following two elements:
•
•
A requirement or test.
One of the following:
•
•
A custom attribute or property of type List with a corresponding percentage value.
One of the following default requirement properties: Priority, Reviewed, or Risk with a
corresponding percentage value.
Quality Goal Example
If a requirement has a property of MyCustomRisk with values of High, Medium, and Low, it should be
possible to define a quality goal of:
Requirement Goal - MyCustomRisk
High = 100%
Medium = 50%
Low = 10%
The 100% means that all of the tests that meet that criteria (linked to a requirement that has the High
attribute value) must execute and pass to meet that goal.
Permissions
Quality goals are permission based. See Quality Goals Permissions for details of permission.
230
| Silk Central 15.5
Quality Goals Page
Tracking > Quality Goals
The following controls are available on the Quality Goals tab allowing you to create, edit, or delete quality
goals for a project:
Quality Goals Grid
Column
Description
Goal Name
The name of the goal.
Select the drop-down list on the column name and then select Show in
Groups to show all goals in a list.
Name
Each value of the attribute or property List type is itemized in the Name
column.
Goal (%)
This text field must contain a numeric value from 0 to 100. The value
represents the percentage of tests required to meet the defined quality
goal.
Buttons
•
•
•
Manage Goals - Click to show the Manage Quality Goals dialog box.
Planning Report - Click to show the Quality Goals Planning Report.
Execution Report - Click to show the Quality Goals Execution Report.
Adding Quality Goals
Before creating a quality goal, you need create a test custom attribute or requirement custom property of
type List that you want to use for your quality goals. Or you can use the requirement fields of Priority,
Reviewed, or Risk.
For example, if you want a quality goal to track a requirement custom property with values of High,
Medium, and Low, first go to Projects:<Project Name> > Project Settings > Requirement Properties
and create a List type custom property that contains these values.
Note: You can only use a property or attribute as a quality goal once per project.
1. In the menu, click Projects > Project List.
2. Select a project.
3. Click Tracking > Quality Goals.
4. Click Manage Goals. The Manage Quality Goals dialog box opens.
5. In the New Goal Name field, enter the name for your goal.
6. In the Attributes/Custom Properties list, select the item that contains the values that you want to use
for your quality goal. The list contains the following types of items:
•
•
•
Requirement property of type List.
Default requirement properties of Priority, Reviewed, or Risk.
Test attribute of type List.
7. Click Add New Goal.
8. Click Close. The Manage Quality Goals dialog box closes and the new goal is added to the Quality
Goals grid.
Silk Central 15.5
| 231
9. For each value in the list, enter a numeric value from 0 to 100 in the Percentage of Tests Required to
Meet Goal.
Deleting Quality Goals
To delete a quality goal:
1.
2.
3.
4.
5.
In the menu, click Projects > Project List.
Select a project.
Click Tracking > Quality Goals.
Click Manage Goals. The Manage Quality Goals dialog box opens.
Click the Delete icon next to the quality goal that you want to delete.
Issues
Describes how to work with issues in Silk Central.
Creating New Issues
The Issues page enables you to easily create issues related to the selected test.
To create a new issue:
1.
2.
3.
4.
5.
In the menu, click Tests > Details View .
Select the test for which you want to create a new issue.
Click the Issues tab.
Click New Issue to open the New Issue dialog box.
Select the Profile of the issue-tracking system you are submitting the issue to.
Note: The profile you select here becomes the default selection for when you enter new issues in
the future. When adding a new issue to an issue tracking system, you will be prompted to provide
login credentials for the issue tracking system. The credentials that you provide will be
automatically preselected for you in the future.
6. Enter a brief Synopsis of the issue.
7. Enter a meaningful Description of the issue.
8. Provide information about the issue by using the UI controls on the right side of the dialog box.
Note: These UI controls vary, based on the selected Profile. For example: If you want to create an
issue that shall be processed with Bugzilla, you need to specify the product, the component, and
so on. If an issue shall be processed with JIRA, you need to specify other values, like the issue
type or the priority.
9. Click OK to create the issue.
Viewing Issue Statistics in Document View
To view issue statistics in Document View:
1. In the menu, click Issues > Document View.
2. In the Issues tree, select the project, issue-tracking system, or product for which you want to view
statistics.
Issues Document View
Issues > Document View
232
| Silk Central 15.5
The Document View displays issue statistics for the selected project in tabular format.
Column
Description
Date
Date and time when issue details were updated.
Open
Number of issues in the selected project, database, or
product that have a status of Open.
Fixed
Number of issues in the selected project, database, or
product that have a status of Fixed.
Verified
Number of issues in the selected project, database, or
product that have a status of Verified.
Closed
Number of issues in the selected project, database, or
product that have a status of Closed.
Deferred
Number of issues in the selected project, database, or
product that have a status of Deferred.
Viewing Issue Statistics in Details View
To view issue statistics in Details View:
1. In the menu, click Issues > Details View.
2. In the Issues tree, select the project, issue-tracking system, or product for which you want to view
statistics.
3. The calendar tool feature enables you to specify the time period over which you want to view issue
statistics. Click the time-frame dates link to expand the calendar.
4. Using the calendar’s From and To list boxes, specify start and end times for issue statistics.
5. Click Update to update the chart view based on the specified time range.
Issues Page
Issues > Details View > Issues
The Issues page lists the issues from all issue tracking systems that are configured for the selected
project. The page includes the following items:
Item
Description
Calendar Tool
Allows you to specify a time-frame for which issues
should be reported. Click the time-frame date link to
expand the calendar tool.
Update
Updates the Issues View based on calendar changes.
The button is displayed only when changes exist.
Assigning Existing Issues
The Issues page enables you to assign issues from issue tracking systems to a selected test.
To assign an existing issue to a test:
1. In the menu, click Tests > Details View .
2. Select the node of the test for which you want to assign an issue.
3. Click the Issues tab.
Silk Central 15.5
| 233
4. Click Assign Existing Issue to open the Assign Existing Issue dialog box.
5. Select the profile of the pre-configured issue-tracking system where the issue is tracked.
6. In the Issue ID field, type the unique alpha-numeric ID of an existing issue in the issue-tracking system.
7. Click OK.
Note: You can also assign an existing issue to a currently running execution plan in the Current Run
page, the Execution Runs page (in Execution Planning), and the Test Runs page (in Tests).
Updating Issue States
To synchronize issue states between Silk Central and an issue tracking system:
1. In the menu, click Tests > Details View .
2. Select the node of the test for which you are updating a corresponding issue.
3. Click the Issues tab.
4. Click Update Issue States to synchronize the state of the issues listed in Silk Central with the
corresponding issues in the issue tracking system.
Deleting Issues (Issue References)
To delete an issue reference:
1. In the menu, click Tests > Details View .
2. Select the test from which you want to delete an issue.
3. Click the Issues tab.
4. In the Actions column, click
.
5. Click Yes on the Delete Issue dialog box to confirm the deletion.
Important: This action removes just the issue reference in Silk Central. It does not delete the issue
itself in the issue tracking system.
Issue Manager
Welcome to Issue Manager!
Issue Manager is a comprehensive tool for automatically tracking issues. With Issue Manager you can
enter, process, and manage issues in a way that models the workflow of your organization.
Issue Manager assists you in managing software bugs, documentation issues, requests for enhancements,
and more. It is designed to meet the needs of a wide range of users, including application developers, QA
engineers, technical support, documentation professionals, managers, and IT personnel.
Issue Manager uses a technique called action-driven workflow . This workflow technology moves an issue
through its life cycle automatically, based on user actions and issue states that can be customized to the
workflow of your business. From the time an issue is reported until it is closed, Issue Manager handles
issue routing automatically whenever a user takes an action on that issue.
Your administrator sets up routing rules and workflow to automatically advance issues between inboxes
that are assigned to individual users or groups. Users with special security privileges can override
predefined issue routing.
Issue Manager allows you to perform the following tasks:
•
•
•
234
| Silk Central 15.5
Report issues through a Web interface.
Add, review, reassign, fix, verify, and close issues.
View detailed information about any issue.
•
•
•
•
•
View user accounts and inboxes.
Receive email whenever certain changes occur to an issue.
Retrieve issue information from the database by running queries.
Produce reports and charts.
Archive issues.
Getting Started with Issue Manager
As an end-user
Become familiar with the end user's tasks.
Create a sample database before you create and configure your organization's production database. For
additional information, see Silk Central Databases.
As an administrator
Before you can work with Issue Manager, you need to set up a database. For additional information, see
Silk CentralDatabases.
Exploring the Sample Database
As an administrator, explore the sample database to get familiar with the features of Issue Manager. To
explore the sample database:
1. Launch Issue Manager and log into the sample database as dhart, a Development user with
unrestricted permissions.
2. Enter an issue against an existing product.
3. Save the issue. Issue Manager fills in the Issue Details page's automatic fields and the History tab.
4. Take an action on the issue and complete the corresponding action dialog box. The Issue Details page
changes. Take other actions until you feel comfortable with the process.
5. View several user accounts.
a) Note which groups the users are assigned to.
b) Look at the user's security privileges.
c) Note the default Inboxes of the users.
6. Add a group.
a) Assign security privileges.
7. Add an Inbox for a new user.
a) Associate the Inbox with the new group.
8. Add an account for the new user.
a) Assign the new Inbox to the user.
b) Assign any remaining security privileges to this user account.
9. Add a new product, including its routing rules.
a) Add one or two releases for the product.
b) Associate each release with one or two platforms.
10.Log out of the system.
11.Log in as the new user.
12.To see how an issue is processed through the workflow, enter and save an issue against your new
product.
a) In the Assigned To field the issue has been routed to one of the Inboxes you have specified in your
routing rules. The bug is in the Dev-Ready state. Select the History tab and note the entries there.
Silk Central 15.5
| 235
b)
c)
d)
e)
Select the History tab and note the entries there.
Reassign the issue to another developer.
See how this action is reflected by the History tab.
Set the issue to Fixed to advance it to its next state. The State field changes to QA-Ready and the
Assigned To field changes to the Inbox specified in your routing rules. Presumably this is the QA
engineer inbox.
f) Set the issue to Verify, which means that a QA engineer has verified that the bug has been fixed.
The issue should move to the Closed state. Look at the History tab again. How has it changed?
13.Add two components for the new product.
14.Set up routing rules for the components, specifying different Inboxes than for the entire product.
15.Enter another issue against a specific product component. Repeat the sub-steps described in step 12 to
see how the routing changes.
Note: The states the issue passes through remain the same because the workflow is the same for
all issues.
16.Change a field label on the Issue Details page.
17.Change Product Code to Product.
18.Open the Issue Details page for an existing issue to view the change.
19.Add a new field to Custom Tab 1.
20.Open the Issue Details page for an existing issue and select the Custom tab to see the new field.
21.Generate a few of the predefined reports and charts that are available in the Reports unit.
What You Can Do With Issue Manager
As a complete solution for your issue tracking needs, Issue Manager allows you to:
•
•
•
•
•
•
•
•
•
•
•
Create new issues:
Import issues: The Silk Test Assistent enables you to forward the details of Silk Test test cases directly
to Issue Manager as the basis for new issues. Likewise, when you discover Silk Central execution
results that require attention, you can easily use the results as the basis for new issues.
Process issues: Issue Manager lets you review, reassign, fix, verify, and close issues (privilege vary
based on user type).
Associate files with Issue Manager issues: If you or a customer has files that are required for
reproducing an issue, you can upload those files to Issue Manager and attach them to the issue. In this
way, you can easily locate the files you need to confirm, fix, or verify a bug.
View a complete history of every issue in the system: Issue Manager records every action that users
take on an issue. The default issue history entry includes the action taken on the issue, the user who
took the action, and notes that explain the action.
Interact with workgroups: Your Issue Manager administrator can set up workgroups within your
organization for sharing privileges, permissions, inboxes, and assignments. In this way, you can interact
with users on an individual basis and also in groups that share similar job responsibilities.
Query the system for issue information that meets your criteria: You can use predefined queries,
construct queries by example, or create advanced queries with SQL.
Generate reports and graphs: Create predefined reports based on issue criteria you specify or create
advanced reports with SQL.
Define notifications: Define to be notified when issue statuses or assignments change.
Remotely interact with the issue database: Enter and query issues remotely via the web.
Assign tests to issues: With Borland
Using Issue Manager
The Issue Manager Help provides information and guidelines that will help you track issues with Issue
Manager to meet the needs of your software development environment.
236
| Silk Central 15.5
Overview
This section gives an overview of the Issue Manager UI. This contains the Issue Tracking page, the Issue
Details page, the Issue Details tabs, and the Issue Tracking toolbar.
Issue Tracking Page
In the menu, click Issues > Issue Tracking.
The Issue Tracking page shows the list of issues of your inbox. To view another Inbox, select one from
the list in the toolbar. Inboxes can be organized in groups. To show just inboxes of a certain Group, select
one from the list in the toolbar.
Click the buttons in the toolbar to perform the following actions:
•
•
•
•
•
Click
(My Inbox) to show the list of issues of your inbox.
Click
(Refresh Inbox) to refresh the data in the grid.
Click
(New Issue) to add a new issue.
Click
(Open Silk Test Classic Intelligent Assistant). For more information, see Silk Test
Intelligent Assistant.
Click
(Customize your Inbox View) to get to the Configuration page.
Click
(View Issue) in the grid to show the details of an issue on the Issue Details page. Click on the
columns to sort the list of issues.
Issue Details Page
In the menu, click Issues > Issue Tracking, select an Inbox from the list in the toolbar, and then click
(View Issue) in the grid.
The Issue Details page shows detailed information to each issue. Click Edit to change the values in the
fields and lists. Click the buttons beneath to perform various actions on the selected issue. The buttons
vary depending on the state of the issue and on your permissions and privileges. For a list of all available
buttons, see Actions for Working with Issues.
Click the buttons
(Previous Issue in Inbox) and
(Next Issue in Inbox) in the toolbar to step
through the list of issues. Click
(Back to Inbox) or
(My Inbox) to get back to the list of issues on
the Issue Tracking page. Enter an issue number in the toolbar field and click Go to quickly move to a
certain issue.
For more information on the tabs beneath the issue details, see Issue Details Tabs.
Issue Details Tabs
The issue details tabs display beneath the issue details on the Issue Details page. Before you can edit the
values on the tabs (like adding customers or attaching files), you need to click Edit on the Issue Details
page. The following tabs are available:
Name
Description
Description
Contains a Synopsis and a Description of the issue.
History
Tracks all changes concerning the issue. For example: When the
issue was created, who created it, actions like reassigning, fixing,
verifying, addition of customers, files, testcases, and so on.
Silk Central 15.5
| 237
Name
Description
Customers
Allows you to add information about customers who reported the
issue. You can edit and remove the customers with the buttons in the
Actions column.
Attached Files
Allows you to add files with additional information concerning the
issue. You can edit and remove the files with the buttons in the
Actions column.
Testcases
Allows you to add Silk Test testcases. QA and development personnel
can directly execute the testcases by clicking
(Run Testcase) in
the Actions column. Silk Test testcases can also be imported with the
Silk Test Intelligent Assistant.
Notification
Allows you to configure email notifications. Issue Manager notifies you
when certain values of an issue change.
Traceability
Shows the tests that are associated with the Issue Manager issue.
Enter your Silk Central credentials to activate this tab. Click the name
of a test to get to the Tests Details View. On the Issues tab of the
Tests Details View you can see all issues that were assigned to the
test.
Custom
Contains any custom fields and lists the Issue Manager Administrator
set up.
Issue Tracking Toolbar Functions
In the menu, click Issues > Issue Tracking.
The following commands are included in the Issue Tracking toolbar:
Command
238
Button
Description
My Inbox
Shows your inbox with the list of issues that were assigned to the inbox.
Refresh Inbox
Refreshes the list of issues.
New Issue
Shows the UI for entering a new issue.
Inbox list
Lists the inboxes of the different users.
Group list
Lists the user groups.
Number of issues
Shows the number of issues that are assigned to the selected inbox.
Back to Inbox
Shows your inbox with the list of issues that were assigned to the inbox.
Previous Issue in Inbox
Shows the data of the previous issue in the list of issues in the selected
inbox.
Next Issue in Inbox
Shows the data of the next issue in the list of issues in the selected
inbox.
Show printable version
Shows a printable view of the data of the selected issue.
Issue number field
Enter the number of the issue you are searching for and click Go to
show the data of this issue.
Open Silk Test Classic
Intelligent Assistant
Opens the Silk Test Classic Intelligent Assistant.
Customize your Inbox View
Shows the Configuration page where you can customize your inbox.
| Silk Central 15.5
Entering Issues
This chapter describes how to create and edit issues in Issue Manager, how to use the Silk Test Intelligent
Assistant to create issues out of Silk Test result files and how to export results from Silk Test.
Creating Issues (Issue Manager)
To create a new issue in Issue Manager:
1. In the menu, click Issues > Issue Tracking.
2.
Click
(New Issue) in the toolbar.
3. Select values for the Issue Type, the Product, the Release, the Platform, the Component, and the
Severity.
Note: The highlighted fields and lists are required.
As you enter values, Issue Manager dynamically assigns an inbox and an initial state for the issue
based on configured rules.
4. Enter a Synopsis and a Description. To create a link between this issue and another issue, type the
issue number or the synopsis of the related issue into the Linked Issue field (autosuggest-enabled).
Linked issues are listed in the History tab.
5. Optional: Add further details to the issue. Click the tabs and click the following buttons:
•
•
•
Add Customer: Track information about customers who have reported the issue.
Add File: Add a file with additional information about the issue.
Add Testcase: QA and development personnel can directly execute the added Silk Test testcases
by clicking (Run Testcase) in the Actions column on the Testcases tab. Silk Test testcases can
also be imported with the Silk Test Intelligent Assistant.
• Add Notification: Configure to be notified by email when certain values of an issue change.
6. Click OK.
The Issue Details page displays. To get back to the list of issues of your inbox (Issue Tracking page),
click
(My Inbox).
Editing Issues (Issue Manager)
To edit an issue in Issue Manager:
1. In the menu, click Issues > Issue Tracking.
2. Click
(View Issue) in the grid. The Issue Details page displays.
3. Click Edit.
4. Edit the values of the lists and fields.
5. Click the tabs to edit further details of the issue.
6. Click OK.
The changes are tracked in the history. Click the History tab to view the changes.
Silk Test Intelligent Assistant
The Silk Test Intelligent Assistant analyzes testcases in Silk Test result files (.rex). The assistant then
creates testcase issues which can be tracked with Issue Manager.
Based on the testcase results you can either create new issues or update existing issues. For example: If
you run a testcase and it fails, the Intelligent Assistant can attach the testcase to a new issue. QA
engineers can subsequently execute the attached testcase directly from Issue Manager and determine
whether the issue has been fixed.
Silk Central 15.5
| 239
You can assign one or more testcases to an issue. However, you cannot assign a testcase to more than
one issue. The Intelligent Assistant considers two testcases to be the same if they have the same script
name, testcase name, and arguments.
Note: You can instruct the Intelligent Assistant to consider the same testcase run on different
platforms to be separate testcases. The Intelligent Assistant will not propose a testcase to be fixed
until that testcase passes on all platforms.
Importing Silk Test Results to Issue Manager
To import the result of Silk Test tests:
1. In the menu, click Issues > Issue Tracking.
2. Select an Inbox from the list in the toolbar.
3.
4.
5.
6.
7.
Click
(Open Silk Test Classic Intelligent Assistant) in the toolbar.
Browse for a .rex file on your computer.
Select a platform from the list to use the platform that the test ran against as a factor in the
consolidation logic.
Click the check box to include tests that have no errors and are not already associated with an issue
and click Next.
Click the check boxes to select testcases and click one of the following buttons:
•
•
Click New Issue to create a new issue and assign the testcase to it. For more information see
Creating Issues (Issue Manager).
Click Existing Issue and enter an issue number to assign the testcase to it.
Assigned testcases are no longer shown in the list.
8. Click Next.
9. Confirm the proposed actions and click Finish.
The testcases are assigned to the issues. To run or edit the testcases, click the buttons in the Actions
column on the Testcases tab.
Exporting Results from Silk Test
To export results from Silk Test:
1. In Silk Test, click Results > Send to Issue Manager. The Send Results to Issue Manager dialog box
displays.
2. Select a results file (.res).
3. Click OK. The Intelligent Assistant launches. The Intelligent Assistant tab displays with the path to the
results file already loaded in the Exported test results (.rex) field.
4. Click Next. The Associate Tests with Issues dialog displays.
Follow the steps in Importing Silk Test Results to Issue Manager.
Proposed Changes
When you associate testcase results and Silk Test testcases with issues, the Silk Test Intelligent Assistant
compares the results and the current information about issues to build a list of proposed changes for
issues.
The list includes proposed actions for issues plus the new issue states and reason codes that will result if
you confirm the actions. Each proposed action is based on the current state and reason code of each
issue, and on the results of the associated testcases.
To create proposed change list, the Silk Test Intelligent Assistant uses the following equation:
240
| Silk Central 15.5
[current state and reason code] + [test results] = [special action, new state
and reason code]
For example: If the current state of an issue is QA-Ready and its reason code is Fixed, if a testcase
associated with this issue failed, the Intelligent Assistant will propose the AutoRejectFix action, which will
change the issue's state to Dev-Ready and its reason code to Rejected. The following equation
summarizes this example:
[QA-Ready and Fixed] + [failed test] = [AutoRejectFix, Dev-Ready and Rejected]
Working with Issues
Issue Manager provides a range of actions that allow you to work on issues. You can, for example, mark
issues as fixed or implemented, you can indicate that you need more info or that an issue is no longer an
issue, and so on.
The buttons for these actions display on the right side of the Issue Details page. For a list of all available
actions, see Actions for Working with Issues. The list of issues varies depending on the state of the issue
and on the permissions of a certain user. Many actions can be configured and customized by the Issue
Manager Administrator.
Actions for Working with Issues
The Issue Details page shows a list of buttons on the right side. Click the buttons to work on a certain
issue. The buttons vary depending on the state of the issue and on your permissions and privileges.
You can perform the following actions:
Action
Description
Accept
Indicates that the enhancement or documentation issue
described in the issue has been approved for future
development.
Add Comment
Allows you to add a comment about the action you are
taking on the issue.
Add Workaround
Indicates that the issue will not be fixed right away, but
that a workaround will be generated.
Already Done
Indicates that the issue is already fixed.
Arbitrate
Indicates that there is disagreement about the state of the
issue. Development, Documentation, or QA need to
discuss the issue and its state.
As Designed
Indicates that the issue actually is not an issue because
the feature works as it was designed to work.
Cannot Do
Indicates that a requested enhancement cannot be
implemented.
Cannot Fix
Indicates that the issue cannot be fixed. That may be the
case because it is too risky or because it would be too
time-consuming.
Confirm as a Bug
Indicates that the issue actually is an issue that needs to
be fixed.
Copy to Project
Allows you to copy issues to another project. All
customers, attached files, and testcases are copied with
the issue. Notifications are not copied. Click the button,
select a Project from the list, and click OK. The values
Silk Central 15.5
| 241
Action
Description
from the source issue are filled in the fields and lists. Edit
the values as required and click OK.
Defer It
Allows you to defer an issue to a later release.
Edit
Allows you to edit the values in the fields and lists on the
Issue Details page and on the Issue Details tab.
Fixed
Indicates that the issue is fixed. Specify the build or
release in which the issue was fixed.
Implemented
Indicates that the enhancement is implemented.
Mark as Duplicate
Marks an issue as a duplicate of another issue. Specify
the issue number of the matching issue. That issue will
remain open.
Need More Info
Indicates that Development needs more information
about the issue from QA. That may be the case when a
bug cannot be reproduced or when the description is not
clear.
No Longer an Issue
Indicates that the issue is outdated. That may be the case
when new functionality or another bug fix resolved the
issue.
Not a Bug
Indicates that the issue is not a bug, but rather that the
reporter of the issue misunderstood functionality.
Not Reproducible
Indicates that the issue cannot be reproduced.
Reassign
Allows you to assign an issue to a different inbox.
Reject
Indicates either:
•
•
The issue is fixed but cannot be varified and therefore
is rejected.
The requested enhancement was not approved.
Reopen Bug
Indicates that QA has reopened the issue. That may be
the case when an issue was fixed in a previous build and
was reintroduced in a later build.
Verify
Indicates that the issue is fixed and accepted as fixed.
Taking Action on Issues
To take action on an existing issue:
1. In the menu, click Issues > Issue Tracking.
2.
(My Inbox) or select a Group and an Inbox from the lists in the toolbar.
Click
3. Click
(View Issue) in the grid. The Issue Details page displays. The action buttons display on the
right side.
4. Click an action button and enter the required values in the dialog box.
For a list of all available actions, see Actions for Working with Issues.
Setting Issue Verification Preferences
With the issue verification preferences you configure how issues are verified each time you create a new
issue or work on an existing issue.
242
| Silk Central 15.5
To set issue verification preferences:
1. In the menu, click Issues > Configuration.
2. Click Preferences.
3. Select one of the following options:
•
Click Always use normal routing: This is the default system routing.
•
Click Always verify your own issue: All entered issues are routed back to you for verification.
•
Click Prompt for each new issue: Determine for each individual case if the issues are routed back
to you or if the issues use standard routing.
Note: You need the Issue Verification Preferences security privilege to set the preferences. The
Issue Manager Administrator can assign this privilege to you. If you do not have this privilege, the
option buttons are disabled.
Email Notification
You can configure Issue Manager to notify you whenever certain pre-defined events occur. These events
are:
•
•
•
Reassignment: An issue is reassigned with no change in state.
StateChange: An issue changes its state.
AnyChange: A change is made to an issue that generates a new history entry.
The Issue Manager Administrator can define additional rules for specific events. Once rules are defined,
users can setup triggers. You can define systemwide notification triggers or notification triggers for specific
issues. For these actions, you need the following security privileges:
Action
Required security privilege
Defining notification rules
Email notification rules and systemwide triggers
Defining notification triggers
Email notification issue triggers
Defining systemwide notification triggers
Email notification rules and systemwide triggers
The system administrator has to configure the email server settings. Otherwise triggers will not work.
Any user can define a basic email notification, regardless of assigned permissions. If you set this basic
notification, Issue Manager notifies you when another user makes changes to an issue in your inbox or
assigns a new issue to your inbox.
Defining Notification Rules
Issue Manager provides three default notification rules: AnyChange, Reassignment, and StateChange.
To define additional notification rules:
1. In the menu, click Issues > Configuration.
2. Click Notification Rules on the left side.
3. Click Add Rule. The New Notification Rule dialog box appears.
4. Enter a Rule Name, a Description, and a WHERE Clause.
5. Check the Is Active checkbox to activate the rule.
6. Click OK.
The notification rule is added to the list.
Note: You need the security privilege Email notification rules and systemwide triggers to define
notification rules.
Silk Central 15.5
| 243
Defining Notification Triggers
To define notification triggers:
1. In the menu, click Issues > Issue Tracking.
2.
Click
3. Click
(My Inbox) or select a Group and an Inbox from the lists in the toolbar.
(View Issue) in the grid. The Issue Details page displays.
4. Click Edit on the right and click the Notification tab.
5. Click Add Notification. The Add Notification dialog box displays.
6. Enter the required values and click OK. The notification trigger is added to the list.
To edit the trigger click
Actions column.
(Edit Notification, to delete the trigger click
(Remove Notification) in the
Note: You need the security privilege Email notification issue triggers to define systemwide
triggers.
Defining Systemwide Notification Triggers
To define systemwide triggers:
1. In the menu, click Issues > Configuration.
2. Click Systemwide Triggers on the left.
3. Click Add Systemwide Notification. The Add Notification dialog box appears.
4. Enter the required values and click OK. The systemwide notification trigger is added to the list.
5. Optional: Click Preferences on the left and check the check box Show systemwide triggers on each
issues's Notifications tab. All systemwide triggers display on the Notification tab of each issue. You
cannot edit or remove these triggers on the Notification tabs.
To edit the trigger click on the rulename. To delete the trigger click
Notification) in the Actions column.
(Remove Systemwide
Note: You need the security privilege Email notification rules and systemwide triggers to define
systemwide triggers.
Configuring Basic Email Notification
To configure basic email notification:
1. In the menu, click Issues > Configuration.
2. Click Preferences on the left.
3. Check the check box Notify me when users assign issues to me or make changes to issues in my
inbox.
Note: Any user can define a basic email notification, regardless of assigned permissions. The subject
line and content of the basic email notification can be configured in the file SRFrontendBootConf.xml.
Reports (Issue Manager)
With the highly customizable Issue Manager reports you can transform data into meaningful charts. Issue
Manager provides a number of pre-configured reports, which are divided into three categories. These
categories display in the Reports tree:
•
•
244
| Silk Central 15.5
Popular Reports
Text Search
•
Management Reports
Text searches are queries that return report data in tabular format. Report templates are created with BIRT
RCP Designer, an Eclipse-based open-source report tool, or with Microsoft Excel.
If you do not have any data in the selected project or if you are not connected to the correct Issue Manager
database, blank reports are generated.
You can create reports using the GUI-based tools or by manually writing SQL code. With this advanced
approach there is virtually no limit to how data can be queried and presented in reports.
For more information on how to work with reports, see Reports.
Creating Reports
To create an Issue Manager report:
1. In the menu, click Issues > Reports.
2. Select a folder in the Reports tree.
3.
Click
(New Child Report) in the toolbar. The Create New Report dialog box appears.
4. Enter a Name and Description.
5. If you want to Share this report with other users check this check box.
6. Enter a Timeout [s] to define how long Issue Manager waits for report executions to complete.
7. Select a Default tab and a Result category from the lists.
If you access a report by using the context menu (for example when you right-click on a test), you are
directed to the defined Default tab.
8. Select a Selection criteria, a Property, an Operator, and a Value from the lists.
Allowed wildcards for strings are * (any amount of characters) and ? (exactly one character).
9. Click More to create an additional query string and select the AND or OR operator to connect the query
strings. Click
(Remove) to remove query strings.
10.Click Next to configure the columns of the report. You can Add Columns, Remove All, set the order
(Move Up) or
(Move Down), remove a single column by clicking
by clicking
sorting and grouping options, and enter an Alias.
(Remove), set
11.Click Finish.
You can also create reports by manually writing SQL code. Click Advanced on the Create New Report
dialog box and enter or paste your SQL code. For more information, see Writing Advanced Queries with
SQL. For a list of all available function placeholders, see SQL Functions for Custom Reports.
Adding Sub-Reports
To aggregate the results from multiple reports into the currently selected report, you can add sub-reports.
The result columns and rows of the sub-report are concatenated to the results of the selected report.
To add a sub-report:
1. In the menu, click Issues > Reports.
2. Select a report in the Reports tree.
3. Click the Properties tab.
4. Click Add Sub-Report. The Add Sub-Report dialog box appears.
5. From the Reports tree, select the sub-report you want to append to the current report.
6. Click OK. Sub-reports display on the associated report's Properties page in the Sub-Reports section.
To delete a sub-report, click
(Remove) in the Actions column.
Silk Central 15.5
| 245
Editing Report Properties
To edit the properties of a report:
1. In the menu, click Issues > Reports.
2. Select a report from the Reports tree.
3.
Click
(Edit) in the toolbar. The Edit Report dialog box appears.
4. Edit the values as required.
5. Click Finish.
For more information on the UI controls of this dialog box, see Creating Reports.
Editing Report Parameters
To edit the parameters of a report:
1. In the menu, click Issues > Reports.
2. Select a report in the Reports tree.
3. Click the Parameters tab.
If any parameters are defined for the report, they are listed here.
4. Click Edit Parameters. The Edit Parameters dialog box appears.
5. Edit the Label or Value of the listed parameters as required.
6. From the Usage list, select the usage type of the parameter:
•
•
•
Constant Value
Start Time
End Time
7. Click OK.
For more information on report parameters, see Report Parameters Page.
Issue Manager SOAP API
Issue Manager offers an open API (Application Programmable Interface) to enable access to the Issue
Manager repository from a third-party application, for example to submit a defect.
The interface the WSDL is based on is shown below. This interface also contains the documentation for
the methods:
/**
* A Project object has a ProjectID and a ProjectName. The ProjectID
is used for all further methods
* for specifying the Issue Manager project you want to work on.
* @param sessionID
* @return Array of initialized Issue Manager projects available
for the user used for generating the sessionID
* @throws SQLException
*/
public Project[] getProjects(long sessionID) throws SQLException;
/**
* @param sessionId
* @param projectID
* @return the names of the 3 issue types
*/
public String[] getIssueTypes(long sessionId, int projectID)
throws RemoteException, SQLException, LoginException;
246
| Silk Central 15.5
/**
* @param sessionId
* @param projectID
* @return Array of ProductNames that are configured for the
provided Issue Manager project
*/
public String[] getProducts(long sessionId, int projectID)
throws RemoteException, SQLException, LoginException;
/**
* @param sessionId
* @param projectID
* @param product
* @return Array of ReleaseNames that are configured for the
provided product
*/
public String[] getReleases(long sessionId, int projectID,
String product) throws RemoteException, MissingValueException,
SQLException, LoginException;
/**
* @param sessionId
* @param projectID
* @return Array of available PlatformNames
*/
public String[] getPlatforms(long sessionId, int projectID) throws
RemoteException, SQLException, LoginException;
/**
* @param sessionId
* @param projectID
* @param product
* @return Array of ComponentNames that are configured for the
provided product
*/
public String[] getComponents(long sessionId, int projectID,
String product) throws RemoteException, MissingValueException,
SQLException, LoginException;
/**
* The list of Severities can be grouped by IssueType or Product.
If the list is grouped by IssueType the
* parameter issueType has to be provided and the product parameter
can be empty. If the list is grouped by
* product issueType can be empty and the product has to be selected.
* @param sessionId
* @param projectID
* @param product
* @param issueType
* @return Array of values that can be used for entering an issue in
the given project when the provided
* IssueType/Product is selected.
*/
public String[] getSeverities(long sessionId, int projectID,String
product,String issueType) throws RemoteException,
MissingValueException, SQLException, LoginException,
NotExistingValueException;
Silk Central 15.5
| 247
/**
* @param sessionId
* @param projectID has to be a ProjectID delivered by
the method getProjects
* @param issueType has to be a values delivered by
the method getIssueTypes
* @param product has to be a values delivered by
the method getProducts
* @param release has to be a values delivered by
the method getReleases for the selected product
* @param platform has to be a values delivered by
the method getPlatforms
* @param component has to be a values delivered by
the method getComponents for the selected product
* @param severity has to be a values delivered by
the method getSeverities for the selected projectID
and IssueType/Product
* @param synopsis the Synopsis for the new issue
* @param description the Description for the new issue
* @return the Issue Number of the new issue
*/
public int saveNewIssue(long sessionId, int projectID,
String issueType, String product, String release, String
platform, String component, String severity, String
synopsis, String description) throws RemoteException,
MissingValueException, NotExistingValueException,
SQLException, LoginException;
Projects (Issue Manager)
Issue Manager uses a project-based workflow. Only those issues that are associated with the active
project can be viewed or processed. To access individual issues, you need to select a project. In the menu,
click Issues > Project List and click the name of a project to activate it. The selected project remains
active until you select another one.
Initializing Repository Configuration
You need to initialize a project for Issue Manager before you can use it.
Initialized projects display initialized in the Actions column.
To initialize a project:
1. In the menu, click Issues > Project List.
2. Click
(Initialize repository configuration for project <project name>) in the Actions column. The
Init Repository dialog box appears.
3. Optional: Click Create sample data to have sample data created for the database you are initializing.
4. Click OK to start the initialization. The Start Configuration Wizard dialog box appears.
5. Click Yes to proceed with the Configuration Wizard or click No if you plan to configure your project later.
For more information on how to configure Issue Manager, see Issue Manager Administration.
Issue Manager Administration
In addition to the management of user accounts and other administration tasks, Issue Manager also shares
its database repository with Silk Central. Issue Manager projects are also created, configured, and
managed in the Silk Central Administration unit. This enables complete integration of Issue Manager
projects with Silk Central projects.
248
| Silk Central 15.5
When using Issue Manager in conjunction with Silk Central, projects may contain numerous elements in
addition to issues, including requirements, tests, and execution definitions.
Issue Manager projects
Issue Manager uses a project-based workflow. Only those issues that are associated with the active
project can be viewed or processed. You must select an Issue Manager project (via the Projects unit)
before you can gain access to individual issues. The selected project remains the default selected project
each time you access Issue Manager, until you select an alternate project to work with, at which point the
newly selected project becomes the default.
Initializing database configuration
Once a project has been created, its database connection must be initialized before it can be used as an
Issue Manager project.
Setting Up Your Data
Once you feel comfortable using Issue Manager, you can enter information about your organization into a
database. You can enter this information in the Configuration page. To open the Configuration page,
click Issues > Configuration.
Your first step should be to gather information about your organization's work processes. Take the time to
plan carefully. To effectively use Issue Manager in your organization you have to gather information about
the following major areas:
•
•
•
People.
Products.
The suitability of the Issue Tracking page, the action dialog boxes, and the workflow of Issue Manager
for your organization.
Complete the following activities in the following order:
1. Gather information about the people in your organization.
2. Gather information about products.
3. Optional: Assess the interface and the workflow of Issue Manager. You can customize the Issue
Tracking page, the action dialog boxes, the severities list, and the workflow in the Configuration page.
4. Create your own database and populate it with the setup data.
Gathering Information About the People in Your Organization
To gather information about the people in your organization:
1. Draw up a list of groups.
2. Decide which security privileges and initial issue states are appropriate for all members in each group.
3. Draw up a list of accounts.
Each user who logs into Issue Manager is required to have an account.
4. Decide on a naming scheme for your accounts.
Include the assigned group, and, if necessary, one or more Inboxes. Ask yourself the following
questions:
• Which accounts need extra security privileges that are not covered by the group's privileges?
• Should the initial issue states for this account differ from those of the group?
• Do you want login to require passwords?
5. While reviewing the list of user accounts, note which users need Inboxes.
Do groups need Inboxes, too? Decide on an inbox naming scheme.
Silk Central 15.5
| 249
6. You may customize the default view for all users.
All users have the same default view of Inboxes. The view contains eight columns of information.
Gathering Information About Products
To gather information about the products in your organization:
1. Draw up a list of products, releases for each product, and platforms for each release.
2. Compare your platform list with the list in Administration > Platforms.
3. Draw up a list of software and documentation components of each product.
Components (functional areas) are not required; however, they allow you to track issues based on
product, release, platform, and component, and to gain finer control over the routing of issues.
4. Draw up a list of issue severities.
The values on this list are displayed in the Severity column on the Issue Tracking page. You can
categorize this list by product or issue type, or you can come up with a generic list for all products and
issue types.
5. Compare your list with the list in Administration > List of Values.
6. Decide which inbox should receive an issue pertaining to a given product, component, release, and
platform.
These are routing rules.
Optional: Assessing the Interface and the Workflows
To assess the interface and the workflows of Issue Manager:
1. Assess the appearance and behavior of the Issue Tracking page to determine whether or not you want
to perform the following tasks:
•
•
•
Modify the default column labels.
Add columns to capture additional information.
Modify the fields on the Action dialog box, or add your own fields.
Keep a list of your modifications. It's your responsibility to inform the users in your organization about
any modifications that you make.
2. Assess the default workflows to determine whether or not they model your organization's needs.
Look at each state and the valid actions for that state. Are the default group permissions for that action
satisfactory?
Routine Administrative Tasks
Occasionally, after initial setup is complete, you will have routine administrative tasks to perform to keep
Issue Manager up to date. The following are the most common tasks:
Adding a new user
For a new user, you will need to perform the following tasks:
•
•
•
Create an Inbox, if needed, before setting up the account.
Set up a new account, associating the account with an existing group and, if necessary, a default inbox.
Add the user's Inboxes to the routing rules if the user needs to receive issues through automatic
routing.
Removing a user
When a user leaves your organization, you should perform the following tasks:
250
| Silk Central 15.5
•
•
•
•
Immediately deactivate the user's account so that he or she can no longer log in. You cannot delete an
account if a user has created or modified issues.
Replace any references to the user's Inbox in the routing rules with another Inbox. This step prevents
new issues from being sent to this Inbox.
Note: You should make changes to routing rules only when no other users are logged in to Issue
Manager.
Clear out the user's Inbox by reassigning the issues to other Inboxes.
Delete the user's Inbox.
Shifting work assignments
You will need to update group assignments when users change jobs. For example, say that Sarah, a QA
engineer, moves to development. You will also need to modify the routing rules so that users will receive
issues that are appropriate for their new responsibilities. For example, Sarah should now receive issues
that require attention by development instead of QA.
When users change projects, you need to modify the routing rules to reflect their current responsibilities.
You also need to make sure that the default inbox is still appropriate. For example, say that Judy is a writer
who used to write manuals for Product A, but now documents Product B. Judy's default inbox, Judy - Doc
(Product A), should be changed to Judy - Doc (Product B).
Adding new product information
Sometimes you will need to perform the following tasks:
•
•
•
Add new products.
Add additional releases, platforms, and components for existing products.
Change your routing rules to accommodate new products, components, releases, and platforms.
Optional Features
Once you have set up your database and have become comfortable in using Issue Manager, consider
using the following optional features:
Email notification
The email notification feature allows Issue Manager users to have email sent to them whenever certain
events occur to an issue, for example a reassignment or a state change. Users with the Email Notification
Rules and Systemwide Triggers security privilege can define additional circumstances under which an
email is sent. Consult your users about the circumstances under which they would like to receive email.
Archiving issues
The greater the number of issues in the database, the longer actions, for example queries, may take to
execute. To help you improve the overall performance, Issue Manager allows you to archive issues that
are no longer relevant to your organization's efforts. Archiving issues segregates them in the database so
that you can, for example, run queries against only the active issues.
Setting Up Groups
Depending on your organization, groups can be entire departments, cross-departmental project teams, or
intra-departmental teams.
Each group can have distinct security privileges and permissions. An Issue Manager group also
determines where issues reported by the members of the group enter the workflow. A user's group
determines what the user can do in Issue Manager and affects how issues reported by the user are routed.
The sample database provides the following default groups:
Silk Central 15.5
| 251
•
•
•
•
•
•
Corporate
Development
Documentation
Quality Assurance
R&D Management
Technical Support
All Issue Manager users, regardless of the tasks that they perform, must be assigned to a group. A user
can only be in one group at a time.
Groups must be set up before inboxes and user accounts are set up, because each inbox and user must
be associated with a group.
Note: Groups are created, edited, and deleted in the Groups tab in Administration > User
Management, while group settings specific for Issue Manager are configured in Issues >
Configuration > Groups.
Group Properties
Groups have a number of properties. Basic group information, for example the name of a group, is
specified in the Groups tab in Administration > User Management. Group settings that are specific for
Issue Manager, for example the initial issue states and certain security privileges, are specified in the
Groups tab in Issues > Configuration.
Note: You have to create a group before you can modify group settings that are specific for Issue
Manager.
Group Information
The following table lists the properties that you can set for a group in Administration > User
Management:
Property
Description
Name
Required unique name for a group, for example Documentation. Can contain up to 20
characters.
Description
Optional: Description of the group, for example Documentation produces all technical
publications, including manuals and release notes. Can contain up to 80 characters.
Account and Role
Assignment
Users must have certain roles assigned to them.
Project Assignment
A group must be assigned to at least one project. Users assigned to a group have
access only to the projects that are assigned to the respective group.
Initial Issue State
The initial issue state is the first state assigned to a bug, enhancement, or documentation issue when it is
submitted by a member of a given group. Different groups can have different initial states for the same type
of issue. Moreover, within a group each issue type, bug, enhancement, and documentation issue, can have
a different initial state.
For example, you might assign a software bug submitted by members of the Development group to an
initial state of Dev-Ready because you assume that developers can accurately assess what is actually a
software bug. On the other hand, you might assign a software bug submitted by members of the Corporate
group to an initial state of Unreviewed because you might want to first verify that the issue is truly a new
bug before sending it on to Development to be fixed.
Issue Manager provides a number of default states for you to choose from. You can also create your own
issue states before you set up the groups in your organization.
252
| Silk Central 15.5
Although initial issue states apply to every member of a group, you can explicitly override these settings for
a given user.
Group Security Settings
Security privileges define which activities all users in a group can perform. You can assign additional
privileges for a given user in a group by editing his or her user account but you cannot take away privileges
that have been granted to the user's group.
To assign security privileges for a group, click Define Group Settings in Issues > Configuration >
Groups. Check the check box to assign the corresponding privilege to the group. To give a group
superuser privileges, check all check boxes.
The following table lists the privileges that allow group members to perform specific customization tasks:
Check Box
Description
Groups, inboxes and user accounts
Create and edit groups, inboxes, and user accounts,
including security privileges.
Products
Create and edit products, releases, platforms, and
components. Edit the Platforms list and other lists.
Routing rules
Define how an issue moves from one inbox to another
based on the product, release, platform, and component
it was logged against.
GUI customization
Customize fields and tabs on the Issue Tracking page.
Workflow customization
Define issue states and actions, action permissions, help
text, and the appearance and usage of action dialog
boxes.
Email notification rules and systemwide triggers
Define email notification rules and add email notification
triggers that apply to all issues in the database.
Archive issues
Removes selected issues from the issues and the tables
related to the issues and places them in the ARCHIVE
and the tables related to the ARCHIVE.
The following table lists the privileges that affect the routing of issues and email triggers:
Check Box
Description
Reassign issues
Move an issue from one inbox to another.
Issue verification preferences
Check to override the normal routing rules.
Email notification issue triggers
Add email notification triggers to individual issues.
Enter/edit issues
Permission to enter and edit issues.
Setting Up Inboxes
An inbox is similar to a mail box. All open, active issues addressed (assigned) to a particular user or group
of users are delivered to the Inbox. It is important not to confuse an Inbox with a user account. Issues are
always assigned to inboxes, not to specific users.
Note: Archived issues do not display in inboxes.
How are issues routed to inboxes?
The routing rules of Issue Manager automatically dispatch issues to the appropriate inboxes. An issue
stays in an inbox until a user acts on it, for example when a developer fixes a bug. Then Issue Manager
automatically dispatches the issue to the next inbox, based on your workflow and routing rules. Finally,
when an issue is closed, Issue Manager removes the issue from the last inbox.
Silk Central 15.5
| 253
An issue can also be routed to another inbox when a user with the Reassign issues security privilege
manually reassigns it to another inbox.
Which users need inboxes?
Users who take action on issues should have an inbox. Developers, QA engineers, and technical writers
are in this category. Users who only report or view bugs do not require inboxes. Technical support
personnel who routinely report bugs found by customers, but who do not act on bugs may be in this
category.
How many inboxes does a user need?
A user can have multiple inboxes. For example, a developer might want two separate inboxes to hold bug
reports from two different products. In this case, you might set up the two inboxes Dan - Dev (Product A)
and Dan - Dev (Product B).
Individual and group inboxes
You can set up inboxes for individual users, groups of users, or subsets of issues. For example, the QA
engineers Sarah and Mike might be responsible for verifying bug fixes for different products. In such an
instance you would set up the two inboxes Sarah - QA and Mike - QA.
Users can also share inboxes. For example, a Product Management group might need only one inbox into
which all enhancements are funneled; periodically, the entire group might meet to review the suggested
improvements. In such situation you might set up a single inbox called PM - Inbox.
Another use of an inbox might be as a holding place for a subset of issues. For example, you might want to
create an inbox for all deferred issues for Product C. In such a case, creating an inbox called Deferred
(Product C) might be appropriate.
Assigning a user's default inbox
When you set up a user account you will assign an inbox to the user account. This inbox is the default
inbox of the user. A user can have only one default inbox.
Viewing default and other inboxes
You can view your default inbox by selecting Issues > Issue Tracking. If the default inbox is not
displayed, click My Inbox in the toolbar.
To see an inbox other than the default, select another inbox listed in the Inbox list box. Any user can view
any inbox, but only a user with the correct privileges and permissions can act on or reassign an issue.
System default view
Issue Manager provides an initial default view of inboxes for all users. You can customize the default view
of inboxes for all users.
Adding an Inbox
You should add at least one inbox for every user who acts on issues.
Note: You need the Groups, inboxes and user accounts security privilege to add, edit, or delete
inboxes.
To add an Inbox:
1. In the menu, click Issues > Configuration.
2. Click Inboxes. The Inboxes page opens.
3. Click Add Inbox. The Inbox Settings dialog box opens.
254
| Silk Central 15.5
4. Type a name for the Inbox in the Name field.
Each inbox requires a unique name of up to 20 characters. The following are sample Inbox names:
•
•
•
•
•
Dave (Dev)
PM Inbox
Jesse - Doc
Dan - Dev (Product A)
Dan - Dev (Product B)
User Inbox names can be in any format you choose, but you should follow the format consistently. The
following are sample formats:
•
•
•
•
user (group)
user - group
user - group (Product-name)
user
Group inboxes should also follow a consistent format, for example one of the following:
•
•
group
Group (Product-Name)
Special characters are not allowed. Inbox names are displayed in ASCII sort order (capital letters first)
on the Inboxes page.
5. From the Group list box, select the group that is associated with this Inbox. Based on this association,
Issue Manager helps users reassign issues selectively. For example, say that Denise, who is in the
Documentation group, reassigns an issue in her inbox. Issue Manager opens the Issue Reassignment
dialog box with Documentation as the default group. Denise can then select another member of the
Documentation group from the New Inbox list box without having to scan the entire list of inboxes.
6. Optional: Enter a description of the inbox in the Description field.
The description can have a length of up to 80 characters. For example Developer David Hanson's
inbox or dhart's inbox for Product B issues.
7. The Is Active check box is checked by default.
Note: If the inbox is used in the routing rules you cannot uncheck the Is active check box.
8. Click OK to create the new inbox..
Editing an Inbox
Note: You need the Groups, inboxes and user accounts security privilege to add, edit, or delete
inboxes.
To edit an inbox:
1. In the menu, click Issues > Configuration.
2. Click Inboxes. The Inboxes page opens.
3. Click on the name of the inbox that you want to edit. The Inbox Settings dialog box opens.
4. Edit the name of the inbox.
5. Select a different group from the Group list box.
6. Edit the description of the inbox.
7. Check or uncheck the Is active check box.
Note: If the inbox is used in the routing rules you cannot uncheck the Is active check box.
8. Click OK to save your changes.
Silk Central 15.5
| 255
Deleting an Inbox
You can delete an inbox only if it does not contain any issues, is not referenced in routing rules, and is not
the default inbox of a user. Before you try to delete an inbox, edit the routing rules to prevent new issues
from being routed to the inbox, and then reassign the existing issues in the inbox.
Note: You need the Groups, inboxes and user accounts security privilege to add, edit, or delete
inboxes.
To delete an inbox:
1. In the menu, click Issues > Configuration.
2. Click Inboxes. The Inboxes page opens.
3. In the Actions column of the inbox that you want to delete, click
. A confirmation dialog box opens.
4. Click Yes to remove the inbox from the system.
Setting Up the Initial Default Inbox View
When you install Issue Manager, the initial default inbox view consists of the following eight columns:
•
•
•
•
•
•
•
•
Severity
Issue#
Product
Component
Release
Synopsis
Created By
Changed By
You can perform the following customization tasks to the initial default inbox view for all users:
•
•
•
Add or remove columns from the display.
Edit the label of a column.
Change the sort order of a column.
Individual users can create custom initial views of inboxes.
Modifying the Default Inbox View
Note: You need the Groups, inboxes and user accounts security privilege to add, edit, or delete
inboxes.
To modify the initial default inbox view:
1. In the menu, click Issues > Configuration.
2. Click Inbox Views. The Inbox Views page opens. This page displays all of the fields that you can
choose to display in an inbox view. Most of the fields are recognizable from the Issue Details page.
Others, for example NumHistory, NumCases, NumAttaches, NumTestcases, and NumNotify refer
to the number of entries on the respective History, Customers, Attached Files, Testcases, and
Notifications tabs of the Issue Details page. The Inbox Views page also displays the schema, or DB
Field Name , of each column.
3. From the View of user list box, select SYSTEM DEFAULT.
4. To add a column to the inbox, click the
Fields.
that corresponds to the column in the List of Available
5. To remove a column from the inbox, click the
that corresponds to the column in the list of the inbox
columns.
6. To change the label of a column and the sort order, perform the following steps:
256
| Silk Central 15.5
a) Click on the name of the inbox column in the Inbox Column Label column. The Inbox Column
Properties dialog box opens.
b) Type a new label for the column into the Inbox column label field.
c) Click the appropriate option button to change the sort order.
d) Click OK.
7. To move a column to the left in the inbox, click
8. To move a column to the right in the inbox, click
.
.
9. Click View Inbox to view the updated default inbox view.
Setting Up User Accounts
A user account is a collection of information about a given user. Each user is assigned to a group and, if
the user acts on issues, an inbox. A user account can be password-protected. Every person who logs on to
the system to report an issue, act on an issue, or merely browse, needs a user account.
Note: You can create, edit, or delete user accounts in the Accounts tab in Administration > User
Management .
Users inherit the security privileges and the initial issue states of their group. To give an individual user
enhanced privileges or alternate initial issue states, you must edit the account of this user. To configure
these settings, use the User Accounts tab in Issues > Configuration.
Note: Before you can set up user accounts, you must have already set up groups and inboxes.
User Account Properties
The issue-related properties for user accounts are specified in the User Accounts tab in Issues >
Configuration.
Note: Before you can view or edit issue-related account properties, you must create a user account.
Click on the name of a user in the User Accounts tab to edit the issue-related account properties.
The following table lists the issue-related account properties:
Property
Description
Login
Required unique login name for a user. Can contain up to
30 characters. Special characters are not allowed.
Note: You cannot edit the login name in Issue
Manager.
Inbox
The default inbox of the user. You can select an alternate
default inbox for the user from the Inbox list box.
Setting Group
Required. The group to which this user belongs. When
you select a group from the Setting Group list box, Issue
Manager automatically assigns the default values of the
group for initial issue states and group security settings to
the user.
Initial Issue State
The initial issue state is the first state assigned to a bug, enhancement, or documentation issue when it is
submitted by a user. The default values are the group defaults, which are the values assigned to the group
to which the user belongs.
You might want to change the default initial issue states for a user account, if, for example, a user has a
higher level of technical competence. For example, suppose that within a group of non-technical
Silk Central 15.5
| 257
managers, one manager is decidedly technical. You might want to have this user's issues enter Issue
Manager further along in the workflow.
User Security Settings
Security privileges define which activities the user can perform. The default security privileges for a user
are the security privileges of the group to which the user belongs. You can assign additional privileges for a
given user in a group by editing his or her user account but you cannot take away privileges that have been
granted to the user's group. The default security privileges are read-only.
To assign security privileges to a user account, click on the name of the user in Issues > Configuration >
User Accounts. Check the appropriate check box to assign the corresponding privilege to the user.
The following table lists the privileges that allow users to perform specific customization tasks:
Check Box
Description
Groups, inboxes and user accounts
Create and edit groups, inboxes, and user accounts,
including security privileges.
Products
Create and edit products, releases, platforms, and
components. Edit the Platforms list and other lists.
Routing rules
Define how an issue moves from one inbox to another
based on the product, release, platform, and component
it was logged against.
GUI customization
Customize fields and tabs on the Issue Tracking page.
Workflow customization
Define issue states and actions, action permissions, help
text, and the appearance and usage of action dialog
boxes.
Email notification rules and systemwide triggers
Define email notification rules and add email notification
triggers that apply to all issues in the database.
Archive issues
Removes selected issues from the issues and the tables
related to the issues and places them in the ARCHIVE
and the tables related to the ARCHIVE.
The following table lists the privileges that affect the routing of issues and email triggers:
Check Box
Description
Reassign issues
Move an issue from one inbox to another.
Issue verification preferences
Check to override the normal routing rules.
Email notification issue triggers
Add email notification triggers to individual issues.
Enter/edit issues
Permission to enter and edit issues.
Editing a User Account
Note: You need the Groups, inboxes and user accounts security privilege to edit user accounts.
To edit the security privileges and the initial issue states for a user account:
1. In the menu, click Issues > Configuration.
2. Click User Accounts. The User Accounts page opens.
3. Click on the name of the user for whom you want to edit the security privileges. The User Settings
dialog box opens.
4. Change the security privileges of the user and the initial issue states.
5. Click OK to save your changes or click Cancel to exit without making changes.
258
| Silk Central 15.5
Defining Product Settings
In addition to tracking issues for specific products, Issue Manager also tracks issues for the following:
•
•
•
Specific versions of products.
Specific platforms that product versions are associated with.
Specific product components.
Product teams often have more than one person writing code for a given application. Issue Manager
enables you to link products and components with specific inboxes. Additionally, Issue Manager
automatically assigns new issues to the appropriate developers based on the product, the component, the
release and the platform.
Note: You can create and edit products, components, versions, builds, and platforms in the
Administration unit of Silk Central. The only properties that you can configure through Issue
Manager are product inbox settings.
It is up to you to define how you want to distinguish products from components. A product in one
organization might be defined as a component in another organization. The following basic definitions
might help you:
Product
A product is a piece of software that can be run separately from other software that may be
delivered with it. It can be sold separately if required. In a product the executable program
is separated from the code base. A product may consist of multiple components.
Component A component is a functional area of a product. A component cannot be sold separately, and
users do not see a component as a distinct product. A product may have one or more
components associated with it.
Release
A release is a specific version or a specific software build of a specific product. A release
can be an internal development build or a build that is shipped to customers. A product
might have multiple releases associated with it. A specific release of a product might be
available on more than one platform.
Platform
A platform is an environment in which a product runs. A platform consists of a combination
of any of the following elements:
•
•
•
Hardware.
Operating system.
Operating system release. For example Microsoft Windows 7.
Many of the values that are defined for products, releases, platforms, and components are
displayed on the Products page in Issues > Configuration > Products.
Defining Inbox Settings for a Project
To define the inbox settings for specific products in Issue Manager:
1.
2.
3.
4.
In the menu, click Issues > Configuration.
Click Products. The Products page opens.
Click Define Product Settings. The Product Settings dialog box opens.
From the Product list box, select the product for which you want to define inbox settings.
Note: By clicking the name of a product that has already been assigned to an issue in the
Products page, you can bypass this step.
5. From the QA-Inbox list box, select the predefined inbox to which an issue assigned to QA and defined
with the given product should be routed.
6. From the Dev-Inbox list box, select the predefined inbox to which an issue assigned to development
and defined with the given product should be routed.
7. From the Enh-Inbox list box, select the predefined inbox to which an enhancement-request issue which
is defined with the given product should be routed.
Silk Central 15.5
| 259
8. From the Doc-Inbox list box, select the predefined inbox to which an issue assigned to documentation
and defined with the current product should be routed.
9. Click OK.
Deleting a Product
Deleting a product in Issue Manager does not actually delete the product from the repository, but rather
detaches the product from the selected project, so that the product is no longer accessible from Issue
Manager.
Note: You can only delete a product as long as no issues have been entered for the specific product.
To delete a product from the active project:
1. In the menu, click Issues > Configuration.
2. Click Products. The Products page opens.
3. In the Actions column of the product that you want to delete, click
. A confirmation dialog box opens.
4. Click Yes to complete the deletion.
Setting Up Routing Rules
Issue Manager relies on defined routing rules, the current state of each issue, and the corresponding state
owners to determine the inboxes that issues are to be routed to during their life cycles. This sophisticated
routing mechanism replaces what would otherwise be a tedious task for issue dispatchers.
The state of an issue is the current condition of the issue. A number of states are provided in the default
workflow of Issue Manager. The state owner is the role in your organization that is responsible for acting on
an issue in a given state.
The following are examples of issue states and owners from the default issue workflow:
Unreviewed Someone needs to determine whether or not this issue is truly a bug or documentation
error. Usually, this role is owned by a QA engineer.
Dev-Ready
Code is ready to be addressed. This role is typically owned by a developer.
QA-Ready
Someone needs to verify that the bug has actually been fixed. This role is usually owned by
a QA engineer.
Different issues of the same type can enter the workflow in different states, depending on who submits
them. The routing is affected accordingly. For example, an issue submitted by a developer enters the
workflow in the Dev-Ready state, and is therefore routed to a developer's inbox. An issue submitted by a
corporate user enters the workflow in the Unreviewed state, and is therefore routed to a QA engineer's
inbox. The so-called initial issue state is assigned through group settings.
An issue moves from one state to the next in the workflow when a user takes action on that issue. For
example, when a QA engineer confirms that a reported, unreviewed issue is indeed a bug, the issue
moves from the Unreviewed state to the Dev-Ready state. The main goal of using routing logic here is to
make sure that once the issue is judged to be a bug by the QA engineer, it moves from his or her inbox to
the appropriate developer's inbox-without need for manual intervention.
Routing Rules
Issue routing is based on rules that you define for a product and its associated releases, platforms, and
components. This rule-based mechanism gives you fine control over the distribution of issues because
issues are routed based in part on a combination of the following criteria:
•
•
260
| Silk Central 15.5
Product
Component
•
•
•
•
Release
Platform
Issue state
State owner
You need to assign the following four inboxes for each set of criteria:
•
•
•
•
An inbox responsible for verifying issues, which is typically a QA inbox.
An inbox responsible for fixing issues, which is typically a Development inbox.
An inbox for handling documentation problems, which is a Documentation inbox.
An inbox for enhancement requests, which is typically a product management inbox.
Example
All Product A bugs related to the Installer component and associated with the Motif
platform can be routed to one set of inboxes, while all Product A bugs related to the
Installer component for the Windows platforms can be sent to another set of inboxes.
Default routing
In addition to granular routing rules, Issue Manager requires that you define one routing rule for the product
as a whole, which means default routing. In default routing, issues for all components, releases, and
platforms of a specific product are routed to a designated set of four inboxes.
Each inbox covers one of the following areas:
•
•
•
•
QA
Development
Documentation
Enhancement requests
For example, all requests for enhancements for Product X are directed to the one enhancement request
inbox you assign, regardless of the individual component, platform, or release.
Issue Manager uses the default routing rule only when other routing rules do not exist or are not applicable.
In other words, default routing rules are applied only when specific rules do not match or have not been
specified.
Default routing is set up during Issue Manager product setup.
Analyzing the processes in your organization
Analyze the breakdown of work in your organization. Review your list of products, releases, and platforms
and consider each component in turn against this list. Ask yourself questions such as the following:
For this component in this release and on this platform, who, which means which inbox, is responsible for
each action, for example verifying, fixing, and so on?
Then define as many rules as required for the different combinations of the following four criteria:
•
•
•
•
Product
Release
Platform
Component
Specifying Rules
Each rule is entered into the Routing Rules page, which is located in Issues > Configuration > Routing
Rules.
Silk Central 15.5
| 261
Note: The New Routing Rule dialog box has an if-then layout. If an issue matches specific
conditions, which means it pertains to a particular release, platform, component, and issue type, then
it is routed to one of the four specified inboxes. Which one of the four inboxes is chosen is determined
by the issue's current state and owner.
The wildcard % symbol
The percent sign (%) in the Release, Platform, and Component fields of the New Routing Rule dialog
box serves as a wildcard character that matches all characters. Using the percent sign by itself in all three
fields would be the same as default routing; everything would be routed to the four inboxes specified in the
dialog box, regardless of values for release, platform, and component.
Tip: You must specify release, component, and platform names consistently to take advantage of
wildcarding.
Once a rule has been saved, it is entered into the Routing Rules page. This page is essentially a routing
table for a particular product. Alternate product selections can be made using the Product list box at the
top of the page.
The order of rules is critical
The order of rules for a component is critical. Issue Manager routes issues by evaluating their current state,
for example Unreviewed, against each rule in the table in order. As soon as Issue Manager finds a match,
it executes the rule. If there is no match, it routes the issue according to the default rules. Default routing
rules are applied only after all other rules for a given product have been applied.
Example
Release 4.% in the Release field would match all Release 4 releases: 4.0, 4.1, 4.1.1,
and so on.
Example: How to read a routing rule
For example, send issues that are related to Product A for all releases and all platforms
to the Sonja - Dev inbox when the issue is ready for development, to the Mike - QA
inbox when the issue is ready for QA, to the Product A request-for-enhancement inbox
Dan -- Dev (Product A) when an enhancement is submitted, and to the Judy -Doc inbox
when a documentation issue relating to the Show me component is reported.
Adding Routing Rules
To add a routing rule:
1. In the menu, click Issues > Configuration.
2. Click Products. The Products page opens.
3. From the Product list box, select the product for which you want to configure a routing rule.
4. Click New Routing Rule. The New Routing Rule dialog box opens.
5. Click the corresponding option button to define if the issue is a BUG or ENHANCEMENT (SOFT) or if
the issue is a DOC-ISSUE (DOC).
6. Select a pre-defined release from the Release list box. Or type in a pre-defined release into the
Specific Matchcode field. Select nothing, which means the dotted line, if any release should be
considered.
7. Select a pre-defined platform from the Platform list box. Or type in a pre-defined platform into the
Specific Matchcode field. Select nothing, which means the dotted line, if any release should be
considered.
262
| Silk Central 15.5
8. Select a pre-defined component from the Component list box. Or type in a pre-defined component into
the Specific Matchcode field. Select nothing, which means the dotted line, if any release should be
considered.
Note: You must select a value for at least one of either release, platform, or component.
Otherwise, the new routing rule would follow the same rules as the default rule.
9. In the Then route to these inboxes area of the dialog box, select a pre-defined inbox for each of the
following four inbox categories:
•
•
•
•
QA Inbox
Development Inbox
Enhancement Inbox
Documentation Inbox
10.Click OK. The rule is saved and added to the routing table.
Note: If you have made changes to the routing table, Issue Manager saves and reconfigures the
routing rules, which may take some time.
Editing Routing Rules
To edit an existing routing rule:
1. In the menu, click Issues > Configuration.
2. Click Products. The Products page opens.
3. From the Product list box, select the product for which you want to configure a routing rule.
4. In the Actions column of the rule that you want to edit, click
opens.
. The Edit Routing Rule dialog box
5. Click the corresponding option button to define if the issue is a BUG or ENHANCEMENT (SOFT) or if
the issue is a DOC-ISSUE (DOC).
6. Select a pre-defined release from the Release list box. Or type in a pre-defined release into the
Specific Matchcode field. Select nothing, which means the dotted line, if any release should be
considered.
7. Select a pre-defined platform from the Platform list box. Or type in a pre-defined platform into the
Specific Matchcode field. Select nothing, which means the dotted line, if any release should be
considered.
8. Select a pre-defined component from the Component list box. Or type in a pre-defined component into
the Specific Matchcode field. Select nothing, which means the dotted line, if any release should be
considered.
Note: You must select a value for at least one of either release, platform, or component.
Otherwise, the new routing rule would follow the same rules as the default rule.
9. In the Then route to these inboxes area of the dialog box, select a pre-defined inbox for each of the
following four inbox categories:
•
•
•
•
QA Inbox
Development Inbox
Enhancement Inbox
Documentation Inbox
10.Click OK. The rule is saved and added to the routing table.
Note: If you have made changes to the routing table, Issue Manager saves and reconfigures the
routing rules, which may take some time.
Deleting Routing Rules
To delete an existing routing rule:
Silk Central 15.5
| 263
1. In the menu, click Issues > Configuration.
2. Click Products. The Products page opens.
3. From the Product list box, select the product for which you want to configure a routing rule.
4. In the Actions column of the rule that you want to delete, click
dialog box opens.
. A Delete Routing Rule confirmation
5. Click Yes to complete the deletion.
Reordering Routing Rules
To reorder routing rules:
1. In the menu, click Issues > Configuration.
2. Click Products. The Products page opens.
3. From the Product list box, select the product for which you want to configure a routing rule.
4. In the Actions column of the rule that you want to reorder, click one of the following:
•
•
To move the rule up in the list, click
.
To move the rule down in the list, click
.
Automatic Routing Override Preferences
You can allow individual users or entire groups to override the normal routing for verifying issues in your
organization. For example, a user might want to verify that the reported issues have been fixed.
To permit such an override, assign the Issue verification preferences privilege to the user or group. With
this security privilege, users can then choose one of the following three strategies from Issues >
Configuration > Preferences:
Strategy
Description
Always use normal
routing
Normal routing for verification. The issue will be routed to the appropriate
QA inbox.
Always verify your own
issue
Have Issue Manager route issues that users submit to their own inboxes for
verification, rather than to the typical QA inbox.
Prompt for each new
issue
Have Issue Manager give users the option to override normal routing each
time an issue is reported.
Reassignment overrides automatic routing
Reassigning an issue is a method of manual routing that overrides the automatic routing mechanism. A
user can explicitly take the Reassign action to route an issue to the inbox of another user, typically a user
in the same group. For example, developer Bill, who is going on vacation, might reassign a Dev-Ready bug
to his developer colleague Dan. The bug remains in the Dev-Ready state, but it has been reassigned.
When an issue that has been reassigned returns to a previous state in the workflow, for example if Dan
were to reject a bug fix, Issue Manager remembers the reassignment and later returns the issue to the
inbox to which the issue was manually routed, which in this case is Dan's inbox, rather than to the inbox to
which it was originally routed, which in this case is Bill's inbox.
Example
To appreciate how efficiently reassignment works, consider an example in which a bug
is reassigned twice - once in the Dev-Ready state and once in the QA-Ready state, and
the QA engineer rejects a bug fix, sending the bug back to an earlier state in the
workflow.
264
| Silk Central 15.5
1. A new bug enters the workflow in the Dev-Ready state. The routing rules
automatically send the bug to the inbox of developer Bill.
2. Bill reassigns the bug to the inbox of developer Dan.
3. Dan claims that the bug has been fixed, which sends the bug to the QA-Ready state.
4. The routing rules automatically route the bug to the inbox of QA engineer Mike for
verification.
5. Mike reassigns the bug to the inbox of his colleague Sarah.
6. Sarah rejects the fix, which sends the bug back to Dev-Ready.
7. Issue Manager routes the Dev-Ready bug back to the inbox of Dan, because he was
the last developer to act on the bug in that state.
8. Dan fixes the bug again, sending the bug back to QA-Ready.
9. Issue Manager routes the QA-Ready bug back to Sarah's inbox, because she was
the last QA engineer to act on the bug in that state.
Without enhanced routing, the issue in the Dev-Ready state (step 7) would be routed to
Bill's inbox, who would then once again reassign the issue to Dan. Similarly, the issue in
the QA-Ready state (step 9) would be routed to Mike's inbox, who would then once
again reassign the issue to Sarah.
Customizing the Issue Details Page
Issue Manager allows you to change the appearance and behavior of the New Issue page and the Issue
Details page for an existing issue. For example, you might want to make a field label more relevant for
your organization, for example Build rather than Release.
Changes you make to the labels on the Issue Details page are propagated to most other pages and dialog
boxes that are invoked through the Customization of Issue Manager.
Issue Manager allows you to make the following changes to the Issue Details page:
•
•
•
•
Edit the labels and modify the properties of the fields that specify basic information about an issue. For
example, you might want to change the label Synopsis to Summary.
Edit the labels of the fields in the Automatic Fields area.
Edit the tab labels.
Define fields on Custom Tab 1 and Custom Tab 2. You can modify or delete these fields or add your
own. By default, Custom Tab 1 contains four fields.
The following table describes where to look for information related to customizing a standard issue field
label and standard issue field contents:
Name
Edit field label?
Customize field properties?
Issue Type
Customizing Fields and Tab Labels
Yes.
Product
Customizing Fields and Tab Labels
Yes. See Editing Products.
Release
Customizing Fields and Tab Labels
Yes. See Editing Versions.
Platform
Customizing Fields and Tab Labels
Yes. See Editing Platforms.
Component
Customizing Fields and Tab Labels
Yes. See Editing Components.
Severity
Customizing Fields and Tab Labels
Yes.
Synopsis
Customizing Fields and Tab Labels
No. Users fill in the synopsis.
Issue Number
Customizing Fields and Tab Labels
No. The issue number cannot be
customized.
Assigned To
Customizing Fields and Tab Labels
Yes. See Routing Rules.
State
Customizing Fields and Tab Labels
Yes. See Customizing Workflow
States.
Silk Central 15.5
| 265
Name
Edit field label?
Customize field properties?
Reason Code
Customizing Fields and Tab Labels
Yes. See Reason Code.
Action Release
Action Properties
Yes.
The following table describes where to look for information related to customizing a tab label and fields on
tabs:
Name
Edit tab label?
Customize field on tabs?
Description
Customizing Fields and Tab Labels
No. Users fill in the Description tab.
History
Customizing Fields and Tab Labels
No . Issue Manager fills in the
History tab, but you can customize
the Action column. See Current
State Information.
Customers
Customizing Fields and Tab Labels
No. Users can take the predefined
Add Customer action.
Attached Files
Customizing Fields and Tab Labels
No. Users can take the predefined
Add File action.
Testcases
Customizing Fields and Tab Labels
No. Users can take the predefined
Add Testcase action.
Notifications
Customizing Fields and Tab Labels
No. Users can take the predefined
Add Notification action.
Custom Tab
Creating Custom Tabs
Yes. See Editing Custom Fields.
Customizing Fields and Tab Labels
Note: You need the GUI customization privilege to perform the actions described in this topic.
This topic explains how to customize the standard issue fields, tab labels, and automatic fields, with the
exception of the Action Release field. For information on customizing the Action Release field, see
Standard Action Fields Tab. You cannot delete any of these fields, nor can you add to them. However, you
can change their properties. For example, you can edit their labels, choose their mode, and restrict the
groups that have permission to fill in or modify them.
To modify the standard issue fields and tab labels:
1. In the menu, click Issues > Configuration.
2. Click Standard Issue Fields. The Standard Issue Fields page opens.
Note: The Standard Issue Fields page is laid out like the Issue Details page.
3. If you want to rename a tab label, perform the following actions:
a) Click the link of the tab that you want to edit. The Edit Label dialog box opens.
b) Modify the name of the tab as required.
c) Click OK.
4. If you want to edit the properties of a field, perform the following actions:
a) Click the link of any field that you want to edit. The Edit Field Properties dialog box opens.
b) Modify the properties of the field as required.
c) Click OK.
GUI Customization Properties
The fields on the Issue Details page have properties that determine their appearance and usage. For
example, the properties specify the field's label and control type, for example whether the field is a check
box or a text field. You can view and edit the properties for a field on the Edit Field Properties dialog box.
266
| Silk Central 15.5
To access the Edit Field Properties dialog box, click on the link of the property that you want to edit in
Issues > Configuration > Standard Issue Fields.
You can change the following properties:
Property
Description
Label
The text of the field label, up to 20 characters. Add a colon if you want to separate the
label from its associated contents. Special characters are not allowed.
Control Type
Active only when user-defined fields are created. The type of control can be
Checkbox, Textfield, or Popup List.
Case mapping
Active only when the control type is Textfield. Determines the case of the characters
that a user enters into a text field. Available values are Upper, Lower, and None.
List name
Active only for user-defined popup lists. Select the name of the custom list that defines
the values for this popup list.
Mode
Describes the role of the field when a user reports a new issue.
Group
permissions
Value
Description
Required
Must have a value.
Optional
Might have a value or might be blank.
Read-only
Cannot be edited.
Active when mode is Required or Optional. Permissions defines which groups can
enter a value in this field.
•
•
All gives permission to all groups.
Selected restricts permission to the groups you choose from the list box. When the
field is required or optional and permission is restricted to selected groups, the field
is read-only for all remaining groups.
Remember
value from last
issue entered
Select this check box to have the Issue Details page display the last chosen value.
For example, assume that this check box is selected for the Product field. When a
user reporting an issue first picks a value from the Product list box, for example QA
Partner, that value is preserved, so that the next time the user reports an issue, the
Product field displays QA Partner by default.
Mode
Describes the role of the field when a user edits an existing issue.
Value
Description
Required
Must have a value.
Optional
Might have a value or might be blank.
Read-only
Cannot be edited.
Tip: A check box cannot be a required field. If you need a field to be required,
consider defining it as a popup list with two opposite values, such as Yes and
No.
Group
permissions
Active when mode is Required or Optional. Permissions defines which groups can
enter a value in this field.
•
All gives permission to all groups.
Silk Central 15.5
| 267
Property
Description
•
Selected restricts permission to the groups you choose from the list box. When the
field is required or optional and permission is restricted to selected groups, the field
is read-only for all remaining groups.
Custom Tabs and Fields
Issue Manager permits you to define up to ten user-defined fields on Custom Tab 1 and up to ten userdefined fields on Custom Tab 2.
Custom Tab 1
Custom Tab 1 on the Issue Details page contains three fields by default. You can add fields to this tab,
edit the default fields, or delete the fields and start from scratch.
The following table describes the default fields on Custom Tab 1:
Field
Specifies
Mode
Control Type/Value
Automated?
Whether the issue is
automated in regression
tests or manual.
Optional
Check box. Default is
unchecked.
Add Rel Note?
Whether an item on this
issue needs to be added to
the release notes of the
product.
Optional
Check box. Default is
unchecked.
Update Doc?
Whether the documentation Optional
that is related to this issue
needs to be updated.
Check box. Default is
unchecked.
Custom Tab 2
Custom Tab 2 is empty.
Custom Fields
Custom fields can appear in the following two places:
•
•
On the custom tabs of the Issue Details page.
On the action dialog boxes, which open when a user takes an action on an issue.
Creating Custom Tabs
Note: You need the GUI customization privilege to perform the actions described in this topic.
To define a custom tab, you must first plan the fields that you want to appear on the tab. Determine what
information would be useful to collect. Think about the best field type to use for each field-text field, popup
list, or check box. What is the field mode-required or optional? Then complete the following steps:
1. In the menu, click Issues > Configuration.
2. Click Custom Issue Tabs. The Custom Issue Tabs page opens.
3. Click Custom Tab 1 or Custom Tab 2. The Edit Label dialog box opens.
4. Edit the label of the tab as required.
5. Click OK to save the new label.
268
| Silk Central 15.5
Defining Custom Fields
Note: You need the GUI customization privilege to perform the actions described in this topic.
You can edit the field label, mode, group permissions, and reuse of the previous value. To change a field's
control type, you must delete it and then re-create it using the new control type.
To configure a custom field:
1. In the menu, click Issues > Configuration.
2. Click Custom Field Pool. The Custom Field Pool page opens.
3. Click Add Custom Field.
4. Proceed as described in GUI Customization Properties.
Editing Custom Fields
Note: You need the GUI customization privilege to perform the actions described in this topic.
To edit a custom field:
1. In the menu, click Issues > Configuration.
2. Click Custom Field Pool. The Custom Field Pool page opens.
3. Click on the Field Label of the field that you want to edit.
4. Proceed as described in GUI Customization Properties.
Deleting Custom Fields
Note: You need the GUI customization privilege to perform the actions described in this topic.
To delete a custom field:
1. In the menu, click Issues > Configuration.
2. Click Custom Field Pool. The Custom Field Pool page opens.
3. In the Actions column of the field that you want to delete, click
. A confirmation dialog box opens.
4. Click Yes to complete the deletion.
Customizing Workflow
The topics in this section explain the key concepts relating to workflows in Issue Manager. It also presents
the three default workflows and describes how they can be edited.
Action-Driven Workflow
Issue Manager manages an issue through its entire life cycle through an action-driven workflow. Actiondriven workflow means that an issue is driven from one state (condition) to another by user actions until the
issue reaches a terminal, or ending state.
Note: A workflow must have at least one terminal state, which is the last state in the workflow.
Example
In the default workflow, a new bug reported by customer support is considered to be in an Unreviewed
state, a condition that means that no one has confirmed that the "issue" is truly a bug. Assessing the
situation, a QA engineer confirms that the issue is a bug and is ready to send it on to a developer to be
fixed. In this example, think of the initial state as Unreviewed, the action to be taken as Confirm, and the
next state as Dev-Ready.
Silk Central 15.5
| 269
If, on the other hand, an identical issue has already been entered, then the action to be taken upon this
unreviewed issue is Mark as Duplicate and the next state will probably be Closed. Therefore a different
action upon this unreviewed issue sends the issue to a different state, in this case, Closed.
Occasionally, issues retain their current state even after an action has been taken on them. This is true, for
example, for Add Comment, which allows a user to add a comment to the description of an existing issue.
System-supplied actions
Issue Manager has two predefined actions for each state in each workflow:
Reassign
Allows users to route an issue to another inbox.
Edit
Allows users to modify fields on the Issue Details page.
These actions do not change an issue's current state, because they do not move the issue through the
workflow.
Action Information
A workflow defines a valid set of actions that can be performed on a state. These actions can be viewed on
the Workflows page. The available actions vary based on the Issue Type and Current State selected from
the lists.
Actions are available on the Issue Details page in the form of buttons. The available buttons (actions) vary
based on an issue's type and current state.
State Information
State information appears throughout Issue Manager. For example, each group and user account is
assigned three initial issue states, one for each issue type: bug, enhancement, and documentation issue.
Initial issue state affects issue life cycle
The initial state of an issue depends on how knowledgeable the user reporting the issue is with respect to
this type of the issue. For example, when a member of the Technical Support group reports a
documentation issue, it is assumed to be correctly assessed and ready for fixing, and is assigned an initial
state of Open-Doc. However, when the same person submits a software bug, it is not necessarily assumed
to be accurate, so its first state in the workflow is Unreviewed. Different groups can have different initial
states for the same type of issue. For more information on initial issue states, see "Initial Issue State".
When a user saves an issue, Issue Manager automatically assigns the issue an initial state based on the
initial issue state assigned to the user. When a technical writer logs a documentation issue the value of the
State field on the Issue Details page is Open-Doc. The State field is an automatic field, meaning that Issue
Manager, not the user, fills it in based on the workflow and other information.
State Owner
Each non-terminal state in a workflow has exactly one owner. The owner is the role in an organization that
is responsible for acting on an issue in a given state. Consider an unreviewed bug: the user who confirms
or denies an unreviewed software issue is most likely to be someone who performs the QA role. Therefore,
the state owner of an unreviewed bug is the QA role.
A terminal state in a workflow does not have an owner because an issue in this state does not need
someone to be responsible for taking an action on it.
In Issue Manager you choose one of four possible owners for a non-terminal state:
•
•
•
270
| Silk Central 15.5
QA
Development
Documentation
•
Enhancements
Note: A state owner is not a specific QA engineer or a specific inbox; nor is it related to a specific
product, component, release, or platform. A state owner is a general designation of functional
responsibility with respect to a state.
The owner is an important property of a state because the state owner and the routing rules together
determine the specific inbox that will receive the issue (routing rules are described in Setting Up Routing
Rules). Here is an example of how Issue Manager uses routing rules, states, and state owners to move an
issue to a specific inbox.
Say that you decide that the owner of the Unreviewed state of all software bugs, regardless of specific
product, component, and so on, should be the QA role. Individuals who fulfill this role will confirm that a
reported issue is actually a bug. So, on the State Properties dialog for the Unreviewed state, you select the
QA Owns This State radio button. To access this State Properties dialog, go to Issues > Configuration >
Workflows, and then click Edit State.
Now consider routing rules for specific products. When you set up routing rules (Issues > Configuration >
Routing Rules), you specify four specific inboxes for each combination of product, component, release,
and platform. Each of the four state owner radio buttons corresponds to one of the four inboxes on the
Routing Rules page: QA, Development, Enhancement, and Documentation.
Example
A routing rule states that when a bug pertains to the Email component in any release of Product C on any
platform, then route the bug to one of these inboxes: Mike - QA, Sonja - Dev, Dan - Dev (Product C), or
Judy - Doc.
One of the four inboxes is selected based on two factors: the current state of the issue and the owner of
that state. Assuming that the current state of the bug is Unreviewed and that you specified that the QA role
owns unreviewed issues, then the issue will be automatically routed to Mike's inbox, Mike - QA.
When Mike acts on the issue, he will, in effect, move it along its life cycle to another state, which has
another owner. Issue Manager will again determine the appropriate inbox based on the issue's current
state, the owner of the state, and the applicable routing rule for the specific product, component, release,
and platform.
Reason Codes
Issue Manager reason codes are optional, customizable keywords that describe why an issue has changed
its state when a given action is taken.
A number of actions can cause an issue to move to the same state. For example, an issue can be closed
for a variety of reasons: it's not reproducible, it's a duplicate, it's not a bug. Without the extra information
supplied by the reason code, users will have an incomplete picture of an issue's life cycle.
Reason codes can also help you minimize the number of states in your workflow. For example, instead of
defining several terminal states- Not a Bug, Not Reproducible, Duplicate, it is sufficient to have one
terminal state called Closed with a variety of reason codes that indicate why an action closed an issue with,
for example, Closed/Not a Bug.
The user sees reason codes on the Issue Details page and the action dialogs. For example, Judy, a
technical writer, receives a documentation issue in her inbox. Reading the description, she recalls that the
issue has already been reported. She marks the issue as a duplicate. When the Mark as Duplicate dialog
box opens, she can see that the issue has moved from Open-Doc to Closed/Duplicate. Closed is the new
state and Duplicate is the reason code.
Assigning, clearing, or retaining a reason code
When certain actions are taken, Issue Manager assigns a reason code to the action and passes it on to the
new state. Subsequent actions might clear the reason code or simply retain the reason code. In general,
once you set a reason code, it travels with the issue until it reaches the terminal state in the workflow.
Silk Central 15.5
| 271
Consider the case of a developer who fixes a bug and then takes the Fixed action to claim that the bug has
been fixed. This action moves the bug from Dev-Ready to QA-Ready, and sets the reason code to Fixed.
The QA engineer who is verifying the developer's claim accepts the bug fix by taking the Verified action.
This action retains the Fixed reason code and moves the bug along to the Closed state.
However, you might want to clear the reason code, for example, when an issue returns to an earlier state
in the workflow, instead of progressing toward a terminal state. Say that a QA engineer disputes a
developer's claim and takes the Reject action, which sends the issue back to the Dev-Ready state. The
Fixed reason code no longer makes sense, so you might want to clear the reason code for the Reject
action.
Whether reason codes are assigned, cleared, or retained is determined by the setting in the New Action
for State dialog, which is described in Reason code. Click Issues > Configuration > Workflows and click
Add Action to view the New Action for State dialog box
Default Workflows
Issue Manager provides three default workflows—for bugs, documentation issues, and enhancements. If
you want to modify the default workflows or create your own workflows, see Developing Your Own
Workflows.
Default Bug Workflow
The following diagram contains the default Bug Workflow:
The Edit, Reassign, Add Comment, and Add Workaround actions have been omitted from this diagram.
•
•
•
Edit and Reassign are predefined for each state and cannot be modified. These actions do not change
an issue’s state.
Add Comment, which is defined for all states, does not change an issue’s state.
Add Workaround, which is defined for Dev-Ready, QA-Ready, QA-Redo, and Closed, does not change
an issue’s state.
Default reason codes in the bug workflow
To see all the reason codes supplied in the default bug workflow, click Issues > Configuration >
Workflows. Select BUG as the issue type and view its valid actions and reason codes.
272
| Silk Central 15.5
Examples
Consider a common path through the default bug workflow. A bug is reported, enters the Unreviewed state,
and is sent to a QA engineer’s inbox. The bug is confirmed and sent to a developer’s inbox (Dev-Ready
state). The developer claims to fix the bug and takes the Fixed action. The Fixed action sends the bug to
QA-Ready with the reason code Fixed. The QA engineer who receives the issue verifies that the bug has
been fixed. In other words, he takes the Verify action, which sends the bug to the Closed state, retaining
the Fixed reason code.
Now consider a small change in the preceding example. Say that the QA engineer rejects the developer’s
claim that the bug has been fixed. The bug returns to the developer’s inbox, but this time the reason code
is Rejected. The developer is unable to reproduce the problem and so takes the Need More Info action.
The bug goes to QA-Redo. The QA engineer can take one of two actions to close the issue at this point—
Mark as Duplicate or No Longer an Issue, or the QA engineer can clarify the problem and send the bug
back to Dev-Ready.
Default Enhancement Workflow
The following describes the enhancement workflow.
The Edit, Reassign, Add Comment, and Add Workaround actions have been omitted from this diagram.
•
•
•
Edit and Reassign are predefined for each state and cannot be modified. These actions do not change
an issue’s state.
Add Comment, which is defined for all states in this workflow, does not change an issue’s state.
Add Workaround, defined for all states except Unreviewed, does not affect the state.
Default reason codes for the enhancement workflow
To see all the reason codes supplied in the default enhancement workflow, click Issues > Configuration >
Workflows. Select ENHANCEMENT as the issue type and view its valid actions and reason codes.
Example
Consider that a request for an enhancement is accepted and sent to Development (Dev-Ready) by either
an initial set of reviewers (Unreviewed state) or by a management team (Mgmt-Call state). The
management team receives the enhancement request if the initial reviewers take the Maybe action.
If the initial reviewers or management team reject the enhancement request, the issue is closed with a
reason state of Rejected. This Reject action is different from a Reject action taken on an issue in the QA-
Silk Central 15.5
| 273
Ready state. In that case, the development action (Implemented, Cannot Do, Already Done, or Mark as
Duplicate) is being disputed.
Default Documentation Workflow
The following diagram contains the default Documentation Workflow:
The Edit, Reassign, and Add Comment actions have been omitted from this diagram.
•
•
Edit and Reassign are predefined for each state and cannot be modified. These actions do not change
an issue’s state.
Add Comment, which is defined for all states in this workflow except QA-Ready, does not change an
issue’s state.
Default reason codes in the documentation workflow
To see all the reason codes supplied in the default documentation workflow, click Issues > Configuration
> Workflows. Select DOC-ISSUE as the issue type and view its valid actions and reason codes.
Example
Assume that a documentation issue enters in the Unreviewed state. At that point there are three possible
actions that the reviewer can take. He can accept the issue, reject the issue, or mark it as a duplicate of
another issue. If the issue is rejected or found to be a duplicate, then it will be closed, with a reason code of
Rejected or Duplicate. If the reviewer considers the issue a documentation issue that needs to be fixed,
then the issue will be moved to the Open-Doc state and to a documentation inbox. The documentation
specialist can take one of two actions at this point: either take the Fixed action or the Mark as Duplicate
action.
•
•
The Fixed action sends the issue to the QA-Ready state with a reason code of Fixed.
The Mark as Duplicate action sends the issue to a Closed state with a reason code of Duplicate.
If the fix is later verified, then the issue will be moved to the Closed state with a reason code of Resolved.
If, on the other hand, the fix is rejected, then the issue will be returned to a documentation inbox with a
reason code of Rejected.
274
| Silk Central 15.5
Developing Your Own Workflows
If you want to develop your own workflow, the easiest and most reliable approach is to make simple
modifications to the default workflows (for example, edit a state name). It is strongly recommended that you
modify the default workflows rather than create a new workflow from scratch, especially if you have little or
no experience with these concepts.
Some of the things that you can customize include:
•
•
•
•
•
The number and name of the states that an issue passes through.
Which actions are valid on a particular state. These actions appear on the Workflows window.
Which states result from each action on the current state; that is:
Current State ---- Action 1 ---> New State 1
Current State ---- Action 2 ---> New State 2
Which groups have permission to perform each action.
The appearance of the action dialogs that are displayed when users take action on issues.
Prerequisite
Familiarize yourself with the concepts of state diagrams and actions, also called state transitions.
Drawing a State Diagram
Draw a state diagram on a whiteboard or paper. Make sure to draw each state in a box with plenty of
space between each state.
Draw each legal action between states as a line with a single arrow head. Each direction is a distinct
action.
Example
The following example is a small sample of the states you might have in your own workflow. When a new
bug is entered, someone in your organization dispatches the bug to the appropriate QA engineer for
review. If the QA engineer agrees that the reported behavior is a new bug, then it is sent to Development to
be fixed. Development can take a number of possible actions on the bug.
•
•
•
•
The behavior described in the bug report is designed behavior, so the issue is not a bug.
The bug should be deferred until the next release.
The bug cannot be reproduced.
The bug is fixed.
Of course, these are only the developer’s claims and have yet been verified. Your workflow model might
reflect these claims with the following states: Fixed?, Deferred?, Not Repro?, and Not-a-Bug? The question
marks imply that these claims have not yet been verified by a QA engineer.
Silk Central 15.5
| 275
Name Actions with Verbs
It is recommended that you assign a verb to each action. Think about times when a bug might return to an
earlier state in the workflow. Model these negative actions. For example, a QA engineer might reject a
developer’s claim, which returns an issue to Development.
You may also uncover missing positive actions while considering each way that an issue can travel. For
example, you realize that QA engineers also reject some issue reports, in effect closing the issues. In the
example diagram below, the Reject Bug action by a QA engineer leads to the Not-a-Bug state. Ensure that
all actions eventually lead to a terminal state.
Revised Example
276
| Silk Central 15.5
Optimizing the Workflow
As you can see, the preceding diagram is too complicated to be useful. To simplify the workflow you can
eliminate the Dispatch action because the routing rules in Issue Manager take care of distributing bugs to
the correct inboxes. In the preceding diagram you can delete the New-Bug state and the Dispatch action
and start the bug in a state where a QA engineer can review it. You might call this the Unreviewed state.
Another flaw in the workflow is the virtually repetitive states. Using Issue Manager’s methodology, you can
eliminate redundant states by assigning reason codes to actions. For each action that requires a reason
code, devise a brief, descriptive keyword. For a full explanation of reason codes, please read “Reason
codes”. To identify redundancies, look for repeated patterns in the workflow. For example, in the previous
diagram, the last row of states (Not-a-Bug, Deferred, Not-Repro, and Fixed) can be collapsed into the
single state of Closed with a different reason code for each action (for example, Closed/Not-a-Bug, Closed/
Fixed).
The next-to-last row can also be collapsed into a single state that recognizes QA’s role in verifying
Development’s claims. You might call this state QAReady. You can use reason codes here to explain why
a bug has changed states (for example, a bug arrives in the QA-Ready state with a reason code of Fixed
or Deferred). The four Rejected actions taken by QA can be collapsed into a single Rejected action.
Similarly, the four Verified actions taken by QA can be collapsed into a single Verified action.
Example
Add State Owners and Permissions
Issues are routed according to issue state and state owner. A state owner is a role in your organization that
is responsible for an issue in a given state. For example, in the default workflow, QA has responsibility for
issues in the Unreviewed state.
Now you must assign an owner to each state in your final diagram. Finally, decide which groups should
have permission to take each action. In the default workflow, for example, only users in Development are
allowed to fix issues (that means, take the Fixed action).
Prepare a Data Entry Sheet
Optionally, prepare a sheet to facilitate data entry into Issue Manager. The workflow information is entered
by state, so the first column should be current state and owner. Then add the following column headings:
Silk Central 15.5
| 277
•
•
•
•
Actions allowed on the current state.
New state resulting from each action.
Reason code (if applicable).
Permissions - The group(s) that are allowed to take each action.
Your data entry sheet should resemble the following:
State/Owner
Actions
New State
Permissions
Workflow State Customization
You can modify the names, owners, and descriptions of the states in the default workflows. You can enter
or modify all states at once and then add all actions for each state. Or you can enter one state and all its
actions before going on to the next state and its actions.
State Properties
States have the following properties:
State Name
Required, unique state name, up to 20 characters long. Special characters are not allowed.
Description Optional description of the state; no practical length limit.
State Owner Choose a state owner by selecting the appropriate option:
•
•
•
•
•
QA Owns This State
Development Owns This State
Documentation Owns This State
Enhancement State
No One (Terminal State)
Customizing Workflow States
You must have the Workflow customization security privilege to perform these tasks.
1. Click Issues > Configuration > Workflows. The Workflows page is displayed.
2. Select the Issue Type that represents the workflow you want to customize.
3. Proceed with tasks as outlined below:
Add a state to this workflow Click the Add State button. Proceed to step 4.
Edit a state in this workflow
Select the state you want to edit from the State list. Click the Edit
State button. Proceed to step 4.
Add actions for a state in
this workflow
See Customizing Actions, Reason Codes, and Action Dialogs. Begin
the procedure at step 3.
Delete a state in this
workflow
Select the state you want to delete from the State list. Click the
Delete button. Select Yes on the confirmation dialog. Issue Manager
will only delete states that have never been referenced by an issue.
Modify another workflow
Return to step 2.
4. Specify or modify the properties of the state, using the information described in State properties to
guide you.
278
| Silk Central 15.5
Customizing Actions, Reason Codes, and the Action Dialogs
Read this section only if you intend to modify the actions in the default workflows, which are described in
Understanding the Default Workflows. Before proceeding, please read Action Properties.
1. Click Issues > Configuration > Workflows.
2. Select the workflow you want to customize from the Issue Type list.
3. Select the state that has the actions you want to modify from the State list.
4. The Workflows page now illustrates the information you will enter in this procedure:
•
•
•
All the actions that apply to this state (as they appear in the ButtonLabel column).
The state that follows the current state when a given action is taken.
The reason code for each valid action (if applicable).
Note: The Edit and Reassign actions, which Issue Manager predefines for all states, cannot be
modified and are therefore not shown in the dialog.
5. Proceed with tasks as outlined below:
Add an action for the current
state
Click Add Action and proceed to step 6.
Edit an action for the current
state
Select the action you want to edit from the Button Label column.
Add a new state to this
workflow
Return to step 3 of How to Customize workflow states.
Change the sort order of an
action in this workflow
Click the Move Up and Move Down buttons (in the Actions
column) of the action you want to move up or down within the list.
Delete an action from another
workflow
Click the Delete button (in the Actions column) of the action you
want to delete. Then click Yes on the confirmation dialog.
Note: Issue Manager will delete only those actions that
have never been referenced by an issue.
Modify the actions in another
workflow
Return to step 2.
Modify the states in another
workflow
Return to step 2 of How to Customize workflow states.
6. Specify or modify the properties of an existing action on the New Action for State dialog box. Use the
information in Action Properties as a guide.
Action Properties
After you define the states in a workflow, you must define the actions that are associated with each state.
For example, for the Dev-Ready state in the default bug workflow, a developer can take the Fixed action,
the Cannot Fix action, and so on.
Each action has a set of properties associated with it.
General properties
The properties of an action are varied and cover the following areas:
•
•
•
•
Button label that appears on the Issue Details page.
Description of the action that appears on the History tab.
New state that results from this action.
Reason code.
Silk Central 15.5
| 279
•
•
•
Appearance and usage of the action dialog.
Groups permitted to take this action.
Sort order of this action.
Action of State dialog box
Action properties are set on the Edit Action of State dialog box. (Issues > Configuration > Workflows).
Current State Information
Name
Cannot be edited. Displays the name of the current state for which you are defining
or modifying an action (for example, Edit Action for State - Unreviewed).
Button label
This is the name that appears on the button that executes this action, located on the
Issue Details page, up to 30 characters long.
History Action
Code
Concise statement of the action that was taken, up to 20 characters long. It is
recommended that you use uppercase characters (for example, VERIFIED). This
code appears in the Actions column on the Issue Details page’s History tab.
Tooltip
Optional text that will appear as a tool tip when a user passes their cursor over this
action button.
Description
Optional description of this action.
New State List
280
Name
Name of the next state in the workflow when this action is taken on an issue. For example, in
the default workflow when an Unreviewed issue is confirmed as a bug, Issue Manager moves
the issue to the next state, Dev-Ready.
Reason
Code
Optional keyword that describes why an issue has changed from the current state to the new
state when this action is taken. Select the appropriate option:
| Silk Central 15.5
No
Change
No Change indicates that the keyword is retained when the issue moves to the
new state. It will appear in the Reason Code field of the Issue Details page. For
example, the following workflow shows that when a developer claims to have
fixed a bug, the bug moves to the QA-Ready state with a reason code of Fixed.
If a QA engineer verifies the claim, then the bug moves to the Closed state while
retaining the Fixed reason code. Any user browsing issues can easily see the
reason the bug has been closed by looking at the reason code.
Clear
Indicates that the reason code for the current state will be removed when the
issue moves to the new state. Clear is a reasonable choice when an issue
returns to a previous state in the workflow (for example, when a developer
claims to have fixed a bug, the bug moves to the QA-Ready state with a reason
code of Fixed). If, however, the “fix” is rejected, the issue is sent back to
Development (Dev- Ready) and the Fixed reason code is removed, since this
claim is disputed. When you choose Clear, the workflow displays CLEAR in the
Reason Code field; however, the user sees an empty Reason Code field on the
Issue Details page.
Set to
Indicates that you can associate a reason code with this action. Enter a keyword
of up to 20 characters. All capital letters is recommended. Use Set To to specify
a reason code when an action moves an issue to a new state that requires a
reason code. In general, you should assign reason codes to all actions that
developers take.
For example, in the default workflow the Fixed action on the Dev-Ready state
sends the issue to the QA-Ready state with a reason code of Fixed. What this
means in terms of human behavior is that when a developer claims that a bug
has been fixed, he hands it off to a QA engineer, who can now easily scan the
Issue Details page to see why the bug is in his or her inbox (the bug could also
be there because the developer can’t fix it or the software is working as
designed).
If you do not use reason codes
Reason codes are optional keywords that can help to minimize the number of states in your workflow. For
example, rather than defining several closing states (Not a Bug, Not Reproducible, Not Repro, and
Duplicate) one terminal state is sufficient where reason codes help explain why the issue is in the Closed
state. If you decide not to use reason codes, you may need to have several terminal states. A state can be
made a terminal state by selecting the radio button called No one (Terminal State), which appears as a
choice in the State Owner field of the State Properties dialog.
Standard Action Fields Tab
The Standard Action Fields tab on the New Action for State dialog defines the properties relating to the
use and appearance of the action dialog, specifically:
•
•
•
The Action Notes field on action dialogs.
Release Information on action dialogs.
Related Issue Number of a related issue on action dialogs.
Action
Notes
Not Used The Action dialog box will not display the Action Notes field when the user
takes this action.
Optional
The Action dialog box will display the Action Notes field. Users have the
option of entering extra information about the action they are taking.
Required The Action dialog box displays a required Action Notes field. Users must
enter extra information about the action in this field.
Release
Information
This group allows you to have a list appear on the action dialog from which users can
select the release in which this action is taken. The release selected by the user also
appears in one of the automatic fields on the Issue Details page. This information is
particularly useful for certain kinds of actions (for example, those related to confirming,
fixing, and verifying issues). It is not useful for actions that do not change the current state.
The Release Information field has one of four values:
Not Used
The action dialog will not display the list. The action dialog for the Add
Comment action does not have a list box for release information because
release information is not necessary for the Add Comment action.
If you choose Not Used, for example if the user doesn’t supply information
in an optional list box on the action dialog, or if an action hasn’t been taken
which uses the list, then the Issue Details page displays an empty Action
Release field.
Optional
or
Required
The action dialog will display an optional or required list from which the
user selects a release. The last automatic field on the Issue Details page
displays the release in which the action was taken. You need to specify the
list Label to make it appropriate for the action. The label can be up to 20
characters long, including a trailing colon. The default field label is
Confirmed In: for confirming actions; Fixed In: for fixing actions; and
Silk Central 15.5
| 281
Verified In: for verifying actions. The label appears on both the action
dialog and on the Issue Details page. The list’s values derive from the list
of releases specified in the Administration module.
Cleared
The previous value in the last automatic field of the Issue Details page will
be removed and the field label reverted to the default, Action Release.
The Label field in the Release Information group is disabled. Cleared is a
good choice when an action causes an issue to return to a previous state
in the workflow. Examples from the default workflow are the Reject and
Reopen Bug actions. For example, a developer takes a Fixed action and
fills in a specific release number in the Fixed In field. This action sends the
issue to the QA-Ready state. The QA engineer responsible for the issue
rejects the developer’s claim that the bug has been fixed. The Reject action
moves the issue from its current state, QA-Ready, back to a previous state
in the workflow, Dev-Ready.
When an action’s reason code is cleared, consider choosing Cleared as
the value for the Release Information field.
The release selected by the user on the action dialog will appear on the
Issue Details page. For example, say that a user takes the Fixed action,
selects 4.1:prod as the release from the Fixed In list box, and clicks OK.
When the Issue Details page reappears, the Fixed In field displays the
selected release.
Related
Issue
Number
Allows you to place a text field on the action dialog in which users can
enter the number of a duplicate or related issue. This information is useful
when users take the Mark as Duplicate action in the bug workflow or the
Already Done action in the enhancement workflow.
Not Used
Text field will not appear on the action dialog.
Optional
or
Required
An optional or required text field appears on the action
dialog. You need to specify the text field label. The label
can be up to 20 characters long, including a trailing colon.
The default field label in the bug workflow is Duplicate of
#. The default field label in the enhancement workflow is
See Also.
The issue number specified by the user on the action
dialog will appear in the Notes field of the Issue Details
page’s History tab. For example, say a user takes the
Mark as Duplicate action on Issue #8, specifies Issue #6
as the duplicate, and clicks OK. When the Issue Details
page reappears, the Notes field will display the phrase
Related to issue number n, where n is the value of
the Duplicate of # field. If the Duplicate of # field is
optional and the user does not fill it in, then the Notes
field will display the contents of the Action Notes field.
User-Defined Action Fields Tab
The User-defined Action Fields tab of the New Action for State dialog allows you to add fields to the
action dialog of a given action.
Eight field
positions
282
| Silk Central 15.5
These fields appear on the action dialog in addition to the standard action fields. Field 1
- Field 4 appear in the bottom left of the action dialog. Field 5 - Field 8 appear in the
bottom right. For example, the Hours to Fix field might be selected from the list to
appear in the first field position (Field 1) on the action dialog for the Fixed action in the
Dev-Ready state.
Read-only
once
referenced
Once a field has been referenced by an issue, it becomes read-only on the Userdefined Action Fields tab. To see the information entered in the action dialog, you
need to view the issue entry on the Issue Detail page’s History tab.
Sources
The fields that appear in the list boxes on the User-defined Action Fields tab are there
for one of two reasons:
•
•
Defining
Fields on an
action dialog
1.
2.
3.
4.
You may define new fields, as described in the procedure below. These fields are
always optional. The mode cannot be changed.
You may select the fields displayed on the custom tabs of the Issue Details page.
For example, the action dialog might contain the Hours to Fix field. You might want
this information to appear as well on a custom tab. Fields already defined for the
custom tabs automatically appear in the list boxes of the User-defined Action Fields
tab.
Click Issues > Configuration > Custom Field Pool.
Click Add Custom Field button to display the Edit Field Properties dialog box.
Configure the field properties as explained in GUI Customization Properties.
The custom fields you create can then be selected from the list boxes on the Userdefined Actions Field tab.
Permissions Tab
On the Permissions tab you can set security for individual actions, thus restricting actions to selected
groups of users.
By default, Apply Security has a value of No (that means, all groups have permission to take all actions).
This setting appears on the Workflows page as (all groups). You set security by selecting the Yes option
and then selecting one or more groups to have permission to take the action.
Consider this example of defining security for an action: When a developer opens an Issue Details page
for a bug in the Dev-Ready state, the Cannot Fix action is available. However when a user who is not a
developer opens the Issue Details page for the same bug, the action is hidden.
Intelligent Assistant
To process test results, the Intelligent Assistant uses a default set of four state/reason code pairs that
correspond to the four general states defined by the default workflow for bugs.
To view these default states and reason codes:
1. Click Configuration > Intelligent Assistant.
2. Customize mapping between general bug states and specific Issue Manager codes.
If the default workflow for issues has been customized, the states and reason codes used for results
processing must be customized too. For example, if the administrator changes the default workflow so
that issues claimed to be fixed are assigned a state of Unreviewed, he must also change the state entry
for Bugs Claimed to Be Fixed But Not Tested Yet from QA-Ready to Unreviewed.
In addition to the issue states and reason codes specified on the Intelligent Assistant page, Intelligent
Assistant also uses the terminal states defined for the issue workflow. Terminal states are defined on
the Workflows page. The default terminal state is Closed.
Issue Archival
After using Issue Manager for a while, you may find that you have issues in the database that are no longer
relevant to your efforts (for example, issues that are closed or pertain to unsupported products). The more
Silk Central 15.5
| 283
issues in the database, the longer actions (such as queries) take to execute. To help you improve
performance, you can archive issues. You can then run actions against the smaller number of active (not
archived) issues.
When you archive issues, Issue Manager moves the issues from the DEFECT and related tables to the
ARCHIVE and related tables. All issue information is preserved. (By comparison, active issues remain in
the DEFECT table, and users can take the usual actions on them.)
Users may view archived issues on the Issue Details page but they cannot take actions on them because
they are read-only. Archived issues do not appear in users’ inboxes. However, users may still run queries,
reports, and graphs against archived issues. Archiving “hides” issues in a database, but it does not delete
them.
Note: It is strongly recommended that you not delete issues manually, as this may destroy the
integrity of your data.
You may however, want to make your production database smaller by creating a new custom database
that imports only the active issues and related information from the original database.
If you archive an issue that is being displayed (but not edited) on a user’s desktop, the user won’t know
about the change until they log out and log back in again, exits and restarts, or tries to take an action on
the issue.
Note: Issue Manager warns users that they cannot take action on archived issues.
Archiving Issues
To archive issues:
1. In the menu, click Issues > Configuration > Archive.
2. Select the product that relates to the issues you wish to archive.
3. The Release field is automatically populated with the releases related to the selected product. Select
the specific release that relates to the issues you wish to archive.
You can archive issues relating to multiple releases by selecting multiple releases. Use Ctrl+Click to
select individual releases, or Shift+Click to select a range of releases.
4. Click the Archive button.
5. Click Yes on the confirmation dialog to initiate the archiving process.
Setting Up Email Notification Rules
With email notification, you can instruct Issue Manager to notify you or others in your organization
automatically when events of interest occur, such as when an issue changes status.
Email notification rules
Users can have email sent to them whenever the following events occur:
•
•
•
•
An issue is reassigned to another inbox.
An issue moves from one workflow state to another (for example, from Unreviewed to Dev-Ready.
Any change is made to an issue that generates a new entry in the issue's history (for example, the
component against which the issue is reported has changed).
Any other special event that you define (for example, Technical Support wants to receive email when a
particular bug is fixed).
The events listed above are referred to as rules. The first three rules are predefined and cannot be
modified. You may define as many additional rules for special events as you want.
284
| Silk Central 15.5
Triggers
An email trigger instructs Issue Manager to send email whenever a certain event occurs to an issue. A
trigger consists of an email notification rule that specifies an event, the sender and recipients of the email,
the message body, and an optional subject line, introduction, and trailer.
Users must apply a trigger to each issue they are interested in. Only users with the Email notification
issue triggers privilege can add triggers to individual issues.
To view an issue's triggers, look at the Notifications tab of the issue's Issue Details page.
Rules can also be used in triggers that apply to all issues in the database; these are systemwide triggers.
Only users with the Email notification rules and systemwide triggers security privilege can add
systemwide triggers.
Defining Email Notification Rules
Prerequisites
To define your own rules, you must:
•
•
•
•
Have the Email notification rules and systemwide triggers privilege.
Be familiar with SQL, specifically how to compose a WHERE clause.
Be familiar with the database schema, in particular, the columns of the issue-related tables,
IM_Defect and IM_DefectHistory.
Be familiar with your workflow and the values in the workflow.
Tips for writing SQL WHERE clauses
Here are some important tips that will help you write syntactically and semantically correct WHERE
clauses.
Reference both
IM_Defect and
IM_DefectHistory
Your SQL WHERE clauses will probably require references to both the
IM_Defect and IM_DefectHistory tables. The IM_Defect table stores
information that is current for an issue, whereas the IM_DefectHistory table
keeps a record of all actions that have been taken on an issue, along with the
effects of those changes on some issue fields.
For example, IM_DefectHistory stores an issue's inbox assignment before an
action is taken as well as the inbox assignment after the action. These columns
are AssignedIN for the inbox assignment prior to the action and AssignedOUT
for the new inbox.
All actions taken on issues are recorded in the ActionCode field of the
IM_DefectHistory table. These actions appear as action codes in the Action
column of the History tab. You may have noticed such codes as FIXED and
VERIFIED in the sample database.
To see the action codes for most of the actions in your database, look at the Edit
Action of State dialog box of each state (exceptions are ENTERED,
REASSIGNED, and MODIFIED, which are hard-coded and cannot be viewed). To
access the Edit Action of State dialog box for a state, go to Issues >
Configuration > Workflows, click the name of a state in the Button Label
column. Look at the value in the History Action Code field.
Use table aliases
The tables have been aliased. You must use the alias D to refer to the
IM_Defect table and the alias DH to refer to the IM_DefectHistory.
Silk Central 15.5
| 285
Identifying custom
fields
Custom fields are identified in the IM_Defect table as Custom1, Custom2, and
so on, depending on their position on the tabs. Each custom tab has up to 10
fields, 1-10 and 11-20. On Custom Tab 1, the first five fields appear in
descending order in the left column; field 6 through field 10 appear in descending
order in the right column.
To find out the schema name of a particular custom field, go to Issues >
Configuration > Custom Issue Tabs. For example, in the dialog for the sample
database, the Add Rel Note? check box is the fourth field in the left column of
Custom Tab 1 and so is Custom4 in the issue table.
Note: If you change the position of a custom field, then you will need to
update any email notification rules that refer to the field.
Changes to custom
fields are not
tracked
Issue Manager does not track changes to the custom fields in the
IM_DefectHistory table. You can check the current value of a custom field,
but you cannot refer to a previous value. For example, the WHERE clause can
test whether or not the Add Rel Note? check box be selected, but it cannot
capture a change in the value of the check box, from unchecked to checked.
Accessing check
box values
The value of an unselected check box is '.' (a period). The value of a selected
check box is 'X' (capital X).
For example, to retrieve all issues where Add Rel Note? is checked, you would
specify as part of the WHERE clause:
D.Custom4 = 'X'
Examples of rules
Here are four situations in which you might want to create a new rule. The first two situations suggest rules
used in triggers on individual issues. The last two situations suggest rules used in systemwide triggers.
Following each example is the WHERE clause written against the sample database.
Example
1
Technical support and other groups want to know when a particular bug fix has been verified
as fixed.
The WHERE clause looks like this:
DH.ActionCode = 'VERIFIED'
The value of ActionCode in the IM_DefectHistory table is updated whenever a user
takes an action; therefore, Technical Support will receive mail only once, when the Verify
action causes the action code VERIFIED to be entered in the IM_DefectHistory table and
the History tab.
If the clause were written instead by referring to the Reason Code (known as Disposition
in the database):
D.Disposition = 'FIXED'
then Technical Support would almost certainly receive mail more than once, because the
Reason Code remains FIXED in the database. A user who subsequently adds a comment or
saves the issue would trigger email because the rule would still match.
Example
2
286
| Silk Central 15.5
An average user, one who does not act on bugs, would like to know what has happened to a
bug that he entered. In particular he wants to receive email when the bug has received a
developer's attention. In workflow terms, this means the issue has just left the Dev-Ready
state, and consequently, the WHERE clause must test for state change after the action.
The WHERE clause is:
DH.StatusIN = 'Dev-Ready'
AND DH.StatusOUT <> 'Dev-Ready'
The state was Dev-Ready before the action, but after the developer's action, the bug moved
to another state.
Example
3
The documentation department has all doc-issues sent to a group inbox, Doc (Product A),
rather than a user's inbox, Judy -- Doc. The documentation manager wants to receive email
when an issue enters the group inbox.
This WHERE clause is:
DH.AssignedIN <> 'Doc (Product A)'
AND DH.AssignedOUT = 'Doc (Product A)'
It specifies that email should be sent when the inbox before the action was not Doc (Product
A) but after the action is Doc (Product A). The email will be sent only once, when the docissue is routed to Doc (Product A).
Note that without the first part of the WHERE clause, the documentation manager would
receive email when any action was taken on the doc-issue while it was assigned to Doc
(Product A). Although the rule is likely to generate a large volume of mail, since the trigger
needs to be applied systemwide, the two lines together of the WHERE clause restrict the rule
to single event: when the inbox becomes Doc (Product A).
The rule does not need to specify the issue type to be DOC-ISSUE, although it would not be
incorrect, since Doc (Product A) only holds documentation-related issues.
Example
4
The release manager wants to receive email during the next month prior to a major release
regarding the most severe bugs that cannot be fixed. The WHERE clause must test for
severity, Product B, and the Cannot-Fix action code assigned when a developer takes the
Cannot Fix action.
The WHERE clause is:
D.Severity = '1: Fatal/Data Loss'
AND DH.ActionCode = 'Cannot-Fix'
AND D.ProductCode = 'Product B'
These restrictions are necessary because if the WHERE clause merely tests for severity, then
the rule will match anytime the issue is changed and saved, because the severity will not
change until a user explicitly changes it.
The release manager might receive a great deal of mail, especially if this rule is applied in a
systemwide trigger. However, he can easily delete the trigger after the release cycle is over.
Tips for writing WHERE clauses
Work from the general to the specific. First, consider the general business situations that might require
email notification rules. You might ask all Issue Manager users when they would like to receive email about
issues. Find out precisely what information each user wants to glean from the email. For example, a user
might tell you that he wants to know when a bug is fixed. Upon further discussion you might find that what
he really wants to know is when the fix is verified by a QA engineer. This subtle change might require a
different WHERE clause.
Then, when you're satisfied that you understand what users want, translate the situation in terms of your
organization's workflow.
Finally, write the SQL WHERE clause. Try testing the WHERE clause through an advanced query to make
sure you are specifying the conditions exactly as intended.
Silk Central 15.5
| 287
Generally speaking, rules intended for triggers on individual issues should be written simply and
generically, whereas rules for systemwide triggers should be as precise and as restrictive as possible to
avoid excessive email.
Ask yourself how often users want to have email triggered-only once or each time a change is generated. If
a user wants mail only once, then make the rules more restrictive.
Managing Email Notification Rules
You need the Email notification rules and systemwide triggers security privilege to add,
edit, or delete email notification rules.
To add, edit, or delete an email notification rule:
1. Click Issues > Configuration > Notification Rules.
2. Based on the task you wish to perform, proceed as outlined below:
Add a Rule
Click the Add Rule button. The New Notification Rule dialog is
displayed. Proceed with step 3.
Edit a Predefined Rule
Predefined rules cannot be edited.
Delete a Predefined Rule
Predefined rules cannot be deleted.
Edit a Rule you have created Click the Edit icon (in the Actions column) of the rule you wish to
edit. Proceed as explained in step 3.
Delete a Rule you have
created
Click the Delete icon (in the Actions column) of the rule you wish to
delete. Click OK on the confirmation dialog to execute the deletion.
3. Specify or modify the following properties on the New Notification Rule dialog box:
Rule Name
Required unique name, up to 30 characters. Make the name as descriptive as
possible, as users assign rules by name.
Description
Optional description of the triggering event, up to 250 characters.
WHERE clause Required SQL WHERE clause that specifies the triggering event, up to 250
characters. Do not type the WHERE keyword.
4. Click OK to save your settings, or click Cancel to exit without saving.
Once you have defined rules, make sure that you:
Specify email addresses for To make use of email notification, a user must have a valid email address
specified in his or her user account.
all users
Have your database
administrator enable email
notification
Once the feature is enabled, the Notifications tab appears on the Issue
Details page.
Educate your users
Inform your users as to the rules that are available, and what each rule
accomplishes. Users can view the rules by selecting Issues >
Configuration > Notification Rules.
Deleting an Inbox
You can delete an inbox only if it does not contain any issues, is not referenced in routing rules, and is not
the default inbox of a user. Before you try to delete an inbox, edit the routing rules to prevent new issues
from being routed to the inbox, and then reassign the existing issues in the inbox.
Note: You need the Groups, inboxes and user accounts security privilege to add, edit, or delete
inboxes.
To delete an inbox:
288
| Silk Central 15.5
1. In the menu, click Issues > Configuration.
2. Click Inboxes. The Inboxes page opens.
3. In the Actions column of the inbox that you want to delete, click
. A confirmation dialog box opens.
4. Click Yes to remove the inbox from the system.
Managing System-wide Triggers
The following sections describe how to manage system-wide triggers.
Note: You need the Email notification rules and systemwide triggers security
privilege to add, edit, or delete system-wide triggers.
Adding System-Wide Triggers
1. Click Issues > Configuration > Systemwide Triggers. All existing systemwide triggers are listed here.
2. Click Add Systemwide Trigger.
3. On the New Notification dialog box, select a rule name from the list.
4. Select a radio button in the From area of the dialog box to indicate whether the return address should
be:
•
•
The user who edits the issue (thereby setting off the trigger).
Other user (Select a user from the list).
5. Type the email addresses of the recipient(s) in the To field, separating multiple entries with commas.
You may select users from the Add Address list .
Note: Although you can enter any email address in the To field, only users who have email
addresses specified in their user accounts will appear in the Add Address list. For this reason it is
recommended that email addresses be defined for all user accounts (configured via the
Administration module).
6. You can fill in the optional message text fields:
•
•
Subject is an optional subject line (up to 80 characters).
Introduction is optional introductory text (up to 250 characters)
7. Choose the content type of the message:
•
Contents can be:
•
• Issue Summary: The information on the top half of the Issue Details page.
• Issue Summary with Description: Issue summary plus the information from the Description tab.
• Full Issue Detail: All issue information (this is the default).
Trailer is an optional signature field (up to 250 characters long).
8. Click OK to save the trigger and close the dialog.
Editing System-Wide Triggers
1. Click Issues > Configuration > Systemwide Triggers. All existing systemwide triggers are listed here.
2. Click the Edit icon in the Actions column of the trigger you want to edit.
3. On the New Notification dialog box, select a rule name from the list.
4. Select a radio button in the From area of the dialog box to indicate whether the return address should
be:
•
•
The user who edits the issue (thereby setting off the trigger).
Other user (Select a user from the list).
5. Type the email addresses of the recipient(s) in the To field, separating multiple entries with commas.
You may select users from the Add Address list .
Silk Central 15.5
| 289
Note: Although you can enter any email address in the To field, only users who have email
addresses specified in their user accounts will appear in the Add Address list. For this reason it is
recommended that email addresses be defined for all user accounts (configured via the
Administration module).
6. You can fill in the optional message text fields:
•
•
Subject is an optional subject line (up to 80 characters).
Introduction is optional introductory text (up to 250 characters)
7. Choose the content type of the message:
•
Contents can be:
•
• Issue Summary: The information on the top half of the Issue Details page.
• Issue Summary with Description: Issue summary plus the information from the Description tab.
• Full Issue Detail: All issue information (this is the default).
Trailer is an optional signature field (up to 250 characters long).
8. Click OK to save the trigger and close the dialog.
Deleting System-Wide Triggers
1. Click Issues > Configuration > Systemwide Triggers. All existing systemwide triggers are listed here.
2. Click the Delete icon in the Actions column of the trigger you wish to delete.
3. Click Yes on the confirmation dialog box to execute the deletion.
Entering Parameters in Trigger Subject
You can enter parameters in the subject field of a notification trigger to generate a dynamic subject for
email notifications.
The following parameters can be entered in the subject field:
{ID}
Returns the defect number
{PROD}
Returns the product
{PROJ}
Returns the project name
{USER}
Returns the user who modified the issue
{RULE}
Returns the name of the rule that triggered the notification
{SYN}
Returns the synopsis
{STATE}
Returns the current state of the issue
{SEV}
Returns the severity
{REASON}
Returns the current reason code of the issue
{CUSTOM1-20} Returns the custom field of the specified number, e.g., {CUSTOM3} returns the value
stored in custom field 3.
For example, if you want to create an email notification trigger that informs you whenever the state of an
issue changes, you could add the following text into the subject field:
State of issue {ID} was changed by {user}.
If Bill would fix the currently open issue no. 2, you would receive an email notification with the following
subject:
State of issue 2 was changed by bpetersson.
290
| Silk Central 15.5
Enabling Basic Email Notification
A basic notification setting that can be activated by any user, regardless of assigned permissions, allows
users to receive a notification when another user makes a change to an issue in their inbox or assigns a
new issue to them.
Note: The subject line and content of these notifications can be configured in the file
SRFrontendBootConf.xml.
1. Click Configuration > Preferences.
2. Select the Notify me when users assign issues to me or make changes to issues in my inbox
checkbox.
Displaying System-Wide Triggers
When a user selects the Show systemwide triggers on each issue’s Notifications tab checkbox (Issue
Manager > Configuration > Preferences), all system-wide triggers are listed on each issue’s Notification
tab. Any triggers that are assigned to the active issue are also listed.
1. Click Configuration > Preferences.
2. Select the Show systemwide triggers on each issue’s Notifications tab checkbox.
Reports
The Reporting Data Mart
Silk Central offers a data mart for easy access to the most important data. This makes the creation of
reports easier and improves the performance due to much simpler SQL queries.
Overview
The Silk Central reporting data mart makes it easy to access data for reporting purposes. It moves data
from the production tables into dedicated views which should be used for creating advanced reports. The
advantages include:
•
•
•
•
Clear naming of tables and views, allowing you to quickly locate the data you are looking for.
Pre-processed data, giving you the possibility to access aggregated data without having to calculate it
yourself.
Performance improvement, as reports can use much simpler and faster SQL queries.
Less dependency on production database load, which also improves performance and removes load
spikes.
The current version of the data mart covers the results area. Further areas for reporting will be added to
the data mart in future releases. The following tables and views are currently available:
•
•
•
•
•
•
•
The DM_TestStatus table is the basis for status-related views.
The RV_TestStatusExtended view provides detailed information for a certain test execution.
The RV_LatestTestStatus view provides status and extended information on the latest test run of a
test within the context of an execution plan and a certain build.
The RV_MaxTestRunID view is a helper to retrieve the latest test run ID for every test, execution plan,
and build combination.
The RV_TestingCycleStatus view provides status information for testing cycles.
The RV_ExecutionPlanStatusPerBuild view retrieves the latest test status sums for every
execution plan in context of builds.
The RV_ExecutionPlanStatusRollup view retrieves the sums for passed, failed, and not-executed
tests per execution plan or folder in context of a build.
Silk Central 15.5
| 291
•
The RV_ConfigurationSuiteStatus view lists the status counts for all configuration suites and
configurations per build.
Architecture
Data is periodically extracted in the background from the production database tables and loaded into the
data mart tables and views for easy and fast querying. If the load on the database is not too high, this data
is usually available within less than a minute after any changes have been committed. If you are logged in
as a system administrator, you can check the current state of the data loading process by navigating to
http://<server>:<port>/sctm/check/db and checking the DM_TestStatus Table.
Note: If you are updating from a Silk Central version that did not include the data mart (before version
13.0), the data mart tables and views are initially filled with data from the production system.
Depending on your database size, this process can take some time. Once this process has
completed, you can access the data.
How to Create Reports with the Data Mart
The following examples demonstrate how to create useful reports with the data mart views.
Writing Data Mart Queries
1. In the menu, click Reports > Details View.
2. In the Reports tree, select the folder in which you want the new report to display.
This determines where the report is stored in the directory tree.
3. Click
on the toolbar. The Create New Report dialog box opens.
4. Type the name of the new report.
This is the name that is displayed in the Reports tree.
5. Check the Share this report with other users check box if you want to make this report available to
other users.
6. Type a description of the report in the Description field.
7. Click Advanced Query to open the Report data query field. Insert previously written code or write new
code directly in the field.
The Insert placeholder list assists you in editing the SQL queries with pre-defined function
placeholders. For details, see SQL Functions for Custom Reports.
Note: If you manually edit SQL code for the query, click Check SQL to confirm your work.
292
| Silk Central 15.5
8. Click Finish to save your settings.
Reliability of Tests in an Execution Plan
Problem
In a continuous integration environment tests are ideally executed at least once per day for testing the daily
build and ensuring the quality of your application under test. To understand how reliable your test set is for
measuring the quality of your AUT it is inevitable to sometimes have a look at how the results change over
time. For example you might have tests in your test set that frequently change status, therefore being no
real measure for quality.
Solution
Use the data mart view RV_TestStatusExtended to create a report that lists the results for a specific
test in the context of a specific execution plan. This allows you to see how this test’s results have changed
over time. For convenience, we will narrow the list of results down to those related to tagged builds, thus
looking at specific milestone builds of the application under test only. This report collects test result data for
tests in the context of execution plans and builds. In the following query we:
•
•
•
Select the columns we want to display from this view.
Narrow the result down by the ID of the test we want to investigate and the ID of the execution plan in
which the test belongs.
Add a constraint to consider tagged builds only.
SELECT TestName, ExecutionPlanName, VersionName, BuildName, TestRunID,
PassedCount, FailedCount, NotExecutedCount
FROM RV_TestStatusExtended
WHERE TestID = ${TESTID|1|Test ID} AND ExecutionPlanID = ${EXECUTIONPLANID|1|
Execution Plan ID} AND BuildIsTagged = 1
ORDER BY BuildOrderNumber
The result of the SQL query are all test runs for the selected test within the selected execution plan. In the
following example you can see that the test was re-run against build 579_Drop2:
TestName
Execution
PlanName
Version
Name
BuildName
TestRunID
Passed
Count
FailedCount NotExecute
dCount
UI Tests
EN|
SQL2012|
IE9|IIS
3.0
579_Drop02
7741797
59
5
0
UI Tests
EN|
SQL2012|
IE9|IIS
3.0
579_Drop02
7745078
63
1
0
UI Tests
EN|
SQL2012|
IE9|IIS
3.0
593_Drop03
7787437
63
1
0
UI Tests
EN|
SQL2012|
IE9|IIS
3.0
605_Drop04
7848720
63
1
0
All Failed Tests in an Execution Folder
Problem
Typically all execution plans are structured in a folder hierarchy which identifies the different areas or
purposes to which the execution plans and their tests are related. The execution plans are triggered on a
Silk Central 15.5
| 293
regular basis in a continuous integration environment, or occasionally over the release time frame,
resulting in nice execution statistics – unfortunately for each single execution plan only.
However, sometimes you need an overall information to know how all your tests perform for a specific area
or purpose to identify where the weaknesses are.
Solution
Use the data mart view RV_LatestTestStatus to create a report that returns a list of all failed tests for a
specific execution planning hierarchy level.
The following query selects failed tests within an execution planning folder with context information like
execution plan name and build name:
SELECT TestID, TestName, ExecutionPlanID, ExecutionPlanName, BuildName
FROM RV_LatestTestStatus lts
INNER JOIN TM_ExecTreePaths ON lts.ExecutionPlanID =
TM_ExecTreePaths.NodeID_pk_fk
WHERE TM_ExecTreePaths.ParentNodeID_pk_fk = ${executionFolderID|2179|
Execution Folder ID}
AND StatusID IN (2, 9)
ORDER BY TestName
The query does the following:
•
•
•
•
Uses the view RV_LatestTestStatus for retrieving the latest test run result.
Includes the execution tree hierarchy (TM_ExecTreePaths) to be able to query all tests from all the
execution plans within the hierarchy.
Uses the top level folder ID from where the analysis should be started as ParentNodeID_pk_fk.
Includes failed and unresolved test status only (StatusID IN (2,9)).
The numbers 2 and 9 for StatusID can be looked up in the table TM_TestDefStatusNames. Silk
Central maps statuses as follows:
•
•
•
passed and unsupported -> passed.
failed and unresolved -> failed.
not executed and N/A -> not executed.
The result of the SQL query are all tests in the selected execution folder for which the last run failed.
TestID
TestName
ExecutionPlanID
ExecutionPlanName BuildName
14073
JUnitTestPackage
2184
CI Testing
352
14107
Volatile Tests
2191
Volatile Test
352
Testing Cycle Status
Problem
Testing cycles can be complex objects as they contain information about manual testers, tests, different
builds and versions of products, and maybe even configurations. To not lose track it is important to find
answers to questions like:
•
•
•
294
| Silk Central 15.5
How many tests have been finished?
How many of them passed or failed per build?
Are my manual testers still busy or can they do additional work?
Solution
Use the data mart view RV_TestingCycleStatus to create a report that shows the status of a testing
cycle per tester and build that will give you an overview of how many tests are passed, failed, not executed
grouped by manual tester, configuration and build.
SELECT BuildName, TesterLogin, TesterExecutionName,
PassedCount, FailedCount, NotExecutedCount
FROM RV_TestingCycleStatus
WHERE TestingCycleID = ${testingCycleID|3|Testing Cycle ID}
ORDER BY BuildOrderNumber, TesterLogin
The query does the following:
•
•
Uses the view RV_TestingCycleStatus as data source, as it contains BuildName, TesterLogin
and TesterExecutionName, which is the generated name reflecting tester, configuration and test.
Limits the data to the testing cycle ID that you are interested in.
The result of the SQL query shows the status per build and tester.
BuildName
TesterLogin
352
TesterExecution PassedCount
Name
FailedCount
NotExecuted
Count
No specific tester
(Test Assets)
0
0
1
351
admin
admin (English|
SQL2008|FF|
Tomcat - Test
Assets)
0
1
0
352
admin
admin (English|
SQL2008|FF|
Tomcat - Test
Assets)
0
0
1
352
gmazzuchelli
gmazzuchelli
(English|
Oracle10g|IE8|
Tomcat - Test
Assets)
0
1
1
352
jallen
jallen (German|
Oracle11g|FF|
Tomcat - Test
Assets)
1
1
0
352
smiller
smiller (German| 1
SQL2008|IE8|IIS Test Assets)
1
0
For unassigned tests a "no specific tester" group is created with empty values for TesterLogin,
TesterFirstName, and TesterLastName.
In case you just want to see how your test cycle is doing based on the performance of your manual testers,
a slight variation of the query will help:
SELECT TesterLogin, TesterExecutionName, SUM(PassedCount) PassedCount,
SUM(FailedCount) FailedCount, SUM(NotExecutedCount) NotExecutedCount
FROM RV_TestingCycleStatus
WHERE TestingCycleID = ${testingCycleID|3|Testing Cycle ID}
GROUP BY TesterLogin, TesterExecutionName
ORDER BY TesterLogin
The query is extended by:
Silk Central 15.5
| 295
•
•
GROUP BY TesterLogin, TesterExecutionName for denoting the remaining columns.
SUM() to the counters for aggregating the figures.
TesterLogin
TesterExecution
Name
PassedCount
FailedCount
NotExecutedCount
No specific tester
(Test Assets)
0
0
1
admin
admin (English|
SQL2008|FF|Tomcat
- Test Assets)
0
1
1
gmazzuchelli
gmazzuchelli
(English|Oracle10g|
IE8|Tomcat - Test
Assets)
0
1
1
jallen
jallen (German|
1
Oracle11g|FF|Tomcat
- Test Assets)
1
0
smiller
smiller (German|
SQL2008|IE8|IIS Test Assets)
1
0
1
Execution Tree Status
Problem
It is a common practice to have execution plans in a hierarchical structure that represents different testing
areas or purposes. In some cases, for example for knowing the test status and therefore the quality of an
area or purpose, you will want to know the overall passed, failed, and not executed count.
Solution
Use the data mart view RV_ExecutionPlanStatusRollup to create a report that returns the passed,
failed, and not executed counts grouped by build for a specific execution planning folder.
SELECT BuildName, PassedCount, FailedCount, NotExecutedCount
FROM RV_ExecutionPlanStatusRollup
WHERE ExecutionFolderID = ${executionPlanID|43|Execution Plan ID}
The query does the following:
•
•
Selects BuildName and the status counts from the RV_ExecutionPlanStatusRollup view.
Specifies the top-level folder you want the status from (ExecutionFolderID).
The result of the SQL query shows the status of your test runs in all execution plans of the selected folder,
aggregated per build.
BuildName
PassedCount
FailedCount
NotExecutedCount
351
0
0
2
352
15
7
1
If you are interested in more details, for example the status counts for each execution plan within the
selected hierarchy, you can use the data mart view RV_ExecutionPlanStatusPerBuild:
SELECT eps.BuildName, eps.ExecutionPlanID, SUM(eps.PassedCount) PassedCount,
SUM(eps.FailedCount) FailedCount, SUM(eps.NotExecutedCount) NotExecutedCount
FROM RV_ExecutionPlanStatusPerBuild eps
296
| Silk Central 15.5
INNER
WHERE
GROUP
ORDER
JOIN TM_ExecTreePaths etp ON eps.ExecutionPlanID = etp.NodeID_pk_fk
etp.ParentNodeID_pk_fk = ${execFolderID|44|Execution Folder ID}
BY eps.ExecutionPlanID, eps.BuildOrderNumber, eps.BuildName
BY eps.BuildOrderNumber, eps.ExecutionPlanID
The query does the following:
•
•
•
•
Uses the RV_ExecutionPlanStatusPerBuild view to access execution-plan specific data
(ExecutionPlanID and ExecutionPlanName). The previously used
RV_ExecutionPlanStatusRollup view contains pre-aggregated data (summed up data), which is
not suitable for the purpose here as you would get results not only for execution plans but for the folder
nodes as well.
Selects all nodes within a specific folder with a JOIN of the TM_ExecTreePath table to bring in
hierarchy information.
Specifies the top-level folder with ExecutionFolderID. As the table TM_ExecutionTreePaths also
contains a self-reference for every execution plan, you could run this query with an execution plan ID for
ParentNodeID_pk_fk too, which would return the rows for the specific execution plan.
Adds ORDER BY BuildOrderNumber and ExecutionPlanID to get a nicely ordered result, showing
the oldest builds and their execution plans first.
The result of the SQL query shows the status of your test runs in all execution plans of the selected folder.
BuildName
ExecutionPlanID
PassedCount
FailedCount
NotExecutedCount
351
2307
0
0
2
352
2184
11
2
0
352
2185
0
3
0
352
2186
2
1
0
352
2187
1
0
0
352
2191
0
1
0
352
2307
1
0
1
Configuration Suite Status
Problem
Configuration suites allow you to execute the same set of tests against multiple configurations, for example
multiple browsers or operating systems. To be able to make reasonable statements related to quality and
reliability of your application under test you will want to keep track of the results for each individual
configuration.
Solution
Use the data mart view RV_ConfigurationSuiteStatus to create a report that returns the passed,
failed, and not executed counts for each configuration per build.
SELECT BuildName, ConfigurationName, PassedCount, FailedCount,
NotExecutedCount
FROM RV_ConfigurationSuiteStatus
WHERE ConfigurationSuiteID = ${configSuiteID|97|Configuration Suite ID}
ORDER BY BuildOrderNumber, ConfigurationName
The query does the following:
•
•
Retrieves the status counts per build of test runs from the RV_ConfigurationSuiteStatus view.
Narrows the results down to the configuration suite (ConfigurationSuiteID).
The result of the SQL query shows the status of your test runs for each configuration.
Silk Central 15.5
| 297
BuildName
ConfigurationName
PassedCount
FailedCount
NotExecutedCount
350
Chrome
0
1
0
350
Firefox
0
1
0
350
Internet Explorer
0
1
0
351
Chrome
1
0
0
351
Firefox
1
0
0
351
Internet Explorer
0
1
0
352
Chrome
1
0
0
352
Firefox
1
0
0
352
Internet Explorer
1
0
0
In this example, we use the ID of the configuration suite to get all configurations. It is also possible to
restrict the result to specific builds, in which case you would have to include BuildID, BuildName, or
BuildOrderNumber in the where clause.
Note: The view RV_ConfigurationSuiteStatus only contains aggregated status counts without
any test-specific data. To retrieve additional test-specific data, you can use, for example, the view
RV_LatestTestStatus.
Troubleshooting
Wrong or Missing Data
Problem
When querying data from a data mart table or view, the listed results are not up to date or missing.
Resolution
The data mart tables and views are updated periodically in the background, but not in real time. Due to
this, it can take a few seconds up to a few minutes for the data to be loaded into the data mart tables. If
your system is running a heavy load, this influences the performance of the background process which is
loading the data. The reason is that other processes are prioritized higher and may temporarily block the
DataMartUpdater background job. Run your query again later to retrieve updated data.
If you are logged in as a system administrator, you can check the current state of the data loading process
by navigating to http://<server>:<port>/sctm/check/db and checking the DM_TestStatus
Table.
Note: Tests and depending test runs are removed from the data mart if a test is deleted. This also
applies to deleted tests due to cleaning up test packages.
The Data Mart Slows Down the System
Problem
Since running the data mart, the system's overall performance seems to be poorer or behaves
inconsistently.
Resolution
While this should not happen, you can turn off the data mart to check if this actually resolves your issues:
298
| Silk Central 15.5
1. Stop the application server service.
2. Open the TmAppServerHomeConf.xml file with a text editor. This file is located in the /conf/
appserver folder of the Silk Central directory on the application server.
3. Locate the Config/DataMart/Enabled XML tag and set the value to false.
4. Restart the application server service.
Reference: Data Mart Tables and Views
The following data mart tables and views are available for easy and fast reporting.
DM_TestStatus
The DM_TestStatus table is the basis for status-related views.
The other data mart views usually provide easier access to detailed data, as this table does not provide
direct access to information like the name of a test. The key of this table is the combination of the columns
TestID, ExecutionPlanID, BuildID, and TestRunID.
Row
Description
TestID
Identifier of the test.
ExecutionPlanID
Identifier of the execution plan.
BuildID
Identifier of the build.
TestRunID
Identifier of the test run.
ExecutionRunID
Identifies in which execution run this result was
generated.
StatusID
Status of this test run (see
TM_TestDefStatusNames).
ReasonID
Reason for the status of this test run (see
TM_ResultStatusReasons). Can be null.
PassedCount
Sum of all passed tests, which is 0 or 1 for common tests
and can be more for package test roots.
FailedCount
Sum of all failed tests, which is 0 or 1 for common tests
and can be more for package test roots.
NotExecutedCount
Sum of all not-executed tests, which is 0 or 1 for common
tests and can be more for package test roots.
ProjectID
ID of the project that this row belongs to.
TestStartTime
Time when the test run started (UTC).
ExecutionStartTime
Time when the execution run started (UTC).
TestDurationInMilliseconds
Duration of the test run in milliseconds.
IsBlocked
Flags the test run as blocked/unblocked
DbChangedAt
Time when this row was last updated by the reporting
data mart.
RV_TestStatusExtended View
The RV_TestStatusExtended view provides detailed information for a certain test execution.
This view contains all test runs, in contrast to the view RV_LatestTestStatus which contains only the
latest test run of a test within the context of an execution plan and a certain build. You can use this view for
Silk Central 15.5
| 299
example to create a report that lists all test runs of your tagged builds. The key of this table is the
combination of the columns TestID, ExecutionPlanID, BuildID, and TestRunID.
Note: Tests and depending test runs are removed from the data mart if a test is deleted. This also
applies to deleted tests due to cleaning up test packages.
Row
Description
TestID
Identifier of the test.
ExecutionPlanID
Identifier of the execution plan.
BuildID
Identifier of the build.
TestRunID
Identifier of the test run.
ExecutionRunID
Identifies in which execution run this result was
generated.
StatusID
Status of this test run (see
TM_TestDefStatusNames).
ReasonID
Reason for the status of this test run (see
TM_ResultStatusReasons). Can be null.
300
PassedCount
Sum of all passed tests, which is 0 or 1 for common tests
and can be more for package test roots.
FailedCount
Sum of all failed tests, which is 0 or 1 for common tests
and can be more for package test roots.
NotExecutedCount
Sum of all not-executed tests, which is 0 or 1 for common
tests and can be more for package test roots.
ProjectID
ID of the project that this row belongs to.
TestStartTime
Time when the test run started (UTC).
ExecutionStartTime
Time when the execution run started (UTC).
TestDurationInMilliseconds
Duration of the test run in milliseconds.
IsBlocked
Flags the test run as blocked/unblocked
DbChangedAt
Time when this row was last updated by the reporting
data mart.
TestName
Name of the test.
TestDescription
Description of the test.
TestParentID
ID of the test's parent.
PlannedTimeInMinutes
Time planned for this test in minutes.
Reason
Name of the reason. Can contain reasons that have been
deleted in the meantime.
ExecutionPlanName
Name of the execution plan.
ExecutionPlanDescription
Description of the execution plan.
ExecutionParentFolderID
ID of the execution plan's parent.
Priority
Priority of the execution plan: 0 = Low, 1 = Medium, 2 =
High.
BuildName
Name of the build used for this test run.
| Silk Central 15.5
Row
Description
BuildDescription
Description of the build.
BuildOrderNumber
Order number of the build.
BuildIsTagged
1 if the build is tagged, 0 otherwise.
VersionID
ID of the version that the build belongs to.
VersionName
Name of the version.
VersionDescription
Description of the version.
VersionOrderNumber
Order number of the version.
ProductID
ID of the product that the build belongs to.
ProductCode
Name of the product.
ProductDescription
Description of the product.
ProductOrderNumber
Order number of the product.
RV_LatestTestStatus View
The RV_LatestTestStatus view provides status and extended information on the latest test run of a
test within the context of an execution plan and a certain build.
Use the RV_TestStatusExtended view to retrieve information about all test runs. You can use this view
to create a report that lists all failed tests in an execution folder. The key of this table is the combination of
the columns TestID, ExecutionPlanID, BuildID, and TestRunID.
Row
Description
TestID
Identifier of the test.
ExecutionPlanID
Identifier of the execution plan.
BuildID
Identifier of the build.
TestRunID
Identifier of the test run.
ExecutionRunID
Identifies in which execution run this result was
generated.
StatusID
Status of this test run (see
TM_TestDefStatusNames).
ReasonID
Reason for the status of this test run (see
TM_ResultStatusReasons). Can be null.
PassedCount
Sum of all passed tests, which is 0 or 1 for common tests
and can be more for package test roots.
FailedCount
Sum of all failed tests, which is 0 or 1 for common tests
and can be more for package test roots.
NotExecutedCount
Sum of all not-executed tests, which is 0 or 1 for common
tests and can be more for package test roots.
ProjectID
ID of the project that this row belongs to.
TestStartTime
Time when the test run started (UTC).
ExecutionStartTime
Time when the execution run started (UTC).
Silk Central 15.5
| 301
Row
Description
TestDurationInMilliseconds
Duration of the test run in milliseconds.
IsBlocked
Flags the test run as blocked/unblocked
DbChangedAt
Time when this row was last updated by the reporting
data mart.
TestName
Name of the test.
TestDescription
Description of the test.
TestParentID
ID of the test's parent.
PlannedTimeInMinutes
Time planned for this test in minutes.
Reason
Name of the reason. Can contain reasons that have been
deleted in the meantime.
ExecutionPlanName
Name of the execution plan.
ExecutionPlanDescription
Description of the execution plan.
ExecutionParentFolderID
ID of the execution plan's parent.
Priority
Priority of the execution plan: 0 = Low, 1 = Medium, 2 =
High.
BuildName
Name of the build used for this test run.
BuildDescription
Description of the build.
BuildOrderNumber
Order number of the build.
BuildIsTagged
1 if the build is tagged, 0 otherwise.
VersionID
ID of the version that the build belongs to.
VersionName
Name of the version.
VersionDescription
Description of the version.
VersionOrderNumber
Order number of the version.
ProductID
ID of the product that the build belongs to.
ProductCode
Name of the product.
ProductDescription
Description of the product.
ProductOrderNumber
Order number of the product.
RV_MaxTestRunID View
The RV_MaxTestRunID view is a helper to retrieve the latest test run ID for every test, execution plan,
and build combination.
The key of this table is the combination of the columns TestID, ExecutionPlanID and BuildID.
302
Row
Description
TestID
Identifier of the test.
ExecutionPlanID
Identifier of the execution plan.
BuildID
Identifier of the build.
| Silk Central 15.5
Row
Description
MaxTestRunID
Identifies the latest test run for the test in context of the
execution plan and build.
RV_TestingCycleStatus
The RV_TestingCycleStatus view provides status information for testing cycles.
You can use this view to create a report that shows the current status of a testing cycle.
TestingCycleID denotes the testing cycle and TesterExecutionID (as well as
TesterExecutionName, UserID, CapacityInCycle, TesterLogin, TesterFirstName,
TesterLastName) is used to identify the assigned tester in the testing cycle. For the tests which are not
assigned to a specific tester, the UserID, CapacityInCycle, TesterLogin, TesterFirstName, and
TesterLastName are null. The key of this table is the combination of the columns
TesterExecutionID and BuildID.
Row
Description
TestingCycleID
Identifier of the testing cycle.
TesterExecutionID
Identifies the group of tests that are assigned to a specific
tester.
TesterExecutionName
The generated name for the group of tests that are
assigned to a specific tester.
UserID
The user ID of the tester.
CapacityInCycleInMinutes
The capacity for this user in this testing cycle in minutes.
TesterLogin
Login name of the tester.
TesterFirstName
First name of tester.
TesterLastName
Last name of tester.
PassedCount
Sum of all passed tests.
FailedCount
Sum of all failed tests.
NotExecutedCount
Sum of all not-executed tests.
ProjectID
Identifier of the project.
BuildID
Identifier of the build.
BuildName
Name of the build used for this test run.
BuildDescription
Description of the build.
BuildOrderNumber
Order number of the build.
BuildIsTagged
1 if the build is tagged, 0 otherwise.
VersionID
ID of the version that the build belongs to.
VersionName
Name of the version.
VersionDescription
Description of the version.
VersionOrderNumber
Order number of the version.
ProductID
ID of the product that the build belongs to.
ProductCode
Name of the product.
Silk Central 15.5
| 303
Row
Description
ProductDescription
Description of the product.
ProductOrderNumber
Order number of the product.
RV_ExecutionPlanStatusPerBuild
The RV_ExecutionPlanStatusPerBuild view retrieves the latest test status sums for every execution
plan in context of builds.
Folders and child nodes are not considered. You can use this view to create a report that shows the status
of your test runs for each execution plan in a folder. In contrast to RV_ExecutionPlanStatusRollup,
this view has a slight performance advantage as no hierarchy is considered for retrieving the data. The key
of this table is the combination of the columns ExecutionPlanID and BuildID.
Row
Description
ExecutionPlanID
Identifier of the execution plan.
BuildID
Identifier of the build.
ExecutionPlanName
Name of the execution plan.
ExecutionParentFolderID
ID of the execution plan's parent.
PassedCount
Sum of all passed tests.
FailedCount
Sum of all failed tests.
NotExecutedCount
Sum of all not-executed tests.
ProjectID
ID of the project that the execution plan belongs to.
BuildName
Name of the build used for this test run.
BuildDescription
Description of the build.
BuildOrderNumber
Order number of the build.
BuildIsTagged
1 if the build is tagged, 0 otherwise.
VersionID
ID of the version that the build belongs to.
VersionName
Name of the version.
VersionDescription
Description of the version.
VersionOrderNumber
Order number of the version.
ProductID
ID of the product that the build belongs to.
ProductCode
Name of the product.
ProductDescription
Description of the product.
ProductOrderNumber
Order number of the product.
RV_ExecutionPlanStatusRollup
The RV_ExecutionPlanStatusRollup view retrieves the sums for passed, failed, and not-executed
tests per execution plan or folder in context of a build.
In case of folders, the counters include the numbers from all children. You can use this view to create a
report that shows the status of all test runs in a folder. The key of this table is the combination of the
columns ExecutionFolderID and BuildID.
304
| Silk Central 15.5
Row
Description
ExecutionFolderID
Identifier of the execution plan.
BuildID
Identifier of the build.
PassedCount
Sum of all passed tests.
FailedCount
Sum of all failed tests.
NotExecutedCount
Sum of all not-executed tests.
ProjectID
ID of the project that the execution plan belongs to.
BuildName
Name of the build used for this test run.
BuildDescription
Description of the build.
BuildOrderNumber
Order number of the build.
BuildIsTagged
1 if the build is tagged, 0 otherwise.
VersionID
ID of the version that the build belongs to.
VersionName
Name of the version.
VersionDescription
Description of the version.
VersionOrderNumber
Order number of the version.
ProductID
ID of the product that the build belongs to.
ProductCode
Name of the product.
ProductDescription
Description of the product.
ProductOrderNumber
Order number of the product.
RV_ConfigurationSuiteStatus
The RV_ConfigurationSuiteStatus view lists the status counts for all configuration suites and
configurations per build.
You can use this view to create a report that shows the status of all test runs for each configuration in a
configuration suite. The key of this table is the combination of the columns ConfigurationID and
BuildID.
Row
Description
ConfigurationSuiteID
Identifier of the configuration suite.
ConfigurationID
Identifier of the configuration.
ConfigurationName
Name of the configuration.
BuildID
Identifier of the build.
PassedCount
Sum of all passed tests.
FailedCount
Sum of all failed tests.
NotExecutedCount
Sum of all not-executed tests.
ProjectID
ID of the project that this row belongs to.
BuildName
Name of the build used for this test run.
BuildDescription
Description of the build.
Silk Central 15.5
| 305
Row
Description
BuildOrderNumber
Order number of the build.
BuildIsTagged
1 if the build is tagged, 0 otherwise.
VersionID
ID of the version that the build belongs to.
VersionName
Name of the version.
VersionDescription
Description of the version.
VersionOrderNumber
Order number of the version.
ProductID
ID of the product that the build belongs to.
ProductCode
Name of the product.
ProductDescription
Description of the product.
ProductOrderNumber
Order number of the product.
Reporting Area
Overview
The default reports that ship with Silk Central are visible in all projects and are listed under Global Reports
in the Reports tree. These reports cannot be modified, but you can make copies that you can customize to
your needs. Creating your own custom reports within the Global Reports tree makes your reports
available for all projects too. You can also copy reports between project trees and the Global Reports
tree. The concept of global reports allows you to flexibly administrate reports across all projects within Silk
Central.
Limitations:
•
•
Because global reports are not in context of a project, they need to be advanced reports (SQL).
Global reports cannot be sub-reports of project reports, and sub-reports are not available in the global
reports section.
Shared Global Report Permissions
Because shared global reports are available in all projects for all users, user roles that are able to update
and delete them require special permissions: Manage shared global reports and Delete shared global
reports. Non-shared global reports can be updated and deleted by user roles with the standard report
permissions for updating and deleting reports. This implies the following special scenarios:
•
•
The option Share this report with other users is disabled in global reports and folders if the user does
not have the Manage shared global reports permission
When pasting a copied shared report into the Global Reports tree without the Manage shared global
reports permission, the pasted report is set to non-shared
Creating and Customizing Reports
Creating Reports
Silk Central offers reports that quickly and easily transform data into intuitive charts and graphs. Preinstalled reports are available for the Requirements, Tests, and Issues areas.
Reports are created using either BIRT RCP Designer, an open-source, Eclipse-based report tool, or
Microsoft® Word® or Microsoft® Excel® report templates. Silk Central is tightly integrated with BIRT RCP
Designer to make it easy for you to generate reports on test management data. The reporting functionality
306
| Silk Central 15.5
in Silk Central is highly customizable. Numerous pre-installed reports and report templates provide out-ofthe-box options for a wide range of reporting needs. Simple GUI-based tools allow you to edit the preinstalled reports and create reports of your own. For users with SQL knowledge, there is virtually no limit to
how data can be queried and presented in custom reports.
Tip: If a blank report is generated, the cause may be that there are not any data in the project you
selected, or you may not be connected to the appropriate Silk Central database. Reports are not
available offline unless your Silk Central database is accessible locally.
Creating New Reports
To create a new report:
1. In the menu, click Reports > Details View.
2. In the Reports tree, select the folder in which you want the new report to display.
This determines where the report is stored in the directory tree.
3. Click
on the toolbar. The Create New Report dialog box opens.
4. Type the name of the new report.
This is the name that is displayed in the Reports tree.
5. Check the Share this report with other users check box if you want to make this report available to
other users.
6. In the Timeout [s] field, type the maximum time period in seconds that Silk Central should wait for SQL
queries to complete.
7. From the Default tab list, select the tab that you want to be directed to when you select this report from
one of the context-sensitive report lists.
8. Select the corresponding result type from the Result category list.
This setting specifies the database table and view that is to be filtered for the report. The following result
types are available:
Result Type
Description
Requirement
Returns requirements available in the Requirements module that meet
the query criteria.
Test
Returns tests available in the Tests area that meet the query criteria.
Test Execution
Returns executed test results from the Executions area that meet the
query criteria.
Execution Plan
Returns execution plans from the execution area.
Issue
Returns issues, including imported issues.
Requirement Progress
Builds
Contains information on requirements progress per build so that you can
see how requirements develop across builds.
Requirement Progress
Days
The same as Requirement Progress Builds, but shows development on
a daily basis.
Test Progress Builds
Shows how tests develop across builds.
Test Progress Days
Same as above, but shows development on a daily basis.
Each result type offers a set of selection criteria. Based on the result type you have selected, specify an
appropriate Selection criteria for your report. These criteria typically group properties based on a view
or some other intuitive grouping, for example custom properties.
9. From the Property list, select the property that is to be filtered on.
For some selection criteria, properties are dynamic.
Silk Central 15.5
| 307
10.Select an Operator for the query.
The available operators depend on the property. Example operators are =, not, like, and not like.
Strings are always compared lowercase. Allowed wildcards for strings are "*" and "?", where * matches
any characters and ? matches exactly one character.
11.Select or specify the Value that the query is to be filtered on.
For date-based properties, the Value field is replaced with a calendar tool that you can use to select a
specific date.
12.Optional: To add an additional query string to this report, click More. An existing query string can be
deleted by clicking the string’s Delete button. When multiple query strings are defined, AND and OR
option buttons are displayed next to More. Use these option buttons to define if the queries should be
considered cumulatively, or if only one query string’s criteria needs to be met.
13.Click Next to configure report columns on the New Report dialog box.
14.Click Add Columns. The Add Columns dialog box lists all available report columns.
15.Select the columns that you want to have included in the report and click OK.
You can select multiple columns with Ctrl+Click.
Note: For test-planning reports, the list of available column names is enhanced with the column
names from the LQM_v_tests table. For details, refer to the Silk Central Database Model Schema.
The selected columns display in tabular format on the New Report dialog box.
16.Optional: Configure how each report column is to be displayed. For each column, specify a sort
direction, ascending, descending, or unsorted, using the up/down arrows in the Sorting column.
17.When multiple columns are selected for sorting, a list box is displayed in the Sort Order column that
allows you to more easily edit the column-sort order. Set these numbers as required.
18.Give each column an Alias.
This is the name by which each column will be labeled in the generated report.
19.With grouping, you can take advantage of SQL aggregation features, for example when selecting a
number of elements or querying a total sum of values. Check the Group by check box to specify that
SQL group by functions are to be applied.
20.Columns that are not selected for SQL group by functions are set to aggregation by default, which
means a single aggregate value is calculated. From the Aggregation list, select the appropriate
aggregation type.
The following types are available:
•
•
•
•
•
Count
Sum
Average
Minimum
Maximum
21.The Actions column enables you to move column listings up and down in the view, or to delete a
column.
22.Click Finish to complete your new report.
SQL Functions for Custom Reports
To assist in writing advanced queries, placeholders are available for each function. Function placeholders
are replaced with SQL code upon execution. Functions are used like parameters, but their names have a $
(dollar symbol) as a prefix. Unlike parameters, placeholders are defined report elements that cannot be
customized per execution.
The following table lists all available function placeholders:
308
| Silk Central 15.5
Function
What it does
Example
$TODAY
Returns the current systemdate on
the database server. You can also
write $TODAY-1 for yesterday or
$TODAY-7 for a week ago.
CreatedAt > ${$TODAY}
$DATE(column)
Returns the date but not the time.
$DATE('string')
Converts the given string to a
database date.
CreatedAt > $
{$DATE('01/10/2005')}
$DAYS[p1;p2]
Calculates the difference in days
between the two given parameters.
The two parameters can be a column
within the table/view or $TODAY.
The following example returns the
rows created within the last week: $
$WEEK(param)
Returns the week-number of the
given parameter, which can be
$TODAY or a column.
$MONTH(param)
Returns the month of the year as a
number of the given parameter, which
can be $TODAY or a column.
$YEAR(param)
Returns the year as a number of the
given parameter, which can be
$TODAY or a column.
$USERID
The ID of the currently logged in user.
$USERNAME
The name of the currently logged in
user.
$PROJECTID
The ID of the currently selected
project.
$PROJECTNAME
The name of the currently selected
project.
$REPORTNAME
The name of the currently selected
report.
$REPORTID
The ID of the currently selected
report.
{$DAYS[CreatedAt;$TODAY]}
> 7
Below is the code of the pre-installed Requirement with Child Requirements report. With this report, a
selected requirement is shown with its requirement ID. Full details regarding the requirement’s child
requirements are displayed. Although not a custom report, this report is a helpful example because it
makes use of the $PROJECTID function. It also includes two parameters, reqID (requirement ID) and
reqProp_Obsolete_0 (show obsolete requirements).
SELECT r.ReqID, r.ReqCreated, r.ReqName, r.TreeOrder
FROM RTM_V_Requirements r INNER JOIN
TM_ReqTreePaths rtp ON (rtp.ReqNodeID_pk_fk = r.ReqID)
WHERE rtp.ParentNodeID_pk_fk=${reqID|22322|Requirement ID} AND
r.ProjectID = ${$PROJECTID} AND
r.MarkedAsObsolete=${reqProp_Obsolete_0|0|Show obsolete Requirements}
ORDER BY r.TreeOrder ASC
Writing Advanced Queries with SQL
Advanced reports can be created through manual SQL coding. Virtually any reporting option is available if
you know the database schema. Clicking Advanced Query hides the query string list boxes and opens the
Report data query field in which you can insert existing code or write new SQL code.
Silk Central 15.5
| 309
Restriction: The SQL statement select top is not supported.
One approach is to begin query-string construction using the list boxes as outlined in Creating New
Reports. If the report criteria are valid, the equivalent SQL statement will be generated and displayed, and
then move to advanced mode for further modifications.
Note: If you switch from advanced mode back to simple mode the changes you made within the code
will be lost.
To write an advanced query directly in SQL:
1. In the menu, click Reports > Details View.
2. In the Reports tree, select the folder in which you want the new report to display.
This determines where the report is stored in the directory tree.
3. Click
on the toolbar. The Create New Report dialog box opens.
4. Type the name of the new report.
This is the name that is displayed in the Reports tree.
5. Check the Share this report with other users check box if you want to make this report available to
other users.
6. Type a description of the report in the Description field.
7. Click Advanced Query to open the Report data query field. Insert previously written code or write new
code directly in the field.
The Insert placeholder list assists you in editing the SQL queries with pre-defined function
placeholders. For details, see SQL Functions for Custom Reports.
Note: If you manually edit SQL code for the query, click Check SQL to confirm your work.
8. Click Finish to save your settings.
Working with Sub-Reports
Adding Sub-Reports
To aggregate the results from multiple reports into the currently selected report, you can add sub-reports.
When adding a report as a sub-report, the result columns and rows of the sub-report are concatenated to
the results of the selected report.
To add a report as a sub-report:
1. In the menu, click Reports > Details View.
2. Select a report in the Reports tree.
3. Click the Properties tab.
4. Click Add Sub-Report.
The Add Sub-Report dialog box appears.
5. From the Reports tree, select the sub-report you want to append to the current report.
6. Click OK to complete the addition of the sub-report. Sub-reports are displayed on the associated
report’s Properties page in the Sub-Reports section.
Deleting Sub-Reports
To delete a sub-report:
1. In the menu, click Reports > Details View.
2. Select the report in the Reports tree that has the associated sub-report that you want to delete.
310
| Silk Central 15.5
3. Click the Properties tab.
4. Click
in the Actions column of the sub-report that you want to delete.
5. Click Yes on the confirmation dialog box to confirm the deletion.
Report Templates
Uploading Report Templates
To upload a template from your local system:
1. In the menu, click Reports > Details View.
2. Select the report to which you want to associate the template.
3. Click the Report tab.
4. Click the Click here to upload a new report template link to open the Upload Template dialog box.
5. Give the template a meaningful Name and Description.
6. In the Projects list box, select the project to which you would like to make the template available or
select All Projects to have the template associated with all projects.
7. Click Browse to browse to and select the template on your local system.
8. Click OK to upload the template.
Downloading Report Templates
Silk Central report templates render report data into formats that meet your specific needs. Templates can
take the form of Word documents, Excel spreadsheets, BIRT RCP Designer templates, XML, or CSV files.
Downloading Silk Central report templates to your local system enables you to edit them through BIRT
Report Designer or Microsoft Excel or Word. After you download and edit a report, you can upload it to
make it available to other users. For details see the related Uploading Report Templates procedure.
To download an existing report template for editing:
1. In the menu, click Reports > Details View.
2. Select a report that utilizes the template you want to modify from the Reports tree.
3. Click the Properties tab.
4. Click the download link of the template you want to download.
The available download links are:
Generate
empty
BIRT
report
template
You receive the report data as an empty generic BIRT report template. The datasource is already
configured.
Generate
Excel
report
template
You receive an Excel file with a sheet named DATA that contains the data, for example in CSV
format. This is the only affected sheet in the template, so you can specify information in adjoining
sheets, for example diagrams.
Download You receive a Word .DOCX file that you can use to create a custom Word report. The Word file
contains examples of how to customize the template to add the data that you need for your report.
sample
Word
report
template
Silk Central 15.5
| 311
Download You receive the report data as a Comma Separated Values (CSV) file. Depending on your local
settings, you will receive ‘,’ or ‘;’ as the delimiter character. The date is also formatted based on
report
user settings.
data
as .CSV
file
Download
report
data
as .XML
file
You receive the report data as XML. The advantage of this approach over CSV is that you retain all
subreport data. Accessing data outside of Silk Central - You can call a specific URL that offers the
report data using the following format: http://server/servicesExchange?
hid=reportData&userName=<username>&passWord=<password>&reportFilterID=<ID
of the report>&type=<csv|xml>.
5. The File Download dialog box displays. Click Save and download the report file to your local system as
a .rptdesign, .docx, or .xls file, depending on the report type that you are downloading.
6. Edit the report based on your needs using either the BIRT RCP Designer, for .rptdesign files, Word
for .docx, or Excel, for .xls files.
Removing Report Templates
To remove the template of the current report:
1. In the menu, click Reports > Details View.
2. In the Reports tree, select the report from which you want to delete a template.
3. Click the Report tab.
4. Click
.
5. Click Yes on the subsequent confirmation dialog box.
Report Subscriptions
The Subscriptions tab in the reporting unit allows you to subscribe to reports. You can customize when,
where, and how you receive the report as well as modify report parameters. The report is created in the
background on the application server, per a selected schedule, and the subscriber is sent the report via
email or the report can be displayed in a dashboard panel and is also accessible from external sites
through a URL.
Subscribing to a Report
Please note the following when working with subscriptions:
•
•
•
•
•
If the user who created the report is deleted, the schedule for the report is removed, disabling the
report. Another user must modify the subscription to re-activate it.
Subscriptions are not copied when you copy or baseline a project.
Subscriptions are not exported when you export a project.
After a subscription is created, you can edit it or delete it using icons in the Actions column.
For dashboard panel and externally accessed reports, only the last report result is stored and there is
no history available.
1. In the menu, click Reports > Details View.
2. Select a report in the Reports tree.
3. Click the Subscriptions tab.
4. Click Add Subscription. The Edit Subscription dialog box opens.
5. Give your subscription a name in the Name field.
6. To modify the subscription parameters, click Edit Parameters. The Edit Parameter dialog box opens.
Change the Value and click OK.
312
| Silk Central 15.5
7. Select a schedule from the Schedule list. If the schedule you want does not exist, you need to create it.
8. In the Result Handling area, pick one of the following options:
•
•
If you want to send the report as an email, click Send as Email and select the Format: Report
template (Excel, BIRT), PDF (data table) or XLSX (data table). The available
options depend on the existence of the configured template. Then, enter the Email addresses
where the report will be sent. You can send the report to multiple email addresses by separating
them with commas, semi-colons or blanks.
If you want to make the report available in a dashboard panel or from external sites, click Provide
for dashboard and external access. Selecting this option makes the report available in the Report
Subscription dashboard panel, and you can embed the provided link in Websites, emails, and
more. This is a permanent link that does not change and requires no login or license to access. Note
that when using a template, only BIRT templates are graphically rendered. Other templates display
as data table.
9. Click OK. The new subscription is listed in the Subscriptions list.
Example: Embedding the External Access Link in an IFrame
<html>
...
<body>
...
<iframe src="http://<front-end server>:19120/servicesExchange?
hid=reportOutput&linkId=ec36a037-a59a-4899-a98c-5a4a4644811f"
width="700" height="500"></iframe>
...
</body>
</html>
Adding a Report to a Dashboard Panel
Using any report available in the Reports unit, the Report Subscription panel of your dashboard allows
you to display an existing report. First, create and configure your report, and then add the panel to your
dashboard.
1. In the menu, click Reports > Details View.
2. Select a report in the Reports tree.
3. Click the Subscriptions tab.
4. Click Add Subscription. The Edit Subscription dialog box opens.
5. Give your subscription a name in the Name field.
6. To modify the subscription parameters, click Edit Parameters. The Edit Parameter dialog box opens.
Change the Value and click OK.
7. Select a schedule from the Schedule list. If the schedule you want does not exist, you need to create it.
8. Click Provide for dashboard and external access to make the report available in a dashboard panel.
9. Click OK. The new subscription is listed in the Subscriptions list.
10.In the menu, click Home > My Dashboard.
11.Click Add Panel on the top left. The Add Panel dialog box appears, listing the available panels along
with a short description for each panel.
12.Select Report Subscription. The Configure Panel dialog box appears, listing all available report
subscriptions.
13.Select a report subscription from the list and click OK. The panel is added to your Dashboard.
Silk Central 15.5
| 313
Working with Charts
Displaying Charts
To display a chart:
1. In the menu, click Reports > Details View.
2. Select a report in the Reports tree.
3. Click the Chart tab to display the default chart.
4.
To select a different chart type, click
. The Select Chart Type dialog appears.
5. Select a chart type from the Chart type list.
6. Check the view properties that you want to apply to the chart:
• 3D view
• Show horizontal grid lines
• Show vertical grid lines
• Show legend
7. Specify how these chart options are to be saved:
•
•
Click the For current user only option to have these chart settings override the report’s standard
settings whenever the current user views this chart.
Click the As report standard option to have these chart settings presented to all users who do not
have overriding user settings defined. This setting does not effect individual user settings.
8. Click OK to display the new chart type.
Note: The chart configurations you define here become the default for this report. When standard
charts and graphs are not able to deliver the specific data that you require, or when they cannot
display data in a required format, you can customize the appearance of queried data using the Silk
Central reporting functionality. To open the current chart in a separate browser window, click at
the top of the Chart page.
Printing Charts
To print the current chart:
1. In the menu, click Reports > Details View.
2. Select a report in the Reports tree.
3. Click the Chart tab.
4. Click Print. The chart data displays in a new window in printable format. Your system’s print dialog box
is also displayed.
5. Configure print settings as necessary and click OK to print the chart.
Removing Charts
Removing a chart only removes the currently selected chart template from the selected report, it does not
remove the chart template entirely.
To remove the current chart template from the selected report:
1. In the menu, click Reports > Details View.
2. Select a report in the Reports tree.
3. Click the Chart tab.
4. Click Remove chart type. The Remove Chart dialog box opens.
5. Select one of the following:
314
| Silk Central 15.5
•
Select Remove user settings (and revert to report standard) to have the current user’s chart
settings deleted along with the chart. The chart will subsequently be displayed according to the
report’s standard settings. If no standard settings have been defined, the chart cannot be displayed.
Note: This option is only available when the current user has defined specific chart settings.
•
Select Remove standard chart settings of report to have any standard settings deleted along with
the chart. User-specific settings are not affected by this option.
Note: This option is only available when standard chart settings have been defined for a report.
6. Click OK to delete the chart template. If required, you can click the <Click here to choose a chart
type> link to assign a new chart template to the selected report.
Report Chart Page
Reports > Details View > Chart
The Chart page enables you to define charts and graphs for data analysis. The page relies on the internal
reporting engine of Silk Central to create standard charts and graphs from the data retrieved by the
selected report query.
The following standard chart types are available:
•
•
•
•
•
•
area chart
bar chart
horizontal stacked bar chart
line chart
pie chart
stacked bar chart
Customizing Reports
Customizing BIRT Report Templates
With BIRT RCP Designer (BIRT), you can customize the pre-installed report templates of Silk Central and
create custom report templates. For details on using BIRT, see the Administration topics in this Help and
the BIRT RCP Designer documentation.
To download an existing template for editing:
1. In the menu, click Reports > Details View.
2. Select a report that utilizes the BIRT Report Template.
3. Click the Properties tab.
4. Click Download BIRT report template. You receive the report data as an empty generic BIRT report
template. The datasource is already configured.
5. Once you have saved the template to your local system, modify it as required.
For detailed information on configuring BIRT report templates, see the Administration topics in this
Help.
6. To upload the modified report template, click Administration > Report Templates in the menu and
click Upload.
Customizing the Word Report Template
Use the Word report template to create a custom report that suits your needs.
To download an existing template for editing:
Silk Central 15.5
| 315
1. In the menu, click Reports > Details View.
2. Select a report.
3. Click the Properties tab.
4. Click the Download sample Word report template link. Use your browser to save the file locally.
5. Using the available result columns in your report, customize the report to your liking according to the
commands contained in Word Report Template.
6. To upload the modified report template, click Administration > Report Templates in the menu and
click Upload.
Word Report Template
About the template
Use the Word report template to create a customized report. The template uses Word merge fields to get
the data that you need. The template is designed for .DOCX files and does not support .DOC. Here a few
tips to get started:
•
•
•
•
To insert merge fields in a document, click Office 2010 > Insert > Quick Parts > Fields > MergeField
or click Ctrl plus F9.
In order to edit a merge field, right click the field and then select Edit Field.
You can mix and match standard text in addition to merge fields in your report.
Merge fields take the following form: « value ».
General Report Information
The following contains data you may want to use in your report header:
Field
Description
${report.name}
The name of the report.
${report.projectName}
The name of the project where the report is executed.
${report.description}
The description of the report.
${report.executedBy}
The login name of the user who executed the report.
${report.generatedOn}
The date and time when the report was executed.
${report.generatedOnWeek}
The week number of when the report was executed.
Accessing Data
The following sections describe how to access and display different data for your report.
By Index
«${rows[0].cols[3]}»
By Name
«${rows[0].ReqName}»
In Lists
A typical use case would be to iterate through each row and show the column information for
every row. To get a list of data, do the following:
«[#list rows as r]»
«${r.TestDefID}» - «${r.TestName}»
«[/#list]»
The beginning of the loop is defined by [#list rows as r] and the end by [/#list].
The row data within the loop is referenced with r which allows you to get Test Name within
the loop by referencing it with ${r.TestName}.
316
| Silk Central 15.5
The above example would iterate through all rows and the rendered report would show a list
of tests with their id and their name.
In Tables
Defining the start and end of a loop within a table row requires an additional command to
continue iterating within the table. You have to place the list command for the loop into the
first column of your table and preface it with @before-row. You need to use @after-row
to complete the list. The following table shows how to do this.
«${headers[3]}»|«${headers[3].@name}»
«${headers[4]}»|«${headers[4].@index}»
«@before-row[#list rows as r]»«${r.ReqName}»
«@after-row[/#list]»
«${r.ReqDescription.@html}»
Headers
•
and HTML
•
•
Headers of the data can be accessed with a merge field named headers.
Headers can be displayed in different ways by appending .@elementName or .@name
or .@index.
Some Silk Central data, like many Description fields, are stored as HTML. If you want to
display your HTML-encoded text based on its tags, append the attribute .@html. If you
don't add this attribute, you will still see the text, but it will contain the HTML markup. For
example: if your source data is <b>My report description</b> and you
use .@html, you will see My report description. Otherwise, you will see: <b>My report
description</b>. The following HTML tags are supported: <b>, <strong>, <i>,
<u>, <br>, <p>, and <a>.
Troubleshooting
Why does my report show Are you referencing columns by their index? If yes, be aware that the first
column is referenced by index 0 and not by 1.
wrong data?
Why do I get an error
mentioning a specific field
when downloading my
report? I don't see this
field in my template?
You may have changed the label of a field but the mail merge reference
still has its original value. For example, you may receive an error message
that the field ${r.requirementName} doesn't exist. In your document
you see the field ${r.reqName}. When you right click this field and select
Edit Field, you will see that the reference is still $
{r.requirementName}. Don't forget to change mail merge fields via Edit
field.
Sample Report
The following sample Word report shows a report with manual tests containing steps.
Note: You cannot copy and paste this sample as is. It is designed to show you different ways to use
reporting code for the various sections in a report. The sample shown below is included in the Report
Templates as ManualTestResults.docx.
Report generated: «${report.generatedOn}» «${report.generatedOnWeek}»
«${report.name}»
Project Name
Report Description
Report Executed By
«${report.projectName}»
«${report.description}»
«${report.executedBy}»
«[#list rows as r]»«[#assign firstRow=(r_index==0 ||
rows[r_index-1].ManualTestDefID != r.ManualTestDefID)]»«[#if firstRow]»
«${r.TestDefinitionName}»
«${r.TestDefinitionDescription.@html}»
Silk Central 15.5
| 317
Status: «${r.StatusName}»
Planned Time [hh:mm]: «[#if r.PlannedTime!="null"]»«${r.PlannedTime}»«[#else]»
00:00«[/#if]»
Used Time [hh:mm]: «[#if r.UsedTime!="null"]»«${r.UsedTime}»«[#else]»00:00«[/
#if]»
Build: «${r.BuildName}»
Version: «${r.VersionName}»
Execution Plan: «${r.ExecDefName}»
Changed By: «${r.ChangedBy.@text}»
Changed On: «${r.ChangedAt.@text}»
«[/#if]»«[#if r.StepName != "null"]»«[#if firstRow]» Test Step Details:«[/
#if]»
Step Name: «${r.StepName}»
Description: «${r.StepDescr.@html}»
Status: «${r.StepStatus}»
Result Info: «${r.StepResultInfo.@html}»
Expected Result: «${r.ExpectedResult.@html}»
«[/#if]»«[/#list]»
Viewing Reports
Because each template expects a certain data format to produce a useful graph, not all templates can be
applied to all report queries. You will receive an error message if you attempt to generate a report through
an incompatible report template. For example, selecting the Four Values Per Row As Horizontal Bar
template to display the Requirements Status Overview report works because this particular Microsoft Excel
template requires exactly the four values, failed, passed, not executed, and not covered that the
report query delivers.
To generate a report:
1. In the menu, click Reports > Details View.
2. In the Reports tree, select the report that you want to generate.
3. Click the Report tab.
4. Click the link <Click here to choose a report template>. The Select Report Template dialog box
displays.
5. Select the template you wish to use.
6. Click OK to display the report.
Saving Reports
How you save a report locally depends on whether you have selected a BIRT report template or an Excel
or Word template. If you have selected an Excel template, click the Download Excel report template link
in the Properties page of the selected report. This will invoke Microsoft Excel on your local computer and
the report will be loaded automatically. Likewise, with Word, click Download sample Word report
template.
If you have selected a BIRT report template, use the following procedure to save the report.
To export the current BIRT report as PDF:
1. In the menu, click Reports > Details View.
2. In the Reports tree, select the report that you want to save.
3. Click the Report tab.
4. Click
on the Report view toolbar.
5. On the File Download dialog box, click Save to save the PDF document to a location of your choice.
318
| Silk Central 15.5
Bookmarking Reports
The BOOKMARK button bookmarks the currently displayed report, including the parameters that you have
set in the Parameters page. You can send bookmark URLs to other Silk Central users, allowing them to
view reports with a single click.
The bookmark URL contains the parameters, prefixed with rp_. Date values are represented as the
correlating Long values in UTC in the URL.
Viewing a Report as a PDF
To view the current report in PDF format within the report browser frame:
1. In the menu, click Reports > Details View.
2. In the Reports tree, select the report that you want to view.
3. Click the Report tab.
4. Click on the report view toolbar. The report displays in PDF format.
Accessing Most Recently Used (MRU) Reports
To select a recently-viewed report:
1. In the menu, click Reports > Details View.
2. On the Reports toolbar, expand the Last Used Reports list box.
3. Select the report that you want to view.
Reports Toolbar Functions
Silk Central > Reports
The Reports toolbar provides important commands for report management. The toolbar includes the
following items:
Item
Icon
Description
New Child Folder
Enables creation of new report folders. Click New Child Folder to
define a name and optional description for a new folder. The new
folder displays as a child of the currently selected node in the Reports
tree.
New Child Report
Enables creation of new reports. Click New Child Report to define a
new report using the Create New Report dialog box. A new report
displays as a child of the currently selected node in the Reports tree.
Edit
Edit a report.
Delete
Delete a report.
Cut
Cut a report and add it to the clipboard.
Copy
Copy a report to the clipboard.
Paste
Paste a report from the clipboard into the Reports tree.
Paste as Child
Paste a report from the clipboard into the Reports tree, as a subnode
of the selected node.
Silk Central 15.5
| 319
Item
Icon
Description
Move Up
Move reports up within the Reports tree.
Move Down
Move reports down within the Reports tree.
Last Used Reports
Lists the Most Recently Used (MRU) reports by date/time in
descending order. Select a report name from the list to advance to
that report. Each time a report is accessed by clicking the Data,
Chart, or Report tab, that report is added to the top of the list box.
Accessing a report's Properties or Parameters tab does not result in
that report being added to the Last Used Reports list box.
The Last Used Reports list box is empty for new users and users
who have not yet generated a report. The number of reports that
displays in this list can be configured by your administrator. For more
information, see the Administration topics in this Help.
Report Properties
Editing Report Properties
To edit the properties of a report:
1. In the menu, click Reports > Details View.
2. Select a report in the Reports tree.
3. Click the Properties tab.
4. Click Edit. The Edit Report dialog box appears.
5. Modify the Name, the Description and the Timeout [s] of the report as required.
6. Check the Share this report with other users check box if you want to make this report available to
other users.
7. From the Default tab list, select the tab that you want to be directed to when you select this report from
one of the context-sensitive report lists.
8. You can edit the report in two ways:
•
Create a simple report: Use the Selection criteria, Property, Operator, and Value lists to generate
SQL queries. Click More to add further query strings and choose the operators AND or OR to
combine the queries. Click
•
to delete a query string.
Create an advanced report: If you are familiar with SQL, you may want to edit the query code. Click
Advanced Query and modify the query code within the Report data query field. The Insert
placeholder list assists you in editing the SQL queries with pre-defined function placeholders. Click
Simple to go back to the simple mode.
Note: If you manually edit the SQL code for the query, upon finishing, click Check SQL to confirm
your work.
9. Click Finish to save your changes.
Report Properties Page
Reports > Details View > Properties
The Properties page displays the basic properties of the selected report, enabling you to edit these
properties or the report templates. You can also add subreports to your reports.
The page displays the following items:
320
| Silk Central 15.5
Items
Description
Report Name
Name of the report (customizable)
Report ID
System-defined identifier of the report
Description
A description of the report (customizable)
Created On
Date the report was created. Default reports are created
when a database is created and connected to.
Created By
User who created the report. Default reports are created
by the user Admin.
Changed On
Date the report was last modified.
Changed By
User who last modified the report.
Renderer
Report template that is currently assigned to the report.
Default Tab
Tab you are directed to when you select this report from
one of the context-sensitive report lists.
Edit
Click to open the Edit Report dialog box.
Add Subreport
Click to add a subreport to the report.
Report Templates
The available pre-installed report templates are:
Generate
empty
BIRT
report
template
You receive the report data as an empty generic BIRT repo
Generate
Excel
report
template
You receive an Excel file with a sheet named DATA that con
the only affected sheet in the template, so you can specify i
diagrams.
Download
sample
Word
report
template
You receive a Word .DOCX file that you can use to create a
examples of how to customize the template to add the data
Download
report
data
as .CSV
file
You receive the report data as a Comma Separated Values
will receive ‘,’ or ‘;’ as the delimiter character. The date is als
Download
report
data
as .XML
file
You receive the report data as XML. The advantage of this
data. Accessing data outside of Silk Central - You can call a
following format: http://server/servicesExchan
hid=reportData&userName=<username>&passW
of the report>&type=<csv|xml>.
Report Parameters
Editing Report Parameters
To edit the parameters of a report:
Silk Central 15.5
| 321
1.
2.
3.
4.
5.
6.
In the menu, click Reports > Details View.
Select a report in the Reports tree.
Click the Parameters tab. If the report has parameters defined for it, the parameters are listed here.
Click Edit Parameters. The Edit Parameters dialog box appears.
Edit the Label or Value of the listed parameters as required.
From the Usage list, select the usage type of the parameter:
• Constant Value
• Start Time
• End Time
7. Click OK.
Report Parameters Page
Reports > Details View > Parameters
The Parameters page lists customizable statement elements. Parameters can be defined any time before
a report execution by simply changing them on the Parameters page. The syntax of a parameter is: $
{parametername|defaultvalue|guiname}. The defaultvalue and the guiname are optional.
Parameter-names cannot contain whitespace characters.
When a report has parameters associated with it, it is possible to edit the values of the parameters before
each report execution. Parameter values are stored in the current user context, which means edited values
are available only to the user who performs the edits. When parameter values are not specified for a given
report execution, the default values from the report definition are used.
Using the Usage list box, you can select the usage type of a parameter. The possible values are
constant value, start time, and end time. start time and end time are used for reports that
query for a specific date range.
When a report has subreports assigned to it, the parameters of those subreports are also shown in the
Parameters page and the values are stored only within the context of the selected report. For example, the
values are only used in conjunction with the current subreport configuration. When creating new reports,
parameters are the values that are defined on the Create New Report dialog box in the Selection criteria
area.
Report Data Page
Reports > Details View > Data
The Data page serves as a read-only result preview that shows the results of the selected report a
dynamic grid with sorting and filtering capabilities. The visible data can be exported to Excel with the
Download Data (.xlsx) button.
You can access the requirements, tests, execution plans, and Issue Manager issues that you query for
directly from the results list in the Data page. To do so, your query must include the column ProjectID
and the respective ID of the element that you want to link to.
ID
Description
RequID
Query for this column to enable a link to requirements on the Data page of a report.
TestDefID Query for this column to enable a link to tests on the Data page of a report.
ExecDefID Query for this column to enable a link to execution plans on the Data page of a report.
DefectID
Query for this column to enable a link to Issue Manager issues on the Data page of a report.
If the query's result includes both the ProjectID and either of RequID, TestDefID, ExecDefID, or
DefectID using exactly these terms as column names, the Data page will display the values in the
element ID's column as a link.
322
| Silk Central 15.5
Report Page
Reports > Details View > Report
The Report page is used to display data as a formatted report. If you have not yet assigned a template for
your report, you can select one in the Report page.
A list box provides a selection of all available report templates. In addition to many system-installed
templates, any custom report templates that were uploaded from Administration > Report Templates are
also available here.
You can also download an existing template by clicking the Properties tab, and then clicking the download
link that corresponds to the report format you are working with. From there you can customize the template
to your needs.
Note: Reports are cached to improve the performance of reporting. Click Update to update the report
data immediately.
Project Overview Report
Reports > Project Overview Report
Displays the Project Overview Report, which offers a high-level overview of the status of the selected
project. The Project Overview Report includes the following sections:
Section
Description
General Report Information
General information like the name of
the current project, the report
description, and the planned release
date.
Requirements
Test coverage status for
requirements. Shows the percentage
of test coverage in tabular and graph
format both all requirements and
requirements with high priority.
Tests
Test-type distribution and testexecution results in chart and tabular
form for tests.
Issues
The amount of found, fixed, deferred,
and currently open in the backlog
issues, that are linked to tests, in
tabular and graph format.
Code Analysis
The goal of conventional code coverage is to deliver information about what code is covered by tests. This
approach is typically used to gain code-coverage information for unit tests. The code-analysis functionality
in Silk Central goes well beyond this, delivering data for unit, functional, and load tests, both automated
and manual, in managed environments. Code coverage measurements are utilized to track test progress
and guide test planning. This innovative approach in Silk Central to code coverage draws on the
relationship between specific tests and the code they test. This approach enables you to perform impact/
dependency analysis of code changes from the testing perspective. It also assists you in optimizing your
testing, by helping you identify the test runs that are most relevant to a specific code change.
The Code Analysis unit offers code-coverage data for AUT (Applications Under Test), packages/
namespaces, classes, methods, and statements, enabling you to perform test-impact analysis, which
Silk Central 15.5
| 323
determines the tests that should be run in response to specific code changes, and effort analysis, which
determines how many hours of automated testing and manual testing are required to adequately cover
specific code changes. Each of these code-analysis tasks can be addressed by running pre-configured
reports. The unit features a navigation tree that lists all products that have been created for the selected
project. You can drill down into products to select specific versions, and at the deepest level, specific
builds.
Enabling Code Analysis
You must configure Silk Central to gather code coverage data from an application under test. You can
configure any number of execution plans listed in Executions > Details View > Deployment.
Tip: Make sure that only code coverage-enabled tests access your application under test and that no
parallel tests are executed. This ensures that the code coverage data is correct and that it can be
assigned to a specific test later.
Java Code Analysis Options
To use Java Code Analysis for an AUT, you have to run the JVM of the AUT with a Java Agent. The Java
Runtime Environment (JRE) version 5 or higher is required. You can use the following options for all
supported Java versions:
Option
Description
port=19129
Optional: Port of code coverage service. When no port is specified the port 19129 is used
coveragepath=[path1], Pathes to the .jar files that are covered by the agent. If parts of a path contain whitespaces
[path2], ...
have to use quotes. For example: coveragepath="C:\Program Files\YourApplic
If a folder is specified, the agent recursively looks for all .class files in this folder. If a folder
trailing wildcard is specified, the agent looks for .jar files in this folder. Running the agent w
specifying a coveragepath is not valid.
java -javaagent:agent.jar=coveragepath="C:Program Files\YourApplic
Aut.jar
includes=[package1]:
[package2]:
[package3]: ...
Optional: Only packages that match these packages are considered for coverage. Wildcar
allowed for specifying the included packages.
java -javaagent:agent.jar=includes=com.borland.* AUT.jar
excludes=[package1]:
[package2]:
[package3]: ...
Optional: Packages that are specified in the excludes option are ignored for code coverag
Wildcards (*) are allowed for specifying the excluded packages.
java javaagent:agent.jar=includes=com.borland.*;excludes=com.borland.in
AUT.jar
Note: When both inclusions and exclusions are specified in the filters, the exclusion
evaluated first. If a class is both included and excluded through filters, this class will
excluded and no coverage data is generated for this class. If the filter option is not s
coverage data is generated for all used classes, unless the coverage path option is s
which case coverage data is generated for all classes in the coverage path.
Java Code Analysis Example
Example for Windows:
"<java_home_directory>\bin\java" javaagent:agent.jar=port=19129;
coveragepath=C:\dev\deploy\lib\library1.jar,C:\dev\deploy\lib
\library2.jar;
includes=com.borland.*;excludes=com.borland.internal.*
com.borland.MyApplication
324
| Silk Central 15.5
Example for Linux (including quotation marks):
"<java_home_directory>/bin/java" javaagent:agent.jar="port=19129;
coveragepath=/tmp/dev/deploy/lib/library1.jar,/tmp/dev/
deploy/lib/library2.jar;
includes=com.borland.*;excludes=com.borland.internal.*"
com.borland.MyApplication
.NET Code Analysis
Note: Silk Central does not support .NET code analysis for Windows 8 or Windows Server 2012.
.NET Code Analysis and Manual Testing
The following sections detail the required steps to install and use the DevPartner .NET code coverage
components shipped with Silk Central. The example below will get you started by using manual testing and
a single AUT. If you plan to use automated testing, first read and understand the steps below, and then see
the topic titled .NET Code Analysis and Automated Testing .
Note: In order to use the Silk Central/.NET code coverage functionality, the Silk Central - DevPartner
components must be used. The Silk Central-DevPartner components cannot be installed on
machines that have DevPartner 10.1 or below previously installed. Silk Central does not support .NET
code analysis for Windows 8 or Windows Server 2012.
Note: .NET code analysis requires the PDB files generated at compile time of the .NET application
under test (AUT) to be located in the same directory as the AUT's executable(s). If the PDBs for the
AUT are not available, it is not possible to leverage the .NET code analysis functionality.
Manual Testing Workflow
Installing the Windows Code Analysis Framework and DevPartner Analytics
1. Go to the machine that hosts the application to test.
2. Open Silk Central.
3. Go to Help > Tools and click Windows Code Analysis Framework. This will prompt a download of
CAFramework.exe. CAFramework.exe includes the installation for the Code Analysis
Framework and the DevPartner Analytics package.
Silk Central 15.5
| 325
Note: Multiple execution servers running tests against the same Code Analysis Framework at the
same time is not supported.
4. Double click the download file to start the installation. Walk-through the installation of the Windows
Code Analysis Framework. At the end of the installation, you will be prompted to install
DevPartner Analytics. Ensure that the DevPartner Analytics Installation check box is checked
on the appropriate installation screen and install this component. At the end of this installation, all
required files are installed and the proper service is started. The name of the service is Silk Central
Code Analysis Service.
Configuring DPAnalysis to launch Your AUT
1. Create a .BAT file that points to DPAnalysis.exe. An example would be:
"C:\Program Files\Micro Focus\DevPartner\Analysis\dpanalysis.exe" /cov /
USE_AUTOMATION_INTERFACE
/W "C:\Common\Development\MYAPP"
/P "C:\Common\Development\MYAPP\MyApp.exe"
2. For readability, the example above is on multiple lines. Your .BAT file should be on one line. Make the
following modifications:
a) Ensure that the first line is your installation path to dpanalysis.exe. The two switches are
mandatory.
b) The second line contains a mandatory switch and needs to include the path to your executable and
PDBs.
c) The third line contains a mandatory switch and needs to include the absolute path to your test
application and the application name.
3. Double-click the .BAT file to have DPAnalysis launch your application.
For more information on running DPAnalysis.exe, see the topic titled Using DpAnalysis.exe. That topic
and related topics contain information on additional switches and how to use a configuration file if you have
multiple applications to test.
Configuring Silk Central for Code Analysis
1. In the menu, click Execution Planning > Details View.
2. Open an existing execution plan that contains a manual test with steps to test functionality for your
AUT.
3. Click the Deployment tab.
4. Under Code Analysis Settings, click Edit to view the Edit Code Analysis Settings dialog box.
5. Ensure that Enable Code Analysis is checked.
6. Select DevPartner .NET Code Analysis from the Code Analysis Profile list.
7. For the Hostnames field, type in the host name followed by colon and the port number. For example:
localhost:19129.
The default code analysis framework port is 19129. You can configure the code analysis framework to
run at a given port using the following xml file: <install dir>\Code Analysis
\CodeAnalysisConfig.xml
8. Click OK.
9. Run the test by clicking Run in the Execution area.
10.On the Run dialog box, ensure that All Tests is checked.
11.In the Set build for execution plan, select the proper build for your execution plan.
12.Click OK.
326
| Silk Central 15.5
.NET Code Analysis and Automated Testing
This section describes two scenarios that you may encounter when executing your tests that use code
coverage. It also provides proper ways to structure your tests within an execution plan.
The examples used in the following topics are specific to DevPartner Code Analysis, but the structure is
similar for other code analysis tools. For example, you will have different startup/cleanup parameters in
your execution plan.
Automated Testing Workflow
Configuring One or More Tests with One AUT
If you have the scenario where you have one or more tests in a single execution plan and they test against
a single application under test, you should structure your testing as follows:
1. Create a ProcessExecutor test that will start your code analysis application.
The ProcessExecutor Argument List should start your code analysis program. For example: start
cmd /c start cmd /c D:\sctm\dps\startDPS_Simple1.bat, where
startDPS_Simple1.bat contains:
"C:\Program Files\Micro Focus\DevPartner\Analysis\dpanalysis.exe"
/cov
/USE_AUTOMATION_INTERFACE
/O "D:\SCTM\temp"
/W "D:\SCTM\DPS\TESTAPP\SCTMCodeAnalysisTestApp\bin\Debug"
/P "D:\SCTM\DPS\TESTAPP\SCTMCodeAnalysisTestApp\bin\Debug
\SCTMCodeAnalysisTestApp.exe"
2. Create an execution plan.
3. Click Executions > Details View, select an execution plan and click the Setup/Cleanup tab.
4. Add the previously created test as the Setup Test.
5. Add a test to the execution plan that automates your application under test with an automated testing
tool.
6. Optional: Add another test to the execution plan that automates your application under test with an
automated testing tool.
7. Create a ProcessExecutor test.
8. Click Executions > Details View, select an execution plan and click the Setup/Cleanup tab.
Silk Central 15.5
| 327
9. Add the previously created test as the Cleanup Test.
The ProcessExecutor Argument List should close your program: start cmd /c taskkill /IM
SCTMCodeAnalysisTestApp.exe.
Configuring One or More Tests with Multiple AUTs
If you have the scenario where you have one or more tests in a single execution plan and they test against
multiple AUTs, you should structure your testing as follows:
1. Create a ProcessExecutor test that will start your code analysis application.
The ProcessExecutor Argument List should start your code analysis program. For example: start
cmd /c start cmd /c D:\sctm\dps\two_app_dps.cmd, where two_app_dps.cmd contains:
"C:\Program Files\Micro Focus\DevPartner\Analysis\dpanalysis.exe"
/config D:\SCTM\DPS\configuration_file.xml
and configuration_file.xml contains:
<?xml version="1.0" ?>
<ProductConfiguration>
<RuntimeAnalysis Type="Coverage" MaximumSessionDuration="1000"
NoUIMsg="true" />
<Targets RunInParallel="true">
<Process CollectData="true" Spawn="true" NoWaitForCompletion="true"
NM_USE_AUTOMATION_INTERFACE="1" >
<AnalysisOptions NM_USE_AUTOMATION_INTERFACE="1" NO_MACH5="1"
NM_METHOD_GRANULARITY="1" SESSION_DIR="c:\temp" />
<Path>D:\SCTM\DPS\SCTMCodeAnalysisTestApp
\SCTMCodeAnalysisTestApp\
SCTMCodeAnalysisTestApp\bin\Debug\SCTMCodeAnalysisTestApp.exe</
Path>
<Arguments></Arguments>
<WorkingDirectory>D:\SCTM\DPS\SCTMCodeAnalysisTestApp
\SCTMCodeAnalysisTestApp\
SCTMCodeAnalysisTestApp\bin\Debug</WorkingDirectory>
</Process>
<Process CollectData="true" Spawn="true" NoWaitForCompletion="true"
>
<AnalysisOptions NM_USE_AUTOMATION_INTERFACE="1" NO_MACH5="1"
NM_METHOD_GRANULARITY="1" SESSION_DIR="c:\temp" />
<Path>D:\SourceCode\SVNQAD\Development\Development\SOURCECODE\
QADSCTMMigration\bin\QADSCTMMigration.exe</Path>
<Arguments></Arguments>
<WorkingDirectory>D:\SourceCode\SVNQAD\Development\Development\
SOURCECODE\QADSCTMMigration\bin</WorkingDirectory>
</Process>
</Targets>
</ProductConfiguration>
2. Create an execution plan.
3. Click Executions > Details View, select an execution plan and click the Setup/Cleanup tab.
4. Add the previously created test as the Setup Test.
5. Add a test to the execution plan that automates your first application under test with an automated
testing tool.
6. Add another test to the execution plan that automates your second application under test with an
automated testing tool.
7. Create a ProcessExecutor test.
8. Click Executions > Details View, select an execution plan and click the Setup/Cleanup tab.
9. Add the previously created test as the Cleanup Test.
328
| Silk Central 15.5
The ProcessExecutor Argument List should close your programs: start cmd /c taskkill /IM
application1.exe /IM Application2.exe.
Using DPAnalysis.exe
DPAnalysis.exe is the DevPartner code coverage application that allows you to profile .NET
applications. The application is started using the command line.
You can use the application with traditional switches as documented in these topics, or you can add an
additional switch that points to a configuration file. You may want to use a configuration file if you have an
exceptionally long command line string or you want to run multiple applications in a single session.
The /USE_AUTOMATION_INTERFACE switch is mandatory. It causes the automation interface
environment needed for the interaction with the framework to be established. It also causes license
checking to be bypassed. This switch does not take any parameters.
Running DPAnalysis.exe from the Command Line
The DevPartner Studio Code Coverage installation includes DPAnalysis.exe, a command line
executable that is installed in the \Program Files\Micro Focus\DevPartner Studio\Analysis\
directory.
Use the following syntax and switches to run the DevPartner Studio Code Coverage tool from the
command line:
DPAnalysis [/Cov] [/USE_AUTOMATION_INTERFACE] [/E|/D|/R]
[/W workingdirectory] [/PROJ_DIR] [/H hostmachine]
[/NOWAIT] [/NO_UI_MSG] [/N] [/F] [/A C:\temp1;C:\temp2]
[/NO_QUANTUM /NM_METHOD_GRANULARITY /EXCLUDE_SYSTEM_DLLS
/NM_ALLOW_INLINING /NO_OLEHOOKS /NM_TRACK_SYSTEM_OBJECTS]
{/P|/S} target [target arguments]
Example
You can use DPAnalysis.exe directly from the command line, using switches to direct the analysis
session. For example, the following command line launches a code coverage session for the application
SCTMCodeAnalysisTestApp.exe.
dpanalysis.exe /cov /USE_AUTOMATION_INTERFACE /W "D:\SCTM
\DPSCoverageIntegration\Test App\
SCTMCodeAnalysisTestApp\SCTMCodeAnalysisTestApp\bin\Debug" /P
"D:\SCTM\DPSCoverageIntegration\Test App\SCTMCodeAnalysisTestApp
\SCTMCodeAnalysisTestApp\bin
\Debug\SCTMCodeAnalysisTestApp.exe"
Switches
Analysis Type Switches
Name
Description
/Cov[erage]
Sets analysis type to DevPartner Coverage Analysis
Note: DPAnalysis.exe does not instrument unmanaged code. To collect performance or coverage
analysis data for an unmanaged application, you must first instrument the application.
Data Collection Switches
Enables or disables data collection for a given target, but does not launch the target. Optional.
Silk Central 15.5
| 329
Name
Description
/E[nable]
Enables data collection for the specified process or service.
/D[isable]
Disables data collection for the specified process or service.
/R[epeat]
Profiling will occur any time you run the specified process until you use the /D switch to
disable profiling.
Other Switches
These switches are optional.
Name
Description
/W[orkingDir]
Specify the working directory for the target process or service.
/PROJ_DIR
Specify directory of DevPartner Studio project, used to locate playlists, etc.
/N[ewconsole]
Run the process in its own command window. If you use DPAnalysis.exe to analyze
a console application that requires keyboard input, you must use the /NewConsole switch
to open a console window to accept the input.
/INCLUSION_FILTER The /INCLUSION_FILTER switch is optional and allows an Inclusion Filter file to be
<filterFile>
specified. This file is used when the coverage data is provided to the framework in the
Silk Central-specific XML format. It causes the report generation program to filter out all
classes that are not specified in the filter file. This switch takes a single parameter as
shown here.
/INCLUSION_FILTER <filterFile>
where <filterFile> is the fully-qualified path of the filter file to be used for the
duration of the program.
The sample Inclusion_Filter file below is a simple XML file that contains the set of classes
to be included in the generated report. It also contains a value, <filterClasses>, which
indicates whether the filter is to be applied.
<?xml version="1.0" encoding="utf-8"?>
<!--D:\Public\SCTM Work\ProdAPI_Tester_CSharp_LINES.dpcov->
<inclusionInfo>
<filterClasses>false</filterClasses>
<includedClass>MicroFocus.Products.Tools.TCS_TraceMechanism
.CTCS_MsgStream</includedClass>
<includedClass>MicroFocus.Products.Tools.TCS_TraceMechanism
.CTCS_RecvTask</includedClass>
<includedClass>MicroFocus.Products.Tools.TCS_TraceMechanism
.CTCS_TimeStamp</includedClass>
<includedClass>MicroFocus.Products.Tools.TCS_TraceMechanism
.CTCS_Tracer</includedClass>
<includedClass>MicroFocus.Products.Tools.TCS_TraceMechanism
.CMsgRegisterClientReqMB</includedClass>
</inclusionInfo>
/A[ssembly_dir]
330
| Silk Central 15.5
For coverage analysis only. A list of paths that contain referenced DLL/PDB files. Use
this switch to specify any referenced but not loaded DLL/PDB files to display in a
coverage session file. Separate multiple paths with a semicolon (;).
Analysis Options
Example of the analysis options is:
<AnalysisOptions NM_USE_AUTOMATION_INTERFACE="1" NO_MACH5="1"
NM_METHOD_GRANULARITY="1" SESSION_DIR="c:\temp" />
Column
Type
/NM_USE_AUTOMATION_INTERFACE
A required switch in the analysis options section of the coniguration
file. The value must equal "1".
/NO_QUANTUM
Disables excluding time spent on other threads.
/NM_ALLOW_INLINING
Enable run-time instrumentation of inline methods (Coverage and
Performance only).
/NO_OLEHOOKS
Disable collection of COM.
Target Switch
Identifies target to follow as either a process or service. Required. Pick only one. All arguments that follow
the target name or path will be arguments to the target.
Name
Description
/P[rocess]
Specify a target process (followed by arguments to process)
/S[ervice]
Specify a target service (followed by arguments to service)
/C[onfig]
Path to configuration file
DPAnalysis Configuration File
To manage analysis sessions with an XML configuration file, run DPAnalysis.exe from the command
line with the /config switch and a properly structured XML configuration file as its target. For example:
dpanalysis.exe /config c:\temp\configuration_file.xml
By using a configuration file, you can profile and manage multiple processes or services. The ability to
profile multiple processes can be especially useful for analyzing Web applications.
Sample Configuration File
<?xml version="1.0" ?>
<ProductConfiguration>
<RuntimeAnalysis Type="Coverage" MaximumSessionDuration="1000"
NoUIMsg="true" />
<Targets RunInParallel="true">
<Process CollectData="true" Spawn="true" NoWaitForCompletion="true"
NM_USE_AUTOMATION_INTERFACE="1" >
<AnalysisOptions NM_USE_AUTOMATION_INTERFACE="1" NO_MACH5="1"
NM_METHOD_GRANULARITY="1" SESSION_DIR="c:\temp" />
<Path>D:\SCTM\DPS\SCTMCodeAnalysisTestApp
\SCTMCodeAnalysisTestApp\
SCTMCodeAnalysisTestApp\bin\Debug\SCTMCodeAnalysisTestApp.exe</Path>
<Arguments></Arguments>
<WorkingDirectory>D:\SCTM\DPS\SCTMCodeAnalysisTestApp
\SCTMCodeAnalysisTestApp\
SCTMCodeAnalysisTestApp\bin\Debug</WorkingDirectory>
</Process>
<Process CollectData="true" Spawn="true" NoWaitForCompletion="true"
>
<AnalysisOptions NM_USE_AUTOMATION_INTERFACE="1" NO_MACH5="1"
NM_METHOD_GRANULARITY="1" SESSION_DIR="c:\temp" />
<Path>D:\SourceCode\SVNQAD\Development\Development\SOURCECODE
Silk Central 15.5
| 331
\QADSCTMMigration\bin\QADSCTMMigration.exe</Path>
<Arguments></Arguments>
<WorkingDirectory>D:\SourceCode\SVNQAD\Development\Development
\SOURCECODE\QADSCTMMigration\bin</WorkingDirectory>
</Process>
</Targets>
</ProductConfiguration>
AnalysisOptions Element
Attributes that work with AnalysisOptions vary depending on the type of analysis session you run.
Note: DPAnalysis.exe ignores attributes mismatched with the type of analysis.
<AnalysisOptions
SESSION_DIR = "c:\MyDir"
SESSION_FILENAME = "myfile.dpcov"
NM_METHOD_GRANULARITY = "1"
EXCLUDE_SYSTEM_DLLS = "1"
NM_ALLOW_INLINING = "1"
NO_OLEHOOKS = "1"
NM_TRACK_SYSTEM_OBJECTS = "1"
NO_QUANTUM="1"
NO_MACH5 = "1"
FORCE_PROFILING = "1"
ASSEMBLY_DIR = "C:\TEMP1;C:\TEMP2"
/>
SESSION_DIR
Optional. Use with Coverage, Memory, Performance, and Performance Expert. Specify a directory for
saving the session file generated by the profiled target. Without this attribute, the resulting session file will
be placed in the user's My Documents directory. If both SESSION_DIR and SESSION_FILENAME are
absent, DPAnalysis.exe prompts you for the save location at the end of the session.
SESSION_FILENAME
Optional. Use with Coverage, Memory, Performance, and Performance Expert. Specify a session name for
the session file generated for this target. Without this attribute, DPAnalysis.exe creates a unique name
by combining the target's image name with a number (for example, iexplore1.dpprf). If you specify a
name but no directory, the file will be placed in user's My Documents directory. If both
SESSION_FILENAME and SESSION_DIR are absent, DPAnalysis.exe prompts you for the save
location at the end of the session.
NM_METHOD_GRANULARITY
Optional. Use with Performance to set data collection granularity to method-level (line-level is default).
Specify a value of 1 to set the attribute. Omitting the attribute disables it.
EXCLUDE_SYSTEM_DLLS
Optional. Use with Performance to exclude system images. Specify a value of 1 to set the attribute.
Omitting the attribute disables it.
NM_ALLOW_INLINING
Optional. Use with Coverage and Performance to specify level of analysis detail. Enables run-time
instrumentation of inline methods. Equivalent to the Instrument Inline Functions property. Specify a value
of 1 to instrument inline functions. Omit the attribute to disable it.
332
| Silk Central 15.5
NO_OLEHOOKS
Optional. Use with Performance analysis to activate tracking of system objects. Specify a value of 1 to set
the attribute. Omitting the attribute disables it.
NM_TRACK_SYSTEM_OBJECTS
Optional. Use with Memory analysis to ignore system or third-party object allocations when tracking
allocated objects. Specify a value of 1 to set the attribute. Omitting the attribute disables it. The default
state (disabled) enables you to see memory allocations made when your application uses system or other
non-profiled resources.
NO_QUANTUM
Optional. Use with Performance and Performance Expert analysis to exclude time spent in threads of other
running applications. Specify a value of 1 to set the attribute. Omitting the attribute disables it.
FORCE_PROFILING
Optional. Use with Performance and Coverage analysis to force profiling of applications written without
managed code or DevPartner Native C/C++ Instrumentation. Specify a value of 1 to set the attribute.
Omitting the attribute disables it.
ASSEMBLY_DIR
Optional. Use with coverage analysis to specify the absolute path(s) containing referenced but not loaded
assemblies to be shown in the Coverage session file. Separate multiple locations with a semicolon.
Omitting the attribute disables it.
Element Information
Number of Occurrences
0 or 1 per Process or Service.
Parent Elements
Process, Service
Contents
None
Remarks
Optional. Defines run time attributes for the specified target process or service. Attributes correspond to
DevPartner Coverage, Memory, and Performance properties accessible from the Properties Window in
Visual Studio.
Example
The following example shows a construction using AnalysisOptions within a Service.
<Service CollectData="true">
<AnalysisOptions NM_METHOD_GRANULARITY="1" EXCLUDE_SYSTEM_DLLS="1"
NM_ALLOW_INLINING="1"
NO_OLEHOOKS="1" ASSEMBLY_DIR="C:\TEMP">
</Service>
Arguments Element
Syntax
<Arguments>/arg1 /arg2 /arg3</Arguments>
Silk Central 15.5
| 333
Attributes
None
Element Information
Number of Occurrences
0 or 1 per Process or Service.
Parent Elements
Process, Service
Contents
None
Remarks
Optional. No default if omitted. Arguments to be passed to the target process or service.
Example
The following example uses Arguments within a Process element.
<Process CollectData="true">
<Arguments>/arg1 /agr2 /arg3</Arguments>
</Process>
ExcludeImages Element
Syntax
<ExcludeImages>
<Image>ClassLibrary1.dll</Image>
<Image>ClassLibrary2.dll</Image>
</ExcludeImages>
Attribues
None.
Element Information
Number of Occurrences
0 or 1 per Process or Service.
Parent Elements
Process, Service
Contents
Image
Remarks
Optional. No default if omitted. Provide a list of at least one image (no maximum) which, if loaded by the
target process or service, will not be profiled.
Example
The following example shows a construction using ExcludeImages within a Process element. Note the
Image elements contained within ExcludeImages.
<Process CollectData="true">
<ExcludeImages>
<Image>ClassLibrary1.dll</Image>
<Image>ClassLibrary2.dll</Image>
</ExcludeImages>
</Process>
334
| Silk Central 15.5
Host Element
Syntax
<Host>hostmachine</Host>
Attributes
None.
Element Information
Number of Occurrences
0 or 1 per Process or Service.
Parent Elements
Process, Service.
Contents
Name of the host machine.
Remarks
Optional. No default if omitted. Sets the host machine of the target process or service.
Example
The following example shows a construction using Host within a Service. Note that the example includes
the required Name element.
<Service CollectData="true">
<Name>ServiceApp</Name>
<Host>remotemachine</Host>
</Service>
Name Element
Syntax
<Name>MyServiceName</Name>
Attributes
None.
Element Information
Number of Occurrences
1.
Parent Elements
Service.
Contents
Service name.
Remarks
Required. The name of the service as registered with the service control manager. This is the same name
you would use for the system's NET START command.
Example
The following example shows a construction using Name within a Service.
<Service CollectData="true">
<Name>ServiceApp</Name>
</Service>
Silk Central 15.5
| 335
Path Element
Syntax
<Path> c:\MyDir\target.exe </Path>
Attributes
None.
Element Information
Number of Occurrences
1.
Parent Elements
Process.
Contents
Path to the executable.
Remarks
Required. Specify a fully qualified or relative path to the executable. You can specify the executable name
without the path if the executable exists in the current directory.
Example
The following example shows a construction using Path within a Process element.
<Process CollectData="true">
<Path>ClientApp.exe</Path>
</Process>
Process Element
Syntax
<Process CollectData="true or false"
Spawn="true or false"
NoWaitForCompletion="true or false"
NewConsole="true or false"
RepeatInjection="true or false"> ...
</Process>
Attributes
Profiling will occur any time you run the specified process until you use the /D switch to disable profiling.
CollectData
Optional. Specify true or false. Defaults to true if omitted. Specifies whether
profiling will be enabled for the target process.
Spawn
Optional. Specify true or false. Defaults to true if omitted. Specifies if
DPAnalysis.exe will spawn the specified target. Do not set to true for
aspnet_wp.exe or w3wp.exe. DevPartner cannot spawn the ASP.NET worker
process directly. Launch the ASP.NET worker process by opening the target
Web page.
NoWaitForCompletion Optional. Specify true or false. Defaults to false if omitted. The default is to
wait until the process has completed. If set to true, causes DPAnalysis.exe
to wait only until the target has started executing. DPAnalysis.exe will not
wait for processes on remote machines (using the Host element). The
336
| Silk Central 15.5
MaximumSessionDuration attribute in the RuntimeAnalysis element
overrides NoWaitForCompletion.
NewConsole
Optional. Specify true or false. Defaults to false if omitted. Causes
DPAnalysis.exe to run the target in its own console window. The default is to
use the same console that you typed the DPAnalysis.exe command line in. If
you use DPAnalysis.exe to analyze a console application that requires
keyboard input, you must use the /NewConsole switch to open a console
window to accept the input.
RepeatInjection
Optional. Specify true or false. Defaults to false if omitted. Causes
DPAnalysis.exe to profile the target in every time it runs until you explicitly
specify false.
Element Information
Number of Occurrences
1 or more.
Parent Elements
Target.
Contents
AnalysisOptions, Path, Arguments, WorkingDirectory, ExcludeImages.
Remarks
Specifies a target executable.
Example
The following example shows a construction using Process and includes AnalysisOptions, Path,
Arguments, and WorkingDirectory tags.
<Targets RunInParallel="true">
<Process CollectData="true" Spawn="true" NoWaitForCompletion="true"
NewConsole="true">
<AnalysisOptions NO_MACH5="1" NM_METHOD_GRANULARITY="1" SESSION_DIR="c:
\MyDir" />
<Path>ClientApp.exe</Path>
<Arguments>/arg1 /agr2 /arg3</Arguments>
<WorkingDirectory>c:\temp</WorkingDirectory>
</Process>
</Targets>
RuntimeAnalysis Element
Syntax
<RuntimeAnalysis Type="Coverage" NoUIMsg="false"
NM_INCLUSION_FILTER="Q:\AppDir\InclusionFilter.xml">
Attributes
Type
Required: Possible choices are: Performance; Coverage; Memory; or
Expert. Specifies the analysis types for all targets listed.
MaximumSessionDuration Optional: If omitted, no default used. If specified, DPAnalysis.exe will
limit a session run for this amount of time. For example, if you specify
MaximiumSessionDuration="60" and then begin profiling a service
(with RestartAtEndOfRun="true" for the service), after 60 seconds,
DPAnalysis.exe will stop the service and then restart the service.
Silk Central 15.5
| 337
NoUIMsg
Optional: If omitted, false is used by default. If set to true
DPAnalysis.exe suppresses all UI error messages that may appear
during the duration of the session. Setting this to true is useful when
sessions are run unattended or when running a large number of
consecutive tests.
NM_INCLUSION_FILTER
Optional: Allows an Inclusion Filter file to be specified. This file is used
when the coverage data is provided to the framework in the Silk Centralspecific XML format. It causes the report generation program to filter out all
classes that are not specified in the filter file. This switch takes a single
parameter.
Element Information
Number of Occurrences
1.
Parent Elements
ProductConfiguration.
Contents
None.
Remarks
Required. Defines the type of analysis and maximum session time.
Example
The following example shows a construction using RuntimeAnalysis following a ProductConfiguration tag.
In this example, the Type attribute specifies a performance analysis with a maximum duration of 1000
seconds and suppression of UI error messages.
<?xml version="1.0" ?>
<ProductConfiguration xmlns="http://www.microfocus.com/products">
<RuntimeAnalysis Type="Performance" MaximumSessionDuration="1000"
NoUIMsg="true"/>
Service Element
Syntax
<Service
CollectData = "true or false"
Start = "true or false"
RestartIfRunning = "true or false"
RestartAtEndOfRun = "true or false"
RepeatInjection = "true or false"
>
...
</Service>
Attributes
338
CollectData
Optional. Specify true or false. Defaults to true if omitted. Specifies whether
profiling will be enabled for the target service.
Start
Optional. Specify true or false. Defaults to true if omitted. Specifies if
DPAnalysis.exe will start the specified target. If set to false, profiling will be
enabled for this target but it will not be started; profiling will begin the next time the
service is started (by whatever means).
| Silk Central 15.5
RestartIfRunning
Optional. Specify true or false. Defaults to false if omitted. When you set
RestartIfRunning to true, DPAnalysis.exe will attempt to restart the specified
service if it is running on the host computer.
RestartAtEndOfRun Optional. Specify true or false. Defaults to false if omitted. When you specify
true, DPAnalysis.exe will attempt to restart the service (generating a session
file) at the end of the run. If the service is the only process to be profiled, set this
attribute to false.
RepeatInjection
Optional. Specify true or false. Defaults to false if omitted. Causes
DPAnalysis.exe to profile the target in every time it runs until you explicitly
specify false.
Element Information
Number of Occurrences The configuration file must contain at least 1 Process or 1 Service element.
Parent Elements
Targets.
Contents
AnalysisOptions, Path, Arguments, Working Directory, ExcludeImages, Name,
Host.
Remarks
Specifies a target service.
Example
The following example shows a construction using Service within a Targets element.
<Targets RunInParallel="true">
<Service CollectData="true" Start="true" RestartIfRunning="true"
RestartAtEndOfRun="true">
<Name>ServiceApp</Name>
</Service>
</Targets>
Targets Element
Syntax
<Targets RunInParallel="true or false">
</Targets>
...
Attributes
RunInParallel Optional. Specify true or false. Defaults to true if omitted. If you specify more than
one target, defines how the targets are run. When RunInParallel is true, DPAnalysis
starts the target processes and services one right after the other; multiple targets will run
at the same time (parallel). Otherwise, DPAnalysis starts target N + 1 only after process
N has launched and exited; targets run one at a time (serial).
Element Information
Number of Occurrences
1.
Parent Elements
RuntimeAnalysis.
Silk Central 15.5
| 339
Contents
Process, Service.
Remarks
Required. Begins a block of one or more <Process> or <Service> entries. Target processes and
services are started in the order they are listed in the configuration file.
Example
The following example shows a construction using Targets to specify analysis of one <Service> and two
<Process> elements. Note that RunInParallel is true so that, for this example, the targets would run in
parallel.
<Targets RunInParallel="true">
<Service CollectData="true" Start="true">
<AnalysisOptions NM_METHOD_GRANULARITY="0" EXCLUDE_SYSTEM_DLLS="1" />
<Name>ServiceApp</Name>
<Host>remotemachine</Host>
</Service>
<Process CollectData="true" Spawn="true" NoWaitForCompletion="true">
<AnalysisOptions NO_MACH5="1" NM_METHOD_GRANULARITY="1" SESSION_DIR="c:
\MyDir" />
<Path>ClientApp.exe</Path>
<WorkingDirectory>c:\temp</WorkingDirectory>
</Process>
<Process CollectData="true" Spawn="true" NoWaitForCompletion="true">
<AnalysisOptions NO_MACH5="1" NM_METHOD_GRANULARITY="1" SESSION_DIR="c:
\MyDir" />
<Path>TestApp02.exe</Path>
<WorkingDirectory>c:\temp</WorkingDirectory>
</Process>
</Targets>
WorkingDirectory Element
Syntax
<WorkingDirectory> c:\MyWorkingDir </WorkingDirectory>
Attributes
None.
Element Information
Number of Occurrences
1 per Process or Service.
Parent Elements
Process, Service.
Contents
Path to the target directory.
Remarks
Optional. No default if omitted. Set the working directory of the target process or service.
340
| Silk Central 15.5
Example
The following example shows a construction using WorkingDirectory nested within a parent Process
element.
<Process CollectData="true">
<WorkingDirectory>c:\temp</WorkingDirectory>
</Process>
Enabling Code Analysis for Execution Plans
To enable code analysis for an execution plan:
1. In the menu, click Execution Planning > Details View.
2. In the Execution tree, select an execution plan.
3. Click the Deployment tab.
4. In the Code Analysis Settings section of the Deployment page, click Edit. The Edit Code Analysis
Settings dialog box displays.
5. Check the Enable code analysis check box.
6. Select a profile from the Code Analysis Profile list box.
7. In the Hostnames text box, enter a comma-separated list of host names, with port, if default port 19129
is not used, from which code analysis information is to be gathered.
For example labmachine1, labmachine2:8000, 198.68.0.1. For each execution plan, you
need to define the host names of the machine resources where the AUT is running. For example, with a
client/server system, you must not only gather code coverage information on the client, which probably
runs directly on an execution server, but also on the server, which likely runs on a different machine.
This applies to all multi-tiered applications.
Note: For JUnit code analysis runs, you do not need to specify a hostname.
8. Click OK to save your settings.
Note: Once code analysis has been defined for an execution plan, each future run of that execution
plan will gather code coverage information from the defined host names. While monitoring an
execution on the Activities page, you will see that after gathering the sources for tests, Silk Central
gathers full code coverage information before beginning test runs. The Code Coverage Controller,
which is integrated into each Silk Central execution server, controls all defined hosts during execution
runs. For each test of an execution plan, the controller starts and stops all associated instances,
collects XML-based code coverage files for the test, and merges the results into a single file. The test
then saves the merged code coverage file to its execution results.
Code Analysis Details Page
Reports > Code Analysis > Details
The Details page displays code-coverage information for selected products, versions, and builds at the
product, package, and class levels.
Product level view displays a list of covered and not-covered packages for specific products and product
builds. By clicking a package name in Product view you can drill down to view code-coverage information
for the classes that are included in that package.
Product view displays the following attributes for a selected product:
Attribute
Description
Name
Product name
Statements
Total amount of statements
Silk Central 15.5
| 341
Attribute
Description
Packages/Namespaces
Histogram bar view that includes the following figures:
•
•
•
Classes
Histogram bar view that includes the following figures:
•
•
•
Methods
Total percentage of packages/namespaces that are
covered
Number of covered packages/namespaces, in green
Number of uncovered packages/namespaces, in red
Total percentage of classes that are covered
Number of covered classes, in green
Number of uncovered classes, in red
Histogram bar view that includes the following figures:
•
•
•
Total percentage of methods that are covered
Number of covered methods, in green
Number of uncovered methods, in red
Package level view displays a list of covered and not-covered classes for specific products and product
builds. By clicking a class name in Package view you can drill down to view code-coverage information for
the methods that are included in that class.
Package view displays the following attributes for each package in the selected product, across multiple
rows:
Attribute
Description
Package
Package name
Statements
Total statements
Classes
Histogram bar view that includes the following figures:
•
•
•
Methods
Total percentage of classes that are covered
Number of covered classes, in green
Number of uncovered classes, in red
Histogram bar view that includes the following figures:
•
•
•
Total percentage of methods that are covered
Number of covered methods, in green
Number of uncovered methods, in red
Class level view displays a list of covered and not-covered methods for specific products and product
builds.
Class view displays the following attributes for each method, across multiple rows:
Attribute
Description
Name
Method name
Signature
Method signature
Statements
Total statements
Covered
Covered status of method:
•
342
| Silk Central 15.5
True indicates that the method is covered
Attribute
Description
•
False indicates that the method is not covered
Note: When the page includes more elements than can be displayed at once without impacting
response time, elements are displayed in increments. Page number links at the bottom of the page
allow you to browse through the elements included on the page one page at a time. To display all
elements as a single list, click the [All] link.
Latest Builds and Build Versions
When you select a product in the navigation tree, the list of packages and classes with coverage
information for the latest covered version, which implies the latest covered build for the version, is
displayed automatically. When you select a product version in the navigation tree, coverage information for
the latest covered build of the version is displayed automatically.
Note: If you are running multiple applications against the same build, the coverage from all of the
applications will be merged together.
Note: Code analysis across a range of builds is not supported by Silk Central currently.
Generating Code-Change Impact Reports
To generate a code-change impact report:
1. In the menu, click Projects > Project List.
2. Select the project for which you want to analyze code-coverage data.
3. In the menu, click Reports > Code Analysis.
4. Click Create Code Change Impact Report. The Select Classes for Report dialog box appears.
5. Select a Product and Version if you want to change the pre-selected values.
6. In the Filter field, type criteria to filter the packages/namespaces. For example, entering the string
published will only list packages/namespaces that contain the string published in their names.
7. Select a package from the Packages/Namespaces list.
Use Ctrl+Click or Shift+Click to select multiple packages/Namespaces.
The classes that are available in the selected package/namespace are displayed in the Classes list.
8. In the Classes list, select a class that you want to have included as a source in your report.
Use Ctrl+Click or Shift+Click to select multiple classes.
9. Click Add. The selected classes are added to the Selected classes list.
10.Repeat the preceding steps until you have added all required classes to the Selected classes list.
You can remove classes from the Selected classes list by selecting entries and clicking Remove or by
clicking Remove All.
11.Select a report from the Select report list.
12.Click OK to generate the report.
Select Classes for Report Dialog Box
Reports > Code Analysis > Create Code Change Impact Report
The Select Classes for Report dialog box enables you to select class files to be included as sources in a
Code-Change Impact Report. The dialog box includes the following elements:
Silk Central 15.5
| 343
Element
Description
Product
Name of the product for which code analysis information
is required.
Version
Version of the product for which code analysis
information is required.
Filter
Enter criteria for filtering the packages. For example, if
you type the string published, the Code-Change
Impact Report displays only packages that contain the
string “published” in their names.
Packages/Namespaces
Product packages/namespaces that are specified for
coverage in the selected version.
Classes
All classes included in the selected package.
Add
Click to add the selected classes for code-coverage
analysis.
Selected Classes
Displays the classes that are already selected for codecoverage analysis.
Remove
Click to remove the selected class from the Selected
Classes list box.
Remove All
Click to remove all classes from the Selected Classes
list box.
Select Report
Type of the Code-Change Impact Report.
Viewing Code-Coverage Information for Packages/Namespaces
To view code-coverage information for a package/namespace:
1. In the menu, click Projects > Project List.
2. Select the project for which you want to view code-coverage information.
3. In the menu, click Reports > Code Analysis.
4. In the Code Analysis tree, expand the project node in the navigation tree to display the products that
are available for the selected project.
5. Expand a product node to display the versions that are available for that product.
6. Expand a version node to display the builds that are available for that version.
7. Select a specific build. Code coverage information for the selected build displays on the Details page.
Note: To view code-analysis information for all products click Show all products on the toolbar.
Products of other projects are then listed under the Other Projects node.
Default Reports
Code-Change Impact Reports
The code-change impact reports enable you to perform testing-impact analysis, effort analysis, and risk
analysis. You can select classes of interest and, by applying report templates, generate reports that help
you determine the test impact that changing the selected classes will result in.
For selected classes, you can choose from report templates that analyze the test impact of proposed code
changes.
344
| Silk Central 15.5
Code-Change Impact Report for Tests
This report displays the following columns for each affected test:
•
•
•
•
•
•
•
•
•
•
•
•
•
•
•
Unique key: Test + Execution plan
Project name
Test name
Test hierarchy
Execution plan
Test type
Duration of test
Status of test, cumulative across all runs of build range
Last build executed
# Times executed for this version
# Times passed for this version + # Times failed for this version
Coverage index: Methods covered by the test for the specified classes / total methods of specified
classes.
Time stamp
Test creator
Test executor. Manual tester or execution server
Code-Change Impact Report for Execution Plans
This report is valuable as it identifies the execution plans that need to be re-run following code changes.
This report displays the following columns for each affected execution plan:
•
•
•
•
•
•
•
•
•
•
Project name
Execution plan name
# Manual tests
# Automated tests
# Manual tests in coverage path
# Automated tests in coverage path
Duration of manual tests
Duration of automated tests
Duration of manual tests in coverage path
Duration of automated tests in coverage path
Use Cases for Reports
The following typical code-change impact issues can be addressed with code-change impact reports:
Testing
impact
analysis
You want to know which tests you should run as a result of a specific change to the code.
Effort
analysis
You want to know how many hours of automated and manual testing will be required to
properly cover a particular set of changes to the code.
•
•
•
•
•
•
Select a particular class.
Select and execute the Code Change Impact - Tests report.
Observe the list of tests that cover the classes that were touched in this version.
Select a particular class .
Select and execute the Code Change Impact - Execution Plans report.
Observe the required time (cost) for automated and manual tests.
Silk Central 15.5
| 345
Code Coverage Reports
This section explains the code coverage reports that ship with Silk Central. Code coverage reports offer a
detailed overview of your product's code coverage over a period of time or range of builds.
Code Coverage Trend Report
Shows the improvement trend of code coverage for methods, classes, and packages for a product over a
selected range of builds.
Input Parameters
The input parameters for a code coverage trend report are:
Parameter
Description
product_ProductVersion
Version of the selected product.
BuildFrom
First build in the range of examined builds.
BuildTo
Last build in the range of examined builds.
General Report Information
Element
Description
Report Description
Description of the report.
Report Executed By
User who executed the report.
Product Information
Name, version, and examined build range of the selected product.
Code Coverage Trend Graph
Shows the overall percentage of code coverage for the selected product over the selected range of builds.
Code coverage for specific packages/namespaces, classes, and methods is displayed individually.
Code Coverage Trend Details
Displays the information from the Code Coverage Trend Graph in a tabular format.
Method Coverage Comparison Report
Compares method coverage for all included packages/namespaces across two product builds.
Input Parameters
The input parameters for a method coverage comparison report are:
Parameter Description
Build 1
Number of the first build that is to be compared.
Build 2
Number of the second build that is to be compared.
Product
The examined product.
Threshold The minimum amount of change that results in a package/namespace appearing in the
report. Packages/namespaces with a smaller percentage of change are not shown in the
report. The threshold range is from 0 to 100 percent.
346
| Silk Central 15.5
General Report Information
Element
Description
Project Name
Name of the project.
Report Description
Description of the report.
Report Executed By
User who executed the report.
Product
Name of the selected product.
Build 1
Number of the first build to be compared.
Build 2
Number of the second build to be compared.
Method Coverage Information
The method coverage table shows the following information for all packages/namespaces that have
changes in method-coverage percentage that are bigger than the threshold:
Element
Description
Package Name
Name of the package.
Statements
Number of statements that are included in the package.
% Method Coverage Percentage of method coverage in the second build.
Difference in the code coverage percentage from the first build to the second build.
The difference is negative when code coverage drops.
% Difference
Context-Sensitive Reports
The areas Requirements,Tests, and Executions offer dynamically-generated lists of reports that are
specific to each unit. Context-sensitive report lists are helpful because they offer report types that relate
directly to your current activities.
Requirements Context-sensitive report lists in the Requirements tree offer all reports that take a
requirement ID as an input parameter.
Tests
Context-sensitive report lists in the Tests tree offers all reports that take a test ID as an
input parameter.
Executions
Context-sensitive report lists in the Execution Plans tree offer all reports that take an
execution-plan ID as an input parameter. On the execution-plan Runs tab, contextsensitive report lists offer all reports that have the following configuration:
•
•
•
Result category = Execution Plan
Selection criteria = Execution Plan Run
Property = ID
When you select a report from a context-sensitive report list, you are taken directly to that report's default
tab in the Reports area. This default destination-tab behavior can be configured using each report's Edit
Report dialog box.
There are two types of reports that appear in the context-sensitive report lists: reports that you have
already accessed and reports that you have not yet accessed. Reports that you have accessed previously
appear above a line separator in the menu. These reports are listed chronologically with the most recently
viewed report at the top of the list. Other default reports that are available, but have not yet been accessed,
appear beneath the line separator.
In addition to the default-configured context-sensitive reports, you can configure new and existing reports
to be included in the context-sensitive report list of each area. Context sensitivity is added to reports on a
per-user, per-report basis only.
Silk Central 15.5
| 347
Accessing Context-Sensitive Execution Reports
Note: Reports must be enabled as context-sensitive reports to make them available in the
Executions area.
To access a context-sensitive execution-plan report:
1. In the menu, click Execution Planning.
2. Right-click an execution plan in the Execution Plans tree and choose Reports.
3. Select a report from the Reports sub-menu.
You are taken to the Parameters tab of the selected report in the Reports area where the ID of the
execution plan is pre-populated as a value.
Note: You can configure this destination-tab linking behavior by using each report's Edit Report
dialog box.
4. Edit the parameters of the report as required.
5. Complete configuration of the report on the Data, Report, or Chart page.
Accessing Context-Sensitive Execution-Plan-Run Reports
Note: Reports must be enabled as context-sensitive reports to make them available in the
Executions area.
To access a context-sensitive execution-plan-run report:
1. In the menu, click Execution Planning > Details View.
2. Click the Runs tab.
3. Right-click a run and choose Reports.
4. Select a report from the Reports sub-menu.
You are taken to the Parameters page of the selected report in the Reports area where the ID of the
run is pre-populated as a value.
Note: You can configure this destination-tab linking behavior by using each report's Edit Report
dialog box.
5. Edit the parameters of the report as required.
6. Complete configuration of the report on the Data, Report, or Chart page.
Accessing Context-Sensitive Requirements Reports
Note: Context-sensitive reports are available in the Requirements area only for those reports that
accept a requirement ID as an input parameter.
To access a context-sensitive requirements report:
1. In the menu, click Requirements > Details View .
2. Right-click a requirement in the Requirements tree and choose Reports.
3. Select a report from the Reports sub-menu.
You are taken to the Parameters page of the selected report in the Reports area where the
requirement's ID is pre-populated as a value.
Note: You can configure this destination-tab linking behavior by using each report's Edit Report
dialog box.
4. Edit the parameters of the report as required.
5. Complete configuration of the report on the Data, Report, or Chart page.
348
| Silk Central 15.5
Accessing Context-Sensitive Test Reports
Note: Context-sensitive reports are available in the Tests area only for those reports that accept a
test ID as an input parameter.
To access a context-sensitive test report:
1. In the menu, click Tests > Details View .
2. Right-click a test, a folder, or a test container in the Tests tree or the Grid View and choose Reports.
Note: When multi-selecting tests in the Grid View, the context-sensitive reporting is disabled.
3. Select a report from the Reports sub-menu.
You are taken to the Parameters page of the selected report in the Reports unit where the ID of the
test is pre-populated as a value.
Note: You can configure this destination-tab linking behavior by using each report's Edit Report
dialog box.
4. Edit the parameters of the report as required.
5. Complete configuration of the report on the Data, Report, or Chart page.
Enabling Context-Sensitive Execution Reports
Explains how to enable execution-plan and execution-plan-run reports to be displayed in context-sensitive
report lists.
To enable a simple report to be displayed in context-sensitive report lists in the Execution tree or the
Runs page:
1. Create a new report.
For additional information, see Creating New Reports.
2. Select Execution Plan from the Result category list box.
3. Select the Selection criteria for the context-sensitive report.
4. Select ID from the Property list box.
5. Type a value in the Value text box.
For example, the ID number of an existing execution plan or an existing execution-plan run.
6. Click Finish.
Enabling Advanced Context-Sensitive Execution Reports
To enable an advanced report to be displayed in context-sensitive report lists in the Execution Plans tree
or on the Runs page:
1. Create a report that includes one of the following:
•
•
An execution-plan ID as an input parameter for the report to be displayed in the Execution Plans
tree.
An execution-plan-run ID as an input parameter for the report to be displayed on the Runs page.
For additional information, see Creating New Reports and Writing Advanced Queries with SQL.
2. To make an advanced query available in the context menu of the Executions area, insert the
parameter name execProp_Id_0 as input for ExecDef_ID_pk_fk.
For example, your report's SQL statement might have defined a hard-coded database-column value,
such as ExecDef_ID_pk_fk = 68. To edit this report so that it receives column-name values
dynamically, replace the static value of 68 with ${execProp_Id_0 | 68}.
Silk Central 15.5
| 349
Note: For additional information about tables and column-name definitions, refer to the Silk Central
Database Model Schema.
Enabling Context-Sensitive Requirement Reports
Explains how to enable requirements reports to be displayed in the context-sensitive report list.
To enable a simple report to be displayed in the context-sensitive report list of the Requirements area:
1. Create a new report.
For additional information, see Creating New Reports.
2. Select Requirement from the Result category list box.
3. Select the Selection criteria for the context-sensitive report.
4. Type a value in the Value text box.
For example, the ID number of an existing requirement.
Enabling Advanced Context-Sensitive Requirement Reports
To enable an advanced report to be displayed in context-sensitive report lists in the Requirements area:
1. Create a report that includes a requirement ID as an input parameter.
For additional information, see Creating New Reports and Writing Advanced Queries with SQL.
2. To make an advanced query available in the context menu of the Requirements unit, insert the
parameter name reqProp_Id_0 as input for Req_ID_pk_fk.
For example, your report's SQL statement might have defined a hard-coded database-column value,
such as Req_ID_pk_fk = 68. To edit this report so that it receives column-name values dynamically,
replace the static value of 68 with ${reqProp_Id_0 | 68}.
Note: For additional information about tables and column-name definitions, refer to the Silk Central
Database Model Schema.
Enabling Context-Sensitive Test Reports
Explains how to enable test reports to be displayed in the context-sensitive report list.
To enable a simple report to be displayed in the context-sensitive report list of the Tests area:
1. Create a new report.
For additional information, see Creating New Reports.
2. Select Test from the Result category list box.
3. Select the Selection criteria for the context-sensitive report.
4. Type a value in the Value text box.
For example, the ID number of an existing test.
Enabling Advanced Context-Sensitive Test Reports
To enable an advanced report to be displayed in context-sensitive report lists in the Tests area:
1. Create a report that includes a test ID, a test folder ID, or a test container ID as an input parameter.
For additional information, see Creating New Reports and Writing Advanced Queries with SQL.
2. To make an advanced query available in the context menu of the Tests area, insert the parameter
name tdProp_Id_0 as input for the test ID or tfProp_Id as input for the test folder ID or test
container ID.
350
| Silk Central 15.5
For example, your report's SQL statement might have defined a hard-coded database-column value,
such as TestDef_ID_pk_fk = 68. To edit this report so that it receives column-name values
dynamically, replace the static value of 68 with ${tdProp_Id_0 | 68}.
Note: For additional information about tables and column-name definitions, refer to the Silk Central
Database Model Schema.
Execution Planning Reports
This section explains the execution planning reports that ship with Silk Central. To ease the assessment of
results, execution planning reports give you a detailed overview of the progress of your test executions and
the status of defects, over a period of time, or over a range of builds.
Execution Plan Run Comparison Reports
Execution-plan run-comparison reports present an overview of the comparison between two execution-plan
runs.
Note: Run-comparison reports are not suitable for the comparison of manual tests to automated
tests. When the name of the report includes (Last Two Runs), you can compare only the last two runs
of the execution plan or test.
The following reports compare two execution-plan runs:
Report Name
Description
Execution Plan Run Comparison Report
The default execution-plan run-comparison report that
compares two execution-plan runs.
Execution Plan Run Comparison Report – Compares only the failed tests of two execution-plan runs.
Failed in Newer Run
Execution Plan Run Comparison Report – Compares only those tests of two execution-plan runs, that
Changed Status
changed their statuses.
The execution-plan run-comparison report provides the following information:
•
•
•
•
•
Changes to the status of the execution plans
Number of errors
Number of warnings
Context in which the execution plans were executed
Execution duration of the assigned tests
Note: When the status of an assigned test changes to Failed between compared runs, the test is
marked red. When the status of an assigned test changes to Passed between compared runs, the
test is marked green.
General Report Information
This section provides the following general information about the report:
Element
Description
Project Name
Name of the active project.
Report Description
Description of the report.
Report Executed By
User who executed the report.
Execution Plan Run Comparison
This section identifies the following differences between the two runs:
Silk Central 15.5
| 351
Element
Description
ID
Identifier of the execution plan.
Name
Name of the execution plan.
Start Time
Execution time of each run.
Duration
Duration of each run.
Run ID
ID of each execution plan run.
Product
Name of the product specified for the run.
Version
Version of the product specified for the run.
Build
Build of the product specified for the run.
Status
Status of each execution-plan run.
Test Run Comparison
This section provides the following details about the tests assigned to each execution plan run:
Element
Description
ID
ID of each test.
Name
Name of each test.
Status
Status of each test in each execution-plan run.
Duration
Duration of each test in each execution-plan run.
Errors
Number of errors of each test in each execution-plan run.
Warnings
Number of warnings of each test in each execution-plan run.
Execution Plan Run Errors Report
The Execution Plan Run Errors report provides a detailed list of all tests that did not pass an executionplan run and the reason they did not pass. All errors that occurred during the execution-plan run are listed
in this report. The user can quickly assess results and easily identify any unwanted effects in the
execution-plan run.
Input Parameters
The input parameter for an Execution Plan Run Errors report is the identifier of the execution-plan run.
General Report Information
This section provides the following general information about the report:
352
Element
Description
Project Name
Name of the active project.
Report Description
Description of the report.
Report Executed By
User who executed the report.
| Silk Central 15.5
Execution Plan Information
This section provides the following information about the execution plan:
Element
Description
Execution Plan ID
Identifier of the execution plan.
Execution Plan Name
Name of the execution plan.
Run ID
Identifier of the execution-plan run.
Product
Name of the product specified for the execution-plan run.
Version
Version of the product specified for the execution-plan run.
Build
Build of the product specified for the execution-plan run.
Execution Server
Execution server where the execution plan was run.
Keywords
Keywords assigned to the execution-plan run.
Execution Timestamp
Time and date of the execution-plan run.
Duration
Duration of the execution-plan run.
Status
Status of all tests assigned to the execution plan.
Test Runs
This section provides the following information about each test run that did not pass:
Element
Description
ID
Identifier of the test.
Name
Name of the test.
Duration
Duration of the test run.
Errors
Amount of errors that occurred during the test run.
Warnings Amount of warnings that occurred during the test run.
Messages If there are messages available, the content of the Messages page of the Test Run Dialog
is shown here.
Not Passed Tests Report
The Not Passed Tests Report presents an overview of all not-passed tests of a folder or project in the
Executions area. You can use this report for error analysis, for example during configuration testing.
Input Parameters
The input parameter for a Not Passed Tests Report is the identifier of the configuration suite, folder, or
project.
General Report Information
This section provides the following general information about the report:
Silk Central 15.5
| 353
Element
Description
Project Name
Name of the active project.
Report Description
Description of the report.
Report Executed By
User who executed the report.
Specific Information for Each Test
For each test, the report provides a grid with an entry for each execution plan in context of which the test is
not passed. Click on the name of the test to view the Runs page of the test in the Tests area. The grid
includes the following columns:
Column
Description
ID
Identifier of the execution plan.
Execution Plan Name of the execution plan. Click to view the runs of the execution plan in the
Executions area.
Status
The status of the last run of the test in the context of the execution plan. For data-driven
tests or test packages, the status is displayed as a bar graph.
Run ID
Identifier of the last run of the test. Click to view the results of the run in the Test Run
Results dialog box.
Not Passed Tests per Execution Plan Report
The Not Passed Tests per Execution Plan Report presents an overview of all not-passed tests per
configuration of a configuration suite, or per execution plan of a folder or project in the Executions area.
You can use this report for error analysis, for example during configuration testing.
Input Parameters
The input parameter for a Not Passed Tests per Execution Plan Report is the identifier of the configuration
suite, folder, or project.
General Report Information
This section provides the following general information about the report:
Element
Description
Project Name
Name of the active project.
Report Description
Description of the report.
Report Executed By
User who executed the report.
Specific Information for Each Execution Plan
For each configuration or execution plan, the report provides a grid with an entry for each test in the
configuration or execution plan. Click on the name of the configuration or execution plan to view the
Properties page of the configuration or execution in the Execution unit. The grid includes the following
columns :
Column Description
ID
354
| Silk Central 15.5
Identifier of the test.
Column Description
Test
Name of the test. Click to view the runs of the test in the Tests area.
Status
The status of the last run of the test in the context of the execution plan. For data-driven tests or
test packages, the status is displayed as a bar graph.
Run ID
Identifier of the last run of the test. Click to view the results of the run in the Test Run Results
dialog box.
Execution Status Overview Report
The Execution Status Overview report presents an overview of the execution status of the selected node
and all execution plans below the node.
Input Parameters
The input parameter for a Execution Status Overview report is the identifier of the node in the Execution
Plans tree.
General Report Information
This section provides the following general information about the report:
Element
Description
Project Name
Name of the project that includes the selected node.
Report Description
Description of the report.
Report Executed By
User who executed the report.
Overall Status Information
Provides an overview, including the aggeregated status, of the selected node and all execution plans
below the node.
Element
Description
Name
Name of the selected Execution tree node.
Execution Plans Amount of execution plans that are that are below the selected node and were
executed.
Tests
Amount of tests that are assigned to the execution plans below the selected node.
Status
The aggregated status of the last run of the execution plans below the selected node.
The status is displayed as a bar graph.
Duration
Accumulated duration of the last run of the execution plans below the selected node.
Status of Execution Plans
Provides detailed information on the execution status of the individual execution plans, including the
selected node, that are below the selected node. Can include multiple tables, if the selection includes
multiple parent tree nodes.
Column
Description
Name
Name of the execution plan. Click to view the properties of the execution plan in the
Executions area.
Tests
Amount of tests that are assigned to the execution plan.
Silk Central 15.5
| 355
Column
Description
Status
The status of the last run of the execution plan.
Product
Name of the product that the execution plan is assigned to.
Version
Version of the product that the execution plan is assigned to.
Build
Build of the product that the execution plan is assigned to.
Start Time Date and time the last run of the execution plan started.
Duration
Duration of the last run of the execution plan.
Issues Per Component Report
The Issues Per Component report offers an overview of all issues related to each component. In addition to
offering basic issue tracking, this report assists in monitoring the overall issue trend for each component.
Performance Trend Reports
This section explains the performance trend reports that ship with Silk Central. Performance trend reports
show the evolution of the application under test's performance over a specified period of time. The input
data for the performance reports is provided by Silk Performer load tests.
Average Page-Time Trend Report
Shows the page times per page for all tests executed for the specified test within the specified time range.
The performance trend of the page times for the tested pages is shown in a graph.
Input Parameters
The input parameters for an Average Page-Time Trend report are:
Parameter
Description
Date From (DD-MONYYYY)
Starting date for the time range. For example 06-DEC-2008.
Date To (DD-MONYYYY)
End date for the time range. For example 16-JAN-2009.
Exclude Runs with
more than <nnn>
Errors
Runs that generate more errors than specified here are not included in the
report. Use this setting to avoid that outliers skew the trend curve.
Maximum Value for yAxis
Limits the y-axis of the graph to the specified value. Transaction busy-times that
exceed this value are cut off at the top. This setting is useful to prevent the
flattening of lines caused by outliers.
Measure Filter
Shown measures are limited to those including the specified string in their
name. This field has to be filled out. To display all available measures, set the
measure filter to %. For example, to show only measures that include the word
"unit" at any position in their names, set the measure filter to %unit%.
Test ID
Identifier of the test for which you want to view the report.
General Report Information
Lists overview information like the name of the current project, the report description, and the user who
executed the report.
356
| Silk Central 15.5
Test Information
Lists general information about the test.
Silk Performer Project Information
Lists general information about the Silk Performer project that is used to perform the load test.
Page Time Trend Information
The trend charts show the page time trend over the selected time range for all filtered measures. The
minimum, maximum, and average page time curves are shown in each chart. The displayed values in each
chart are cut at the selected maximum y-axis value.
Average Transaction Busy-Time Trend Report
Shows the transaction busy time per transaction for all tests executed for the specified test within the
specified time range. The performance trends of the transaction busy-times for the tested transaction are
displayed in trend charts.
Input Parameters
The input parameters for an Average Transaction Busy-Time Trend report are:
Parameter
Description
Date From (DD-MONYYYY)
Starting date for the time range. For example 06-DEC-2008.
Date To (DD-MONYYYY)
End date for the time range. For example 16-JAN-2009.
Runs that generate more errors than specified here are not included in the
Exclude Runs with
more than <nnn> Errors report. Use this setting to avoid that outliers skew the trend curve.
Maximum Value for yAxis
Limits the y-axis of the graph to the specified value. Transaction busy-times
that exceed this value are cut off at the top. This setting is useful to prevent
the flattening of lines caused by outliers.
Test ID
Identifier of the test for which you want to view the report.
Transaction Filter
Shown transactions are limited to those including the specified string in their
name. This field has to be filled out. To display all available transactions, set
the transaction filter to %. For example, to show only transactions that include
the word "unit" at any position in their names, set the transaction filter to
%unit%.
General Report Information
Lists overview information like the name of the current project, the report description, and the user who
executed the report.
Test Information
Lists general information about the test.
Silk Performer Project Information
Lists general information about the Silk Performer project that is used to perform the load test.
Silk Central 15.5
| 357
Transaction Busy-Time Trend Information
The trend charts show the transaction busy-time trend over the selected time range for all filtered
transactions. The minimum, maximum, and average transaction busy-time curves are shown in each chart.
The displayed values in each chart are cut at the selected maximum y-axis value.
Custom Measure Trend Report
Shows the average, minimum, and maximum values of the defined measure or measures for all tests
executed for the specified test within the specified time range. The performance trend of the values for
each tested measure is shown in a graph.
Input Parameters
The input parameters for a Custom Measure Trend report are:
Parameter
Description
Date From (DD-MONYYYY)
Starting date for the time range. For example 06-DEC-2008.
Date To (DD-MONYYYY)
End date for the time range. For example 16-JAN-2009.
Exclude Runs with
more than <nnn>
Errors
Runs that generate more errors than specified here are not included in the
report. Use this setting to avoid that outliers skew the trend curve.
Maximum Value for yAxis
Limits the y-axis of the graph to the specified value. Measures that exceed this
value are cut off at the top. This setting is useful to prevent the flattening of
lines caused by outliers.
Measure Name
Name of the custom measure for which you want to view the report. For
example CreateTestDefinition.
Measure Type
Type of the custom measure. For example Transaction(BusyTime)[s].
Test ID
Identifier of the test for which you want to view the report.
General Report Information
Lists overview information like the name of the current project, the report description, and the user who
executed the report.
Test Information
Lists general information about the test.
Silk Performer Project Information
Lists general information about the Silk Performer project that is used to perform the load test.
Custom Measure Trend Information
The trend chart shows the performance trend over the selected time range for the selected measure. The
minimum, maximum, and average measure curves are shown in the chart. The displayed values in the
chart are cut at the selected maximum y-axis value.
Overall Page-Time Trend Report
Shows overall page times, aggregated over all user types, for all tests executed for the specified test within
the specified time range. The performance trend of the page times for the tested page is shown in a graph.
358
| Silk Central 15.5
Input Parameters
The input parameters for an Overall Page-Time Trend report are:
Parameter
Description
Date From (DD-MONYYYY)
Starting date for the time range. For example 06-DEC-2008.
Date To (DD-MON-YYYY)
End date for the time range. For example 16-JAN-2009.
Exclude Runs with more
than <nnn> Errors
Runs that generate more errors than specified here are not included in the
report. Use this setting to avoid that outliers skew the trend curve.
Maximum Value for y-Axis Limits the y-axis of the graph to the specified value. Transaction busytimes that exceed this value are cut off at the top. This setting is useful to
prevent the flattening of lines caused by outliers.
Test ID
Identifier of the test for which you want to view the report.
General Report Information
Lists overview information like the name of the current project, the report description, and the user who
executed the report.
Test Information
Lists general information about the test.
Silk Performer Project Information
Lists general information about the Silk Performer project that is used to perform the load test.
Overall Page-Time Trend Information
The trend chart shows the overall page-time trend over the selected time range for all pages. The
minimum, maximum, and average overall page-time curves are shown in the chart. The displayed values in
the chart are cut at the selected maximum y-axis value.
Overall Transaction Busy-Time Trend Report
Shows overall transaction busy-time, aggregated over all user types, for all tests executed for the specified
test within the specified time range. The performance trend of the transaction busy-times for the tested
transaction is displayed in a trend chart.
Input Parameters
The input parameters for an Overall Transaction Busy-Time Trend report are:
Parameter
Description
Date From (DD-MONYYYY)
Starting date for the time range. For example 06-DEC-2008.
Date To (DD-MON-YYYY)
End date for the time range. For example 16-JAN-2009.
Exclude Runs with more
than <nnn> Errors
Runs that generate more errors than specified here are not included in the
report. Use this setting to avoid that outliers skew the trend curve.
Maximum Value for y-Axis Limits the y-axis of the graph to the specified value. Transaction busytimes that exceed this value are cut off at the top. This setting is useful to
prevent the flattening of lines caused by outliers.
Silk Central 15.5
| 359
Parameter
Description
Test ID
Identifier of the test for which you want to view the report.
General Report Information
Lists overview information like the name of the current project, the report description, and the user who
executed the report.
Test Information
Lists general information about the test.
Silk Performer Project Information
Lists general information about the Silk Performer project that is used to perform the load test.
Overall Transaction Busy-Time Trend Information
The trend chart shows the overall transaction busy-time trend over the selected time range for all
transactions. The minimum, maximum, and average transaction busy-time curves are shown in the chart.
The displayed values in the chart are cut at the selected maximum y-axis value.
Project Overview Report
Silk Central > Tracking > Project Overview Report
The Project Overview Report contains a high-level overview of the status of the selected project.
Requirements Reports
This section describes the requirements-related reports that ship with Silk Central. Requirements reports
detail the status of functional requirements, for example compatibility requirements, GUI requirements, or
feature requirements, which must be met during development. Requirements may also relate to product
management objectives such as reliability, scalability, and performance. The requirement-management
reports help managers to determine if adequate test coverage is established to verify that system
requirements are met during development. When a report references a requirement that includes HTMLformatted content, that content is rendered in the report.
Status Reports
The following status reports are available for the Requirements area:
Report
Description
Requirements
Status Overview
Represents a grouped summary of all requirements by current requirement
coverage. Coverage is expressed by the statuses Passed, Failed, Not
Executed, and Not Covered.
Top-Level
Requirement
Coverage
Represents a listing of all top-level requirements. For each requirement the
number of child requirements, that are covered and not-covered by tests, is
displayed.
Represents a summary of all requirements by current requirement coverage. The
Status of
Requirements with returned group of requirements is restricted by the Priority parameter, which
Priority Higher than specifies the lowest requirement priority that is considered in the data.
'X'
Requirement Impact Displays the test details grouped by the execution plan that is associated to the
requirement. This report allows the user to gain insight into testing assets that may
Analysis Report
360
| Silk Central 15.5
Report
Description
be impacted by a change to the requirement. The report contains the name,
status, date/time of last execution, manual testers, planned time, and issues of
each test. The following statuses are used:
Status
Description
Passed
The test passed.
Failed
The test failed.
N/A
The test is associated to a requirement but is not submitted for
execution.
Not Executed The test is associated to a requirement and is submitted for
execution but not executed yet.
Project
Requirement
Traceability Report
Displays all requirements in a project along with their associated tests and issues.
The following statuses are used:
Status
Description
Passed
The test passed.
Failed
The test failed.
N/A
The test is associated to a requirement but is not submitted for
execution.
Not Executed The test is associated to a requirement and is submitted for
execution but not executed yet.
Progress Reports
The following progress reports are available for the Requirements area:
Report
Description
Requirements Coverage Across
Builds 'X' and 'Y'
Represents a summary of all requirements by current requirement
coverage. The returned group of requirements is restricted by the
Priority parameter, which specifies the lowest requirement
priority that is considered in the data.
Requirements Coverage Over the Represents a trend in requirements coverage by considering overall
requirements coverage over 'X' days.
Past 'X' Days
Specific Requirements Coverage
Over the Past 'X' Days
Represents a trend in requirements coverage by considering
specific requirements coverage over 'X' days.
Document Reports
The following document reports are available for requirements:
Report
Description
All Requirements
All requirements are represented with full requirement information.
Requirement with Child
Requirements
The selected requirement is shown with its requirement ID. Full details
regarding the child requirements of the requirement are displayed.
Silk Central 15.5
| 361
All Related Issues Report
The All Related Issues report provides a detailed list of all issues related to the assigned tests for a
requirement, and explains the relationship between requirements, the assigned tests, and issues that have
occurred.
Input Parameters
The input parameter for the All Related Issues report is the identifier of the requirement.
General Report Information
This section provides the following general information about the report:
Element
Description
Project Name
Name of the active project.
Report Description
Description of the report.
Report Executed By
User who executed the report.
Requirement Information
This section provides the following information about the requirement:
Element
Description
ID
Identifier of the requirement.
Name
Name of the requirement.
Description
Description of the requirement.
Nr. of Issues
Amount of issues related to the requirement or sub-requirements of the requirement.
Related Issues
Shows all issues related to the requirement or sub-requirements of the requirement in tabular form. The
table provides the following information for each issue:
Column
Description
ID
Identifier of the issue. If an identifier is provided by the issue tracking system, this external
identifier is used. The identifier is clickable if an external link is defined for the issue.
Synopsis
Meaningful short-description of the issue.
Status
Current status of the issue. If the status is provided by the issue tracking system, this
external status is used.
Assigned by Person who assigned the issue to the test.
Test ID
Identifier of the test in which the issue was discovered.
Test
Name of the test in which the issue was discovered.
Test Reports
This section explains the test-related reports that ship with Silk Central. Test reports give you an overview
of the progress of your tests and the status of defects over a period of time or over a range of builds.
Status Reports
The following status reports are available for the Tests area:
362
| Silk Central 15.5
Report
Description
Test Status Overview
Represents a status overview of all tests, structured by the statuses
Passed, Failed, Not Executed, and N/A.
Test Status Overview (per
test container)
Represents a status overview of all tests contained in a specific test
container, structured by the statuses Passed, Failed, Not Executed,
and N/A.
Tests per Component
Represents an overview of coverage of components by test; makes it
easier to see where testing activity is needed.
Tests (per test container)
Represents a success rate for each test container by listing the number of
passed tests.
Implemented Tests (per
component)
Represents an overview of coverage of components by tests that have the
Implemented attribute set to Yes.
Failed Tests (per
component)
Represents an overview of failed tests per component; makes it easier to
identify the most critical components in the environment.
Quality Goals Planning Report
Reports > Details View > Tests > Status Report
Represents the number of tests in each goal criteria along with the planned time rolled up to the goal
criteria.
Note: The planned time value is only for manual tests. Automated tests do not have planned time.
This report is split three ways for each quality goal defined in a project:
•
•
•
Testing Scope - compares the total number of tests available against the total number or required tests
for each item in a quality goal.
Required Planned Time - compares the required planned time among the items in the quality goals.
Value table - lists all of the quality goal items along with related metrics: Tests Available, Goal (%),
Tests Required, and Planned Time for Manual Tests.
Note: For a multi select attribute/property, the test will be counted for each matching occurrence.
Quality Goals Execution Report
Reports > Details View > Tests > Status Report
Visually displays the number of tests executed for each item of each goal. This report is split into two
sections for each quality goal defined in a project:
•
•
Execution Status Graph - lists each quality goal item with a color-coded execution status and
summary value.
Value table - lists all of the quality goal items as well as their execution metrics: Passed, Failed, Not
Executed, N/A, Total, Test to Meet Goal, and Execution % to Goal.
Progress Reports
The following progress reports are available for the Tests area:
Report
Description
Test Progress Across Builds
'X' and 'Y'
Represents a trend in test progress resulting from viewing test statuses
in context with builds. The user must specify a build range consisting of
a start- and an end-build.
Silk Central 15.5
| 363
Report
Description
Manual Test Coverage since
Build <x> (cumulative)
Represents a trend in manual test progress, excluding all kind of
automated tests, resulting from viewing test statuses in context with
builds. The user must specify a starting build number which is used as
basis for calculating a cumulative progress.
Automated Test Coverage for Represents the automated test coverage resulting from viewing test
statuses in context with builds. The user must specify a version and a
Builds (non-cumulative)
product and the report shows the test coverage that could be achieved
with the automated tests per build.
Test Progress this Month
Represents a trend in test progress resulting from viewing test statuses
for the current month.
Specific Test Node Progress
Over the Past 'X' Days
Represents a trend in requirements coverage by considering a specific
test node over the past 'X' days.
Tests Created in the Past 'X'
Days (per component)
Represents a listing of new tests per component over the past 'X' days.
Assists in identifying components that lack testing activity.
Test Progress Over the Past
'X' Days
Represents a trend in test progress by considering test statuses over
the past 'X' days.
Percentage Testing Success
Over the Past 'X' Days (per
component)
Represents a percentage listing of successful tests per component over
the past 'X' days; assists in identifying the components in the
environment that are most critical.
Manual Test Reports
The following manual-test reports are available for the Tests area:
Report
Description
Planned vs. Actual
Execution Time of Manual
Tests (Summary)
Represents an overview of the deviation between planned and actual time
for execution of manual tests, viewed on a daily basis.
Historic Planned vs. Actual Represents an overview of planned and actually required execution time
for completed manual tests per user over a specific period of time.
Execution Time (per user)
Planned vs. Actual
Execution Time (status per
user)
Represents progress in terms of planned vs. actual hours of currently
pending manual tests per user. Manual tests are only considered if test
results have been entered by the user and are assigned to the user who
enters the results.
Manual Test Result
Document
An easily printable manual test case report for the latest results of all tests
assigned to the specified execution plan.
An easily printable manual test case report for the latest results of all tests
Manual Test Result
Document (Microsoft Word) assigned to the specified execution plan in a Microsoft Word document.
Manual Test Results by
Execution Plan
An easily printable manual test case report for the latest results of all tests
assigned to the specified execution plan folder or testing cycle.
Baseline Comparison Report
Reports > Details View > <Active Project> > Test > Baseline Comparison > Baseline Comparison
The Baseline Comparison report compares a baselined project with the baseline and displays the number
of changed, deleted, and created tests.
364
| Silk Central 15.5
Input Parameters
The input parameters for the Baseline Comparison report are the identifiers of the project and the baseline.
General Report Information
This section provides a description of the report and the name of the user who executed the report.
Project and Baseline Information
This section provides the information on the project and the baseline, including data related to the creation
of the baseline.
Project and Baseline Summary
This section provides a sum of the created, changed, and deleted tests in the baseline and the project, in
both tabular and graphical form.
Changes
This section provides a detailed list of all changed tests in the project and the baseline, with links to the
tests.
Test Run Comparison Report
Test run-comparison reports present an overview of the comparison between two runs of a test.
Note: Run-comparison reports are not suitable for the comparison of manual tests to automated
tests. When the name of the report includes (Last Two Runs), you can compare only the last two runs
of the execution plan or test.
The test run comparison report provides the following information:
•
•
•
•
•
•
•
•
Changes to the status of the test
Number of errors
Number of warnings
Context in which the test was executed
Execution duration of the assigned tests
Attributes and properties of the test
Parameters of the test
Success conditions for the test
General Report Information
This section provides the following general information about the report:
Element
Description
Project Name
Name of the active project.
Report Description
Description of the report.
Report Executed By
User who executed the report.
Test Information
This section provides the following information about the test:
Silk Central 15.5
| 365
Element
Description
ID
Identifier of the test.
Name
Name of the test.
Description
Description of the test.
Execution Information
This section provides the following information about each execution:
Element
Description
Execution ID
ID of each execution plan.
Execution Name
Name of each execution plan.
Run ID
ID of each execution plan run.
Product
Name of the product.
Version
Version of the product.
Build
Build of the product.
Test Run Comparison
This section identifies the following differences between the two runs:
Element
Description
Status
Status of each run.
Execution Timestamp
Timestamp of each run.
Duration
Duration of each run.
Errors
Number of errors in each test run.
Warnings
Number of warnings in each test run.
Previous Status
Status of each run previous to the last manual change.
Changed by
User who performed the last manual change to the status.
Change Comment
Describes the reason of the manual status change.
Attributes and Properties
This section identifies the attributes and properties of the two runs of the test at execution time.
Parameters
This section lists the parameters of the two runs of the test at execution time.
Success Conditions
This section lists the conditions at execution time for each of the two runs to be considered successful. If a
condition is not satisfied, the test run is considered unsuccessful. Satisfied conditions are marked green,
while unsatisfied conditions are marked red.
366
| Silk Central 15.5
Projects
This section explains how to manage projects in Silk Central. The Projects area offers a high-level testmanager’s view of all projects in your Silk Central installation, including a list of the most recent projects
you have set to active, and enables you to move between projects. The area also enables you to manage
projects and their settings, see high-level project status details, and view current execution statistics.
Build Information
Build information files contain version and build information that is used for execution runs. The build
information files are typically stored and searched for on the execution server that is executing the
execution run. If a build information file is not found on the execution server, the file is searched for on the
application server. This behavior is beneficial when you have multiple execution servers and use a single
build information file across all execution servers. You need to maintain only a single build information file
on the application server. The build information files for automated tests that have no execution server
assigned, and for all manual tests, are immediately searched for on the application server.
Silk Central is able to match up test results with build information and display test results for specific build
numbers.
Build Information Updates
Build information files must be created and configured manually. Whenever a new build becomes available
for testing on an execution server, update the build information to reflect the new build number.
You can update the build information in two different ways:
•
•
Manually, by editing the files each time a new build is installed.
Automatically, if you are using an automated build update process to update the build information file,
for example through a VB Script.
Creating Build Information Files
To create a build information file:
1. On both the application and execution servers, navigate to: C:\ProgramData\SilkCentral
\BuildInfos.
2. Create a build info file for your project based on the template file BuildInfoExample.xml. The
template file contains the following code:
<?xml version="1.0" encoding="utf-8"?>
<ProjectBuildInfo>
<BuildEntryList>
<BuildEntry name="Demo Product">
<Version>3.1</Version>
<BuildNr>350</BuildNr>
</BuildEntry>
<BuildEntry name="Product2">
<Version>4.2</Version>
<BuildNr>613</BuildNr>
</BuildEntry>
</BuildEntryList>
</ProjectBuildInfo>
Note: To improve the structure of build information files, an element called BuildEntryList
which contains a list of BuildEntry elements has been created. BuildEntry tags refer to
specific products that are defined by the name attribute of BuildEntry elements.
Silk Central 15.5
| 367
3. Modify the file content to fit your environment.
Version Used on both application and execution servers. The number of the version that is currently
available for testing. The number is not necessarily the same for each execution server.
BuildNr Used on both application and execution servers. The number of the build that is currently
available for testing. The number is not necessarily the same for each execution server.
4. Distribute the build information file to the execution servers: C:\ProgramData\SilkCentral
\BuildInfos.
Note: When stored on both the application server and execution servers, build information files
must have the exact same name.
Once
you have created the build information files on the application server and each execution server,
5.
you must specify the file name in the settings of the corresponding project. Click Projects:<Project
Name> > Projects List to view the list of projects assigned to you. Select the project to which you want
to link the build information.
6.
7.
8.
9.
Note: This must be done before the scheduling of any tests for the project. Otherwise previously
scheduled tests will not be updated.
Click the Project Settings tab.
Click Edit to edit the project settings of the selected project. The Edit Project Settings dialog box
opens.
Specify the name of the previously created XML file in the Build information file name text box.
Click OK to update the information. With all future test executions, Silk Central will read build
information from the corresponding file and match test results with that information.
Comparing a Project with a Baseline
For baselined projects, you can use the Baseline Comparison report to see all the changes to the tests in
the project since the moment the project was baselined.
To view the report:
1. In the menu, click Projects > Project List.
2. Use CTRL + CLICK to select the project and the baseline of the project that you want to compare.
Tip: For easier selection of the baselines, don't click on the name of the baseline. Click into
another column instead.
3. Right click on the selection.
4. Select Reports > Baseline Comparison .
Note: The Baseline Comparison report must be executed once to display in the context-menu. If
the report is grayed out, execute the report once in the Reports area.
Selecting Projects
To select a project:
1. In the menu, click Projects > Project List.
2. Click the name of the project to select it.
Note: You can only select active projects.
Project List
Project:<Project Name> > Project List
368
| Silk Central 15.5
The Project List page alphabetically displays all the projects and project baselines associated with your
Silk Central installation. The page supports filtering, but does not support sorting. The displayed projects
are sorted by name. Inactive projects and inactive project baselines are disabled.
Project baselines are sorted by their creation date, marked with a special icon, and shown as child nodes
of the original project.
For more information, see Managing Projects.
The following columns are displayed for each project and project baseline:
Column
Description
Actions
Delete
Edit project
Copy project
Baseline project
Export project
Note: This column will be hidden if the current user does not have modify/delete project
permissions.
Project
Name of the project. Click to set the project as the active project.
Project ID
The identifier of the project.
Status
Active or Inactive. Click to switch the status.
Description
Project description.
Created On Date and time the project was created.
Created By
User who created the project.
Changed
On
Date and time the project was last changed.
Changed
By
User who last changed the project.
Switching to a Recently-Accessed Project
You can quickly switch between the five Silk Central projects that you have most recently accessed.
To open one of the five projects you have most recently opened:
1. In the menu, click Projects.
2. In the Recent Projects list, click the name of the project that you want to access. You can continue to
work with the selected project.
Settings Configuration
This section explains how to configure settings in Silk Central.
If you have SuperUser, Administrator, or Project Manager privileges, you can specify project-wide settings
for Silk Central projects. Once global project settings are defined, they are available to all users who have
access to those projects. Global project settings include the definition of filters, attributes, external product
integrations, change notifications, build information, source files, file extensions, and more.
Silk Central 15.5
| 369
Project Settings
Project settings are settings that are specific to a project, for example the project release date.
Configuring Project Settings
To customize the project settings:
1. In the menu, click Project:<Project Name> > Project Settings .
Note: If you have not selected a project, a warning message opens, asking you to select a project.
Select the project for which you want to define the setting.
2. Click the Project Settings tab to view the current settings. The Project Settings page opens.
3. Click Edit to modify the current project settings.
4. The Edit Project Settings dialog box displays. You can specify the following information:
Build Information File
Name
Build information files contain project information, including build number,
build log location, error log location, and build location. Enter the name of
your project’s build information file in this text box. All test executions will
read the build information from this specified file.
Project Release Date
Specify the planned release date for your project.
File Extensions to
ignore in Results
Specify result file types or other file types that should not be saved as
results for test executions.
Note: File extensions must be separated by commas, for example, xlg, *_, res. Changes made in
the Build Information File Name and File Extensions to ignore in Results fields will not effect
scheduled tests. To redistribute tasks to execution servers, you must reschedule the tests, or
disconnect from and reconnect to the database.
5. Click OK to save your project settings.
Project Settings Page
Project:<Project Name> > Project Settings > Project Settings
The Project Settings page lists the following high-level details about the active project:
Item
Description
Build information file name
Build information files contain project information,
including build number, build log location, error log
location, and build location. Enter the name of the active
project’s build information file in this field. All test
executions will read the build information from this
specified file.
Project release date
Scheduled release date of the active project in the format
MM/DD/YYYY.
File extensions to ignore in results
Result file types or other file types that should not be
saved as results for test executions.
Filters
Filters provide an efficient means of finding exactly the information you need, while excluding extraneous
detail. Filters highlight only those elements that are relevant to your needs, and enable you to quickly sort
through requirements, test elements, and execution plans. By defining global filters, you can create
complex filter criteria that are available throughout Silk Central without defining filter criteria each time you
need to filter a list.
370
| Silk Central 15.5
Based on your needs, you can create new filters, edit existing filters, select filters, delete filters, or turn
filtering off at the project level. Projects do not contain default filters. You can access and edit filters from
the toolbars in the Silk Central units and from the Project Settings unit.
Note: Filters are not applied to reports. The Recent Changes filter enables you to view project-wide
changes and additions that other users have made to tests since your last change acknowledgement.
The Show Changes/Show All toggle button and the Acknowledge button in the Tests area help
you to find out what changes other users have made. Your system administrator can configure email
notifications that alert you to changes that are made to test settings. Email alerts include links that
take you directly to a view of recent changes.
Creating Filters
To create a filter:
1. In the menu, click Project:<Project Name> > Project Settings .
Note: If you have not selected a project, a warning message opens, asking you to select a project.
Select the project for which you want to define the setting.
2. Click the Filters tab to view the list of available filters.
3. Click New Filter. The New Filter dialog box appears.
4. Type a Name for the new filter.
This name will be displayed in list boxes when the filter becomes available.
5. Select a Category from the list to make the filter available in the Requirements, Tests, or Execution
Planning area of Silk Central.
6. Optional: Type a Description for the new filter.
7. Optional: Check the Visible to other users check box to allow other users to see the filter.
8. Optional: Check the Editable by other users check box to allow other users to edit the filter.
Note: If Visible to other users and Editable by other users are checked, the filter is public. To
delete non-public (private) filters, you have to be the owner of the filter or you need the Delete
private filters of other users permission.
9. Select a category of filter criteria from the Selection criteria list. The available categories depend on
the general filter category you have selected.
Note: You can combine filters by selecting Nested Test Filter or Nested Requirement Filter.
Selecting one of these categories allows you to include an existing filter in your new filter.
10.Select a Property, Operator, and Value for the filter from the respective lists.
Property Available properties depend on the filter category that you have selected in the previous
step. Defines the property for which you are defining a filter setting. If you have selected an
attribute category, the property list includes custom attributes to query against.
Operator Specifies the filter operator. The operator depends on the property type you have selected.
For example, if you have selected a property that is based on a string field type, the
following operators are available:
Operator
Description
=
The string equals the defined value.
not
The string is different than the defined value.
contains
The string contains the defined value.
not contains
The string does not contain the defined value.
Silk Central 15.5
| 371
Value
Enter the value that you want to filter out. Depending on the property type that you have
selected, values will either be strings that you can enter into the field, or a selection of
predefined values that you can select from the list box.
11.Optional: Click More if you want to add more than one filter category to the new filter. Repeat this
procedure to define new categories.
Note: If you define more than one filter category, you must define whether the categories need to
be fulfilled in addition to the existing categories (AND relationship), or if the filter returns true when
one of the filter categories is fulfilled (OR relationship). Select either AND or OR to define the filter
category relationship. You cannot define nested AND, OR relationships.
12.Optional: To remove filter categories, click Fewer. This removes the last filter category.
13.Click OK to save the new filter, or click Cancel to abort the operation.
Editing Filters
To edit a filter:
1. In the menu, click Project:<Project Name> > Project Settings .
Note: If you have not selected a project, a warning message opens, asking you to select a project.
Select the project for which you want to define the setting.
2. Click the Filters tab to view the list of available filters.
3. Click the name of the filter you want to edit. The Edit Filter dialog box displays.
4. Edit the Name and Description of the filter.
5. Select a category of filter criteria from the Selection criteria list. The available categories depend on
the general filter category you have selected.
Note: You can combine filters by selecting Nested Test Filter or Nested Requirement Filter.
Selecting one of these categories allows you to include an existing filter in your new filter.
6. Select a Property, Operator, and Value for the filter from the respective lists.
Property Available properties depend on the filter category that you have selected in the previous
step. Defines the property for which you are defining a filter setting. If you have selected an
attribute category, the property list includes custom attributes to query against.
Operator Specifies the filter operator. The operator depends on the property type you have selected.
For example, if you have selected a property that is based on a string field type, the
following operators are available:
Value
Operator
Description
=
The string equals the defined value.
not
The string is different than the defined value.
contains
The string contains the defined value.
not contains
The string does not contain the defined value.
Enter the value that you want to filter out. Depending on the property type that you have
selected, values will either be strings that you can enter into the field, or a selection of
predefined values that you can select from the list box.
7. Click OK to save the edited filter definition.
Deleting Filters
To delete a filter:
372
| Silk Central 15.5
1. In the menu, click Project:<Project Name> > Project Settings .
Note: If you have not selected a project, a warning message opens, asking you to select a project.
Select the project for which you want to define the setting.
2. Click the Filters tab to view the list of available filters.
3. Click Delete Filter for the filter that you want to delete. A confirmation dialog box displays, asking you
you to confirm the deletion.
4. Click Yes to delete the selected filter or No to abort the operation. If you click Yes, you will be returned
to the filters list and the deleted filter is no longer displayed.
Filters Page
Project:<Project Name> > Project Settings > Filters
The Filters page lists the filters that are available to the active project. For each filter, the Filters page
displays the following columns:
Item
Description
Actions
Actions that can be performed on the filter. Currently only Delete.
Name
Name of the filter.
Type
Filter category. Requirement, test, or execution.
Created On
When the filter was created.
Created By
User who created the filter.
Changed On
When the filter was most recently modified.
Changed By
User who most recently modified the filter.
Attributes
You can use custom attributes to customize the information for tests in the Tests area. While some
attributes are made available by the integrated functionality of Silk Central, such as priority, components,
and platforms, you may want to define custom attributes to categorize tests to your needs, or to make tests
compatible with specific test cases.
Creating Custom Attributes
To create a custom attribute:
1. In the menu, click Project:<Project Name> > Project Settings .
Note: If you have not selected a project, a warning message opens, asking you to select a project.
Select the project for which you want to define the setting.
2. Click the Attributes tab to view the list of current attributes.
3. Click New Attribute. The New Attribute dialog box displays.
4. Type a Name for the new attribute. This name will be displayed in list boxes when the attribute
becomes available for use.
5. Type a Description for the new attribute.
6. Select the attribute Type. See the Test Attribute and Requirement Property Types topic for descriptions
of each type of attribute.
7. Click OK.
Test Attribute and Requirement Property Types
Silk Central supports the following types of test attributes and requirement properties:
Silk Central 15.5
| 373
Date
The Date type supports date values.
List
The List type supports single select or multi-select lists. It has the following controls:
•
•
•
New Item: Allows you to create entries in the list. Click to show the New Item dialog box.
Enter the Name and Numeric Weight for the list item and click OK.
Note: The value of the Numeric Weight field is used during filtering when the filter
criteria uses any of the following operators: >, >=, <, or <=. When the filter criteria
uses the = or not operators, the value from the Name field is used for comparisons.
Allow multi-select: click this check box to allow users to select more than one values from
the list.
Note: You can update an existing single-select list to be a multi-select list. A multiselect list cannot be changed to being a single-select list though.
Actions: use the icons in this row to delete, to move up, to move down or to edit each item
in the list.
Number The Number type supports integer or decimal numeric values. It has the following fields:
•
•
•
Minimum value: represents the smallest value that you can enter into the field.
Maximum value: represents the largest value that you can enter into the field.
Decimal places: used to define how many values to the right of the decimal point are valid.
Select 0 for an integer value or 1, 2, 3, or 4 for a decimal value.
Note: Custom attributes and requirement properties display their current value if an
update is made to their definition (for example, changes to Minimum value or Maximum
value). In order to apply the new definition, open and save the asset.
Text
The Text type supports any alphanumeric value. It has the following fields:
•
Maximum length: represents the maximum number of characters that can be entered into
the field.
Editing Custom Attributes
To edit a custom attribute:
1. In the menu, click Project:<Project Name> > Project Settings .
Note: If you have not selected a project, a warning message opens, asking you to select a project.
Select the project for which you want to define the setting.
2. Click the Attributes tab to view the list of current attributes.
3. Click the name of the attribute that you want to edit. The Edit Attribute dialog box displays.
4. Edit the Name of the attribute.
When the attribute is available for use, the name will display in list boxes for filters and tests. Attributes
can be used in global filters for filtering by test attributes and can be applied to tests.
5. Edit the Description of the attribute.
6. See the Test Attribute and Requirement Property Types topic for descriptions of each type of attribute.
You have different editing options depending on the attribute data type.
7. Click OK.
You are returned to the Attributes list.
Deleting Custom Attributes
To delete a custom attribute:
374
| Silk Central 15.5
1. In the menu, click Project:<Project Name> > Project Settings .
Note: If you have not selected a project, a warning message opens, asking you to select a project.
Select the project for which you want to define the setting.
2. Click the Attributes tab to view the list of current attributes.
3. Before you can delete an attribute, you must first deactivate it. In the Status column, click the Active
link or icon and then click Yes on the confirmation dialog box to deactivate the attribute.
4. Once the attribute is inactive, click Delete Attribute to remove it. A confirmation dialog box displays,
asking you to confirm the deletion.
5. Click Yes to remove the selected attribute; or click No to abort the operation. If you click Yes you will be
returned to the Attributes page, where the removed attribute is no longer displayed.
6. If an error displays, ensure that the selected attribute is not applied to any tests or used in any global
filters. You can only delete unused attributes.
Attributes Page
Project:<Project Name> > Project Settings > Attributes
The Attributes page lists the attributes that have been created for the current project. For each attribute,
the Attributes page displays the following columns:
Column
Description
Actions
Available actions that can be performed on the attribute.
Name
Name of the attribute. When the attribute is available for use, the name will display
in list boxes for filters and tests. Attributes can be used in global filters for filtering
by test attributes and can be applied to tests.
Click the Edit icon to edit the name of the attribute.
Type
Attribute type. See the Test Attribute and Requirement Property Types topic for
descriptions of each type of attribute.
Status
Status of the attribute, active or inactive.
Column
The column name of the attribute in the LQM Reporting table. Use this column
name to query the selected attribute within the LQM Reporting table. See the
database model documentation for detailed information.
Created On
When the attribute was created.
Created By
User who created the attribute.
Changed On
When the attribute was most recently modified.
Changed By
User who most recently modified the attribute.
Requirement Properties
The following sections describe the two types of requirement properties that are available.
Requirement Properties Page
Project:<Project Name> > Project Settings > Requirement Properties
The Requirement Properties page lists the custom requirement properties and the calculated properties
that are available for the active project.
Silk Central 15.5
| 375
Calculated Properties
Column
Description
Actions
Available actions that can be performed on the calculated property.
Name
Name of the calculated property.
Click the Edit icon to edit the calculated property.
Formula
Contains the actual formula of the calculated property.
Classification
Lists the classifications for the calculated property.
Created On
When the property was created.
Created By
User who created the property.
Changed On
When the property was most recently modified.
Changed By
User who most recently modified the property.
Custom Properties
Column
Description
Actions
Available actions that can be performed on the custom property.
Name
Name of the requirement property.
Click the Edit icon to edit the requirement property.
Type
Property type. See the Test Attribute and Requirement Property Types topic for
descriptions of each type of attribute.
Created On
When the property was created.
Created By
User who created the property.
Changed On
When the property was most recently modified.
Changed By
User who most recently modified the property.
Calculated Properties
Calculated properties are used to create a single value based on a user-defined formula derived from the
values of internal or custom properties. This value is then put into a labelled range called a classification.
The goal of a calculated property is to be able to view the classification Name in grids. The value of a
calculated property is shown everywhere where the values of custom properties are shown (Document
view, for example). Calculated properties can also be used in filters and quality goals like other internal or
custom requirement properties.
Every calculated property has a default classification without a lower bound. All other classifications must
have a lower bound. The classification allows you to set a name and range for the value of the calculated
property. The name of the classification is how the value will display in the grids. If one or more property
values used in the formula are not set, or evaluating the formula on a particular requirement fails (for
example, division by zero), --- will appear as the value of the calculated property.
You can use any internal or custom property from within a project in the formula for a calculated property.
The internal or custom property must be of type Number, Text, or List with single selection. You can use
the following operators in the formula: + - * / ()
Restriction: You can have up to five calculated properties per project. Calculated properties cannot
be used within other calculated properties.
376
| Silk Central 15.5
Creating a Calculated Property
Calculated properties are used to create a property that is based on a range of values. This procedure will
walk you through creating a calculated property named Custom Risk with three classifications: Low,
Medium, and High. We will use the internal property Risk and a custom property named Impact of type
Number (you should create this one in advance).
1. Click Requirements > Requirement Properties .
2. Click New Calculated Property.
3. In the Name field, type Custom Risk.
4. In the Description field, type Calculated property using Risk and Impact (L, M, H).
5. Select Business Impact from the Insert Property list. ${Business Impact} is added to the
Formula field.
6. Select * from the Insert Operator list. ${Business Impact}* is added to the Formula field.
7. Select Business Risk from the Insert Property list. ${Business Impact}*${Business Risk}
is added to the Formula field.
8. On the default row of the Classification grid, rename the entry to Low. Since all calculated properties
must contain a default classification without a lower bound, this one will be used.
9. Click Add Classification. A new row is added to the Classification grid.
10.Name the classification Medium and add a Lower Bound of 10.
11.Click Add Classification. A new row is added to the Classification grid.
12.Name the classification High and add a Lower Bound of 20.
13.Click OK.
A calculated property is now created that will be populated with Low, Medium, or High when both the
Impact and Risk properties are set for a requirement.
Calculated Property Page
The Calculated Property page is used to add or to edit a calculated property to a project. To access this
page click Requirements > Requirement Properties and then click an existing calculated property or
New Calculated Property.
Name
Contains the name of your calculated property.
Description
Enter a meaningful description of your calculated property perhaps referencing the
formula or classification.
Formula
Contains the formula for your calculated property. You can manually type in the
formula or use the Insert Property and Insert Operator lists to do this. If you
manually type in the formula, the field names should be contained within the
following structure: ${}. Operators go between this structure.
Insert Property
Place your cursor where you want the property to appear in the Formula field and
select one of the system or custom properties from the list to add it.
Insert Operator
Place your cursor where you want the operator to appear in the Formula field and
select an operator.
Classifications
Grid
The Classifications grid is used to set varying ranges for the values of your
calculated properties. Click Add Classification to create a new row in the grid. Use
the Name field to identify the classification and the Lower Bound field to determine
the lowest value for calculated property. The important thing to know about
classifications is that the Name of the classification is what will appear in grids, not
the values of calculated properties. For example if your classification Name is
Medium with a Lower Bound of 5 and your calculated property value is 7, as long
Silk Central 15.5
| 377
as your next classification lower bound value is greater than 7, the calculated value
will appear as Medium.
Internal Property Values
The values of several internal properties can be used in the formulas for calculated properties. The values
for supported properties are noted below.
Risk
Value Name
Internal Value
Low
1
Medium
2
High
3
Critical
4
Priority
Value Name
Internal Value
Low
1
Medium
2
High
3
Critical
4
Reviewed
Value Name
Internal Value
No
0
Yes
1
Custom Properties
You can add custom property fields across all requirements in the selected project in Requirements >
Requirement Properties. Custom properties can subsequently be edited alongside the default properties
on the Edit Requirements dialog box. Custom properties are displayed in Requirements > Details View
> Properties.
Creating a Custom Requirement Property
To create a new custom requirement property:
1. In the menu, click Project:<Project Name> > Project Settings .
Note: If you have not selected a project, a warning message opens, asking you to select a project.
Select the project for which you want to define the setting.
2. Click the Requirement Properties tab.
3. Click New Requirement Property to display the New Requirement Property dialog box.
4. Type a name for the new property in the Name field.
5. Select the data Type of the new property from the Type list. See the Test Attribute and Requirement
Property Types topic for descriptions of each type of attribute.
378
| Silk Central 15.5
6. Click OK.
Your custom property is available to all requirements in the active project.
Test Attribute and Requirement Property Types
Silk Central supports the following types of test attributes and requirement properties:
Date
The Date type supports date values.
List
The List type supports single select or multi-select lists. It has the following controls:
•
•
•
New Item: Allows you to create entries in the list. Click to show the New Item dialog box.
Enter the Name and Numeric Weight for the list item and click OK.
Note: The value of the Numeric Weight field is used during filtering when the filter
criteria uses any of the following operators: >, >=, <, or <=. When the filter criteria
uses the = or not operators, the value from the Name field is used for comparisons.
Allow multi-select: click this check box to allow users to select more than one values from
the list.
Note: You can update an existing single-select list to be a multi-select list. A multiselect list cannot be changed to being a single-select list though.
Actions: use the icons in this row to delete, to move up, to move down or to edit each item
in the list.
Number The Number type supports integer or decimal numeric values. It has the following fields:
•
•
•
Minimum value: represents the smallest value that you can enter into the field.
Maximum value: represents the largest value that you can enter into the field.
Decimal places: used to define how many values to the right of the decimal point are valid.
Select 0 for an integer value or 1, 2, 3, or 4 for a decimal value.
Note: Custom attributes and requirement properties display their current value if an
update is made to their definition (for example, changes to Minimum value or Maximum
value). In order to apply the new definition, open and save the asset.
Text
The Text type supports any alphanumeric value. It has the following fields:
•
Maximum length: represents the maximum number of characters that can be entered into
the field.
Editing Custom Requirement Properties
To edit a previously created custom requirement property:
1. In the menu, click Project:<Project Name> > Project Settings .
2.
3.
4.
5.
6.
Note: If you have not selected a project, a warning message opens, asking you to select a project.
Select the project for which you want to define the setting.
Click the Requirement Properties tab.
Click the name of the property you want to edit. The Edit Requirement Property dialog box displays.
Edit the name of the property in the Name field.
When the property is available for use, the name will display in lists for filters and requirements.
Properties can be used in global filters for filtering by requirement properties and can be applied to
requirements.
Edit the Description of the property.
See the Test Attribute and Requirement Property Types topic for descriptions of each type of
requirement property. You have different editing options depending on the property data type.
Silk Central 15.5
| 379
7. Click OK to save your changes.
Deleting Custom Requirement Properties
To delete a previously created custom requirement property:
1. In the menu, click Project:<Project Name> > Project Settings .
Note: If you have not selected a project, a warning message opens, asking you to select a project.
Select the project for which you want to define the setting.
2. Click the Requirement Properties tab.
3. Click
. A confirmation dialog box appears.
4. Click Yes to confirm the deletion.
Step Properties
Use step properties to extend a manual test step with additional properties. Add a custom step property to
a project in Projects:<Project Name> > Project Settings to add the property to all manual test steps in
the project. Add a custom step property to a library in the Libraries tree to add a custom step property to
all manual test steps in the library. Step properties can subsequently be edited alongside the default
properties on the Edit Manual Test Step dialog box.
Creating Step Properties
To create a new step property:
1. In the menu, click Project:<Project Name> > Project Settings .
Note: If you have not selected a project, a warning message opens, asking you to select a project.
Select the project for which you want to define the setting.
2. Click the Step Properties tab.
3. Click New Property. The New Step Property dialog box opens.
4. Enter a name for the new property in the Name text box.
Note: Step property fields are always declared as type string.
5. Click OK to make your property available to all manual test steps in the selected Silk Central project.
Note: To create a step property for a library, select the library node in the Libraries tree and
continue with the second step.
Editing Step Properties
To edit a previously created step property
1. In the menu, click Project:<Project Name> > Project Settings .
Note: If you have not selected a project, a warning message opens, asking you to select a project.
Select the project for which you want to define the setting.
2. Click the Step Properties tab.
3. Click on the name of the property that you want to edit. The Edit Step Property dialog opens.
4. Edit the name of the property in the Name text box.
5. Click OK to save your changes, or click Cancel to abort the operation without saving.
Deleting Step Properties
To delete a previously created step property
380
| Silk Central 15.5
1. In the menu, click Project:<Project Name> > Project Settings .
Note: If you have not selected a project, a warning message opens, asking you to select a project.
Select the project for which you want to define the setting.
2. Click the Step Properties tab.
3. Click Delete Property in the Actions column of the property that you want to delete. A confirmation
dialog box displays, asking you to confirm the deletion.
4. Click Yes to complete the operation, or No to abort.
Step Properties Page
Project:<Project Name> > Project Settings > Step Properties
The Step Properties page lists all properties that can be populated into manual test steps across the
active project. For each custom step property, the Step Properties page displays the following columns:
Column
Description
Name
Name of the step property.
Actions
The following actions can be performed on a property:
•
•
•
Delete Property
Move Up
Move Down
Change Notification
Silk Central can notify you by email when requirements or tests are changed by other users. Each user has
the option of activating change-notification. Once notification has been enabled, you can view and
acknowledge changes that have occurred since your last acknowledgment. To avoid numerous
notifications, only a single email alert is sent to you when a change is made, regardless of how many
changes other users may have made since your last acknowledgment. Email alerts include links that take
you directly to a view of recent changes.
Before you can activate change notification for requirements or tests, you must configure your email
address in the user settings of Silk Central.
Note: Change notification only works if an email server has been configured by your administrator. If
change notification has not been enabled, please contact your Silk Central administrator.
Enabling Change Notification
To enable change notification:
1. In the menu, click Project:<Project Name> > Project Settings .
Note: If you have not selected a project, a warning message opens, asking you to select a project.
Select the project for which you want to define the setting.
2. Click the Notifications tab.
3. Click Configure Email Notification to open the Configure Email Notification dialog box.
4. If you want to be notified by email when changes are made to requirements in the currently selected
project, check the Changes on Requirements check box.
5. If you want to be notified by email when changes are made to tests within the currently selected project,
check the Changes on Tests check box.
6. Click OK to save the notification settings, or click Cancel to abort the operation without saving changes.
You will be notified by email about changes for which you have activated notification.
Silk Central 15.5
| 381
Disabling Change Notification
To disable change notification:
1. In the menu, click Project:<Project Name> > Project Settings .
Note: If you have not selected a project, a warning message opens, asking you to select a project.
Select the project for which you want to define the setting.
2. Click the Notifications tab.
3. Click Configure Email Notification to open the Configure Email Notification dialog box.
4. If you do not want to be notified by email when changes are made to requirements in the currently
selected project, uncheck the Changes on Requirements check box.
5. If you do not want to be notified by email when changes are made to tests in the currently selected
project, uncheck the Changes on Tests check box.
6. Click OK to save the notification settings or click Cancel to abort the operation without saving changes.
Changes Triggering Change Notification
When you have activated change notification to inform you of changes that are made to requirements or
tests an email alert is sent to you, following your logout. The email alert is sent to you if one or more of the
following settings are changed:
Area
Changes
Requirements
•
•
•
•
•
•
•
A requirement is created or deleted.
The name or description of a requirement is edited.
A system property is edited.
A requirement is set as obsolete.
A requirement is recovered.
A test is assigned to or removed from a requirement.
A custom property of a requirement is created, edited,
or deleted.
Tests
•
•
•
•
•
•
•
•
•
•
•
•
•
A container is created or edited.
A product is edited.
A source control profile is edited.
"Clear working folder" is edited.
The root node is edited.
The custom data directory is edited.
The include directory is edited.
The hidden test properties are edited.
The Silk Test Classic interface is edited.
A test folder is created, edited, or deleted.
A test is created, edited, or deleted.
The planned time is edited.
A test step is added or edited.
Notifications Page
Project:<Project Name> > Project Settings > Notifications
The Notifications page lists the notification events for the active project. For each notification event, the
Notifications page displays the following columns:
382
| Silk Central 15.5
Column
Description
Notification Events
Name of the notification event that has been set up for
the active project.
Status
Status of the notification event. Active or inactive.
Click the Configure... button in each section to edit the values.
Email
When an email notification event is activated, a notification email is sent to the user that activated the
event, the first time one of the specified settings is changed.
Note: You must have specified an email address to be able to receive email notifications.
Requirement Flagging
You can configure notifications differently for internal and external requirements. All requirement flagging is
enabled by default. For more information, see the Flags topic.
External Requirements Management Tools
This section explains how to work with external requirements management tools.
Important: Before upgrading from Silk Central 15.0 or earlier to the current version, perform a
Synchronize All to synchronize all your requirements with your integrated requirements
management tools.
Requirements Management Configuration
Integrating external requirements-management enables you to coordinate the requirements-management
features of Silk Central with other tools you may already be working with. Integration is configured on the
Requirements Management page in Project:<Project Name> > Project Settings. The page is divided
into a separate section for each installed plug-in. Initially, the view is divided into sections, one for each
pre-installed requirements-management tool.
For information on the supported versions, refer to the Silk Central Release Notes. You can download addins for IBM Rational RequisitePro and IBM Rational DOORS from the Tools unit in Help. These add-ins
can be installed on appropriate server and client computers. For details, refer to the ReadMe files that are
included in the downloadable archives.
Silk Central supports integration with external requirements-management systems (RMS) through its open
interface. Creating a plug-in and integrating it into Silk Central allows integrating any RMS. Refer to the Silk
Central API Help for information about the interfaces that enable proper integration of external RMS.
Before you can configure Caliber integration, you must install the Caliber client on the Silk Central
application server and on the front-end server. Additionally, make sure that MPX support is enabled in
Caliber.
Before you can configure RequisitePro integration, you must install the IBM Rational RequisitePro client on
the Silk Central front-end server.
Before you can configure DOORS integration, you must install the DOORS client on the Silk Central frontend server.
•
•
The add-in for RequisitePro enhances the RequisitePro menu with an entry providing a link to the Silk
Central front-end server’s project selection.
The Add-In for DOORS enables Silk Central to communicate with DOORS. This add-in must be
installed on the DOORS client on the Silk Central front-end server.
Silk Central 15.5
| 383
Note: Configuring integration with Caliber requires the definition of Caliber login credentials.
Whenever requirements are synchronized between Silk Central and Caliber, these credentials are
used to login to Silk Central, thus checking out a Silk Central license. The license is set free as soon
as the synchronization process has completed. We recommend creating a dedicated Silk Central user
for synchronization purposes, which should be used by all Silk Central requirements integrations. This
ensures that only a single Caliber license is used for the process of synchronization.
Requirements Management Page
Project:<Project Name> > Project Settings > Requirements Management
The Requirements Management page lists the requirements-management integrations that have been
configured for the current project.
Note: If an integration has not been enabled, you will only see the Status property.
Caliber Integration
This section lists details related to the integration of the Caliber requirements management system.
Item
Description
Status
Status of integration, enabled or disabled.
Hostname
Machine where the external server is installed.
Username
Credential for the requirements management server.
Project Name
External project with which the Silk Central project is integrated.
Baseline
Baseline of the external project with which the Silk Central project is integrated.
Requirement Types
Requirement types within the project that are integrated.
Schedule
Schedule to automatically synchronize requirements with Caliber.
Create Requirements
Indicates whether or not the Enable creation of unassigned requirements option is
active. Enables creation and editing of unmapped requirements in Silk Central
projects that are configured for integration with Caliber.
Upload Requirements
Indicates whether or not the Enable upload of requirements to CaliberRM option is
active. Enables the upload of unmapped or unassigned requirements from Silk
Central to Caliber. This allows you to upload additional previously unmapped
requirement trees to Caliber and then have those requirements mapped within Silk
Central. When this option is enabled, the Map Requirement button in Requirements
> Properties becomes enabled, enabling configuration of top level requirements for
external requirement types, which is required when uploading unmapped
requirements.
Property Mappings
Lists any external to internal property mappings that have been defined between the
internal and external requirements management systems.
Actions
•
•
•
•
•
•
Edit Configuration
Edit Property Mapping
Edit Schedule
Edit Notification
Disable Configuration
Remove Configuration
CaliberRDM
This section lists details related to the integration of the CaliberRDM requirements management system.
384
| Silk Central 15.5
Item
Description
Status
Status of integration, enabled or disabled.
Hostname
Machine where the external server is installed.
Port
Listening port of the external server.
Username
Credential for the requirements management server.
Password
Credential for the requirements management server.
Project Name
External project with which the Silk Central project is synchronized.
Schedule
Schedule to automatically synchronize requirements with the tool.
Create Requirements
Indicates whether or not the Enable creation of unassigned requirements option is
active. Enables creation and editing of unmapped requirements in Silk Central
projects that are configured for integration with the tool.
Actions
•
•
•
•
•
Edit Configuration
Edit Schedule
Edit Notification
Disable Configuration
Remove Configuration
IBM Rational RequisitePro Integration
This section lists details related to the integration of the IBM Rational RequisitePro requirements
management system.
Item
Description
Status
Status of integration, enabled or disabled.
UNC Project Path
Machine where the external server is installed.
UNC Username
Credential for the UNC file-path, which is required for the integration with IBM
Rational RequisitePro.
UNC Password
Credential for the UNC file-path, which is required for the integration with IBM
Rational RequisitePro.
User name
Credential for the requirements management server.
Password
Credential for the requirements management server.
Packages
The requirement packages from the external project that are integrated with the Silk
Central project.
Requirement Types
Requirement types within the packages that are integrated.
Create Requirements
Indicates whether or not the Enable creation of unassigned requirements option
is active. Enables creation and editing of unmapped requirements in Silk Central
projects that are configured for integration with IBM Rational RequisitePro.
Upload Requirements
Indicates whether or not the Enable upload of requirements to RequisitePro
option is active. Enables the upload of unmapped/unassigned requirements from
Silk Central to RequisitePro. This allows you to upload additional previously
unmapped requirement trees to RequisitePro and then have those requirements
mapped within Silk Central. When this option is enabled, the Map Requirement
button in Requirements > Properties becomes enabled, enabling configuration of
top level requirements for external requirement types, which is required when
uploading unmapped requirements.
Silk Central 15.5
| 385
Item
Description
Property Mappings
Lists any external to internal property mappings that have been defined between the
internal and external requirements management systems.
Actions
•
•
•
•
•
•
Edit Configuration
Edit Property Mapping
Edit Schedule
Edit Notification
Disable Configuration
Remove Configuration
SAP Solution Manager
This section lists details related to the integration of the SAP Solution Manager requirements management
system.
Item
Description
Status
Status of integration, enabled or disabled.
URL
SAP Solution Manager URL.
Username
Credential for the requirements management server.
Password
Credential for the requirements management server.
Project Name
External project with which the Silk Central project is synchronized.
Schedule
Schedule to automatically synchronize requirements with the tool.
Create Requirements
Indicates whether or not the Enable creation of unassigned requirements option
is active. Enables creation and editing of unmapped requirements in Silk Central
projects that are configured for integration with the tool.
Actions
•
•
•
•
•
Edit Configuration
Edit Schedule
Edit Notification
Disable Configuration
Remove Configuration
Rally
This section lists details related to the integration of the Rally requirements management system.
386
Item
Description
Status
Status of integration, enabled or disabled.
URL
URL of Rally.
Username
Credential for the requirements management server.
Password
Credential for the requirements management server.
Project Name
External project with which the Silk Central project is synchronized.
Schedule
Schedule to automatically synchronize requirements with the tool.
Create Requirements
Indicates whether or not the Enable creation of unassigned requirements option
is active. Enables creation and editing of unmapped requirements in Silk Central
projects that are configured for integration with the tool.
| Silk Central 15.5
Item
Description
Actions
•
•
•
•
•
Edit Configuration
Edit Schedule
Edit Notification
Disable Configuration
Remove Configuration
IBM Rational DOORS Integration
This section lists details related to the integration of the DOORS requirements management system.
Item
Description
Status
Status of integration, enabled or disabled.
RM Service URL
The URL of Silk Central's DOORS requirement Web Service. The default value
should point to the correct location already.
Username
Credential for the requirements management server.
Password
Credential for the requirements management server.
DOORS Installation Path
Client installation path within the front-end server directory structure.
Project Name
External project with which the Silk Central project is synchronized.
Requirement Types
Requirement types within the project that are synchronized.
Schedule
Any defined synchronization schedule.
Create Requirements
Indicates whether or not the Enable creation of unassigned requirements option
is active. Enables creation and editing of unmapped requirements in Silk Central
projects that are configured for integration with DOORS.
Upload Requirements
Indicates whether or not the Enable upload of requirements to IBM Rational
DOORS option is active. Enables the upload of unmapped or unassigned
requirements from Silk Central to DOORS. This allows you to upload additional
previously unmapped requirement trees to DOORS and then have those
requirements mapped within Silk Central. When this option is enabled, the Map
Requirement button in Requirements > Properties becomes enabled, enabling
configuration of top level requirements for external requirement types, which is
required when uploading unmapped requirements.
Property Mappings
Lists any external to internal property mappings that have been defined between the
internal and external requirements management systems.
Actions
•
•
•
•
•
•
Edit Configuration
Edit Property Mapping
Edit Schedule
Edit Notification
Disable Configuration
Remove Configuration
Caliber Integration
This section describes how to integrate Caliber with Silk Central.
Note: Caliber user defined attribute Multiple selection user list and Multiple selection group list
must be mapped to the Silk Central text attribute type and not list type.
Silk Central 15.5
| 387
Enabling Integration with Caliber
To enable integration with Caliber:
1. In the menu, click Projects > Project List.
2. Select the project to which you want to establish integration.
3. In the menu, click Project:<Project Name> > Project Settings .
Note: If you have not selected a project, a warning message opens, asking you to select a project.
Select the project for which you want to define the setting.
4. Click the Requirements Management tab.
5. Click New Integration.
Note: To enable creation and editing of unmapped requirements within the integrated
requirements, check the Allow internal requirements check box.
The New Integration dialog box opens.
6. Select Caliber from the list and click Next. The Edit Configuration dialog box opens.
7. Type a Name for the new profile.
This is the name that is displayed in lists where the profiles are available for selection.
8. Type the Hostname of the machine where the external server is installed.
9. Type valid Username and Password credentials for the requirements management server.
10.Click Test Connection to confirm that the host and user credentials you have entered are correct.
A Connection successful message box displays if the settings are correct. Click OK to continue.
Note: Consult your system administrator if you are not able to establish a connection.
11.Click OK.
12.From the Project list box, select the external project with which the Silk Central project is to be
integrated. The requirement types that are available with the selected project are automatically
populated into the Requirement Types field. The baselines that are available with the selected project
are automatically populated into the Baseline field.
13.Select a Baseline from the external project that should be integrated with the Silk Central project.
Your selections are displayed on the Edit Configuration dialog box.
14.Click OK.
15.Select one or more requirement types from the external project that should be integrated with the Silk
Central project.
Use CTRL + Click to select multiple requirement types.
16.Click OK to save your settings.
Baseline Support for Caliber Integration
You can select the current baseline or existing user-defined baselines for Caliber integration. You cannot
import modified baselined requirements into Silk Central. Requirements that are not of the current baseline
can only be changed in Caliber if the version of the requirement that is used for the baseline is changed.
Such changes are only updated within Silk Central requirements when a manual or scheduled
synchronization is performed.
You can change a baseline after you import it into Silk Central. You can change the configured baseline to
a different user-defined baseline or the current baseline. After such a change, the next synchronization of
the baseline, either manual or scheduled, will update the Silk Central project and update, create, or delete
requirements as required. When a baseline is changed, a message displays that states that the changes
will take effect after the next synchronization.
388
| Silk Central 15.5
Handling Test Assignments in Caliber
Assigned tests are displayed, managed, and created as traces (“Trace to”) of synchronized requirements in
Caliber.
The External Traceability for Silk Central must be enabled for a Caliber project within the Caliber
Administrator and the correct Silk Central front-end server must be configured. Click Edit for the Silk
Central External Traceability for correct project within the Caliber Administrator.
When a project is synchronized with a Silk Central project, the assigned tests of the synchronized Silk
Central requirements will display as traces ("Trace To") of the Caliber requirement. If you edit these
assignments in Silk Central, the changes will be reflected immediately in Caliber.
Copying Caliber-Integrated Projects
To manage Caliber baselines when copying Silk Central projects:
1. In the menu, click Project:<Project Name> > Project Settings .
Note: If you have not selected a project, a warning message opens, asking you to select a project.
Select the project for which you want to define the setting.
2. Click the Requirements Management tab.
3. Verify that the baseline you want to save is selected.
Note: If a baseline is changed, you must perform a synchronization to update the project
requirements with the baseline changes, before you can copy an associated Silk Central project.
The integration configuration is only copied if you select a baseline other than the current baseline.
If you select the current baseline, you need to specify if you want to keep the integration
configuration in the original project or move it to the copied project.
4. If the baseline that you want to save is not selected, click Edit Configuration. The Edit Configuration
dialog box displays.
5. Click Browse next to the Project name text box. The Browse Projects dialog box opens.
6. Select the baseline you want to save, then confirm your selection.
7. In the menu, click Projects > Project List . The Projects page displays, listing all existing projects and
project baselines.
8. Click
in the Actions column of the project you want to copy.
Note: For full details on copying a project, see the Administration topics in this Help.
The Copy Project dialog box displays.
9. Select the items you want to copy into the new project, then confirm your selection.
10.Apply the baseline that you want to continue working with to the Silk Central project.
Note: After copying a project, the original project and the copy are identical. Define on which you
will continue working on by applying the corresponding baseline.
Creating a Baseline for a Caliber-Integrated Project
To create a baseline of a Caliber-integrated Silk Central project:
1. Create a baseline of the Silk Central project. A Silk Central message box displays during the process,
asking if you want to enable the Caliber integration for the new baseline.
2. Click Yes. When the new baseline is created, the Baseline Project - Adapt Project Settings dialog
box opens.
3. Click Edit to change the requirements integration settings.
The Edit Configuration dialog box opens.
4. Click Browse next to the Project name text box. The Browse Projects dialog box opens.
Silk Central 15.5
| 389
5. Select a Caliber project, a baseline, and the requirement type for synchronization.
6. Click Ok to close the Browse Projects dialog box.
7. Click Ok to close the Edit Configuration dialog box.
8. Click Finish to close the Baseline Project - Adapt Project Settings dialog box.
Atlassian JIRA Agile Integration
Silk Central offers a requirements integration with Atlassian JIRA Agile, which is based on the project and
issue tracking system JIRA. All issue types (the generic object type in JIRA) can be synchronized. Since
Atlassian JIRA Agile offers the creation of custom issue types, you can specify a list of Atlassian JIRA Agile
issue types in Silk Central that you want to synchronize, such as for example Bug or Improvement.
Enabling Integration with Atlassian JIRA Agile
To enable integration with Atlassian JIRA Agile:
1. In the menu, click Projects > Project List.
2. Select the project to which you want to establish integration.
3. In the menu, click Project:<Project Name> > Project Settings .
Note: If you have not selected a project, a warning message opens, asking you to select a project.
Select the project for which you want to define the setting.
4. Click the Requirements Management tab.
5. Click New Integration.
Note: To enable creation and editing of unmapped requirements within the integrated
requirements, check the Allow internal requirements check box.
The New Integration dialog box opens.
6. Select Atlassian JIRA Agile from the list and click Next. The Edit Configuration dialog box opens.
7. Type a Name for the new profile.
This is the name that is displayed in lists where the profiles are available for selection.
8. Enter the URL of your JIRA Agile server.
9. Type valid Username and Password credentials for JIRA Agile.
10.In the Issue Types field, specify the issue types that you want to synchronize, separated by semicolons
(;).
All issue types (the generic object type in JIRA) can be synchronized. Since Atlassian JIRA Agile offers
the creation of custom issue types, you can specify a list of Atlassian JIRA Agile issue types in Silk
Central that you want to synchronize, such as for example Bug or Improvement.
11.Click Test Connection to confirm that the host and user credentials you have entered are correct.
A Connection successful message box displays if the settings are correct. Click OK to continue.
Note: Consult your system administrator if you are not able to establish a connection.
12.Click Load. The Project list is populated with all the projects in JIRA Agile that you have permissions
for.
13.From the Project list, select the external project with which the Silk Central project is to be integrated.
14.Click OK to save your settings.
Atlassian JIRA Agile Property Mappings
The following properties have a default mapping between JIRA Agile and Silk Central:
•
390
| Silk Central 15.5
User stories that are in JIRA Agile's Backlog are reflected in Silk Central by having the Sprint
property value set to Backlog. This enables you to easily search for them by creating a filter.
•
The default Priority values of JIRA Agile's user stories are mapped to Silk Central's Priority
property. If you are not using JIRA Agile's default Priority values, you can customize this mapping.
Viewing JIRA Agile Backlog Stories in Silk Central
1. In the menu, click Requirements > Details View.
2. Create a new filter with the following criteria:
• Selection Criteria: External Custom Attributes
• Property: Sprint
• Value: Backlog
3. Click Apply to apply the filter immediately or Save and apply to save the filter for future reuse.
Mapping JIRA Agile Priority values to Silk Central's Priority
The default Priority values of JIRA Agile's user stories are mapped to Silk Central's Priority property
as follows:
•
•
•
•
•
Blocker=SC_Priority_Critical
Critical=SC_Priority_High
Major=SC_Priority_Medium
Minor=SC_Priority_Low
Trivial=SC_Priority_Low
If you are not using JIRA Agile's default Priority values, or if you want to customize the mapping, your
Silk Central administrator should customize the settings as follows:
1. Stop the application server.
2. Open the file propertyMappings.properties with a text editor. This file is located in the JIRA Agile
plugin-file JIRAAgile.zip on the application server in the plugins folder.
3. Search for SC_Priority=Priority, beneath which you can customize the mapping of JIRA Agile's
Priority values to Silk Central's Priority.
Note: Silk Central Priority values require the prefix SC_Priority_.
4. Save and close the file
5. Re-start the application server.
IBM Rational DOORS Integration
This section describes how to integrate Silk Central and IBM Rational® DOORS® (DOORS).
Installing IBM Rational DOORS on the Front-End Server
To integrate Silk Central and DOORS, install the DOORS client on the Silk Central front-end server
machine. If you use more than one front-end server machine, you must install the DOORS client to the
same directory on each of the machines.
To install the DOORS client on the Silk Central front-end server machine:
1. In the menu, click Help > Tools .
2. Click Silk Central Add-In for IBM Rational DOORS to download the DOORS plug-in package.
The package contains two ZIP-Archives:
• DoorsRM.zip
• DoorsClientLibs.zip
3. Create a new folder with the name testmanager in the …\lib\dxl folder of your DOORS client
installation.
Silk Central 15.5
| 391
The default path for this folder is C:\Program Files (x86)\IBM\Rational\DOORS\<version>.
4. Extract all DOORS script files from DoorsClientLibs.zip to this folder.
The plug-in package DoorsRMPlugin.zip is automatically installed to the Plugins folder of your Silk
Central application server installation during the setup process. During startup of the application server,
this plug-in will be published to all front-end servers.
Enabling Integration with IBM Rational DOORS
To enable integration with DOORS:
1. In the menu, click Projects > Project List.
2. Select the project to which you want to establish integration.
3. In the menu, click Project:<Project Name> > Project Settings .
Note: If you have not selected a project, a warning message opens, asking you to select a project.
Select the project for which you want to define the setting.
4. Click the Requirements Management tab.
5. Click New Integration.
Note: To enable creation and editing of unmapped requirements within the integrated
requirements, check the Allow internal requirements check box.
The New Integration dialog box opens.
6. Select IBM Rational DOORS from the list and click Next. The Edit Configuration dialog box opens.
7. Type a Name for the new profile.
This is the name that is displayed in lists where the profiles are available for selection.
8. In the RM service URL text box, type the URL of the Silk Central DOORS requirement Web Service.
The default value should point to the correct location already. For example http://MySCTMHost:
19120/services/doorsrequirementsmanagement.
9. Type valid Username and Password credentials for the requirements management server.
10.The default DOORS client installation path is displayed in the DOORS Installation Path text box. If this
path is not correct, click Browse to browse to and select the correct destination in the front-end server
directory structure.
11.Click Test Connection to confirm that the host and user credentials you have entered are correct.
A Connection successful message box displays if the settings are correct. Click OK to continue.
Note: Consult your system administrator if you are not able to establish a connection.
12.Click Browse next to the Project name text box to open the Browse Requirement Types dialog box.
From the Project text box, select the external project with which the Silk Central project is to be
synchronized.
The requirement types that are available with the selected project are automatically populated into the
Requirement types text box. Select the requirement types that are to be synchronized and click OK.
Use CTRL + CLICK to select multiple requirement types.
Your selections are now displayed on the Edit Configuration dialog box.
13.Click OK to save your settings.
Caution: As the DOORS application object is used for communication, and this object does not
support login data, but rather requires a running DOORS client, Silk Central starts each DOORS
client process with the provided login data and then uses that same data for all subsequent
application objects. Therefore only one set of DOORS login credentials is supported for
communication at one time. It is recommended that you use the same DOORS credentials for all
configurations so that integration tasks can be performed on the front-end server for all projects at
392
| Silk Central 15.5
the same time. When a second set of credentials is used, the second set only works after all
sessions using of the first set of credentials have timed out.
IBM Rational RequisitePro Integration
The topics in this section describe the integration between IBM Rational RequisitePro and Silk Central.
Enabling Integration with IBM Rational RequisitePro
Note: You can only configure one IBM Rational RequisitePro integration per project.
To enable integration with IBM Rational RequisitePro:
1. In the menu, click Projects > Project List.
2. Select the project to which you want to establish integration.
3. In the menu, click Project:<Project Name> > Project Settings .
Note: If you have not selected a project, a warning message opens, asking you to select a project.
Select the project for which you want to define the setting.
4. Click the Requirements Management tab.
5. Click New Integration.
Note: To enable creation and editing of unmapped requirements within the integrated
requirements, check the Allow internal requirements check box.
The New Integration dialog box opens.
6. Select IBM Rational RequisitePro from the list and click Next. The Edit Configuration dialog box
opens.
7. Type a Name for the new profile.
This is the name that is displayed in lists where the profiles are available for selection.
8. Type the Project path (UNC) to the machine where the external server is installed.
9. Type valid UNC username and UNC password credentials for the machine where the external server
is installed.
10.Type valid Username and Password credentials for the requirements management server.
11.Click Test Connection to confirm that the host and user credentials you have entered are correct.
A Connection successful message box displays if the settings are correct. Click OK to continue.
Note: Consult your system administrator if you are not able to establish a connection.
12.Click Edit Packages and Requirement Types.
Your selections are then displayed on the Edit Configuration dialog.
Note: Only requirements of explicitly selected packages will be synchronized. Selecting a parent
package does not select the child packages of the parent.
The Browse Packages & Requirement Types dialog box opens. The packages and requirement
types that are available with the selected project are automatically populated into the Packages and
Requirement Types list boxes.
13.From the Packages list box, select one or more packages from the external project that should be
integrated with the Silk Central project.
Use CTRL + CLICK to select multiple packages.
14.From the Requirement types list box, select one or more requirement types from the external project
that should be integrated with the Silk Central project.
Use CTRL + CLICK to select multiple requirement types.
Silk Central 15.5
| 393
15.Click OK. The Browse Packages & Requirement Types dialog box closes.
16.Click OK to save your settings.
Rally Integration
Integrating the project management tool Rally enables you to define user stories which you can then use
as requirements in Silk Central. You can then create tests in Silk Central to cover these requirements. To
update the tests you have created with any changes to the corresponding user stories in Rally, synchronize
the requirements.
The following user story properties are synchronized from the Rally REST Service. You can use these
properties to help filter and categorize the user stories.:
Property
Description
Name
The name of the user story in Rally.
Rally ID
The identifier of the user story in Rally. This property is the External ID of the
requirement in Silk Central.
Description
The description of the user story in Rally.
Iteration
The iteration in Rally in which the user story is included.
Project
The project in Rally in which the user story is included.
Release
The project release in which the user story is included.
State
The state of progress of the user story in Rally. The following states are available:
•
•
•
•
Defined
In-Progress
Completed
Accepted
Plan Estimate (Story The estimated time in Rally for the user story to be completed. The time is
estimated in story points.
Points)
Enabling Integration with Rally
To enable integration with Rally:
1. In the menu, click Projects > Project List.
2. Select the project to which you want to establish integration.
3. In the menu, click Project:<Project Name> > Project Settings .
Note: If you have not selected a project, a warning message opens, asking you to select a project.
Select the project for which you want to define the setting.
4. Click the Requirements Management tab.
5. Click New Integration.
Note: To enable creation and editing of unmapped requirements within the integrated
requirements, check the Allow internal requirements check box.
The New Integration dialog box opens.
6. Select Rally from the list and click Next. The Edit Configuration dialog box opens.
7. Type a Name for the new profile.
This is the name that is displayed in lists where the profiles are available for selection.
8. Type the URL.
9. Type valid Username and Password credentials for Rally.
394
| Silk Central 15.5
10.Optional: If direct access to the Internet is restricted, and the Rally REST service is located in a
machine outside the scope of the internal network, use the Proxy Host and Proxy Port text boxes to
specify a proxy through which Silk Central can connect to Rally .
Note: To connect to Rally by using a proxy, you need to fill out both text boxes, Proxy Host and
Proxy Port.
11.Click Test Connection to confirm that the host and user credentials you have entered are correct.
A Connection successful message box displays if the settings are correct. Click OK to continue.
Note: Consult your system administrator if you are not able to establish a connection.
12.Click OK.
13.Click Load. The Project list box is populated with all the projects from all workspaces in Rally that you
have permissions for.
14.From the Project list box, select the external project with which the Silk Central project is to be
integrated.
15.Click OK to save your settings.
Issue Tracking Profiles
Issue tracking profiles enable Silk Central to integrate with external issue tracking systems.
Additional issue tracking systems can be configured by installing a custom plug-in. For additional
information, refer to the Issue Manager API Help. Defining issue tracking profiles allows you to link tests
within the Tests area to issues in third-party issue-tracking systems. Linked issue states are updated
periodically from the third-party issue tracking system.
Mapping Issue States
After defining a new issue tracking profile, you should map the existing issue states of the external issue
tracking system to the issue states of Silk Central. Doing this enables Silk Central to list issues correctly
when querying internal and external issues.
To map issue states:
1. In the menu, click Project:<Project Name> > Project Settings .
Note: If you have not selected a project, a warning message opens, asking you to select a project.
Select the project for which you want to define the setting.
2. Click the Issue Tracking tab. The Issue Tracking page opens, listing all of the issue tracking profiles
that have been created for the system.
3. In the Actions column of the issue tracking profile you want to edit, click Edit mapping of issue
tracking profile .... The Edit Status Mapping dialog box opens.
4. Map internal issue states to corresponding external issue states by selecting the respective entries from
the list boxes.
The existing issue states of the external issue tracking software are listed in the External column. The
internal issue states of Silk Central are available in the list boxes in the Internal column.
5. Once you have mapped each external issue state to an internal state, click OK to save your settings, or
click Cancel to abort the operation.
Atlassian JIRA
This section describes how to configure Atlassian JIRA (JIRA) issue tracking profiles to integrate with Silk
Central.
The JIRA plug-in relies on the Silk Central Java API for integration.
Silk Central 15.5
| 395
Note: See the sources of the package com.borland.sctm.issuetracking.jira to see how
these elements fit together.
For a list of the JIRA versions that are supported for integration with Silk Central, refer to the Silk Central
Release Notes.
If you assign an external JIRA issue to a test, you can enter the issue ID either with or without the project
key. For example: PROJECT-13 or just 13.
Adding Atlassian JIRA Issue Tracking Profiles
Before you integrate Silk Central with JIRA, ensure that the SOAP services are enabled. For detailed
information, refer to the JIRA documentation.
To add a JIRA issue tracking profile:
1. In the menu, click Issues > Issue Tracking Integrations. The Issue Tracking page displays, listing all
issue tracking profiles that have been created for the system.
2. Click New Profile to open the New Issue Tracking Profile dialog box.
3. Type a Name for the new profile.
This is the name that is displayed in lists where the profiles are available for selection.
4. Type a Description for the new profile.
5. Select Atlassian JIRA from the Type list.
6. Type a valid Username and Password.
These credentials will be used to access the issue tracking system.
7. In the URL field, type the host name of your JIRA server and the port that is used to connect to the
server.
8. Click Load Project to load all projects from the server and populate the Project list box, then select a
project from the Project list box.
9. Optional: Select true from the Show custom fields list to display custom JIRA fields in the issue
dialog. If true is selected, the JIRA user defined for the issue tracking profile has to have JIRA
administration permissions.
10.Optional: If you experience performance issues on large JIRA installations, select false from the
Update daily issue statistics list. The daily issue statistics will not be updated.
Note: If you use JIRA 5 or a later JIRA version, this setting is ignored, since the performance
issues are resolved for the newer versions.
11.Click OK.
Silk Central attempts a trial connection to the external system using the information you have provided.
Note: If an error occurs, please review the information that you have supplied, or consult your
administrator.
12.If the trial connection is successful, a confirmation dialog box displays, asking you if you want to map
internal issue states to the states of the newly defined profile.
•
•
Click Yes to proceed with the related Mapping Issue States procedure.
Click No to map issue states later.
Editing Atlassian JIRA Issue Tracking Profiles
When the server or login credentials of your issue tracking system change, you must edit your issue
tracking profile accordingly.
To edit an existing Atlassian JIRA issue tracking profile:
1. In the menu, click Issues > Issue Tracking Integrations. The Issue Tracking page displays, listing all
issue tracking profiles that have been created for the system.
396
| Silk Central 15.5
2. Click on the name of the issue tracking profile that you want to modify. The Edit Issue Tracking Profile
dialog box opens.
3. Edit the Name of the profile.
This is the name that is displayed in lists where profiles are available for selection.
4. Edit the Description of the profile.
5. Optional: Select a new Type for the issue tracking profile from the list box.
6. Edit the Username and Password.
These credentials are used to access your issue tracking system.
7. In the URL field, edit the hostname of your JIRA server and the port that is used to connect to the
server.
8. To change the JIRA project, click Load Project to load all projects from the server and update the
Project list box, then select a project from the Project list box.
9. Optional: Select true from the Show custom fields list to display custom JIRA fields in the issue
dialog. If true is selected, the JIRA user defined for the issue tracking profile has to have JIRA
administration permissions.
10.Optional: If you experience performance issues on large JIRA installations, select false from the
Update daily issue statistics list. The daily issue statistics will not be updated.
Note: If you use JIRA 5 or a later JIRA version, this setting is ignored, since the performance
issues are resolved for the newer versions.
11.Click OK.
Silk Central attempts a trial connection to the external system using the information you have provided.
Note: If an error occurs, please review the information that you have supplied, or consult your
administrator.
12.If the trial connection is successful, a confirmation dialog box displays, asking you if you want to map
internal issue states to the states of the newly defined profile.
•
•
Click Yes to proceed with the related Mapping Issue States procedure.
Click No to map issue states later.
Bugzilla
This section describes how to configure Bugzilla issue tracking profiles to integrate with Silk Central.
The Bugzilla plug-in relies on the Silk Central Java API for integration. Silk Central communicates with
Bugzilla through the XML-RPC Bugzilla Web-service introduced with Bugzilla 3.0 by using the Redstone
XML-RPC library. To enable Bugzilla integration, ensure that you have installed a SOAP::Lite package for
the web server. For example, for the Debian distribution install the libsoap-lite-perl package.
For a list of the Bugzilla versions that are supported for integration with Silk Central, refer to the Silk
Central Release Notes.
Adding Bugzilla Issue Tracking Profiles
To add a Bugzilla issue tracking profile:
1. In the menu, click Issues > Issue Tracking Integrations. The Issue Tracking page displays, listing all
issue tracking profiles that have been created for the system.
2. Click New Profile to open the New Issue Tracking Profile dialog box.
3. Type a Name for the new profile.
This is the name that is displayed in lists where the profiles are available for selection.
4. Type a Description for the new profile.
5. Select Bugzilla from the Type list box.
Silk Central 15.5
| 397
6. Type a valid Username and Password.
These credentials will be used to access the issue tracking system.
7. Enter the URL of your Bugzilla installation. For example, http://bugzillaserver/bugzilla.
8. Click OK.
Silk Central attempts a trial connection to the external system using the information you have provided.
Note: If an error occurs, please review the information that you have supplied, or consult your
administrator.
9. If the trial connection is successful, a confirmation dialog box displays, asking you if you want to map
internal issue states to the states of the newly defined profile.
•
•
Click Yes to proceed with the related Mapping Issue States procedure.
Click No to map issue states later.
Editing Bugzilla Issue Tracking Profiles
When the server or login credentials of your issue tracking system change, you must edit your issue
tracking profile accordingly.
To edit an existing Bugzilla issue tracking profile:
1. In the menu, click Issues > Issue Tracking Integrations. The Issue Tracking page displays, listing all
issue tracking profiles that have been created for the system.
2. Click on the name of the issue tracking profile that you want to modify. The Edit Issue Tracking Profile
dialog box opens.
3. Edit the Name of the profile.
This is the name that is displayed in lists where profiles are available for selection.
4. Edit the Description of the profile.
5. Optional: Select a new Type for the issue tracking profile from the list box.
6. Edit the Username and Password.
These credentials are used to access your issue tracking system.
7. Edit the URL of your Bugzilla installation.
8. Click OK.
Silk Central attempts a trial connection to the external system using the information you have provided.
Note: If an error occurs, please review the information that you have supplied, or consult your
administrator.
9. If the trial connection is successful, a confirmation dialog box displays, asking you if you want to map
internal issue states to the states of the newly defined profile.
•
•
Click Yes to proceed with the related Mapping Issue States procedure.
Click No to map issue states later.
Changepoint
This section describes how to configure Changepoint issue tracking profiles.
Changepoint is an IT management and governance tool that enables organizations to maximize the
business value of the entire IT portfolio including projects, applications, and infrastructure.
This integration allows you to connect Silk Central to Changepoint to store issues.
Important: The Changepoint environment must have the Changepoint API installed and the
CPWebService configured.
398
| Silk Central 15.5
Known Issues
Workflow Do not change the Changepoint workflows for requests after submitting them in Silk Central.
Do not use different workflows in requests when assigning external issues. The filter criteria
used in workflows should be based on fields used in the Silk Central Issue Tracking Profile.
Otherwise, unexpected states may be assigned to requests in Silk Central.
Adding Changepoint Issue Tracking Profiles
To add a Changepoint issue tracking profile:
1. In the menu, click Issues > Issue Tracking Integrations. The Issue Tracking page displays, listing all
issue tracking profiles that have been created for the system.
2. Click New Profile to open the New Issue Tracking Profile dialog box.
3. Type a Name for the new profile.
This is the name that is displayed in lists where the profiles are available for selection.
4. Type a Description for the new profile.
5. Select Compuware Changepoint from the Type list box.
6. Type a valid Username and Password for the issue tracking system.
Note: In order to select a project and to submit a new issue, the Username field must contain a
Changepoint user who has the project's Edit Project Plan permission.
7. Enter the URL of your Changepoint installation in the Changepoint Server URL field.
8. Enter the URL of your Changepoint web service server in the Changepoint WebService URL field.
9. Click Load Initiator to load your Changepoint initiators.
10.Select an initiator from the Initiator list box.
11.Click Load Client to load your Changepoint clients.
12.Select a client from the Client list box.
13.Click Load Initiative to load your Changepoint initiatives.
14.Select an initiative from the Initiative list box.
15.Click Load Project to load your Changepoint projects.
16.Select a project from the Project list box.
17.Click Load Request Type to load your Changepoint request types.
18.Select a request type from the Request Type list box.
19.Click Load Application to load your Changepoint applications. Select an application from the
Application list box.
20.Click OK.
Silk Central attempts a trial connection to the external system using the information you have provided.
Note: If an error occurs, please review the information that you have supplied, or consult your
administrator.
21.If the trial connection is successful, a confirmation dialog box displays, asking you if you want to map
internal issue states to the states of the newly defined profile.
•
•
Click Yes to proceed with the related Mapping Issue States procedure.
Click No to map issue states later.
Opening Changepoint Issues in Context
To open Silk Central issues in the context of the Changepoint system, you need to place a specific file in
the virtual directory on the Changepoint server. To do so, follow the steps below:
Silk Central 15.5
| 399
1. In the menu, click Help > Tools to view the Downloadable Client Tools page.
2. Click the Changepoint Request Form link.
3. When prompted, choose to save the ChangepointRequestForm.zip file to disk.
4. Extract CPRequestForm.html from ChangepointRequestForm.zip.
If you are using Changepoint 2010, the required file is in the Changepoint 2010 folder. It is called
CPRequestForm2010.html. Extract this file and manually rename it to CPRequestForm.html.
5. Manually copy CPRequestForm.html to the Changepoint server and placed into the virtual directory
in which Changepoint is running.
Synchronizing the Time for the Changepoint and Silk Central Servers
This section describes how to ensure that the Changepoint server and Silk Central server communicate
properly.
1. Open the web.config file located in the ../Changepoint/CP Web Services directory.
2. Add the following key to the security section:
<timeToleranceInSeconds>86400</timeToleranceInSeconds>
3. Save the file.
IBM Rational ClearQuest
This section describes how to configure IBM Rational ClearQuest issue tracking profiles to integrate with
Silk Central.
IBM Rational ClearQuest products provide flexible defect/change tracking and automated workflow
support. The two key products are IBM Rational ClearQuest (ClearQuest) and IBM Rational ClearQuest
MultiSite (ClearQuest Multisite). To work with ClearQuest profiles, you must have the ClearQuest client
software installed on the computer where the Silk Central front-end server is running. For detailed
information about installing ClearQuest, refer to the ClearQuest documentation.
For a list of the ClearQuest versions that are supported for integration with Silk Central, refer to the Silk
Central Release Notes.
Adding ClearQuest Issue Tracking Profiles
To add a ClearQuest issue tracking profile:
1. In the menu, click Issues > Issue Tracking Integrations. The Issue Tracking page displays, listing all
issue tracking profiles that have been created for the system.
2. Click New Profile to open the New Issue Tracking Profile dialog box.
3. Type a Name for the new profile.
This is the name that is displayed in lists where the profiles are available for selection.
4. Type a Description for the new profile.
5. Select IBM Rational ClearQuest from the Type list box.
6. Type a valid Username and Password.
These credentials will be used to access the issue tracking system.
7. Enter the Repository Info of your ClearQuest installation.
This is the database name that is defined in the ClearQuest client software. The name of the sample
database is SAMPL.
Note: It is not possible to use more than one ClearQuest schema repository. Silk Central will
connect to the default ClearQuest repository.
8. Specify the Record Type, which is the issue type of ClearQuest.
400
| Silk Central 15.5
When entering an issue in Silk Central, ClearQuest will save the issue with the issue type you define in
this text box. The default issue type is Defect.
9. Click OK.
Silk Central attempts a trial connection to the external system using the information you have provided.
Note: If an error occurs, please review the information that you have supplied, or consult your
administrator.
10.If the trial connection is successful, a confirmation dialog box displays, asking you if you want to map
internal issue states to the states of the newly defined profile.
•
•
Click Yes to proceed with the related Mapping Issue States procedure.
Click No to map issue states later.
Editing ClearQuest Issue Tracking Profiles
When the server or login credentials of your issue tracking system change, you must edit your issue
tracking profile accordingly.
To edit an existing ClearQuest issue tracking profile:
1. In the menu, click Issues > Issue Tracking Integrations. The Issue Tracking page displays, listing all
issue tracking profiles that have been created for the system.
2. Click on the name of the issue tracking profile that you want to modify. The Edit Issue Tracking Profile
dialog box opens.
3. Edit the Name of the profile.
This is the name that is displayed in lists where profiles are available for selection.
4. Edit the Description of the profile.
5. Optional: Select a new Type for the issue tracking profile from the list box.
6. Edit the Username and Password.
These credentials are used to access your issue tracking system.
7. Edit the Repository Info of your ClearQuest installation.
This is the database name that is defined in the ClearQuest client software. The name of the sample
database is SAMPL.
Note: It is not possible to use more than one ClearQuest schema repository. Silk Central will
connect to the default ClearQuest repository.
8. Change the Record Type, which is the issue type of ClearQuest.
When entering an issue in Silk Central, ClearQuest saves the issue with the issue type you define in
this field.
9. Click OK.
Silk Central attempts a trial connection to the external system using the information you have provided.
Note: If an error occurs, please review the information that you have supplied, or consult your
administrator.
10.If the trial connection is successful, a confirmation dialog box displays, asking you if you want to map
internal issue states to the states of the newly defined profile.
•
•
Click Yes to proceed with the related Mapping Issue States procedure.
Click No to map issue states later.
Issue Manager
Issue Manager, the issue-tracking tool of Silk Central, is fully integrated with Silk Central, enabling you to
correlate issues with system requirements and executed tests.
Silk Central 15.5
| 401
Test issues can be added and managed in the menu through Tests > Details View > Issues. For more
information, see the Issue Manager topics in this Help.
Adding Issue Manager Issue Tracking Profiles
To add an Issue Manager issue tracking profile:
1. In the menu, click Issues > Issue Tracking Integrations. The Issue Tracking page displays, listing all
issue tracking profiles that have been created for the system.
2. Click New Profile to open the New Issue Tracking Profile dialog box.
3. Type a Name for the new profile.
This is the name that is displayed in lists where the profiles are available for selection.
4. Type a Description for the new profile.
5. Select Issue Manager from the Type list box.
6. Type a valid Username and Password.
These credentials will be used to access the issue tracking system.
7. Type the Issue Manager URL of your Issue Manager installation. This is the URL you use to login to
Issue Manager, though without the login extension at the end.
For example, if your standard Issue Manager URL is http://IssueManager/login, then the
correct service URL is http://IssueManager.
8. Optional: If Issue Manager should communicate with the front-end server through a different URL than
the one that users use to access the Web user interface, type this URL into the Web Service URL field.
This is required for example when users access the Web user interface through a proxy, while Issue
Manager needs the internal URL or IP address of the front-end server.
9. Proceed as follows:
1. Click Load Projects. This action will populate the Project list box with all initialized Issue Manager
projects to which the specified user has access to. Note that only those projects display for which
Issue Manager user groups have been defined, and the defined user is a member of at least one
user group.
2. Select the Project where Issue Manager issues are maintained.
Caution: We recommend not to use identical projects for Issue Manager and Silk Central, as this
limits flexibility in working with both tools on different future projects.
10.Click OK.
Silk Central attempts a trial connection to the external system using the information you have provided.
Note: If an error occurs, please review the information that you have supplied, or consult your
administrator.
the
trial connection is successful, a confirmation dialog box displays, asking you if you want to map
11.If
internal issue states to the states of the newly defined profile.
•
•
Click Yes to proceed with the related Mapping Issue States procedure.
Click No to map issue states later.
Editing Issue Manager Issue Tracking Profiles
When the server or login credentials of your issue tracking system change, you must edit your issue
tracking profile accordingly.
To edit an existing Issue Manager issue tracking profile:
1. In the menu, click Issues > Issue Tracking Integrations. The Issue Tracking page displays, listing all
issue tracking profiles that have been created for the system.
2. Click on the name of the issue tracking profile that you want to modify. The Edit Issue Tracking Profile
dialog box opens.
402
| Silk Central 15.5
3. Edit the Name of the profile.
This is the name that is displayed in lists where profiles are available for selection.
4. Edit the Description of the profile.
5. Optional: Select a new Type for the issue tracking profile from the list box.
6. Edit the Username and Password.
These credentials are used to access your issue tracking system.
7. Edit the Issue Manager URL of your Issue Manager installation if the location has changed.
This is the URL you use to login to Issue Manager, though without the login extension at the end. For
example, if your standard Issue Manager URL is http://IssueManager/login, then the correct
service URL would be http://IssueManager.
8. Optional: If Issue Manager should communicate with the front-end server through a different URL than
the one that users use to access the Web user interface, type this URL into the Web Service URL field.
This is required for example when users access the Web user interface through a proxy, while Issue
Manager needs the internal URL or IP address of the front-end server.
9. To change the Issue Manager project, click Load Projects to load all projects from the server and
update the Project list box, then select a project from the Project list box.
10.Click OK.
Silk Central attempts a trial connection to the external system using the information you have provided.
Note: If an error occurs, please review the information that you have supplied, or consult your
administrator.
11.If the trial connection is successful, a confirmation dialog box displays, asking you if you want to map
internal issue states to the states of the newly defined profile.
•
•
Click Yes to proceed with the related Mapping Issue States procedure.
Click No to map issue states later.
StarTeam Issue Tracking Profiles
This section describes how to configure StarTeam issue tracking profiles to integrate with Silk Central.
StarTeam is a software change management and configuration management tool that enables coordination
and management of the software delivery process.
To work with StarTeam profiles and use the go-to-link functionality for change requests in StarTeam, you
must have the StarTeam Cross-Platform Client software installed on the computer where the browser is
running.
For a list of the StarTeam versions that are supported for integration with Silk Central, refer to the Silk
Central Release Notes.
Adding StarTeam Issue Tracking Profiles
To add a StarTeam issue tracking profile:
1. In the menu, click Issues > Issue Tracking Integrations. The Issue Tracking page displays, listing all
issue tracking profiles that have been created for the system.
2. Click New Profile to open the New Issue Tracking Profile dialog box.
3. Edit the Name of the profile.
This is the name that is displayed in lists where profiles are available for selection.
4. Type a Description for the new profile.
5. Select StarTeam from the Type list box
6. Type a valid Username and Password.
These credentials will be used to access the issue tracking system.
Silk Central 15.5
| 403
7. Type the Hostname of your StarTeam server and the Port that is used to connect to the server. If this
setting has not been changed, use the default port 49201.
8. Specify the type of Encryption that the profile supports.
9. Click Load Project to load all projects from the server and populate the Project list box, then select a
project from the Project list box.
10.Click Load View to load all views for the selected project and populate the View list box, then select a
view from the View list box.
11.Click Load Status Field to load all enumeration fields for change requests and populate the Status
Field list box, then select a status field from the Status Field list box.
If you are using a custom workflow in StarTeam, this field is the workflow driver field in StarTeam that
maps to the Silk Central issue state.
12.Select a type of link from the Link Type list box.
starteam://
External ID links on the Issues tab will open the cross platform client.
http://
External ID links on the Issues tab will open the issue in the StarTeam web UI.
13.If you selected http:// in the Link Type list box, enter the web server address of the StarTeam web
UI in the WebServer field.
14.Select Yes or No in the Workflow field. Select Yes to show the required fields that are specified in the
workflow of the selected View.
15.Click OK.
Silk Central attempts a trial connection to the external system using the information you have provided.
Note: If an error occurs, please review the information that you have supplied, or consult your
administrator.
16.If the trial connection is successful, a confirmation dialog box displays, asking you if you want to map
internal issue states to the states of the newly defined profile.
•
•
Click Yes to proceed with the related Mapping Issue States procedure.
Click No to map issue states later.
Editing StarTeam Issue Tracking Profiles
When the server or login credentials of your issue tracking system change, you must edit your issue
tracking profile accordingly.
To edit an existing StarTeam issue tracking profile:
1. In the menu, click Issues > Issue Tracking Integrations. The Issue Tracking page displays, listing all
issue tracking profiles that have been created for the system.
2. Click on the name of the issue tracking profile that you want to modify. The Edit Issue Tracking Profile
dialog box opens.
3. Edit the Name of the profile.
This is the name that is displayed in lists where profiles are available for selection.
4. Edit the Description of the profile.
5. Optional: Select a new Type for the issue tracking profile from the list box.
6. Edit the Username and Password.
These credentials are used to access your issue tracking system.
7. Edit the Hostname of your StarTeam server and the Port that is used to connect to the server.
8. Modify the type of Encryption that the profile supports.
9. To change the StarTeam project, click Load Project to load all projects from the server and update the
Project list box, then select a project from the Project list box.
404
| Silk Central 15.5
10.To change the view, click Load View to load all views for the selected project and populate the View list
box, then select a view from the View list box.
11.To change the workflow driver field, click Load Status Field to load all enumeration fields for change
requests and populate the Status Field list box, then select a status field from the Status Field list box.
If you are using a custom workflow in StarTeam, this field is the workflow driver field in StarTeam that
maps to the Silk Central issue state.
12.Select a type of link from the Link Type list box.
starteam://
External ID links on the Issues tab will open the cross platform client.
http://
External ID links on the Issues tab will open the issue in the StarTeam web UI.
13.If you selected http:// in the Link Type list box, enter the web server address of the StarTeam web
UI in the WebServer field.
14.Select Yes or No in the Workflow field. Select Yes to show the required fields that are specified in the
workflow of the selected View.
15.Click OK.
Silk Central attempts a trial connection to the external system using the information you have provided.
Note: If an error occurs, please review the information that you have supplied, or consult your
administrator.
16.If the trial connection is successful, a confirmation dialog box displays, asking you if you want to map
internal issue states to the states of the newly defined profile.
•
•
Click Yes to proceed with the related Mapping Issue States procedure.
Click No to map issue states later.
Team Foundation Server
This section describes how to configure Team Foundation Server (TFS) issue tracking profiles to integrate
with Silk Central.
TFS versions that are currently supported for integration with Silk Central: Team Foundation Server 2010,
2012, 2013
Installing a Team Foundation Server Web Service Proxy
To communicate with a TFS, you need to install a Team Foundation Server Web Service Proxy as an
interface to the TFS.
To install a TFS proxy service:
1. Install Microsoft Visual Studio Team Explorer from http://www.microsoft.com/downloads/details.aspx?
FamilyID=fe4f9904-0480-4c9d-a264-02fedd78ab38.
2. Install IIS and the Web Deployment Tool, for example with the Web Platform Installer from http://
www.microsoft.com/web/downloads/default.aspx.
3. Download the Team Foundation Server Web Service Proxy from Help > Tools.
4. Unzip the downloaded package.
5. Open a command shell and type DotNetTfsWebServiceProxy.deploy.cmd /Y to install the proxy
service. If an error message box displays, stating that ASP.NET 4 is required, refer to http://
msdn.microsoft.com/en-us/library/k6h9cz8h.aspx.
6. Open the IIS Manager.
7. Verify that the new website exists.
8. In the root folder of the virtual directory, open the Web.config file.
9. In the appSettings section of the file, modify the value of the key WorkItemTrackingCacheRoot to a
local directory.
Silk Central 15.5
| 405
For example:
<appSettings>
<add key="WorkItemTrackingCacheRoot" value="C:\temp" />
</appSettings>
10.If the directory you have specified does not exist, create it.
11.Grant Everyone full rights on the specified directory.
For additional information on deploying an ASP.NET Web Application, refer to http://
msdn.microsoft.com/en-us/library/ee942158.aspx.
Adding TFS Issue Tracking Profiles
You need to configure a Team Foundation Server Web Service Proxy, which is provided by Micro Focus to
enable Silk Central to access TFS issues.
Important: This is not the Team Foundation Server Proxy provided by Microsoft.
To add a TFS issue tracking profile:
1. In the menu, click Issues > Issue Tracking Integrations. The Issue Tracking page displays, listing all
issue tracking profiles that have been created for the system.
2. Click New Profile to open the New Issue Tracking Profile dialog box.
3. Type a Name for the new profile.
This is the name that is displayed in lists where the profiles are available for selection.
4. Type a Description for the new profile.
5. Select Team Foundation Server <version> from the Type list box.
6. Type a valid Username and Password.
These credentials will be used to access the issue tracking system.
7. Type the Domain of the TFS user.
8. Enter the URL of your TFS installation.
For example, http://tfsserver:8080/tfs.
9. Type the Collection to which your project belongs.
For example DefaultCollection.
All projects in the collection are listed in the Projects list box.
10.Select the Project from the list box.
11.Type the URL of your TFS proxy. For example http://tfsproxyserver/
DotNetTfsWebServiceProxy_deploy/TfsWebServiceProxy.asmx.
12.Click Load Work Item Type. The Work Item Type list box is populated with the available work item
types.
13.Select the Work Item Type from the list box.
14.Click Load Initial State. The Initial State list box is populated with the states that are allowed for the
selected work item type.
15.Click OK.
Silk Central attempts a trial connection to the external system using the information you have provided.
Note: If an error occurs, please review the information that you have supplied, or consult your
administrator.
16.If the trial connection is successful, a confirmation dialog box displays, asking you if you want to map
internal issue states to the states of the newly defined profile.
•
406
| Silk Central 15.5
Click Yes to proceed with the related Mapping Issue States procedure.
•
Click No to map issue states later.
Editing TFS Issue Tracking Profiles
When the server or login credentials of your issue tracking system change, you must edit your issue
tracking profile accordingly.
To edit an existing TFS issue tracking profile:
1. In the menu, click Issues > Issue Tracking Integrations. The Issue Tracking page displays, listing all
issue tracking profiles that have been created for the system.
2. Click on the name of the issue tracking profile that you want to modify. The Edit Issue Tracking Profile
dialog box opens.
3. Edit the Name of the profile.
This is the name that is displayed in lists where profiles are available for selection.
4. Edit the Description of the profile.
5. Optional: Select a new Type for the issue tracking profile from the list box.
6. Edit the Username and Password.
These credentials are used to access your issue tracking system.
7. Edit the Domain of the TFS user.
8. Edit the URL and Collection of your TFS installation.
9. Select a different Project.
10.Edit the URL and port of your TFS proxy.
11.Click OK.
Silk Central attempts a trial connection to the external system using the information you have provided.
Note: If an error occurs, please review the information that you have supplied, or consult your
administrator.
Deleting Issue Tracking Profiles
To delete an issue tracking profile:
1. In the menu, click Project:<Project Name> > Project Settings .
Note: If you have not selected a project, a warning message opens, asking you to select a project.
Select the project for which you want to define the setting.
2. Click the Issue Tracking tab. The Issue Tracking page opens, listing all of the issue tracking profiles
that have been created for the system.
3. In the Actions column of the issue tracking profile you wish to delete, click Delete issue tracking
profile .... A confirmation dialog box displays.
4. Click Yes.
Issue Tracking Profiles Page
Project:<Project Name> > Project Settings > Issue Tracking
Use this page to configure profiles for the integration of external issue tracking systems into Silk Central.
Click New Profile to create a new issue tracking profile. For each issue tracking profile, the page displays
the following columns:
Column
Description
Name
The name of the profile as it displays in the Silk Central
GUI and in reports. Click the name to edit a profile.
Silk Central 15.5
| 407
Column
Description
Type
The external issue tracking system.
Login
The login name with which Silk Central connects to the
issue tracking system.
Repository Info
The physical location of the issue tracking system.
Hostname or URL.
Created On
Date when the issue tracking profile was created.
Created By
The user who created the issue tracking profile.
Actions
The following actions can be performed on an issue
tracking profile:
•
•
Delete issue tracking profile
Edit mapping of issue tracking profile
Source Control Profiles
Describes how to integrate Silk Central with external source control systems.
Source control profiles enable Silk Central to integrate with external source control systems. Defining
source control profiles allows you to define where Silk Central’s execution servers should retrieve program
sources for test execution.
You need double the amount of free disk space on the execution server to accommodate the source files
because Silk Central checks out the source control tree and then generates a working directory with the
executable source files.
Additional source control systems can be configured by installing a custom plug-in. For detailed
information, refer to the Silk Central API Help.
The following source control systems are currently supported by Silk Central “out of the box”:
Apache Commons Virtual File System
This section describes how to configure Virtual File System (VFS) source control profiles.
A VFS is an abstraction layer on top of a more concrete file system. The purpose of a VFS is to allow client
applications to access different types of concrete file systems in a uniform way. Apache Commons VFS
provides a single API for accessing various file systems. It presents a uniform view of the files from various
sources. The protocols that are currently supported for VFS by Silk Central are:
Protocol Description
http
Copies the given file. This protocol type is also supported for copying and unpacking ZIP, JAR,
or other zipped files. It is required to specify a .zip file on a http server. For example,
zip:http://myTestServer/myTests.zip. The .zip file will be extracted on the execution
server.
ftp
Copies the given file. This protocol type is also supported for copying and unpacking ZIP, JAR,
or other zipped files.
smb
Server Message Block (smb) copies all files and folders. This protocol can be used instead of a
UNC profile. For example, the VFS smb path smb://server-name/shared-resourcepath is equivalent to the UNC path \\server-name\shared-resource-path.
Note: When you create a new ProcessExecutor test that uses VFS for source control, you need to
specify the complete path to the executable in the Executable Name text box.
408
| Silk Central 15.5
Adding VFS Source Control Profiles
To create a VFS source control profile:
1. In the menu, click Project:<Project Name> > Project Settings .
Note: If you have not selected a project, a warning message opens, asking you to select a project.
Select the project for which you want to define the setting.
2. Click the Source Control tab. The Source Control page opens, listing all of the source control profiles
that have been created for the system.
3. Click New Profile to open the New Source Control Profile dialog box.
4. Type a Name for the new profile.
This is the name that is displayed in lists where the profiles are available for selection.
5. Select VFS from the Source control system list box.
6. Type the URL of the VFS Repository you want to access.
Specify the appropriate protocol type in the URL:
FTP
ftp://<ftp server URL>
HTTP
http://<http server URL>
SMB
smb://<Samba server url>
Note: This field is case sensitive.
Note: HTTP, FTP and SMB are also supported for zipped files. In order to point to a zipped file the
URL must be adjusted to <zipped file type>:<protocol>://<server URL pointing
to zipped file> to include the type of the zipped file. For example, zip:http://
193.80.200.135/<path>/archive.zip or jar:http://193.80.200.135/<path>/
archive.jar.
7. Type a valid VFS Username and Password.
These credentials will be used to access your VFS repository. The SMB protocol allows including the
domain name in the username in the following form: domain/username.
8. Type the Working folder to which the Silk Central execution server should copy the source files.
The working folder must be a local path. For example, C:\TempSources\.
9. Type the Project path you want this profile to use. Click Browse to display the Select Project Path
dialog box. The Select Project Path dialog box opens. Select the desired project path in the tree view
and click OK. Leaving this text box empty sets the project path to the root directory.
10.Click OK.
Silk Central attempts a trial connection to the external system using the information you have provided.
Note: If an error occurs, please review the information that you have supplied, or consult your
administrator.
If the trial connection is successful, you are returned to the Source Control page.
Editing VFS Source Control Profiles
To modify a VFS source control profile:
1. In the menu, click Project:<Project Name> > Project Settings .
Note: If you have not selected a project, a warning message opens, asking you to select a project.
Select the project for which you want to define the setting.
2. Click the Source Control tab. The Source Control page opens, listing all of the source control profiles
that have been created for the system.
Silk Central 15.5
| 409
3. Click on the name of the source control profile that you want to modify. The Edit Source Control
Profile dialog box opens.
4. Edit the Name of the profile.
This is the name that is displayed in lists where profiles are available for selection.
5. Edit the URL of the VFS Repository you want to access.
Note: This field is case sensitive.
6. Edit the Username and Password.
These credentials are used to access your repository.
7. Edit the Working folder to which the Silk Central execution server copies the source files.
The working folder must be a local path. For example, C:\TempSources\.
8. Edit the Project path you want this profile to use.
9. Click OK.
Silk Central attempts a trial connection to the external system using the information you have provided.
Note: If an error occurs, please review the information that you have supplied, or consult your
administrator.
If the trial connection is successful, you are returned to the Source Control page.
Git
This section describes how to configure Git source control profiles.
Git is a distributed revision control and source code management (SCM) system with an emphasis on
speed. Every Git working directory is a full-fledged repository with complete history and full version tracking
capabilities, not dependent on network access or a central server.
Adding Git Source Control Profiles
To create a Git source control profile:
1. In the menu, click Project:<Project Name> > Project Settings .
Note: If you have not selected a project, a warning message opens, asking you to select a project.
Select the project for which you want to define the setting.
2. Click the Source Control tab. The Source Control page opens, listing all of the source control profiles
that have been created for the system.
3. Click New Profile to open the New Source Control Profile dialog box.
4. Type a Name for the new profile.
This is the name that is displayed in lists where the profiles are available for selection.
5. Select Git from the Source control system list box.
6. Type the URL of the Git Repository you want to access.
7. Type a valid Git Username and Password, if required.
8. Type the Working folder to which the Silk Central execution server should copy the source files.
The working folder must be a local path. For example, C:\TempSources\.
9. Type the Project path you want this profile to use. Click Browse to display the Select Project Path
dialog box. The Select Project Path dialog box opens. Select the desired project path in the tree view
and click OK. Leaving this text box empty sets the project path to the root directory.
10.Click OK.
Silk Central attempts a trial connection to the external system using the information you have provided.
410
| Silk Central 15.5
Note: If an error occurs, please review the information that you have supplied, or consult your
administrator.
If the trial connection is successful, you are returned to the Source Control page.
Editing Git Source Control Profiles
To modify a Git source control profile:
1. In the menu, click Project:<Project Name> > Project Settings .
Note: If you have not selected a project, a warning message opens, asking you to select a project.
Select the project for which you want to define the setting.
2. Click the Source Control tab. The Source Control page opens, listing all of the source control profiles
that have been created for the system.
3. Click on the name of the source control profile that you want to modify. The Edit Source Control
Profile dialog box opens.
4. Edit the Name of the profile.
This is the name that is displayed in lists where profiles are available for selection.
5. Edit the URL of the Git Repository you want to access.
Note: This field is case sensitive.
6. Edit the Username and Password.
These credentials are used to access your repository.
7. Edit the Working folder to which the Silk Central execution server copies the source files.
The working folder must be a local path. For example, C:\TempSources\.
8. Edit the Project path you want this profile to use.
9. Click OK.
Silk Central attempts a trial connection to the external system using the information you have provided.
Note: If an error occurs, please review the information that you have supplied, or consult your
administrator.
If the trial connection is successful, you are returned to the Source Control page.
Microsoft Team Foundation Server
This section describes how to configure Team Foundation Server (TFS) source control profiles.
TFS versions that are currently supported for integration with Silk Central: Team Foundation Server 2010,
2012, 2013
Note: To add a TFS source control profile, the Microsoft Visual Studio Team Explorer Everywhere
command-line client needs to be installed on the front-end server and every execution server on
which you want to use the source control profile. You can download the CLC from the Microsoft
Download Center. You must run Team Explorer Everywhere and accept the license agreement to
make the integration work. For more information, refer to this knowledge base article.
Adding TFS Source Control Profiles
To add a TFS source control profile, the Microsoft Visual Studio Team Explorer Everywhere command-line
client needs to be installed on the front-end server and every execution server on which you want to use
the source control profile. You can download the CLC from the Microsoft Download Center. You must run
Team Explorer Everywhere and accept the license agreement to make the integration work. For more
information, refer to this knowledge base article.
To create a TFS source control profile:
Silk Central 15.5
| 411
1. In the menu, click Project:<Project Name> > Project Settings .
2.
3.
4.
5.
6.
Note: If you have not selected a project, a warning message opens, asking you to select a project.
Select the project for which you want to define the setting.
Click the Source Control tab. The Source Control page opens, listing all of the source control profiles
that have been created for the system.
Click New Profile to open the New Source Control Profile dialog box.
Type a Name for the new profile.
This is the name that is displayed in lists where the profiles are available for selection.
Select Team Foundation Server from the Source control system list box.
Enter the URL of your TFS installation.
For example, http://tfsserver:8080/tfs.
7. Type the Domain of the TFS user.
8. Type a valid Username and Password.
These credentials will be used to access your repository.
9. Type the Working folder to which the Silk Central execution server should copy the source files.
The working folder must be a local path. For example, C:\TempSources\.
10.Type the Project path you want this profile to use. Click Browse to display the Select Project Path
dialog box. The Select Project Path dialog box opens. Select the desired project path in the tree view
and click OK. Leaving this text box empty sets the project path to the root directory.
11.Click OK.
Silk Central attempts a trial connection to the external system using the information you have provided.
Note: If an error occurs, please review the information that you have supplied, or consult your
administrator.
If the trial connection is successful, you are returned to the Source Control page.
Editing TFS Source Control Profiles
To add a TFS source control profile, the Microsoft Visual Studio Team Explorer Everywhere command-line
client needs to be installed on the front-end server and every execution server on which you want to use
the source control profile. You can download the CLC from the Microsoft Download Center. You must run
Team Explorer Everywhere and accept the license agreement to make the integration work. For more
information, refer to this knowledge base article.
To modify a TFS source control profile:
1. In the menu, click Project:<Project Name> > Project Settings .
2.
3.
4.
5.
6.
7.
412
| Silk Central 15.5
Note: If you have not selected a project, a warning message opens, asking you to select a project.
Select the project for which you want to define the setting.
Click the Source Control tab. The Source Control page opens, listing all of the source control profiles
that have been created for the system.
Click on the name of the source control profile that you want to modify. The Edit Source Control
Profile dialog box opens.
Edit the Name of the profile.
This is the name that is displayed in lists where profiles are available for selection.
Edit the URL of the TFS Repository you want to access.
Edit the Username and Password.
These credentials are used to access your repository.
Edit the Working folder to which the Silk Central execution server copies the source files.
The working folder must be a local path. For example, C:\TempSources\.
8. Edit the Project path you want this profile to use.
9. Click OK.
Silk Central attempts a trial connection to the external system using the information you have provided.
Note: If an error occurs, please review the information that you have supplied, or consult your
administrator.
If the trial connection is successful, you are returned to the Source Control page.
Serena Version Manager (PVCS)
This section describes how to configure Serena Version Manager (PVCS) source control profiles.
Serena Version Manager, from the makers of PVCS, is the full-featured solution for version control and
revision management in software projects. More than simply storing code revisions, Version Manager is a
robust, full-featured solution with security, high performance, and varying levels of support for distributed
teams.
Note: To add a PVCS source control profile, the PVCS client needs to be installed on the front-end
server and every execution server on which you want to use the source control profile.
Adding PVCS Source Control Profiles
To create a PVCS source control profile:
1. In the menu, click Project:<Project Name> > Project Settings .
2.
3.
4.
5.
6.
7.
8.
Note: If you have not selected a project, a warning message opens, asking you to select a project.
Select the project for which you want to define the setting.
Click the Source Control tab. The Source Control page opens, listing all of the source control profiles
that have been created for the system.
Click New Profile to open the New Source Control Profile dialog box.
Type a Name for the new profile.
This is the name that is displayed in lists where the profiles are available for selection.
Select PVCS from the Source control system list box.
Type the UNC path of the PVCS Repository you want to access.
If you do not know the UNC path of the repository, consult your PVCS administrator.
Type a valid UNC username and UNC password.
These credentials are required to access the UNC path of the configuration file.
Type the Working folder to which the Silk Central execution server should copy the source files.
The working folder must be a local path. For example, C:\TempSources\.
9. Type the Execution path. This is the local path of the PVCS installation, where the command line tool
pcli.exe is located. The default path is C:\Program Files\Serena\vm\win32\bin.
Note: The PVCS client software must be installed on the front-end server and each execution
server. PVCS must be installed in identical paths on each machine. For example, if you install
PVCS on the TestPartner front-end server to C:\Program Files\Serena\, you must install
PVCS in the same path on the execution servers.
10.Type a valid Username and Password.
These credentials will be used to access your repository.
11.Type the Project path you want this profile to use. Click Browse to display the Select Project Path
dialog box. The Select Project Path dialog box opens. Select the desired project path in the tree view
and click OK. Leaving this text box empty sets the project path to the root directory.
12.Click OK.
Silk Central attempts a trial connection to the external system using the information you have provided.
Silk Central 15.5
| 413
Note: If an error occurs, please review the information that you have supplied, or consult your
administrator.
If the trial connection is successful, you are returned to the Source Control page.
Editing PVCS Source Control Profiles
To modify a PVCS source control profile:
1. In the menu, click Project:<Project Name> > Project Settings .
Note: If you have not selected a project, a warning message opens, asking you to select a project.
Select the project for which you want to define the setting.
2. Click the Source Control tab. The Source Control page opens, listing all of the source control profiles
that have been created for the system.
3. Click on the name of the source control profile that you want to modify. The Edit Source Control
Profile dialog box opens.
4. Edit the Name of the profile.
This is the name that is displayed in lists where profiles are available for selection.
5. Edit the UNC path of the PVCS Repository. If you do not know the UNC path of the repository, consult
your PVCS administrator.
6. Edit the UNC username and UNC password as required. These credentials are required to access the
repository UNC path you specified above.
7. Edit the Working folder to which the Silk Central execution server copies the source files.
The working folder must be a local path. For example, C:\TempSources\.
8. Edit the Execution path. This is the local path of the PVCS installation, where the command line tool
pcli.exe is located. The default path is C:\Program Files\Merant\vm\win32\bin.
Note: The PVCS client software must be installed on the front-end server and each execution
server. PVCS must be installed in identical paths on each machine. For example, if you install
PVCS on the Silk Central front-end server to C:\Program Files\Serena\, you must install
PVCS in the same path on the execution servers.
9. Edit the Username and Password.
These credentials are used to access your repository.
10.Edit the Project path you want this profile to use.
11.Click OK.
Silk Central attempts a trial connection to the external system using the information you have provided.
Note: If an error occurs, please review the information that you have supplied, or consult your
administrator.
If the trial connection is successful, you are returned to the Source Control page.
Silk Test Workbench
This section describes how to configure Silk Test Workbench source control profiles.
Silk Test Workbench is an automated testing tool that accelerates the functional testing of complex
applications. Silk Test Workbench provides support for testing applications developed in a wide variety of
development tools including Java, .NET, browser-based web applications, and COM components,
including both ActiveX controls and automation objects. With Silk Test Workbench, you can record user
sessions with your applications to create tests, enhance the test by adding validation and test logic, and
play back tests to ensure that the applications work as expected.
Note: To add a Silk Test Workbench source control profile, the Silk Test Workbench client needs to
be installed on every execution server on which you want to use the source control profile.
414
| Silk Central 15.5
Adding Silk Test Workbench Source Control Profiles
To create a Silk Test Workbench source control profile:
1. In the menu, click Project:<Project Name> > Project Settings .
Note: If you have not selected a project, a warning message opens, asking you to select a project.
Select the project for which you want to define the setting.
2. Click the Source Control tab. The Source Control page opens, listing all of the source control profiles
that have been created for the system.
3. Click New Profile to open the New Issue Tracking Profile dialog box.
4. Type a Name for the new profile.
This is the name that is displayed in lists where the profiles are available for selection.
5. Select Silk Test Workbench Test from the Source control system list box.
6. Select a database type from the Database type list box, either SQL Server or Oracle.
Note: The Microsoft Office Access database type is not supported. When connecting to a Silk Test
Workbench Oracle database, there is a Silk Test Workbench requirement that the TNS name must
be the same as the host server name.
7. Enter the name of the Silk Test Workbench database server in the Database server text box.
8. Enter the name of the Silk Test Workbench database in the Database name text box.
9. Enter the port number of the Silk Test Workbench