1
MSLog for MGX II Operator Manual
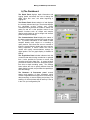
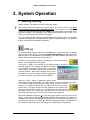
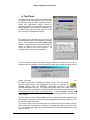
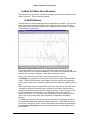
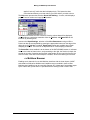
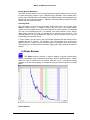
Two selection buttons are available, Automatic and Manual. When Automatic is
selected, the image is displayed with an automatic gain adjustment that maximizes the
contrast between the wave amplitudes. When Manual is selected, the image is
displayed with the amplitude range defined in the scale window, which can be modified
by the user.
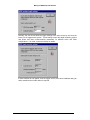
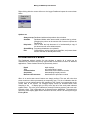
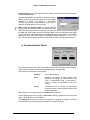
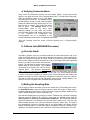
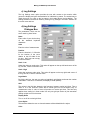
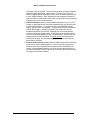
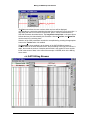
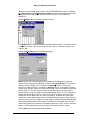
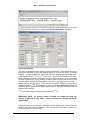
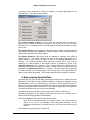
Clicking Logs opens the Log Settings dialog for setting up the receivers transit time,
amplitude or slowness log. Slowness is shown here.
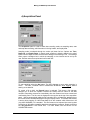
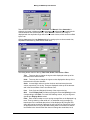
This dialog allows control of the log Title, Units, Scale, Line, Grid and Filter.
Title
Text entry box to change the log trace title displayed at the top of the
browser and the short headers.
Units Text entry box to change the log trace units displayed at the top of the
browser and in the short headers.
Scale Low and High values to set the minimum and maximum plot scale
values, respectively, for the log. These are displayed at the top of the browser
and in the short headers if there is sufficient room.
Line
Color, Style and Weight (thickness) of the trace on the log.
Grid
Check Display Grid to enable vertical grids. Enter the Spacing in units
corresponding to the Scale. For each SAF1000Img column, only one log trace
should have Display Grid checked.
Filter Enter a filter number to use a moving average filter on the displayed Log
trace. Thus by selecting a filter width of 5, a calculated moving average log,
based upon five incremental data points, will be displayed. By using the filter,
spiky data can be smoothed. Data gaps in well logs can be overcome by using
an appropriate filter so long as the data missing does not exceed more than 9
incremental units. Note that the filter does not change the actual data, but is
P/N 7000164G
47