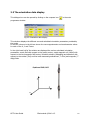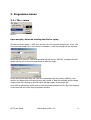
1
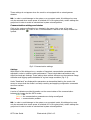
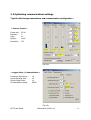
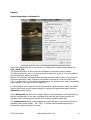
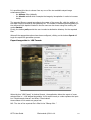
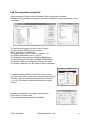
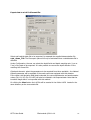
OPTV User Manual Before you start…......................................................................................................................3 1. The main user interface window...........................................................................................4 Status bar information display :...................................................................................................................4 1.1 Depth, logging speed, image resolution and sonde orientation information display..............5 1.2 Sonde and data replay controls..................................................................................................6 2. Logger, sonde and communications settings .......................................................................8 2.1 Logger settings............................................................................................................................8 Configuring the winch type and depth encoder parameters :...........................................................................8 Probe configuration settings.............................................................................................................................9 Communication settings and status................................................................................................................10 Settings.......................................................................................................................................................10 Status..........................................................................................................................................................10 2.2 Optimising communications settings.......................................................................................11 Typical initial image transmission and communication configuration : .......................................................11 « Camera Control »...................................................................................................................................11 « Logger Setup / Communication » ..........................................................................................................11 Uphole communication initial configuration :...............................................................................................12 Downhole communication initial configuration :...........................................................................................12 Increasing uphole transmission speed :..........................................................................................................12 2.2 Camera and image settings......................................................................................................14 2.3 The orientation data display....................................................................................................16 3. Programme menus...............................................................................................................17 3.1 « File » menu.............................................................................................................................17 Open and play: Select an existing data file for replay....................................................................................17 Export :...........................................................................................................................................................18 Export image data to a bitmap file : ..........................................................................................................18 Export image data in LGX Format: .........................................................................................................19 LGX File Importation in WellCad : ..........................................................................................................20 Export data to a LAS 2.0 format file : .......................................................................................................21 New log..........................................................................................................................................................22 Log header: information concerning the client and borehole....................................................................22 Log header: log date, sequencing and borehole data.................................................................................23 Log header: casing and open hole data......................................................................................................24 Log header: free text field for remarks......................................................................................................24 Exit.................................................................................................................................................................24 3.2 « Setup » Menu.........................................................................................................................25 Camera Control : ...........................................................................................................................................25 Logger Setup :................................................................................................................................................25 Deviation Data : .............................................................................................................................................25 Imperial Depht :..............................................................................................................................................25 4. Appendices :.........................................................................................................................26 4.1 EmOPTV.tol file.......................................................................................................................26 4.2 Importation File *.OTV..........................................................................................................26 4.3 Troubleshooting and other options..........................................................................................27 I get an error message Can’t load FTD2xx.dll ..........................................................................................27 How can I configure the system for another logging sonde?.....................................................................27 I would like to change the image refresh rate to avoid display problems..................................................27 What does the audible alarm during logging signify ?..............................................................................27 Image offset adjustment.............................................................................................................................28 OPTV User Guide Electromind ©2011 r1.4 2 Before you start… This software is supplied with the files necessary for the operation of the sonde for which it was developed and has been optimised to operate under Microsoft Windows XP in mode 32bit colour. On connecting the logger acquisition system to your computer for the first time, you will be asked to install the USB. It is available in the driver repertory file for your application or your installation CD. The install documentation and USB driver is also available on the site www.electromind.eu, follow the download link and click Full package v1.06.06 with user guide FR & UK. For old OS, for Windows 7 use Full package v2.06.00 for Windows7 . Note that the OPTV sonde configuration file (EmOptv.tol) supplied with this software should not be modified; since this may cause incorrect operation or even damage to the sonde. For reference, a copy of the original, unmodified configuration file is included as an appendix to this document. A sample data file is installed with the software in the sub-directory “Demo” to allow the software to be used in replay mode. Recommended minimum system configuration: Intel Pentium XXX Mhz/ AMD Athlon 1800 – 256 MB RAM – 1 free USB port OS: Microsoft Windows XP (SP2) , Microsoft Windows 2000 or Windows 7 OPTV User Guide Electromind ©2011 r1.4 3 1. The main user interface window Fig. 1.0 The control panel is divided into several areas concerned with different aspects of the sonde configuration and logging operations. The current sonde depth, logging speed and a number of other parameters are displayed in the upper left part of the screen (fig.1.2). In the upper right part of the control panel are found the different controls and information for sonde power switching and data acquisition or replay (fig.1.5). A status bar in the lower part of the screen provides additional information concerning system status, data transmission and the recording in progress (fig.1.1). Additionally, the programme menu bar allows access to other functions related to data recording or replay and sonde or system configuration options. Status bar information display : Data file currently being recorded or replayed System and USB information Receive Power control Transmit Receive fig. 1.1 OPTV User Guide Electromind ©2011 r1.4 4 1.1 Depth, logging speed, image resolution and sonde orientation information display Depth displayed at sonde bottom Fig. 1.2a Replay mode Depth displayed at sonde top Fig. 1.2b Acquisition mode (for a sonde with optional natural gamma detector) The current tool depth and logging speed are updated continuously in real time while the Logger is powered on and connected to the logging computer’s USB port. While in acquisition mode, the depth display (in yellow) indicates the current depth of the sonde. The depth display becomes blue when the Logger is powered off or when operating in replay mode. In the latter case, the depth display indicates the point reached in the data file replay. Below the depth indicator are a number of displays related to the sonde orientation data transmitted along with the borehole image. In the upper row appear, from left to right, the borehole inclination with respect to the vertical, the borehole azimuth and, finally, representing the angle in degrees between the gravity and magnetic field vectors. Beneath these are two values labelled H and G representing the strengths of, respectively, the magnetic and gravity field measured by the sonde. These parameters can be potentially useful in determining when the orientation data provided by the sonde may have been degraded by proximity to borehole casing or by magnetic rock formations. The compass needle icon at the left hand side of this display window indicates the rotation of the sonde in the borehole relative to magnetic north. As a confirmation of the actual sonde in use, its serial number is displayed to the right of the total gravitational field value. NB: Should a problem occur with the sonde orientation sensor the orientation data values will flash against a red background while the problem persists. When no orientation is applied to the borehole image during acquisition mode, the orientation data is displayed in green indicating the correct operation of the sensor. An orientation data subwindow is also available for consultation of the raw and calculated orientation parameters (see section 2.3 The orientation data display). OPTV User Guide Electromind ©2011 r1.4 5 Clicking on the magnifying glass icon in the upper left part of this panel opens an enlarged depth display window as shown below: Image depth scale in m (or Feet) Fig.1.3 This display window, which also gives the current logging speed and image resolution, can be closed either by double-clicking on it or by clicking on the close window button in its upper right-hand corner. The button allows the operator to enter an initial depth value prior to commencing a logging run, providing that the Logger is connected and powered on and that no recording is currently being made. (Fig.1.4). The depth value entered at this point should correspond to the depth with respect to the top of the sonde. Fig.1.4 The current tool depth can be displayed in one of two ways : with respect to the sonde head connection or, alternatively, with respect to the bottom of the sonde. Double-clicking on the sonde icon to the right of the depth value display will switch the depth display between these modes, with the icon changing accordingly. Depth displayed at sonde top: Depth displayed at sonde bottom: 1.2 Sonde and data replay controls Fig. 1.5a Data replay mode Fig.1.5b Data acquisition mode OPTV User Guide Electromind ©2011 r1.4 6 Fig. 1.5c Recording mode Fig. 1.5D Recording paused This part of the control panel changes according to the current programme operating mode: In replay mode (fig. 1.5a). The control buttons operate as for a video recorder, the replay time counter is displayed when the play button is clicked and disappears when the pause button is clicked. File replay speed can be adjusted with the sliding cursor control . Clicking on the stop button will terminate the replay in progress. While in pause mode, the restart button allows a replay to be restarted from the beginning of the data file. In acquisition mode (fig.1.5b) Once the Logger is correctly connected and switched on, the sonde power button becomes visible. After checking that system is configured correctly for the OPTV sonde by means of the button (logging cable type, and sonde power voltage) the sonde can be powered up to begin the recording of a log; the probe communication status being indicated by the “Probe Control” display. The start of data transmission is signalled by a “beep” from the system. The sonde function status is confirmed by the indicator at the lower right of the main programme window. As a further check on correct sonde operation, the sonde voltage and current consumption indicators will flash red in the case that abnormal values are detected. Recording a log (fig.1.5c) when the sonde is powered up and the communication with the sonde correctly configured, the « New log » menu option under « File » becomes available (see section 3.1.2). This command enables a new log to be recorded, confirmation that recording is taking place is given by the flashing record button. Pause recording (fig.1.5d) recording can be temporarily halted by clicking on the pause button . To continue recording, either click again on the pause button or click on the record button. Stop recording: this is accomplished by clicking on the stop button or sonde power button. A new log can then be started using the “File” – “New log” commands. OPTV User Guide Electromind ©2011 r1.4 7 2. Logger, sonde and communications settings 2.1 Logger settings Configuring the winch type and depth encoder parameters : Click on the system configuration icon situated in the upper right corner of the main programme window , then on the « Winch » tab when the setup window has opened. Fig. 2.0 Winch and encoder settings This dialogue box is used to configure depth encoder direction and resolution, depth measuring pulley circumference and the type of cable with which the winch is equipped as well as the direction of the encoder. It is particularly important to ensure that the correct cable type is selected. NB : in order to avoid damage to the system or a connected sonde, this dialogue box may only be accessed when sonde power is switched off. In file replay mode, certain settings are greyed out in order to avoid an unintentional system misconfiguration. OPTV User Guide Electromind ©2011 r1.4 8 Probe configuration settings Click on the system configuration icon situated in the upper right corner of the main programme window , then on the « Probe » tab when the setup window has opened. Fig.2.1 Probe configuration settings The surface sonde power voltage may be adjusted only within the preset limits defined in the system (90 to 110V). The voltage received by the sonde is displayed in yellow to the right of this setting. It is also possible to apply a correction for the local magnetic field declination (0 to 359.99°) in order to correct image orientation from magnetic to true north. The sonde selection setting sets up the system for the OPTV sonde in use, based on its serial number. This ensures that the system is setup up correctly in respect of certain sonde parameters (HeightOffset, ImageOffset, etc.: see EmOPTV.tol). By means of the Add and Remove buttons, the user can enable the system for a newly acquired OPTV sonde (the required configuration file will be supplied with the sonde) or remove one no longer in use. The Image Offset refers to the position of the camera reference pixel with respect to the reference axis of the sonde orientation sensor. This setting does not need to be changed under normal circumstances. An inappropriate setting will cause acquired borehole image data to be incorrectly orientated. The image offset verification/modification procedure is explained in the Trouble Shooting and other options section of this document. For OPTV sondes fitted with the optional natural gamma detector, one of three display display modes can be chosen for this parameters from the drop-down list. These are: Hide to turn off the natural gamma display; Manual to fix manually the upper limit of the display scale and Auto to let the system configure the scale setting automatically. If the Average check box is selected, a filter will be applied to the natural gamma data using the usermodifiable smoothing factor shown in the adjacent scrolling settings box. The Gamma Coefficient setting allows the operator to modify the calibration factor in order to obtain values directly calculated in standard API units. OPTV User Guide Electromind ©2010 r1.3 9 These settings do not appear when the sonde is not equipped with a natural gamma detector. NB : in order to avoid damage to the system or a connected sonde, this dialogue box may only be accessed when sonde power is switched off. In file replay mode, certain settings are greyed out in order to avoid an unintentional system misconfiguration. Communication settings and status Click on the system configuration icon situated in the upper right corner of the main programme window , then on the « Communication » tab when the setup window has opened. Fig.2.2 Communication settings Settings With the aid of this dialogue box, a number of important communication parameters can be adjusted in order to optimise sonde performance. These include data transmission rate, signal level and gain settings. These settings have a direct influence on the maximum image resolution and logging speed obtainable for a given image resolution (Fig. 2.3). Under “Read back” are displayed the parameters as transmitted back by the sonde: this serves to ensure that the sonde is correctly receiving and applying configuration commands sent from surface. Status A series of indicators provide information on the current status of the communication between the Logger and the OPTV sonde : Green = OK Yellow = the communication parameters are being reconfigured Reed = communication problem. NB : in order to avoid damage to the system or a connected sonde, this dialogue box may only be accessed when sonde power is switched off. In file replay mode, certain settings are greyed out in order to avoid an unintentional system misconfiguration. OPTV User Guide Electromind ©2010 r1.3 10 2.2 Optimising communications settings Typical initial image transmission and communication configuration : « Camera Control » Frame rate : 25 Hz Exposure : 5 Light : 10 Quality : Good Resolution : 720 Fig.2.3a « Logger Setup / Communication » Downhole Signal Drive : Uphole Receiver Gain : Uphole Signal Drive : Communication Speed : 10 15 10 62500 Fig.2.3b OPTV User Guide Electromind ©2010 r1.3 11 Uphole communication initial configuration : (This section concerns the communication from the OPTV sonde to the logger) Start by applying the typical settings as listed on the previous page. Then proceed as described below to determine the optimum configuration. First, set the « Uphole Receiver Gain » to the minimum value (0). Then, increase the « Uphole Receiver Gain » value gradually (leaving at least three seconds between changes), in 1dB steps, until a valid uphole signal is received. This is indicated by the “Uphole Data Valid” LED indicator becoming green, this state should be maintained for at least ten seconds without an error indication. Once reliable communication has been established, increase the « Uphole Receiver Gain » value by a further 4 dB. Downhole communication initial configuration : (This section concerns the communication from the logger OPTV sonde to the OPTV sonde) First, set the receiver gain setting « Downhole drive » to the minimum value (0). Increase this setting gradually through the entire range and note the spread of values over which valid downhole communication is obtained. This state is indicated by the « Downhole data Valid » indicator LED becoming green. The optimum setting for this parameter corresponds to the mid-point of the range of values giving valid communication: for example should this occur over the range 8 to 32, the optimum value will be (8+32)/2 = 20. Increasing uphole transmission speed : The preceding configuration procedure used an uphole transmission speed setting of 62 500 Baud. Since the uphole transmission speed has a direct bearing on the logging speed that can be achieved with the equipment, it is important that this parameter be set to the highest possible reliable value using the method described in the following paragraphs. Note that this setting may need to be readjusted in the event that either the logging winch, cable type or length and/or acquisition system are changed. Once adjusted, all the communications configuration settings are stored by the software for future use. From the starting value of 62 500 Baud, increase the communication speed to the next available setting. Reduce gradually the « Uphole Receiver Gain » setting and note the lowest value at which valid communication is possible (the « Uphole Data valid » LED remains green). Then, increase gradually the « Uphole Receiver Gain » setting and note the highest value at which valid communication is possible by monitoring the behaviour of the « Uphole Data valid » LED. OPTV User Guide Electromind ©2010 r1.3 12 If the difference between the noted values exceeds 10 dB, increase the communication speed setting to the next available value. If the difference between the noted values is equal to, or less than, 10 dB, the communication speed cannot reliably be increased further. Should the communication remain reliable at a setting of 89 286 Baud, decrease the « Uphole Signal Drive » setting to 9. Decrease this setting further to 8 if reliable communications are possible at a speed of 104 167 Baud. With each successful increase in communication speed, increase the image capture frequency (using the « Frame Rate » setting in the « Camera control » window) until a transfer rate of ± 75% is indicated by the « Data flow » bar chart. In as far as is possible, continue the above procedure to determine the highest possible communication speed that provides at least 10 dB of difference between the highest and lowest working « Uphole Receiver Gain » settings. A minimum of 10 dB working range will ensure reliable communications between the sonde and the logger surface acquisition unit. Once the highest possible communication speed has been established by this method, set the « Uphole Receiver Gain » value to be equal to the lowest working value + 4 dB. OPTV User Guide Electromind ©2010 r1.3 13 2.2 Camera and image settings Open the image settings dialogue box by clicking on the camera icon programme window. in the main Fig.2.4 Camera and image quality controls As previously discussed, the available possibilities in terms of image resolution and quality and acquisition speed increase according to the data transmission speed attained between the OPTV sonde and the Logger. See the previous section of this manual for guidance on this topic. Three “bar-graph” indicators to the left of this dialogue box provide information on data transmission, their function being as follows : Packet size : gives the size of the individual data packet being sent from the sonde to the Logger. This parameter is determined by the basic image resolution, the nature of the image data itself and the amount of compression applied to the image data (according to the Quality setting chosen). Data flow : shows what percentage of total available data bandwidth is currently being used. It is recommended to set a configuration that uses at most 75% of available bandwidth. Buffer size : this indicator displays the number of data packets currently stored in the sonde and awaiting transmission. The system will emit a « beep » should this value exceed 16 packets. Should this occur, modify the image settings to reduce the load on the system. Image settings The three principal settings requiring adjustment are : Frame rate (possible values 20-60 Hz), Exposure (1-24) and Light (1-20). The image quality setting and resolution value determine the size of the transmitted date packets and thus the logging speed obtained. OPTV User Guide Electromind ©2010 r1.3 14 For a normal recording, choose an image quality setting of Medium or Good and an image resolution of 720 pixels. Then, for a good logging speed/image quality compromise, adjust the Frame rate in order that the “Buffer size” bar graph indicator does not increase and that the “Data flow” indicator remains at or around 75%. The Frame rate parameter is the most important factor in determining the final vertical resolution of the image. Next, adjust the Light setting to 10, which ensures an adequate illumination for most cases, then the Exposure value in order to obtain a good quality image. Note that a too high Light setting can lead to problems of colour registration and saturation in the case of very light coloured or white geological formations. NB : Frame rate and exposure are to some extent interdependent and controlled by the sonde to ensure as high a quality image as possible. Three possible settings are available for the real-time image orientation during logging, these are: None (image is orientated with respect to the sonde’s internal reference); High side mode (image is orientated to borehole high-side) ; Magnetic North borehole mode (image is orientated with respect to magnetic North). Orientation filter: setting a higher value for this parameter can help to « smooth out » undesirable high frequency image orientation variations, such as can be caused by very irregular borehole walls. The range of settings available is from 0.1 to 2s in steps of 0.1s. Finally, the Camera T° indicator displays the temperature of the image capture device. The indicators with a yellow background (or blue in replay mode) show the values actually transmitted by the sonde in order that the operator can be sure that the commands sent from the surface have been correctly received and implemented. In the lower region of this dialogue box has been incorporated a tool to enable the operator to optimise the depth sampling vertical resolution in respect of the current tool image resolution setting (360, 720 pixels …) and the borehole diameter. On entering this latter parameter in the text box and clicking on the Calculate button, the ideal vertical sampling resolution in mm will be displayed. NB: Certain command options will not be available during log recording or may be greyedout in replay mode in order not to cause undesirable sonde configuration changes. OPTV User Guide Electromind ©2010 r1.3 15 2.3 The orientation data display This dialogue box can be opened by clicking on the compass icon in the main programme window. Fig.2.5 Orientation data display This windows displays the different raw and calculated orientation parameters provided by the sonde. In the two columns to the left are shown the raw magnetometer and accelerometer values for each of the X, Y and Z axes. In the right-hand half of the window are displayed the various calculated orientation parameters: sonde Roll with respect to the gravity vector; sonde magnetic roll (MRoll) with respect to the local magnetic field vector; borehole azimuth (MHeading) and deviation with respect to the vertical (Incl) and the total measured gravitational (T. Grav) and magnetic (T. Mag) fields. OPTV User Guide Electromind ©2010 r1.3 16 3. Programme menus 3.1 « File » menu Fig.3.0 Open and play: Select an existing data file for replay. Choose the file for replay (*.HED) from the list in the file selection dialogue box. If the .LOX file concerned should not for any reason be available, a warning message will be displayed. Should there be only one .LOX file associated with the chosen .HED file, a dialogue box will appear asking you to choose at what depth to start file replay. In the case where more than one .LOX file is associated with the chosen .HED file, a file selector list dialogue box will open showing the number of data files available and the depth range of each file. Clicking on the OK button will start replay of the chosen file. Once a file is selected the replay control buttons become available and the file name appears in the lower left part of the main programme window. OPTV User Guide Electromind ©2010 r1.3 17 Export : Export image data to a bitmap file : Select and load the data file to be exported, for example the supplied demonstration file optv_demo_720. The uppermost section of the chosen file will appear in the export options window. This window allows the user to choose to export an entire file or part of a file by modifying the start and finish depths as desired. When a file is loaded a suggested depth sampling resolution value is given. It is possible to choose an alternative value, subject to the limitation than this can never be smaller than 0.5*, or greater than 5*, the original suggested value. For guidance, the range of acceptable values appears to the right of the text entry box. It is also possible at this stage to choose an alternative image orientation mode (the default mode is that chosen at the recording stage) by choosing the appropriate setting from the Deviation scrolling list box. Under Bitmap Info are shown the number of files and the dimensions of the bitmap file(s) that will be generated. In the case of multiple files, these will be of equal size with the exception of the last file that will contain the remaining available image data. The Output format section of this dialogue box allows the user to choose from the three available output formats (BMP – JPG –TIFF). To reduce final exported image size(s) a black/white output format can be chosen. OPTV User Guide Electromind ©2011 r1.4 18 It is possible at this time to choose from any one of the two available output image enhancement filters: - the bilinear filter (default); - the bicubic method which resample the image by interpolation in order to increase clarity; The exported files are named according to the name of the source file, with the addition of the depth interval covered by that particular file. The number of decimal places appearing in the start and finish depths included in the file name can be chosen using the scrolling list under Decimal. Finally, the button path permits the user to select a destination directory for the exported files. When all the appropriate options have been configured, clicking on the button Export will begin the export file generation process. Export image data in LGX Format: When the box "LGX Format" is checked format , the application allows the export of some selected files in *. LGX Wellcad importable. In this export mode, a combo replaces the input box "Depth sample interval" and offers 5 fixed values. Areas useless in this mode are greyed out. NB: The size of the exported file is filled in the "Bitmap Info. " OPTV User Guide Electromind ©2011 r1.4 19 LGX File Importation in WellCad : When importing in Wellcad, the first window offers to import the file header. Additional import parameters available in the section [WellInfo] are displayed at the end of the window. The second window gives you the choice to import: The actual depth: DEPTH in Feet or meters Watch acquisition: LOG TIME ms The rotation applied: SHIFT ANGLE in degrees * 10 The 6 RAW trajectometry values : HX GZ ... The computed natural gamma : NATURAL GAMMA cps The temperature of the camera: CAMERA TEMPERATURE The image in RGB format following Resolution 360-1440 The format is detailed in the file header to allow importation. To apply the Natural Gamma offset click under the curve Then with right button, select the shortcut menu and choose "Shift By", apply the proposed offset gamma, in this case "1,370 M", the image is already positioned at the correct position. Although the application runs deep in imperial style, Export LGX is in metric mode. Just change the depth parameters in Wellcad. OPTV User Guide Electromind ©2011 r1.4 20 Export data to a LAS 2.0 format file : Select and load the data file to be exported, for example the supplied demonstration file optv_demo_720. The file export options will only be activated when a suitable data file is selected. Under Configuration, the user can select the depth limits and depth sampling rate (1 cm or 5 cm) of the data to be exported. It is also possible to reverse the depth direction of the resulting LAS format file. Displayed channels: select the parameters to be exported from those available – the Natural Gamma parameter will be available if the sonde used was equipped with this detector. If the option Add deviation RAW data is selected, the raw magnetometer and accelerometer values (HX, HY, HZ, GX, GY & GZ) will also be included in the exported data. Note that the borehole image data is not exported with this method. On clicking the Start button the LAS file will be created in the folder LAS20 located in the same directory as the source data file. OPTV User Guide Electromind ©2011 r1.4 21 New log Click to begin recording a new data file. Note that this menu item is only available once a sonde is connected and powered on. fig.3.2 At this point a dialogue box will appear requesting the user to confirm the logging direction and data file depth interval. Choosing this depth interval in no way limits the total length of the recording, it simply defines the maximum length of the individual .LOX files that will be generated and associated with the overall .HED file of the log. For data backups it is obviously essential to transfer the entire set of .LOX files to your backup medium. On clicking the OK button, the user will be prompted to choose a location and name for the data file to be created: for example c:\logdata\site1\borehole1\… There are no pre-defined file naming or directory conventions in this respect. Should, however, a file with the chosen name already exist in the selected location, the user will be prompted as to whether the existing file should be overwritten or the new recording be given a new file name. Log header: information concerning the client and borehole. fig.3.3 OPTV User Guide Electromind ©2011 r1.4 22 Log header: logging depth datum information. fig.3.4 Log header: log date, sequencing and borehole data. fig.3.5 OPTV User Guide Electromind ©2011 r1.4 23 Log header: casing and open hole data. fig.3.6 Log header: free text field for remarks. fig.3.7 Exit Click here to exit from the programme, remember to close any file recording or replay operation in progress and to power off any connected sonde before exiting OPTV User Guide Electromind ©2011 r1.4 24 3.2 « Setup » Menu fig.3.8 This menu allows access to the most important tools for the configuration and verification of the logging system and OPTV sonde, the three sub-menu items can also be opened directly using the buttons in the upper right section of the main programme window. Camera Control : OPTV sonde Camera Control: see section 2.2 Camera and Image settings (can also be accessed via the button ) Logger Setup : See section 2.1 logger settings (or via the button of the main programme window) Deviation Data : See section 2.3 The orientation data display (equivalent to the button ). Imperial Depht : Imperial Depht must be checked for work with Imperial Depth Unit OPTV User Guide Electromind ©2011 r1.4 25 4. Appendices : 4.1 EmOPTV.tol file [Sonde0] SerialNumber=0530 SondeLenght=163 CameraOffset=8 DeviationOffset=107 ImageOffset= 123.7 GammaOnBoard=no GammaOffset=GammaCoef=0.15 # # # # # # # # # # 4 numbers (week - year) Sonde length in cm Offset between tool bottom and camera position in cm Offset between tool bottom and APS position Offset between first camera pixel and ground position (horizontal mode) : expressed in( 0.1°) yes if scintillator inside Offset between tool bottom and scintillator position in cm Coefficient apply to raw data to convert in CPS (maximum 2 numbers after comma [Sonde1] SerialNumber=3113 SondeLenght=163 CameraOffset=8 DeviationOffset=107 ImageOffset=148.3 GammaOnBoard=no GammaOffset=145 GammaCoef=0.15 . . . [Sonde9] 4.2 Importation File *.OTV Importation file sample : [Sonde] Client=PROTO SerialNumber=0530 SerialAPS544= 11838 PMT=Xtal=SondeLenght=182 CameraOffset=8 DeviationOffset=107 ImageOffset= 123.7 GammaOnBoard=no GammaOffset=GammaCoef=0.15 OPTV User Guide # For your information # 4 numbers (week - year) # Serial number of APS – scintilator and crystal # # # # # # # # # Sonde length in cm Offset between tool bottom and camera position in cm Offset between tool bottom and APS position Offset between first camera pixel and ground position (horizontal mode) : expressed in( 0.1°) yes if scintillator inside Offset between tool bottom and scintillator position in cm Coefficient apply to raw data to convert in CPS (maximum 2 numbers after comma Electromind ©2011 r1.4 26 4.3 Troubleshooting and other options I get an error message Can’t load FTD2xx.dll . The USB driver is not correctly installed, follow the instructions given in USB documentation. The install documentation and USB driver is also available on the site www.electromind.eu, follow the download link and click Full package v1.06.06 with user guide FR & UK. How can I configure the system for another logging sonde? The software permits up to 10 different OPTV sondes, each identified by its unique serial number, to be set up for use by the system. A new sonde can be added to the system by (the recommended method) clicking the appropriate button in the sonde configuration dialogue box (see section 2.1) or, alternatively, by manually editing the EmOPTV.tol file as described below. Before adding a sonde using the manual edit method, be sure to make a backup copy of the original unmodified EmOPTV.tol file with a new name or in another location. Open the file for editing, for example in Notepad, and go to the first available empty [Sonde] section. Modify the following parameters so that they correspond with the configuration information supplied with the sonde. See Paragraph 4.1 I would like to change the image refresh rate to avoid display problems Note that changing the image refresh rate setting will affect the processor workload of your acquisition computer. Locate the file EmOPTV.cfg in the programme directory (e.g. c:\eMindlogger\OPTV logger). Open this file in a text editor such as Notepad. In the section : [eMindlogger], Modify or add the line (if not already present) :RefreshDelay=1 The acceptable values are from 1 to 5, the default being 3. Save the modified file. What does the audible alarm during logging signify ? An audible alarm will sound if the 16 line data buffer capacity is exceeded. It will halt automatically once data buffer levels goes down to an acceptable value. Should this occur, check your camera settings it may be necessary to reduce the resolution or frame-rate settings, or choose a lower image quality in order to reduce the load on the system. The alarm can be deactivated if desired as follows: Locate the file EmOPTV.cfg in the programme directory (e.g. c:\eMindlogger\OPTV logger). Open this file in a text editor such as Notepad. In the section : [eMindlogger], Modify or add the line (if not already present) : SilenceMode=yes to deactivate the audible alarm; SilenceMode=no to enable the audible alarm. OPTV User Guide Electromind ©2011 r1.4 27 Image offset adjustment Warning: this setting must be adjusted with the utmost care in order to avoid an incorrect orientation of your image data. Place the sonde horizontally (for example, on a pair of trestles) in a darkened area and position the calibration jig on the tool. Power on the sonde, click on the icon to open the “Logger Setup” dialogue box and click on the “Probe” tab. Click on the button “Edit” adjacent to the displayed Image Offset value. An adjustment scale will then appear in the dialogue box to aid with the correct setting of this parameter. The default camera settings will be applied automatically. Modify the Image Offset value until the bright spot on the main programme window image display is as close as possible to the centre of the image. Once the parameter has been set to within a few degrees of the correct value, a bright spot will appear in the adjustment scale shown in the dialogue box. A final adjustment should now be made in order to position the bright spot precisely at the centre of the scale. Once this has been achieved, click on the “Save” button to store this new value. Note that the new setting will be stored only in your EmOPTV.tol file in order to avoid any undesired change to the *.otv file supplied with your equipment. Your *.otv file should be edited manually to take into account this new setting, as well as any other changes (such as the natural gamma coefficient). NB : the image offset calibration jig is optional accessory available from Electromind. OPTV User Guide Electromind ©2011 r1.4 28