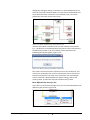
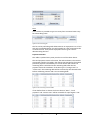
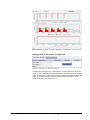
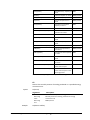
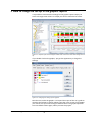
1
User's Guide energyPRO By EMD International A/S © Copyright and publisher: EMD International A/S Niels Jernes vej 10 DK-9220 Aalborg Ø DENMARK Phone: +45 9635 4444, fax: +45 9635 4446 e-mail: [email protected], web: www.emd.dk About energyPRO User's Guide This User's Guide consists of four chapters and a number of appendices. Chapter 1, “Introduction to energyPRO” is a general introduction to the energyPRO desktop. Chapter 2, “The energyPRO desktop in details” describes the facilities in energyPRO window by window, explaining the single input fields. Chapter 3, “Method of calculation in energyPRO” explains the general principles in energyPRO calculations. Includes a step-by-step example explaining how the operation strategy is calculated. Chapter 4, “Functions in energyPRO” serves as a reference section explaining the available functions in energyPRO. EMD International A/S Aalborg, July 2012. Contents 1 Introduction to energyPRO 10 1.1 Introduction ....................................................................................................................... 10 1.2 Installation ......................................................................................................................... 10 1.3 License Conditions ............................................................................................................. 11 1.4 Service and Updates .......................................................................................................... 11 1.5 License activation............................................................................................................... 12 1.6 The energyPRO desktop..................................................................................................... 19 1.6.1 Input data structure ......................................................................................... 19 1.6.2 The editing windows......................................................................................... 21 1.6.3 Reports ............................................................................................................. 25 1.7 Graphical editing ................................................................................................................ 25 1.7.1 What is included? ............................................................................................. 26 1.7.2 What about the old way of doing things? ........................................................ 26 1.7.3 A better overview ............................................................................................. 27 1.7.4 Adjusting View .................................................................................................. 27 1.7.5 How to edit ....................................................................................................... 29 1.7.6 Add Component ............................................................................................... 30 1.7.7 Connections ...................................................................................................... 32 1.8 Data-sets delivered with energyPRO ................................................................................. 35 1.8.1 Finding data the first time ................................................................................ 35 2 The energyPRO desktop in details 37 2.1 Introduction ....................................................................................................................... 37 2.2 Menu bar ........................................................................................................................... 37 2.2.1 Set-up ............................................................................................................... 37 2.2.2 Window ............................................................................................................ 40 2.2.3 Help (and license activation) ............................................................................ 40 2.3 Project Identification ......................................................................................................... 40 2.3.2 Project reports .................................................................................................. 45 2.4 External conditions ............................................................................................................ 47 2.4.1 External conditions – Input form ...................................................................... 47 2.4.2 External conditions - Time series ...................................................................... 49 2.4.3 External conditions – Online NCAR Data .......................................................... 51 2.4.4 External conditions - Time series functions ...................................................... 55 2.4.5 External conditions - Indexes ........................................................................... 57 2.5 Sites 59 2.5.1 Adding more sites ............................................................................................. 59 2.5.2 Adding transmissions........................................................................................ 60 2.6 Transmissions .................................................................................................................... 60 2.6.1 Restricting when transmissions can be used .................................................... 61 2.6.2 What about fuel and electricity transmissions? ............................................... 61 2.7 Fuels 62 2.7.1 Editing options for editing a specific fuel ......................................................... 62 2.7.2 Editing the data fields ....................................................................................... 63 2.7.3 Using fuel when defining energy Unit .............................................................. 64 2.8 Demands ............................................................................................................................ 64 2.8.1 Developing over the years ................................................................................ 65 User's Guide energyPRO Contents vii 2.8.2 Restricted period of connection ....................................................................... 65 2.8.3 Demand depends on external conditions......................................................... 66 2.8.4 As graphics – button ......................................................................................... 69 2.8.5 As time series – button ..................................................................................... 69 2.9 Energy conversion units ..................................................................................................... 69 2.9.1 Energy conversion units – in general ................................................................ 69 2.9.2 Production units described by load curves ....................................................... 71 2.9.3 Production units not described with load curves ............................................. 75 2.9.4 Heat rejection ................................................................................................... 86 2.10 Storages ........................................................................................................................... 87 2.10.1 Storages in general ......................................................................................... 87 2.10.2 Thermal store ................................................................................................. 87 2.10.3 Electrical storage ............................................................................................ 89 2.10.4 Cold Storage ................................................................................................... 93 2.11 Electricity Markets ........................................................................................................... 93 2.11.1 Market Type ................................................................................................... 93 2.11.2 Flat Rate .......................................................................................................... 95 2.11.3 Fixed Tariffs .................................................................................................... 96 2.11.4 Spot Market .................................................................................................... 97 2.11.5 Show As graphics ............................................................................................ 99 2.11.6 More than one “Electricity Market” in a model (MARKETS) ........................ 100 2.12 Operation Strategy ........................................................................................................ 100 2.12.1 Operation strategy ....................................................................................... 102 2.12.2 Heat rejection table ...................................................................................... 107 2.12.3 Miscellaneous table ...................................................................................... 107 2.12.4 The Island Operation Strategy ...................................................................... 109 2.13 Environment .................................................................................................................. 110 2.14 Economic input data ...................................................................................................... 113 2.14.1 Facilities in the economic section ................................................................. 113 2.14.2 Economy – Main folder: ............................................................................... 113 2.15 Revenues and Operational Expenditures....................................................................... 117 2.16 Investment ..................................................................................................................... 124 2.17 Financing ........................................................................................................................ 125 2.17.1 Financing – Main folder ................................................................................ 126 2.17.2 Financing – Loans, Owners capital etc. ......................................................... 126 2.18 Taxation ......................................................................................................................... 130 2.19 Reports........................................................................................................................... 132 2.19.1 Introduction .................................................................................................. 132 2.19.2 Reports to Clipboard..................................................................................... 133 2.19.3 Production, Graphical ................................................................................... 133 2.19.4 Energy conversion annual ............................................................................ 135 2.19.5 Energy Conversion, monthly ........................................................................ 136 2.19.6 Energy Conversion, summary ....................................................................... 136 2.19.7 Duration curves for Demands ....................................................................... 137 2.19.8 Environment ................................................................................................. 138 2.19.9 Economy Reports introduction ..................................................................... 138 2.19.10 Operation income ....................................................................................... 140 2.19.11 Cash flow, monthly ..................................................................................... 140 2.19.12 Cash flow, graphical .................................................................................... 141 2.19.13 Financial key figures ................................................................................... 142 2.19.14 Income statement ...................................................................................... 142 2.19.15 Income Statement, summary ..................................................................... 143 2.19.16 Balance sheet ............................................................................................. 144 2.19.17 Balance sheet, summary ............................................................................ 144 2.19.18 Catalogue of technical assumptions ........................................................... 144 2.19.19 Catalogue of economical assumptions ....................................................... 144 2.19.20 Operation Strategy Calculation .................................................................. 144 viii Contents User's Guide energyPRO 2.20 Tools............................................................................................................................... 148 2.20.1 Introduction .................................................................................................. 148 2.20.2 Generate ambient temperatures ................................................................. 148 2.20.3 Copy energy conversion to Clipboard .......................................................... 149 3 Method of calculation in energyPRO 151 3.1 Method of energy calculation in energyPRO ................................................................... 151 3.1.1 The optimisation problem .............................................................................. 151 3.1.2 Time series is a fundamental object in energyPRO ........................................ 152 3.1.3 Splitting up the planning period (fixed tariffs) ............................................... 155 3.1.4 Energy conversion units ................................................................................. 156 3.1.5 Thermal storage and cold storage .................................................................. 157 3.1.6 The Operation strategy (example with Fixed tariffs – User defined) ............. 158 3.1.7 Calculating a time period under restrictions .................................................. 159 3.1.8 Planning of new productions follows Operation strategy .............................. 161 3.1.9 An example of planning optimal productions in energyPRO .......................... 162 3.2 Method of economy calculation in energyPRO ............................................................... 171 3.2.1 energyPRO calculates nominal payments ...................................................... 171 3.2.2 Net present value calculation ......................................................................... 172 3.2.3 Internal rate of return .................................................................................... 172 3.2.4 Payback time .................................................................................................. 173 3.3 Method of solar calculation in energyPRO ...................................................................... 175 3.3.1 Definitions ...................................................................................................... 175 3.3.2 External conditions ......................................................................................... 177 3.3.3 Radiation on solar collector or photovoltaic .................................................. 177 3.3.4 Array shading .................................................................................................. 179 3.3.5 Solar Collector ................................................................................................ 183 3.3.6 Photovoltaic .................................................................................................... 185 3.4 Method of wind farm calculation in energyPRO.............................................................. 187 3.4.1 Definitions ...................................................................................................... 187 3.4.2 Mathematical description .............................................................................. 187 4 Functions in energyPRO 189 4.1 Introduction ..................................................................................................................... 189 4.2 Functions used in all (or more) formula fields ................................................................ 190 4.3 Functions used only in Production units load curves ...................................................... 191 4.4 Functions used only in Revenues and Operational Expenditures .................................... 197 4.4.1 Functions measuring on the system border ................................................... 198 4.4.2 Functions measuring on energy conversion unit level. .................................. 204 4.4.3 Other Functions .............................................................................................. 216 4.5 Functions used only in Taxation ...................................................................................... 219 4.6 Functions used only in Annual Key Figures ...................................................................... 221 Appendices 227 A Import data from a spread sheet to a time series .............................................................. 227 B How to save as a .pdf file .................................................................................................... 230 C How to change the set-up in the graphic reports ............................................................... 231 D Interpretation of economy functions in calculation the operation strategy ...................... 232 E Interpretation of economy functions in calculation the operation strategy – Net Cooling production ................................................................................................................ 235 User's Guide energyPRO Contents ix 1 Introduction to energyPRO 1.1 Introduction energyPRO is a complete modelling software package for combined techno-economic analysis and optimisation of both cogeneration and trigeneration projects as well as other types of complex energy projects with a combined supply of electricity and thermal energy (steam, hot water or cooling) from multiple different energy producing units. energyPRO is typically used for techno-economic analysis of energy projects such as district heating cogeneration plants with gas engines combined with boilers and thermal storage, industrial cogeneration plants supplying both electricity, steam and hot water to a site, cogeneration plants with absorption chilling (trigeneration), biogas fuelled CHP plants with a biogas store, biomass cogeneration plants. Other types of projects, e.g. geothermal, solar collectors, photovoltaic or wind farms can also be analysed and detailed within the software. energyPRO can also be used for analysing hydro pumping stations, compressed air energy storage and other electricity storage projects. energyPRO allows the daily optimization of the operation to be made against fixed tariffs for electricity or against spot market prices. The optimization is taking into account the limited sizes of thermal and fuel stores. energyPRO provides the user with a detailed financial plan in a standard format accepted by international banks and funding institutions. This includes presentation of the operating results for the project, monthly cash flows, income statements (P&L), balance sheets and key investment figures such as NPV, IRR and payback time. The software enables the user to calculate and produce a report for the emissions (CO2, NOX, SO2, etc.) by the proposed project. 1.2 Installation Insert the energyPRO CD (or demo USB stick) or run the downloaded .exe-file and the installation process will install the energyPRO software in C:\Program files\emd\energyPRO4\ by default. 10 Introduction to energyPRO www.emd.dk User's Guide energyPRO Follow all instructions on the screen. The default data path will be C:\energyPRO Data\ - it is important to change this at installation if you prefer to have the data located somewhere else! The energyPRO CD (or demo USB stick) or run the downloaded .exe-file contains the entire energPRO package. In demo mode you cannot calculate or print or save a project. However, upon purchase of energyPRO modules, EMD International A/S will provide you with a registration key opening the licensed modules. 1.3 License Conditions The independent association Energi- og Miljødata holds all Intellectual Property Rights to the energyPRO software, which is continuously developed by EMD International A/S and distributed worldwide through a network of appointed agents. The manual and other documentation from the energyPRO software are copyrighted and all rights reserved. Conditions of use: The licensee, who has paid for or by other means legally obtained the right to use the program, is entitled to activate and use a license. Copyright: The licensee may under no circumstances copy, pass-on, sell or in any other way distribute the program or documentation associated with the program to third parties. License: The licensee is only allowed to use a single license on one computer at the time, if the licensee has activated a license on two different computers belonging to the same user. Additional Licenses: The name and address of the licensee, which is printed on all reports from the software, will be the same on each additional license supplied as on the first license supplied. Duration-Termination: All user rights to the program are withdrawn in case the licensee does not respect the terms of payment in force at EMD International A/S. Limitation of Liability: The software is provided on an "as is" basis without warranty of any kind. EMD International A/S does not warrant, guarantee or make any representations regarding the functionality of the software, any results obtained by the use of the software and any software support provided by EMD International A/S and their agencies/partners in terms of correctness, accuracy, reliability, usefulness, or otherwise. The licensee is solely responsible for the selection of the software, for the installation of, use of, and results obtained from the software and software support received. Also excluded is any implied warranty by EMD International A/S, such as merchantability, non-infringement and fitness for a particular purpose. 1.4 Service and Updates A valid service agreement with EMD means that the user gets access to the following services: User's Guide energyPRO Introduction to energyPRO 11 Free e-mail or telephone hotline service covering advice and guidance regarding the use of the software. The latest version of the software. Download access to online data from the EMD-server. The user pays an annual service fee of 20% of the actual list price for modules covered by his License Agreement. Software updates are not issued at regular intervals, but typically twice a year. It is possible to download improvements and updates from our website www.emd.dk. From energyPRO version 4.0.3 it is possible to let energyPRO automatically check for updates on program start-up. The first time energyPRO is started, the user will be asked whether or not energyPRO automatically should check for newer versions online. This can later be changed in the Help menu by clicking “Automatically check for updates”. For users without a service agreement, or who have cancelled a previous agreement, any future software update charge will be calculated based from the date service expired on the license. 1.5 License activation To work with energyPRO you need to activate your license. When buying energyPRO you will receive a license file needed for the activation. The activation process in energyPRO is as follows. Start energyPRO and choose the “License activation” in the Help menu. Figure 1.1: Accessing license activation item The below window will appear and guide you through the registration. 12 Introduction to energyPRO www.emd.dk User's Guide energyPRO Figure 1.2: The 4 steps of registration and activation You simply just need to follow the 4 steps. “Import licence file” invokes an open file dialog, where you are asked to select the license file. The name of the file is: energyPROx.x.erf (where x.x is the version number). If you have saved the file elsewhere, just browse to find and open it. Click the “Open” button to import. Figure 1.3: Open the energyPRO registration file Next, the End user license agreement must be accepted: User's Guide energyPRO Introduction to energyPRO 13 Figure 1.4: Accept End user license agreement Each user is identified by email address and each user is allowed two installations, for example an office and a home computer or similar. In order to register the user must go through the activation procedure. Figure 1.5: Software Activation Press Next to continue the registration process. 14 Introduction to energyPRO www.emd.dk User's Guide energyPRO Figure 1.6: Activation information On this screen the data to be sent to the activation server is displayed. The faded texts are read by the software (computer ID, user name etc.). If you are the end-user you fill in your name and email address. A license holder is allowed as many email addresses as you have licenses and each email address can be used twice. If you are the administrator you can additionally add your own email address. That will make the activation code come to you instead of the end-user, but the administrator address does not count to the allowed number of licenses. The “Skip online activation…” option is available for users, who do not want to send information via the internet, using FTP. Check this to activate by e-mail or phone. User's Guide energyPRO Introduction to energyPRO 15 Figure 1.7: Activation information with end-user information It is possible to buy a different number of licenses for each module. If all modules bought by the user should be activated select “Activate all modules”. If instead only a selection of modules should be activated then select “Activate individual modules”. Figure 1.8: Select module selection method If “Activate individual modules” was selected then you must point out the ones to activate. The list will show you all your available modules. If the module you wish to register is not in the list, then you do not have a valid license for it and you may contact EMD. By showing the activation 16 Introduction to energyPRO www.emd.dk User's Guide energyPRO statistics you can see who are currently using the licenses in the company. Figure 1.9: Select modules Next step is to enter the activation code. At this stage you will have received an activation code in your email inbox. The code will be sent to the email address you typed in previously. Figure 1.10: Enter activation code Your license has now been successfully activated. User's Guide energyPRO Introduction to energyPRO 17 Figure 1.11: Activation succeeded The activation process is concluded by showing you the “About” window for energyPRO on this computer. Here you can see the license information for your organization. This is the information included on all printouts made with energyPRO. You can also see your current version of energyPRO. If you suspect your version not to be current, and you do not let energyPRO automatically check for updates, you can visit the energyPRO update page and check if newer versions are available. Figure 1.12: About box with registration information Press Restart. When having restarted the program, the registration and activation will be accepted. 18 Introduction to energyPRO www.emd.dk User's Guide energyPRO 1.6 The energyPRO desktop The energyPRO desktop is divided into three main sections as shown in Figure 1.13. These are: The Input data structure The Editing window The Report structure Input data structure Editing windows Reports Figure 1.13: The three main sections of the energyPRO desktop 1.6.1 Input data structure The Input data structure has functionalities much like the classic Windows explorer, and serves as the energyPRO desktop navigator. The Input data structure is arranged in a folder structure as known from the classic Windows explorer. The functionality attached to the folders is aimed to be as similar as practically possible to the Windows explorer. Furthermore, the input data structure serves as the energyPRO desktop navigator. By right clicking the mouse on any folder in the input data structure, the available folder specific options are shown. In Figure 1.14 is shown the main input data folder structure for “Input data”. The folders shown in this figure are the standard root folders found in all energyPRO projects, and are always present when energyPRO is started. This is the starting point for all energyPRO projects User's Guide energyPRO Introduction to energyPRO 19 Figure 1.14: Input-data. The main input data folder-structure Each folder (and subfolder) in this structure corresponds with an editing window. Folder icons Folder icons are used for indicating the integrity of the data in the project Folder icons are used for indicating the integrity of the data in the project. Folders with yellow background indicate technical data/reports and blue background indicates economy data or reports. Input data is OK Error in input data Selected folder Unmarked folder (data only checked before calculation) Start your energyPRO experience by studying the standard examples delivered with energyPRO New energyPRO users are recommended to start their energyPRO experience by loading some of the project examples delivered with energyPRO. These project files are loaded by choosing the “Open” option in the “File” menu. Selecting one of the files found in the “Project examples” folder. Often the easiest way to create a new energyPRO project is to modify an existing project with similar traits. When constructing a project some of the root folders are supplemented with subfolders, containing specific information defining for instance time series containing ambient temperatures, demands, fuels or production units. It is possible to add subfolders to the root folders: External Conditions, Fuels, Demands and Energy Units. Hereto comes in “Economy” the option to add to subfolders to the second levels folders in “Economy”. How to add, load, save, and rename subfolders. Right click the mouse on the folders and discover the options By right clicking the mouse, while placed on a folder, a small frame will become visible. In this frame, the options attached to this specific folder are shown. The content of the frame is context-sensitive. An example of such a frame is shown in the following Figure 1.15, where the mouse is right clicked on “Energy conversion units”. In this case the options are to add a production unit, a heat rejection unit or to load one of these from 20 Introduction to energyPRO www.emd.dk User's Guide energyPRO a library if data is available. Figure 1.15: Right-clicking the mouse on a folder to reveal the folder options. The typical options supplementing the “add” and “load” options are options to “save”, “copy” and “rename” the folder. energyPRO projects are constructed by entering all input data folders and then filling in the needed information in the corresponding editing windows and adding new folders. 1.6.2 The editing windows The editing windows are highly context sensitive depending on the type of input data. The descriptions of the specific editing windows are found in chapter 2. In this brief introduction, only few remarks are added. Project Identification This is the place to make a description of the project in text and to define which type of projecting there are in question: DESIGN, FINANCE, ACCOUNT or OPERATION. The choice of the option selected will especially change the content of the Economy and Report folders. User's Guide energyPRO The DESIGN module is selected for one-year calculations, with the emphasis on energy conversion and operation payments. The FINANCE module is selected for investment analysis. This add Investments and Financing to the DESIGN and includes calculations running over more than one year The ACCOUNT module adds the calculation of income statements and balance sheets to the FINANCE module. Add depreciation and taxation to the calculation input. The OPERATION module is selected for optimizing the operation in a short period. The content is almost like in the DESIGN module, but with a few more settings. Introduction to energyPRO 21 The REGION module is a supplementary module enabling the possibility of having geographically distributed productions on more sites in the same model. The REGION module might be used for regional energy planning models, and can be used in combination with any of the four types of projecting. External conditions The root folder contains the information about the planning period. It is possible to add folders containing the following types of sub data to the external conditions root folder: Time series Time series functions Indexes Typical uses for Time series and time series functions are description of electricity market prices, fluctuations of demands and the load curves of the energy units. Indexes are used for describing the development of energy demands over years. Sites This folder contains all the sites in the project. A site is defined as a location that contains demands, energy units and storages and can exchange energy with other sites via transmissions. The root folder shows a graphical overview of the different sites and transmissions between them. The sub folders show the graphical overview of a single site. All energyPRO projects will contain at least one site and users that have the REGION module are able to add more sites and thereby model regional projects. Transmissions The Transmissions folder contains all the transmissions between the sites. A transmission in energyPRO is used to connect 2 sites so that they can exchange energy. A transmission has the following attributes: Start and end site Transmission in both directions or not Energy type, which in the current version can be Heat, Process Heat and Cooling Capacity and loss Fuels Add subfolders to the fuels root to describe the fuels used in your project. Example could be “Natural gas”, “Biogas”, “Coal” etc. It is optional to define a fuel store and describe that only a restricted amount of a fuel is available. 22 Introduction to energyPRO www.emd.dk User's Guide energyPRO Demands It is possible to define four types of demands. Heat demands Process heat demands Electricity demands Cooling demands A demand is specified either by an annual amount of energy and a distribution or by a time series. If for instance a demand is degree-day dependent, a time series folder with ambient temperatures must be placed in “External conditions” and selected when describing yearly variations the demand. There are several options to modify the distribution of a demand during a day, week, month or years. Energy conversion units There are two types of energy conversion units in energyPRO. These are: Production units Heat rejection The productions units consists of nine predefined types of units of which one is a user defined type described by load curve(s) and three renewable technologies described with individual editing windows. The Load curve described units are: Boiler CHP-unit (Combined Heat and Power) Electrical heat pump User defined unit Absorption cooler Electrical cooler If the production unit type is consuming (or producing) fuel, a fuel defined in a “fuel” sub-folder has to be selected. The ability to convert energy is described with one or more load curves. Each load curve contains two or more loads, depending on the type of unit. The user-defined unit include all load types except “Heat consumption”. The possible loads are: User's Guide energyPRO Fuel consumption Heat production Process heat production Heat consumption Electric production Electric consumption Introduction to energyPRO 23 Heat consumption (only available in absorption cooling) Cooling production Fuel production For advanced users there is a wide scope of options to describe the behaviour of energy units dependent on formulas, the actual production on other production units and time series specified in the “External condition”- folders. The special treated renewable technologies without load curve description are: Wind farm Solar collector Photo voltaic Storages In this folder the different energy storage facilities are modelled. Three types of energy storages are available in energyPRO. These are: Thermal storage Electricity storage Cold storage Note that fuel storages are modelled under each fuel. Electricity market In the Electricity market folder it is possible to define an electricity market. The options for electricity markets are: Flat tariff Fixed tariff Spot market If the MARKETS module is not activated, it is only possible to add one electricity market. With the MARKETS module you can add any number of electricity markets to your model. Operation strategy The Operation strategy can be user defined or it can be auto calculated based on the payments set-up in the economy. The Operation strategy is basically a decision table used to describe the priority between energy production units in different tariff periods. Environment Emission types, such as CO2, NOx and SO2, can be added in this folder if needed. 24 Introduction to energyPRO www.emd.dk User's Guide energyPRO Economy There are several types of input data for the economy calculations. The economic data (and the calculations based on these) are the main difference between the four types of projecting. The groups of economic data are: Revenues Operation expenditures Investment (FINANCE and ACCOUNT modules) Financing (FINANCE and ACCOUNT modules) Taxation (ACCOUNT module) Investment key figures (FINANCE and ACCOUNT modules) Annual key figures (ACCOUNT modules) 1.6.3 Reports The range of reports dependents on the selected type of projecting in “Project identification”. In the figure below is shown the reports available when the DESIGN-module is chosen. Clicking the folder invokes the desired report. Figure 1.16: Available report if DESIGN is chosen Note that the “Operation Strategy Calculation” report is only available if the auto calculated operation strategy is chosen in the “Operation strategy” input window. 1.7 Graphical editing With energyPRO 4.0 graphical editing were introduced. This provides the user with a better overview of a project and makes it easier to do the editing. User's Guide energyPRO Introduction to energyPRO 25 Figure 1.17: energyPRO in Graphical User Mode 1.7.1 What is included? There are 2 different types of graphical overview, namely: The site overview which shows all the sites in the project and the transmissions between them. This view is only relevant in projects with more sites The graphical overview of a single site, which contains the following components: Fuels Demands Energy Units Electricity market Transmission to other sites This is, so to speak, the physical part of an energyPRO project. External conditions, Operation strategy, Environment and Economy are not included in this version of graphical editing. 1.7.2 What about the old way of doing things? You can at any point change the settings to the classic user mode. In Setup – Options, you can switch between Graphical User Mode and Classic User Mode (see Figure 1.18). The setting is saved by energyPRO and is not depending on the given energyPRO project file. 26 Introduction to energyPRO www.emd.dk User's Guide energyPRO Figure 1.18: Switching between Graphical and Classic user mode 1.7.3 A better overview The graphical user mode shows all the main figures at a glance. As shown in the screenshot below, you can see the heat value of the fuels, the full load capacities of the production units, the storage capacity, the annual demands and the electricity market type. At the same time you can see what fuel the production units use and if they have access to an energy storage facility or not. Figure 1.19: Graphical User Mode gives a better overview. 1.7.4 Adjusting View Depending on the size of your screen it can be desirable to adjust the view of the graphic. Zoom In the toolbar above the graphic user interface it is possible to set the zoom-factor: User's Guide energyPRO Introduction to energyPRO 27 Figure 1.20: Setting zoom-factor The up and down arrows increases and decreases the zoom-factor by 10%. A more detailed factor can be put in directly. The magnifying glass icon adjusts the zoom-factor to fit the graphic window. Arrange When loading a projectfile saved in energyPRO 3, energyPRO 4 will automatically arrange the components and connections. You are free to rearrange the components and connections. Figure 1.21 is rearranged by the user, with the same components as Figure 1.19. Figure 1.21: Rearranged graphic view To rearrange, simply mark a component and move it as you like. If you mark a connection you will be able to drag any of the pointers to rearrange the connection, Figure 1.22. Figure 1.22: Marked connection With the head or tail pointer the point of connection at the component can be changed, Figure 1.23. 28 Introduction to energyPRO www.emd.dk User's Guide energyPRO Figure 1.23: Moving connection point If you regret the rearrangement, pressing the auto-arrange-button arranges the components and connections according to energyPRO default settings, Figure 1.24. Figure 1.24: Auto-arrange-button 1.7.5 How to edit Change values If you need to change a value of a component, e.g. a production unit, you simply double-click the component or right click and select Open: Figure 1.25: Edit-window, production unit This window is very similar to the classic view. Additional, you have the option of changing name of the component. It is possible to cancel any changes by pressing Cancel, in other words your changes are not saved until you press OK. User's Guide energyPRO Introduction to energyPRO 29 1.7.6 Add Component In the graphic user mode, you have two ways of adding a fuel, demand or energy unit. One, click the blue plus-sign in the toolbar or two, rightclick on the background. In both cases you have the menu shown in Figure 1.26. Figure 1.26: Adding a component Visual Properties The visual properties of a component are accessed by right-clicking and select Visual Properties, Figure 1.27. Figure 1.27: Access to Visual Properties By selecting the Visual Properties the following screen appears, Figure 1.28. 30 Introduction to energyPRO www.emd.dk User's Guide energyPRO Figure 1.28: Visual Properties The Color is used when representing the production unit in the Production, graphic report. As shape you can choose between a rectangle, ellipse, diamond or picture. If choosing picture, you have access to select a picture. Defaults return the component to the energyPRO default setting. In Select Picture (Figure 1.29) you can choose between a number of build-in pictures or you can add your own pictures. Figure 1.29: Select Picture User's Guide energyPRO Introduction to energyPRO 31 1.7.7 Connections Let’s say you want to change the fuel of a production unit. You can in the edit-window Figure 1.25 change the fuel in the drop-down menu or you can move the connection, Figure 1.30. Figure 1.30: Change fuel by moving connection Click on the connection between the fuel and the production unit, press on the node at the tail of the connection and move it to the wanted fuel. Finally, release the mouse button. The color of the connection is changed to the color of the wanted fuel, Figure 1.31. Figure 1.31: Gas engine 2 has changed fuel Another example, if you want to change the setting of a production unit’s access to the thermal store. In the classic user mode you set the access in the operation strategy. In the graphical user mode you can also 32 Introduction to energyPRO www.emd.dk User's Guide energyPRO change the setting by moving a connection. In the example below you click the connection between Boilers and any of the heat demands and move the head of the connection to the thermal store, now all the production units have access to the store: Figure 1.32: Boilers now have access to the thermal store In some case it does not make sense to move or delete a connection. E.g., a production unit producing electricity has to have a connection to the electricity market. If you try to delete such a connection the following warning will appear, Figure 1.33: Figure 1.33: Warning, when trying to delete a connection The colours of the connections cannot be set on the connections. The colour on a connection from a fuel to a production unit is the same as the colour of the fuel. The colour on a connection from a production unit to a demand is determined by the type of energy. Heat is red, cooling is blue, process heat is brown and electricity is black. Three different lay-outs of a line If you select a connection and right-click, you can choose between three different types of lines, Figure 1.34. Figure 1.34: Different types of line User's Guide energyPRO Introduction to energyPRO 33 Figure 1.35 is an example of the three different types of lines. Figure 1.35: Example of different line types The straight line can be modified by adding connector edge, Figure 1.36. Figure 1.36: Add Connector Edge Then, the connection can have whatever design you like, Figure 1.37. Figure 1.37: User designed connection line 34 Introduction to energyPRO www.emd.dk User's Guide energyPRO 1.8 Data-sets delivered with energyPRO As a part of the energyPRO installation, a few country specific datasets are installed for each language. They are installed in the data structure shown in Figure 1.38. At present energyPRO is available in Danish, English, German, Lithuanian and Polish. Each of these countries has their own folder. The examples are country specific. Danish, English and German have five standard folders, which in English are: Energy units Fuels Other data Project examples Weather Figure 1.38: The default data structure of data delivered with energyPRO Seeking data. Check eventually folders for other countries If you do not find, what you are looking for in your country specific standard folders you might find what you want in the corresponding folder for another country. At present, the following folders might be of your interest. Weather data for several European countries are found in the English weather folder A library of production units are found in the German energy units folder In the folder c:\energyPRO data\English\Weather, you will find weather data for several European countries. The data are mainly based on Test Reference Years. In the German folder for energy units, c:\energyPRO data\Deutsch\ Energieanlagen, you will find a library of energy production units. In the German folder for fuels, c:\energyPRO data\Deutsch\ Brennstoffe, you will find a library of fuels. A Fuel library is found in the German energy units folder 1.8.1 Finding data the first time Your language in which you operate energyPRO decide the default standard folders User's Guide energyPRO The first time you load data energyPRO will automatically suggest that the data are found in the standard folders. If your computer is operated in an English language set-up, it uses the English standard folders and if in German language, the German standard folders etc. Introduction to energyPRO 35 This means that in an English language set-up it will look for projects in the “Projects examples”-folder and for fuels in the “Fuel”-folder and so on. energyPRO remembers where data was loaded/saved last After the first load or save operation energyPRO will remember in which folder data was loaded or saved, this will be the new default setting. 36 Introduction to energyPRO www.emd.dk User's Guide energyPRO 2 The energyPRO desktop in details 2.1 Introduction In this chapter is a description of the Editing Windows used in energyPRO. After starting with information concerning some of the menu bar options, the description follows the order of the folders in the Input Data Structure. Figure 2.1: The Input-Data Structure It is possible to use formulas in several of the Editing Windows. In this chapter you will only find a brief description of the functions to be used in these. A detailed description of these is found in the chapter, “Functions in energyPRO”, which serves as a reference section for formulas used in energyPRO. 2.2 Menu bar 2.2.1 Set-up Demo mode If you switch the program into DEMO-mode, you get the opportunity to evaluate the facilities in the modules, which you have not registered. User's Guide energyPRO The energyPRO desktop in details 37 In DEMO-mode, you can change the input data, but you cannot save changes and the reports have the text “DEMO-version” written across the pages. WARNING: If you have made changes to the project you are working with, remember to SAVE it before you switch into DEMO-mode. When first in DEMO-mode, you cannot save the project and you will lose all your changes! Read only mode If you switch the program into READ-ONLY-mode, you get the opportunity to print out results from energyPRO-project files you might have received from for instance a project partner without any restrictions. In READ-ONLY-mode, it is not possible to change the project data, but there is access to calculate, view and print the reports available in the specific project. Languages Select one of the languages specified. If you select a language that you have not licensed and registered, the program automatically turns into demo-mode. energyPRO is currently maintained in the following languages. English, German and Danish. Occasional updates in Polish and Lithuanian. The first time energyPRO is started, it will be operated in the same language as used by Windows (If the language is available for energyPRO - otherwise in English). If you want to change the language, choose Language in the main menu, select the wanted language and restart the program. If you do not have license to the selected language, energyPRO will start in DEMO-mode. energyPRO is currently maintained in the following languages; English, German, Danish with Occasional updates in Polish and Lithuanian. Figure 2.2: How to change language Options User Interface The User Interface consists of three boxes. 38 The energyPRO desktop in details www.emd.dk User's Guide energyPRO Figure 2.3: User Interface It is in the User Mode menu possible to change between Classical and Graphical User Mode. In Reports you can enable Lock report preview window. By enabling this you can only see one report preview at the time. In Look and feel it is possible to change between a number of skins, changing the appearance of energyPRO. Liquid is standard. Figure 2.4 :Look and feel Report Logo In this menu it is possible to setup a company logo to be used in all the energyPRO reports. The logo will appear in the top right corner of each report as shown in Figure 2.5. Figure 2.5: Example of company logo in energyPRO reports User's Guide energyPRO The energyPRO desktop in details 39 Online Data Here it is possible to change the URL for EMD International’s NCAR if needed. 2.2.2 Window Here are shortcuts to all open reports. Figure 2.6: User Interface 2.2.3 Help (and license activation) Help The context sensitive online-help is activated by either choosing “Help|Help” or simply by pressing the F1-button. Tutorials (Online) Clicking this will open www.emd.dk/energyPRO/Tutorials/ in your standard browser, where you can find tutorials on how to use energyPRO. Check for updates There are two ways to let energyPRO check for updates. One is by clicking “Check for updates now” and another is by activating “Automatically check for updates”, which lets energyPRO automatically check for updates at each energyPRO start-up. About In the about box you will find version number of your actual version of energyPRO and your registration data, where you can see which modules you have licensed. How to activate energyPRO license To work with energyPRO you need to activate you license. When buying energyPRO you will receive a license file needed for the activation. The activation process in energyPRO is as described in the previous section 1.5 License activation 2.3 Project Identification In “Project Identification”, there are two text fields, where comments concerning the actual project are added. The fields have different scopes. 40 The energyPRO desktop in details www.emd.dk User's Guide energyPRO Furthermore, “Project Identification” is the place to select, which module to use for the creation and calculation of the actual energy project. Figure 2.7: Project identification and selection of projecting module Project identification (4 lines maximum) The project identification lines are printed in the top of every energyPRO report helping to identify the actual project. Assumptions to be printed in Catalogue of assumptions The text written in this part is only printed in the report “Catalogue of technical assumptions”. The text can be used for explaining some core assumptions identifying the actual project. This might for instance make it easier to remember how this calculation differs from other calculations. User's Guide energyPRO The energyPRO desktop in details 41 Select Calculation module Projecting The DESIGN module is selected for one-year calculations, with the emphasis on energy conversion and operation costs. The FINANCE module is selected for investment analysis. This add Investments and Financing to the DESIGN and includes calculations running over more than one year The ACCOUNT module adds the calculation of income statements and balance sheets to the FINANCE module. Adds depreciation and taxation to the calculation input. Optimizing daily operation WARNING: you might lose information when you change from ACCOUNTS to FINANCE or DESIGN or change from FINANCE to DESIGN The OPERATION module is selected for optimizing the operation in a short period. The content is close to the DESIGN module, but with a few more settings. The selection of calculation module determines which facilities will be accessible within the project. You can always change your selection of the project module. WARNING: If you change from ACCOUNT to FINANCE or DESIGN the specific ACCOUNTS data will be lost. If you change from FINANCE to DESIGN the specific FINANCE data will be lost. Advanced There are three groups of advanced settings. The first one is concerning production options, the second group is concerning warning issued when demands are not met and the last group relates to configuration of the optimization. Figure 2.8: Project identification –advanced 42 The energyPRO desktop in details www.emd.dk User's Guide energyPRO Production options Checking the advanced setting is only recommended in very specific situations. The available production options are: Delivery of both heat and process heat Starting up production units are slow and expensive Fuel producing energy units in project The first option is typical used in a situation with both high temperature process heat demands and low temperature domestic heating demands. If this option is selected you will have the option to add both the usual heat demands and process heat demands to your project, and to model production units having both heat and process heat productions. The second option is used in situations, where there the starting up time on a production unit is long and expensive. This could be the case in projects dealing with biomass and waste. If this option is selected there will be access to fill in the duration of starting up and closing down period when defining your production units, see Figure 2.9. Figure 2.9: Production unit with two advanced options enabled. Starting up and shutting down periods shown and process heat available. The third option enables fuel producing units, which are able to produce output fuel other units need as input. When this option is enabled a new data field appears in the energy conversion unit, Fuel output: User's Guide energyPRO The energyPRO desktop in details 43 Figure 2.10: User defined production unit with “Fuel producing energy units in project” enabled You have to change the Production unit type to User defined. Then, Fuel output is added in the Power curves. Warnings when demands are not met By default, warnings are issued when Heat, Process heat or cooling demands are not met, but not for electric demands. If you for some reason might want to change this default setting, you can do this here. Figure 2.11: Example of warning issued when a the heat demand is not met Calculation setup In the advanced options you also have the possibility to configure the optimization engine to some extent. These settings will primarily influence preciseness of the optimization and the time it takes to run an optimization. The settings are: 44 The energyPRO desktop in details Length of calculation step: The optimization engine divides the optimization period into steps and this setting defines the size of these steps. The shorter the calculation step, the more precise the optimization ought to be because changes can occur more often. However, shortening the calculation step will increase the calculation time. By default this setting is set to 1 hour since many time series will be in this resolution. By activating “Warning when time series changes asynchronous with calculation step” a warning will be www.emd.dk User's Guide energyPRO shown if any time series are more detailed than the calculation step. Length of optimization period: When energyPRO calculates energy conversion for a project it will by default do this by splitting the whole optimization period into individual months and then calculate them one by one. This is primarily done to speed up the calculation. If you want a more precise optimization you can try to change this option to Year so that an entire year is calculated in one optimization. Be aware this can be time consuming and will not always result in significant differences. Check input data In the standard operation mode, energyPRO automatically checks the integrity of the data structure while editing. There are some cases often with comprehensive time series, where this checking is too time consuming to work with. In this case, you have the option to check the “Before calculation only”-option. This will remove the automatic integrity checking while editing and only perform it when making calculations. 2.3.2 Project reports Under Project identification you will also find a sub-folder called Project reports. A project report is a collection of other reports. The idea is that the user can select a number of reports to be printed in a single report which makes it easier for the user to produce a full report for the project. The project reports are stored in the project and can be saved to a file and then imported in other projects. To add a new project report you simply right-click on the Project reports sub-folder and Select “Add new project report”. You can give the project report a name to easily identify it later on. Once you have added the project report you can edit it to select the individual reports you want to be included. User's Guide energyPRO The energyPRO desktop in details 45 Figure 2.12: Edit window for project reports. In Figure 2.12 you see the project report edit window which lets the user add individual reports to the project report. On the left hand side all the available reports are shown and on the right hand side the actual reports in the project report are shown. To add reports to the project report you simply Double-click the item on the left hand side. Once the report is added you can configure how the report should look in the final project report. The example shown in Figure 2.12 shows a project report containing 4 individual reports: Production, graphic o Energy conversion, annual o This type of report needs no further configuration Energy conversion, monthly o This type of report requires that the user selects the period to show in the report, which in this case is 7 days starting at 27-01-2011 This type of report needs no further configuration Income statement o As this is an economy report it requires the user to select the payment lines to show and it will be generated using the select currency in “All amount in” Once a project report is added it will be available as an item under Project reports in the Report window (on the bottom left side of energyPRO). When the project report is printed the reports in it will simply be generated in the order they appear in the edit window. 46 The energyPRO desktop in details www.emd.dk User's Guide energyPRO 2.4 External conditions The “External conditions” folder serves as parent folder for indexes and time series and time series functions. Hereto comes that the connected editing window is the place to define the “planning period” and eventually to specify use of holidays in the calculation. Figure 2.13: External conditions – sub folders 2.4.1 External conditions – Input form Figure 2.14: External conditions editing window User's Guide energyPRO The energyPRO desktop in details 47 Planning period and Years to be Planned Here you state the start of the period, which are calculated. Note the possibility to state a displaced financial year. If DESIGN is chosen, the planning period is always 1 year. The only information to set is the starting month and year. The end of planning period and “Years to be planned” are dimmed and not accessible. If FINANCE or ACCOUNTS is chosen the “Years to be planned”-parameter determines how many years there will be incorporated in the calculation. Holidays Specifying holidays is only relevant if holiday dependent fixed tariffs is modelled in “Electricity markets" Specifying holidays is only relevant if holiday dependent fixed tariffs are modelled in “Electricity markets”. Often the electricity tariffs are e.g. lower in holidays. Therefore, it is often relevant to know the dates of these holidays. The present version of energyPRO has the holidays for Denmark, Germany and Great Britain encoded. For Germany and Great Britain the regional differences in holidays are also accounted for, as one will have to choose which region’s holidays are needed for the model. If you are making projects in other countries, and the conditions for e.g. tariffs of electricity differ between holidays and working days, it is possible to type in country specific dates. When entering the holiday combo box, five options become available. No Holidays Danish holidays German holidays British holidays Specify holidays manually Figure 2.15: Specifying holidays manually If “Specify holidays manually” is chosen you have to fill in each holiday by a name and a date (format: dd-mm) It is possible to save and load Holidays. Use the right mouse button while standing in the window for holidays to get access to this facility. 48 The energyPRO desktop in details www.emd.dk User's Guide energyPRO Add external conditions for library From here, you can load an existing time series from the hard disk into your project. 2.4.2 External conditions - Time series Time series are the fundamental data format in energyPRO Time series are the fundamental data format in energyPRO. Time series relates very closely to spread sheet formats. You can copy a time series to spread sheet and you can copy a time series from a spread sheet. A time series consists of set of values each connected to a specified date and time. The External conditions time series can be accessed from several of the other editing windows in which the project is specified. Examples of time series are daily temperatures, hourly solar radiation or electricity spot market prices. A typical time series example is a series to distribute a heat demand by using a time series holding the ambient temperature. Other examples of using time series are the calculation of the production of a solar plant by using a time series holding the solar radiation, and a time series holding electricity spot prices used for specifying “Electricity market” prices. Figure 2.16: Time series – Example: Temperatures in “Central England” Symbol The symbol is used for referencing the time series User's Guide energyPRO The symbol is a unique short name for the time series. The symbol is used for referencing the time series elsewhere in the energyPRO. All time series, time series functions and indexes, used in a project, must each have a unique symbol. The energyPRO desktop in details 49 Note: The symbol is repeated in the header of the editing window. Unit The unit in which, the values in the time series, is stated. The unit is for presentation use only and is not evaluated during calculations. Time series Time series consist of rows all specified with the two fields; date/time and value, see Figure 2.16. Arbitrary length of periods between every element in the time series is allowed. The function of the buttons: Copy all: Copy all values from the actual time series to the clipboard. From the clipboard, the values can e.g. be pasted into a spread sheet like Excel. Copy selected: Copies selected row(s) from actual time series into clipboard. Selection is to done by use of the keyboards arrow-tabs or by mouse. Paste: Pastes the content from clipboard to the time series table. Make sure you are pasting using the correct format; date/time and value. For more on importing data from a spread sheet to a time series in energyPRO, see appendices A. Delete all: Deletes all values in the time series. Delete selected: Deletes selected row(s) from the time series. Selection is done by using either the keyboards arrow-tabs or the mouse. As Graphics: The upper “as graphics” –button gives a graphic representation of the time series table. Add line: Add a new line below the active line Delete line: Deletes the active line Figure 2.17 shows an example, where the time series containing daily temperatures in “Central England” is represented graphical. 50 The energyPRO desktop in details www.emd.dk User's Guide energyPRO Figure 2.17: Time series – Graphic: Temperatures in “Central England”. Developing over the years It is possible to add an index to describe the development of a specified time series. To do this check the “Developing over the years” – option and select a previously created index. For the creation of indexes, see section 2.4.5. energyPRO develops a time series over time by moving the values on a weekly basis, so that values in week 2 are moved to week 2 in the following years. After moving the values energyPRO changes the values on a monthly basis according to the index. When the editing windows lower “as graphics”-button is pressed the time series is transformed for the whole planning period. If an index is selected, the index is taken into account. Duplicated values are eliminated in order to improve performance. Note that energyPRO tries to keep the time series as simple as possible in order to improve performance, this means that duplicated values is removed. For instance if coping a time series with 365 daily temperatures you might end up with a time series holding only 320 daily values. 2.4.3 External conditions – Online NCAR Data Instead of importing climate time series from files and spread sheets energyPRO offers the opportunity to do this using online data provided by EMD International. User's Guide energyPRO The energyPRO desktop in details 51 NCAR Data The data originates from the NCAR reanalysis project which provides climate data 4 times daily in a global grid since 1948 to present. The data available in energyPRO are: Air temperature : Instantaneous air temperatures in Celsius calculated at 0, 6, 12,18 Wind speed : Mean wind speed in m/s at 10 meters calculated at 0-6,6-12,12-18,18-24 Air pressure : Mean air pressure in HPa calculated at 0-6,612,12-18,18-24 Relative humidity : Mean relative humidity in % calculated at 06,6-12,12-18,18-24 In energyPRO we offer the possibility to convert NCAR data into intervals that differs from the standard 4 times daily. You can either convert the data to 24 times daily or 1 time a day. The conversion from 4 times daily to 24 times daily is done using linear interpolation, so e.g. if the air temperature at 0 is 2 and at 6 it is 8 the calculated air temperatures will be: Time Air temperature Source 0 2 From NCAR 1 3 Calculated 2 4 Calculated 3 5 Calculated 4 6 Calculated 5 7 Calculated 6 8 From NCAR The conversion from standard 4 times daily to 1 time a day is simply done by finding the mean value of the 4 NCAR values from that day. Adding time series from online NCAR data To add time series from online NCAR data you can either use the globe icon button at the toolbar or right click on the External Conditions folder in the folder structure, as shown in Figure 2.18. 52 The energyPRO desktop in details www.emd.dk User's Guide energyPRO Figure 2.18: Shows how you can add time series from online NCAR data. On the left it is accessed via the folder structure, and on the right it is accessed using the icon in the toolbar After using either of these methods you will be presented with the window shown in Figure 2.19. Figure 2.19: Dialog presented when adding time series from online NCAR data User's Guide energyPRO The energyPRO desktop in details 53 In the window a globe is presented on the left-hand side which is used to select the coordinate you wish to add climate time series from. To move the globe around you press and hold the left mouse button while dragging the mouse around. You can zoom in by moving the mouse wheel up and zoom out by moving the mouse wheel down. Once you have the area of interest in focus you can click on the globe with the left mouse button. This will ask the online server for the nearest NCAR data which will be presented on the globe with dots as shown in Figure 2.20. Figure 2.20: Shows the globe view after the nearest NCAR data points have been fetched 54 The energyPRO desktop in details www.emd.dk User's Guide energyPRO Once the nearest data sources are shown you select one of them by clicking on it with the left mouse button. The next step is to select which climate data you are interested in which is done by clicking the checkboxes in the Weather sources group. For each checked weather source, a time series will be created. Before the time series can be fetched from the online server and created in energyPRO you need to select a reference year for the data. In the drop down box you simply select the reference year. After selecting the reference year you can go ahead and click Ok to create the time series. However, if you want the time series to be created in different intervals than the standard 4 times daily you can choose a different interval in the Interval group box. Please refer to the section on NCAR Data earlier in this chapter to find details on how the conversion is done. Once you click the Ok button energyPRO will contact the online data server provided by EMD international to fetch the selected climate data. For each weather source that was selected it will create a new time series with default names and symbols. You can rename the time series and symbols as you want. 2.4.4 External conditions - Time series functions Time series functions are primarily meant for modifying existing time series. An example of a time series function is shown in Figure 2.21. Symbol The symbol is used for referencing to the time series function The symbol is a unique short name of the time series. The symbol is used for referencing the time series elsewhere in the energyPRO. All time series, time series functions and indexes, used in a project, have to use different symbols. Unit The unit in which, the values in the time series, is stated. The unit is for presentation use only. Figure 2.21: Example of a time series function, where a wind velocity in 10 meters height is modified to wind velocity in 80 meters height. User's Guide energyPRO The energyPRO desktop in details 55 Function In the function field, you have the option to define a function. If you press the Fx-button, you can see which functions are available for defining your time series function. If you need a more detailed description of the functions please see chapter 4 “Functions in energyPRO”, that serves as a reference-section describing the functions available in formula fields in energyPRO. In the function shown in Figure 2.21 a time series is modified. In this example the function modifies a wind speed velocity in 10 meters height to a wind velocity in 80 meters height using a wind gradient exponent of 0.15. The expression WS(_) refer to a time series, holding hourly values of wind velocity measured in 10 meters height. This time series has the symbol WS. Each value in this time series is modified with the factor (10/80)0.15. These values modified in a conversion table An advanced option is to check “These values to be modified in a conversion table”. This gives an extra opportunity to modify a time series function. In Figure 2.22 is shown a conversion table representing the power curve of a wind turbine. This table modifies the time series function shown above in Figure 2.21, so the output is a time series function holding variations in energy in wind instead of variations of wind velocity. Figure 2.22: Time series function example, where a wind velocity in 10 meters height is modified to wind velocity in 80 meters height and finally converted to energy output using a conversion table, which describes the power curve of a wind turbine. Figure 2.23 shows the graphical representation of the time series function example before and after the conversion table modifies it. 56 The energyPRO desktop in details www.emd.dk User's Guide energyPRO Figure 2.23: Time series function example shown graphically. Upper before modifying in conversion table. Lower after modifying in conversion table. 2.4.5 External conditions - Indexes Indexes are used to describe developments in demands and prices User's Guide energyPRO Indexes specify the development of a specific parameter. Indexes are in energyPRO used to describe developments in demands and prices. There are three ways of adding an index to a project. Constant annual increase Annual increase Index The energyPRO desktop in details 57 Symbol The symbol is used for referencing indexes The symbol is a unique short name of the time series. The symbol is used for referencing the time series elsewhere in the energyPRO. All time series, time series functions and indexes, used in a project, must have unique symbols. Constant annual increase. The index changes annually with the percentage typed in. In other words, it changes exponentially and is updated monthly. The index covers the total project period. Index is always 100 on the project start date. Annual Increase is used if the index has to reflect a shift in rate of change. If the first year in the table is before the project start date then the index on project start date is the value calculated based on input from the table, otherwise index is always 100 on the index start date. The index changes exponentially (yearly update). Index is used in situations, where you have a series of values (for instance the retail prices index) with values that you want to use if monthly specification is wanted. The index does not change between the indexes typed into the table. Figure 2.24: Index – example The example shown in Figure 2.24 is an index used for development of a specific heat demand. Within the first year of the projecting period the heat demand is expected to raise 20% due to connection of new consumers. Annual increase is chosen. In the first projecting year, 2012, the annual increase is 20% and hereafter 0 %. The result is shown in the graphic in the bottom of the window. 58 The energyPRO desktop in details www.emd.dk User's Guide energyPRO 2.5 Sites The Sites folder is primarily used in projects with more sites where the parent folder shows an overview of the different sites and transmissions. Figure 2.25: Screenshot that shows an example of a site overview with 3 different sites and 2 transmissions The graphical overview of a single site is shown either by clicking on its subfolder in the Sites branch or by double-clicking on it in the graphical Sites overview. The appearance and functionality of the graphical overview of a single site is described previously in section 1.7. 2.5.1 Adding more sites If you have purchased the REGION module you can add more sites to a project in 3 different ways as shown in Figure 2.26. Figure 2.26: New sites can be added either by right-clicking on the Sites main folder in the tree structure, via the popup menu on the graphical interface or via the Add button in the graphical toolbar Besides adding a new empty site it is also possible to load sites in to your project. When loading sites in to your project the loaded file is another energyPRO project file. So basically this functionality can be used to merge 2 or more energyPRO projects. When loading sites from another project file energyPRO will try to identify the identical external conditions, fuels and economy lines so that these are not duplicated in the final project. However, it is strongly User's Guide energyPRO The energyPRO desktop in details 59 recommended that the user verifies that the merging was done in the desired way. 2.5.2 Adding transmissions The graphical sites overview can also be used to add transmissions between sites. As it can be seen in Figure 2.26 transmissions can be added via the popup menu on the graphical interface or via the Add button in the toolbar. This way of adding transmissions will simply add a transmission between 2 sites that are not yet connected or report an error if all sites are already connected. Another way of adding transmissions is by dragging a line between 2 sites. First you select the type of transmission in the toolbar and you then select connection mode. Figure 2.27: To add transmission by dragging a line you select the type of transmission and then go to connection mode Adding connections in the graphical overview is described in more details in section 1.7.7. 2.6 Transmissions The Transmissions folder contains all the transmissions between sites in the project. Each transmission is defined by the following attributes: 60 The energyPRO desktop in details Energy type, which can be transmitted: Heat, Cooling and Process Heat The 2 sites that the transmission is connected to Attribute that tells in what directions the energy can be transmitted The capacity of the transmission, which can be defined by functions and time series. The capacity is the same in both directions. The loss on the transmission, which can also be defined by functions and time series. In the current version of energyPRO the loss is not relative to the amount of energy transmitted, but merely a constant (can vary over time) loss www.emd.dk User's Guide energyPRO Figure 2.28: Screenshot of the Transmission input form Transmissions are added to the project as described in section 2.5.2. 2.6.1 Restricting when transmissions can be used There are 2 different ways of restricting the use of transmissions: Non availability periods: This option can be used for yearly maintenance periods where the transmission is not available. In Figure 2.28 it can be seen that the transmission is unavailable every year from the 1st of September until the 3rd of September. Operation restricted to period: If a transmission is not available from the beginning of the planning period this option can be used to define when the transmission will be available. As an example you can see in Figure 2.28 that the transmission is not available before the 1st of June 2010 2.6.2 What about fuel and electricity transmissions? In the current version of energyPRO it is not possible to restrict transmission of Electricity and Fuel between the sites. This means that all sites are connected to each other with Electricity and Fuel transmissions. So if you have a restricted Fuel it will be available on all sites and the storage is common for all of them. In the same way an electricity producing unit can produce electricity for an electricity demand on another site. User's Guide energyPRO The energyPRO desktop in details 61 2.7 Fuels Load or add fuel data via the main menu or via the fuel- folder You have two options for including the fuels used in your project. The first option is to include them from a library. The second option is to add a new fuel. You can use earlier saved sets of fuels as a starting point, when you edit data. Right click in the input data folder structure at “Fuels”, select “Load” and choose the data you want to import. The imported data are now present in the editing window and can now be edited. Figure 2.29: Adding fuel data via “Fuel”- folder If you want to add new data then right click in the folder structure at Fuels and select “Add new fuel”. An empty fuel editing window is now shown and your data can now be filled in. 2.7.1 Editing options for editing a specific fuel Figure 2.30 shows the editing options when editing a specific fuel. Beside the “load” and “add” options, there are the options to: Copy fuel – making a new copy in the fuel folder Rename fuel – setting the active fuel folder name in editing mode Delete fuel – Deleting the active fuel-folder Save fuel – Saving the active fuel, invoking a save dialog Figure 2.30: Editing options for a specific fuel 62 The energyPRO desktop in details www.emd.dk User's Guide energyPRO 2.7.2 Editing the data fields Figure 2.31: Simple fuel (no Restrictions and storage) Unit You type the name of the unit (amount), in which the fuel is delivered, e.g. biogas can be delivered in ‘m3’ (cubic meter) or it can be delivered in ‘MWh’. This unit is for information use only. The unit is for instance used in the Heat value combo-box placed to the right. Heat value The heat value consists of two data fields. In the first you type the heat value as a number. The second field is a combo-box in which you choose the corresponding energy unit. Restrictions and storage If you cross mark this field, you get access to restrict the fuel amount offered and to specify fuel storage. Figure 2.32: Fuel with restrictions - biogas example User's Guide energyPRO The energyPRO desktop in details 63 Fuel storage, max utilizable content This parameter states the maximum utilizable content (amount) of the fuel storage. Offered fuel Specify how much fuel your production units are offered of the actual fuel each month. The amount of fuel that is not consumed will be put into the storage as long as it is possible. Remaining fuel will not be utilized. As time series You can convert the offered fuel into time series by pressing the “As time series”-button or by right clicking the mouse standing in the in the editing window. This gives you the possibility to type in data as accurate as you wish. 2.7.3 Using fuel when defining energy Unit To make use of a fuel in your energy calculations you have to choose the fuel when defining your energy units. Figure 2.33: Selecting fuel into an energy production unit. If “Fuel producing energy units in project” has been ticked in the “Project Identification” then a dropdown box called “Fuel output” is added between the fuel input dropdown box and the Powerunit dropdown box. 2.8 Demands Heat (and Process Heat), Electricity and Cooling demands can be specified within energyPRO. An unlimited number of demands can be specified, and in any detail. Detail costs. The more demands and the more details the longer calculation time. All the demands will be summarized before the energy calculation. This gives you an opportunity to make a detailed description of the heat demand. But note that detail costs in calculation time. The more demands and the more details the longer calculation time. In its most simple form, a demand is just one single value covering the annual demand Figure 2.34 The demand will then be distributed evenly all over the year, taking into account the number of days in the months. The resulting monthly amounts are shown in the “Monthly amounts”- 64 The energyPRO desktop in details www.emd.dk User's Guide energyPRO table in the bottom of the window. Note than you have the opportunity to type in and/or change the monthly amounts in that table. Figure 2.34: Demand – simple There are several opportunities to design a demand in a way that it reflect daily, weekly, monthly, and annual variations. The button “As graphics” give you access to view your input graphically. Correspondently the button “As time series” shows the input converted into a time series. 2.8.1 Developing over the years It is possible to design a demand that is developing over the years, see Figure 2.35. This is done by marking the field “Developing over the years”, and link to an already created “Index”. All the Indexes in the “External conditions folder” in your project are available the in the combo box. For further information about creating Indexes please refer to External conditions - Indexes Figure 2.35: Demand – developing of the years 2.8.2 Restricted period of connection Another option is to restrict the period of connection. If you for instance want to model that a new demand will emerge next year you have the opportunity to mark the field “Restricted period of connection” and to User's Guide energyPRO The energyPRO desktop in details 65 type in the period in which the demand is present, see Figure 2.36. If the restricted period of connection is not specified it is assumed that the demand is connected in the whole planning period. Figure 2.36: Demand – Restricted period of connection 2.8.3 Demand depends on external conditions Often the demands or parts hereof are dependent on external conditions, most often ambient temperatures. If “Demand depends on external conditions” is marked, a set of options to set will appear. This is shown in Figure 2.37. The options consist of three parts. Dependent fraction Formula for dependency Season for dependent demand Figure 2.37: Demand depends on external conditions “Demand depends on external conditions” is marked by default when a Heat demand is created but unmarked when other demand types are created. IMPORTANT: Require time series or time series functions created under the external conditions IMPORTANT: The use of “Demand depends on external conditions” requires that a time series or a time series function containing the external conditions have been established. The time series is normally a time series containing the average ambient temperature day by day during a year. Dependent fraction First, you have to define the fraction of the demand that is weather dependent. In a district heating system for instance 20 % of the heat might be assumed to be heat losses transmission and distribution pipes and other 20 % be used for domestic hot water, leaving 60 % for space heating. These 60 % normally depend on the ambient temperature Formula for dependency There are two ways of defining formula for dependency. The first option is that the demand “Depends linear on ambient temperature”. The second option is choosing “Is user defined”. 66 The energyPRO desktop in details www.emd.dk User's Guide energyPRO Depends on linear ambient temperature Demands are distributed after a simple degree-day method. The reference temperature and a time series containing ambient temperatures have to be typed in or chosen. Based hereupon a formula is auto-generated. In the figure below, the user has chosen 17C as reference temperature and chosen the time series with the symbol “T”. Figure 2.38: Formula for dependency - degree-day distributed heat demand Symbol for ambient temperature. In the symbol for ambient temperature combo-box, you find all the symbols attached to the time series and time series functions included in the “External conditions”folder. Select the symbol used in the time series containing your ambient temperatures, in the figure “T”. Reference temperature. The reference temperature is the ambient temperature below which room heating is needed. In Denmark, this temperature is normally assumed to be 17 C. Formula. When “Depend linear on ambient temperatures” is chosen the formula field is dimmed and not editable. In the formula field, you see the degree-day formula, including the reference temperature and the symbol for the ambient temperature. If e.g. the reference temperature are 17 C, and one day have an ambient temperature of 12 C and another day have an average temperature of 7 C, there will be 17C-12C=5 degree days in the first day and 17C-7C=10 degree days in the second day. That means that the first day only gets half of the amount of ambient dependent heat demand as the second day. Is user defined If “Is user defined” is chosen the options for setting the reference temperature and the ambient temperature is no longer available. Figure 2.39: Formula for dependency – Is user defined The only option is to define the formula. In the formula shown in Figure 2.39 is shown a degree-dependent formula, assuming T is the symbol for a Time series holding ambient temperatures. In chapter 4 “Functions in energyPRO” you find a detailed description of the function to be used in energyPRO. User's Guide energyPRO The energyPRO desktop in details 67 Restricted Season for dependent demand Finally, you have the option to define the “Restricted season for dependent demand” by typing in the first date of the restricted season followed by the last day of the heating season, see Figure 2.37. Fixed profile of demand Demands do often vary systematically on daily or weekly basis. Checking “Fixed profile demand” and marking one of the two radio-buttons “Daily” or “Weekly” enables options for modelling this. In Figure 2.40 is shown an example, where weekly is chosen. A fixed profile of demand consists of a number of rows each described by a time and a ratio. Figure 2.40: Fixed profile of demand. Weekly cycle You can add and delete lines by pressing the “add line” and “Delete line”- buttons. If you choose the “As graphics” -button, you will see a graphical representation of your time cycle. Figure 2.41 shows an example of the variation of a weekly cycle. Figure 2.41: Demand - Weekly cycle – graphic. Variations in percentage of weekly max. Note that this graphic only shows the variation of the time cycle and NOT the variation of the demand. 68 The energyPRO desktop in details www.emd.dk User's Guide energyPRO 2.8.4 As graphics – button To see a graphical representation of the demand you have to press the “As graphics”-button placed in the right side of the editing window. In Figure 2.42 a graphical example of a demand is shown. Figure 2.42: A demand shown as graphics example 2.8.5 As time series – button After having created a new demand, you can right click this demand and select “Convert to time series”. Here the demand specified so far will be converted to a time series. This time series can then be edited as described in the section External conditions - Time series. Internally within energyPRO all demands are converted to this format, before energy calculations are started. 2.9 Energy conversion units 2.9.1 Energy conversion units – in general There are two types of energy conversion units in energyPRO. Those are User's Guide energyPRO Production units Heat rejection The energyPRO desktop in details 69 Figure 2.43: The types of energy conversion units in energyPRO The productions units consists of nine predefined types of units of which one is a user defined type described by load curve(s) and three renewable technologies described with individual editing windows. The Load curve described units are: Boiler CHP-unit (Combined Heat and Power) Electrical heat pump User defined unit Absorption Cooling Electrical Cooling If the production unit type is consuming (or producing) fuel, a fuel defined in a “fuel” sub-folder has to be selected. The ability to convert energy is described with one or more load curves. Each load curve contains two or more loads, depending on the type of unit. The user-defined unit include all load types except “Heat consumption”. The possible loads are: 70 The energyPRO desktop in details Fuel consumption, Heat production, Heat consumption Electric production, Electric consumption Heat consumption (only available in absorption cooling) Cooling production Fuel production www.emd.dk User's Guide energyPRO For advanced users there is a wide scope of options to describe the behaviour of energy units dependent on formulas, the actual production on other production units and time series specified in the “External condition”- folders. The special treated renewable technologies without load curve description are: Wind farm Solar collector Photo voltaic 2.9.2 Production units described by load curves Figure 2.44 shows an example of a production unit, in this case a CHPplant, fuelled with natural gas. Figure 2.44: Production unit – CHP example Production unit type Figure 2.45 show the available energy units specified by power curves in energyPRO. User's Guide energyPRO The energyPRO desktop in details 71 Figure 2.45: Production unit types Depending on the production unit type selected, two or more power curves are available. Table 2.1 shows the power curves available depending on the selected Production unit type. X X Boiler X X X Electrical heat pump X Absorption cooling User defined X X X Electrical cooling X X X Fuel production Cooling production X Electricity production Process heat production Heat production Electricity consumption Heat consumption Fuel consumption CHP X X X X X X X Table 2.1: Available power curves for the different types of energy units Note that Process heat production is only available if the “Delivery of both heat and process heat” is selected in the “Advanced” setting in the “Project Identification” editing window. Fuel production is only available if “Fuel producing energy units in project” has been chosen in the “Project Identification”. Fuel type Only fuels added in the fuel folder are available Select a fuel in the combo-box. Options are the fuels you have added in your Fuel folder. If “Fuel producing energy units in project” has been ticked in the “Project Identification” then a dropdown box called “Fuel output” is added between the fuel input dropdown box and the Powerunit dropdown box. 72 The energyPRO desktop in details www.emd.dk User's Guide energyPRO Power unit Select the power unit, which you will use in the power curves. Options are kW and MW. Power curve The top line state the maximum loads, while the bottom line states the minimum loads of the energy unit. The loads of the energy unit between the power lines are calculated by linear interpolation. Note that if only one line is stated then a second imaginary line is automatically assumed created with the content of zeroes. Enable formulas in power curves: This facility gives access to adding formulas in the power curves instead of numbers. The formula will in each time step of the calculation call the formula and return a value. Figure 2.46: Power curve, formula enabled example Note that you can use all the time series created under external conditions and demands you have defined. For instance, you can make the power curve depend on the ambient temperature. If the symbol for ambient temperature is T, it is referenced by T(_), where the underscore means the value belonging to the time step calculated. You have the option to define load curves, including External conditions. For instance temperature time series Demands. Production on other production units Mathematical standard operators In chapter 4 Functions in energyPRO is found a detailed description of the functions to be used in energyPRO. The use of formulas will normally increase the calculation time considerably Note: The use of formulas in your power curves will normally increase the calculation time considerably. Figure 2.46 shows an example where time series are used for modelling the electricity production from off shore wind turbines. Here 2000 MW User's Guide energyPRO The energyPRO desktop in details 73 multiplied with a time series representing a normalized 1 MWproduction profile. Function-button When you push this button a text window will appear. Here you can see the available functions and eventually copy and paste them to the power curve. There are three groups of function. External conditions, demand functions and other functions. The first two references respectively to time series created under external conditions and to the demands. The last group contain basic mathematical functions and a step-function Z. Figure 2.47: Example of list of functions Restricted period of connection: Checking this option gives access to state the period where the unit exist. No specification means that the unit exist in the whole planning period. Operation dependent on other unit With this option checked you can state whether operation on this unit either include or exclude operation on another unit. This choice will appear at the bottom of the window as the choices: Allowed only when no production on unit Allowed only when production on unit. In both cases, you have the option to specify one of your already created energy units by selecting them in the two combo-boxes Figure 2.48: Operation dependent on other unit Below is given two examples of how to use this facility. If you e.g. have an energy unit running on two different fuels, biogas and natural gas, you can define this energy production unit as consisting of two different energy units (biogas engine and natural gas engine). You 74 The energyPRO desktop in details www.emd.dk User's Guide energyPRO select the unit you are specifying are e.g. the natural gas engine part is not allowed to run if the biogas engine is already operating. If you e.g. have an energy unit, where you can add an economizer to improve its heat production power output, you can define the economizer as an extra energy unit (modelled as boiler), where select, that the economizer can only be in operation if the belonging energy unit is producing. You then select the unit that have to be operating at the same time as the actual unit that you are editing. If no energy unit is selected, no restrictions are imposed on the operation. Non-availability periods: By checking the “Non availability periods”, you get access to a table where you can specify periods, where the actual energy unit is not available for operation. This could for instance be if the unit in a period is out for scheduled maintenance. Figure 2.49 shows an example where this is the case 8 days in respectively January and February. It is possible to select if the non availability periods are repeated every year, or if they only occur in one specific year. Figure 2.49: Non availability periods 2.9.3 Production units not described with load curves Solar collector In energyPRO Solar collectors are described by a) Size and position, b) Time series with ambient temperatures and solar radiation and c) Collector and field specific information, see Figure 2.50. User's Guide energyPRO The energyPRO desktop in details 75 Figure 2.50: Solar collector editing window in energyPRO Size and Position Total area of collectors: Is the aggregated area of the solar collectors. Latitude UTM: Is the Latitude of the solar collectors in UTM coordinates. Inclination of inclined plane: This is the tilted angle from ground of the solar collector. Orientation of inclined plane: The orientation of inclined planed is the deviation of the collectors from facing south (northern hemisphere – otherwise deviation from north). Figure 2.51: Solar collector – Size and position Select Input Time Series Prerequisites for the calculation of the heat production are time series with ambient temperatures and solar radiation on the horizontal plane. 76 The energyPRO desktop in details www.emd.dk User's Guide energyPRO These time series must be placed in the “External conditions”- folder before modelling the solar collector. Ambient temperature: Select a time series holding ambient temperatures. Radiation on horizontal plane: Depending on the available data solar radiation data two options are available. If “Aggregated” solar radiation is available, then select “Aggregated radiation” and select the time series holding these data. If both “Direct” and “Diffuse” is available then select the two time series holding these data, see Figure 2.52 Figure 2.52: Solar collector – Select input time series Collector and field specification The solar collectors are specified by a number of values, defining their technical characteristics. These values are normally found in the data sheets from the manufacturers. The equation used for the calculations are P A * I * no a1 * t m t a a2 * t m t a * L p 2 where I = Calculated radiation based on the position and radiation time series. t a = Ambient Temperatures found in specified time series. a = Start efficiency: Start efficiency is also called “Conversion factor”. The collectors start efficiency, where the fluid temperature equals the ambient temperature. a1 = Loss coefficient (a1) a2 = Loss coefficient (a2) Figure 2.53: Solar collector – Collector specification User's Guide energyPRO The energyPRO desktop in details 77 Incidence angle modifier (K): Refers to the change in performance as the sun's angle in relation to the collector surface changes. The IAM is used for the calculation of I , found in the equation above. Figure 2.54: Solar collector – Incidence angle modifier as graphic t m = Collector temperature: The average temperature of the collectors on the collector side. This temperature is defined by a forward temperature (the temperature of the water leaving the collector), tfrom and a return temperature (the temperature of the water entering the collector), tto. These values can either be fixed or referring to an external time series. Most often these temperatures are known on the demand side of the heat exchanger, but in the calculations it is the temperature on the collector side of the heat exchanger that is needed. So if you know the temperature on the demand side you can select that in the user interface and then you also have to specify the temperature drop over the heat exchanger, thx. The complete equation for calculating tm is then: tm = (tfrom+tto)/2 + thx Figure 2.55: The Collector field specification window used to define temperatures and losses Lp = Losses in pipes: This represents the loss in the pipes in the collector field. The loss is simply given as a percentage of the heat production. Array shading Often, large scale solar collector or photo voltaic systems will be mounted on the ground in rows which results in array shading. In other words solar collectors in one row will produce shade on the row behind it (compared to the sun). In energyPRO the effect of array shading is included by specifying the following parameters: 78 The energyPRO desktop in details www.emd.dk User's Guide energyPRO Figure 2.56: The array shading parameters Number of rows: The number of rows in the array Distance between rows: The distance in meters between each row Height, units: The height of each solar collector in meters Inclination, ground: The inclination of the ground in degrees. 0 means a flat surface. Orientation of ground: The orientation of the ground relative to directly south. These parameters are used to calculate the effect of array shading on direct (beam), diffuse and reflected radiation. Photo Voltaic In energyPRO solar Photo Voltaic is described by a) Size and position, b) Time series with ambient temperatures and solar radiation and c) a PV module specific information, and d) Miscellaneous, see Figure 2.57. Figure 2.57: Photo Voltaic editing window in energyPRO Size and Position Total Installed capacity: Is the aggregated capacity of installed PV panels, the unit is stated in kW or MW. Latitude UTM: Is the Latitude of the Photo Voltaic in UTM coordinates. User's Guide energyPRO The energyPRO desktop in details 79 Inclination of inclined plane: This is the tilted angle from ground of the PV panels. Orientation of inclined plane: The orientation of inclined planed is the deviation of the PV panels from facing south (northern hemisphere – otherwise deviation from north). Figure 2.58: Photo Voltaic – Size and position Select Input Time Series Prerequisites for the calculation of the heat production are time series with ambient temperatures and solar radiation on the horizontal plane. These time series must be place in the “External conditions”- folder before modelling the solar collector. Ambient temperature: Select a time series holding ambient temperatures. Radiation on horizontal plane: Depending on the available data solar radiation data two options are available. If “Aggregated” solar radiation is available, then select “Aggregated radiation” and select the time series holding these data. If both “Direct” and “Diffuse” is available then select the two time series holding these data, see Figure 2.59. Figure 2.59: Photo Voltaic – Select input time series PV module specification The PV module is described by three parameters, normally found on the manufacturers’ data sheets. Maximum power: The “Maximum power” from the PV panel under standard conditions. This value is not used in the energy conversion but only to calculate the number of panels. 80 The energyPRO desktop in details www.emd.dk User's Guide energyPRO Temperature coefficient of power: This coefficient specifies how the power productions from the panels react to changes operating temperature. NOCT: Normal Operating Cell Temperature Figure 2.60: Photo Voltaic – PV module specification Miscellaneous Aggregated losses from module to grid:. This value represents the losses from module to grid and encompass PV array losses, cable losses, inverter losses etc. Number of values: The calculated number of panels based on installed capacity and the Maximum power from the PV module specification. Figure 2.61: Photo Voltaic – Miscellaneous Wind farm The wind farm is a specialised energy unit having the general energy unit properties such as “non availability periods”, the “operation dependent on other unit”-option and the “restricted to period”-option. The wind farm uses an external time series with measured wind speed and a wind farm power curve to calculate electric production form the wind farm. The time series with wind speed must be present in the “External conditions”-folder, and the power curve must be specified in the wind farm editing window. Calculation type There are two approaches for calculation wind farms in energyPRO. 1. Annual production calculated, divided into two sub cases a. Park power curve is used directly b. Power curve is scaled to another level 2. Fixed annual production (wind speed is scaled) All approaches require that a time series holding wind speed is available and present in the “External conditions”-folder. User's Guide energyPRO The energyPRO desktop in details 81 Figure 2.62: Calculation type Annual production calculated. In this case the productions from the wind farm are calculated based on the wind speed specification and power curve of the wind farm. As an advanced setting, there are options to scale the power curve and thereby the production. Fixed annual production. This option serves to distribute a desired annual production given a specified wind farm power curve. All wind speeds specified through “Wind speed specification” (see below) are scaled by the modification factor that makes agreement between the annual production, the power curve and the wind speeds. This factor is found through iterations. Wind speed specification The wind speed at hub height is defined through the following parameters, which is used for converting the wind speed in measure height to wind speed at hub height. 1. A time series holding the wind speed 2. The measure height of the time series 3. The hub height of the turbines 4. The Hellmann exponent Figure 2.63: Wind speed specification Ad 1) The time series must be established in External conditions prior to the specification. Specification of power curve The power curve consists of a data set of values containing the wind speed and the corresponding power output from the turbines. In the calculation, the power output is assumed to be linear between two data elements. The power curve is specified through a data table and shown on a corresponding graph, see Figure 2.64. 82 The energyPRO desktop in details www.emd.dk User's Guide energyPRO Figure 2.64: The power curve of the wind farm The functionalities of the table are comparable to the other energyPRO tables. This includes unlimited number of values, add line and delete line buttons. Data is added by typing data into the table or it can be pasted via the clipboard. It is possible to copy a calculated wind park curve from WindPro via clipboard to the wind farm power curve in energyPRO, see Figure 2.65. Figure 2.65: The power curve. Values can be copied from clipboard, including park power curve calculated in WindPro Annual production calculated, not advanced Figure 2.66 shows the content of the wind farm editing-window if “Annual production calculated” is selected. This window contains the data described in this window, plus an advanced option. User's Guide energyPRO The energyPRO desktop in details 83 Figure 2.66: Wind farm, “Annual production calculated”, not advanced Annual production calculated (power curve scaled). An example of this is shown in Figure 2.67. Notice that the power curve now has a new resulting power curve both in the table presentation and in the graphic representation. There are two variants. It is possible to scale using a percentage or a new max. power curve value, see Figure 2.67 and Figure 2.68. 84 The energyPRO desktop in details www.emd.dk User's Guide energyPRO Figure 2.67: Wind farm, “Annual production calculated”, power curve scaled with percentage Figure 2.68: Wind farm, “Annual production calculated”, power curve scaled with max power curve value User's Guide energyPRO The energyPRO desktop in details 85 Fixed Annual production If Fixed annual production is selected then the Annual production and the wind farm power curve is specified (e.g. calculated in WindPro). Given the power curve and a stated annual production all wind speed values are scaled by a factor. This factor is calculated, and is used when calculating the production at any time. See the description in section 3.4. Figure 2.69: Fixed annual production (Scaling wind speed) 2.9.4 Heat rejection A heat rejection unit is e.g. used in situations, where electricity demands require electricity production from co-generating engines, while the heat produced by the cooling of the engines cannot be utilized. If a heat rejection unit is inserted, you must remember to select, which of the production units that have access to the heat rejection unit. This selection is done in the “Operation Strategy” editing window. 86 The energyPRO desktop in details www.emd.dk User's Guide energyPRO Figure 2.70: The heat rejection window Heat rejection capacity: Here you state the heat rejection capacity. Operation restricted to period: By checking this option you got access to state the period where the unit exist. No specification means that the unit exist in the whole planning period. Non-availability periods: By checking the “Non availability periods”, you get access to a table where you can specify periods, where the actual energy unit is not available for operation. 2.10 Storages 2.10.1 Storages in general There are three types of storages available in energyPRO. These are: Thermal Storage Electrical Storage Cold Storage 2.10.2 Thermal store Thermal stores are often key elements in creating cost-effective energy systems Energy systems do often require the use of thermal stores to reach costefficient solutions. Two of the main reasons are heat load situations during summertime and fluctuating electricity tariffs. If you insert a thermal store, you must select which of the production units that have access to the store. This selection is done in the “Operation Strategy” editing window. A thermal store also often has a loss over time that depends on the amount of energy in the storage. This loss can also be modelled in energyPRO. User's Guide energyPRO The energyPRO desktop in details 87 Figure 2.71: The thermal store window Volume: Is the volume of the thermal store. Temperature in the top: The temperature in the hot zone at the top of the thermal store. This temperature can be defined as a function using external conditions. Temperature in the bottom: This defines the cold temperature at the bottom of the thermal store. Together with the temperature in the top this temperature is used to calculate the temperature difference. Utilization: The percentage of the net volume actually used. The utilization might reflect both technical restrictions (e.g. volume below injection point), and operational reasons. Storage capacity: Based on the information stated above, storage capacity is calculated and shown. Operation restricted to period: If you are working in Finance or Accounts you have access to this point. Checking this point gives you access to state the period where the unit exists. No specification means that the unit exists in the whole planning period. Non-availability periods: By checking the “Non availability periods”, you get access to a table where you can specify periods, where the actual energy unit is not available for operation. Storage Loss: Clicking this check box gives you access to define a loss for the thermal store which is described in the following. 88 The energyPRO desktop in details www.emd.dk User's Guide energyPRO Storage Loss In energyPRO the thermal store loss is defined by: Loss when store is full and loss when store is empty. Both these losses can vary over time, which means that they can depend on things like temperature variations in the planning period. In order to calculate the loss at a given storage content linear interpolation is used, so if the storage is 75% full the loss will be (Loss at full – Loss at empty) * 0.75 + Loss at empty. Defining the loss at full and empty store can be a tedious task for the user so therefore energyPRO allows the user to define the loss via: Temperature at top and bottom (already defined as part of the thermal store capacity) Storage Height, which is the height of the storage in meters Insulation thickness in mm Thermal conductivity of the storage walls Ambient temperature, which is the temperature the storage is located in. This can be constant if the storage is located inside the building or it can be dependent on a time series if it is located outside Figure 2.72: The storage loss part of the thermal store window Based on these attributes energyPRO will calculate the two losses, however it is also possible for the user to click the User Defined checkbox and thereby be able to define the losses freely using functions and time series. 2.10.3 Electrical storage In energyPRO an electrical storage is basically a storage that can store electricity by converting it to another energy type (called internal energy type). So you should think of an electrical storage as a unit that consists of three individual units; a storage unit, a charging unit and a discharging unit. The charging unit uses electricity and converts it to the internal energy type and the discharging unit uses the internal energy type to produce electricity. User's Guide energyPRO The energyPRO desktop in details 89 These units will have a capacity and an efficiency. The capacity indicates the amount of energy they can convert and the efficiency indicates the loss associated with converting the energy. Battery The simplest form of electrical storage in energyPRO is a Battery. In this type of electrical storage you can simply think of it as a battery where you only have to define the electrical capacity of the battery and the capacity and efficiency of charging and discharging units. Figure 2.73: The edit window for a Battery The actual usage of the battery in a calculation is automatically done by energyPRO to use it in the most efficient way. Hydro pumping station A Hydro pumping station is an electrical storage that utilizes the potential energy in elevated water. So the charging unit is a pump that uses electricity to pump water in to an upper reservoir. When electricity is needed or it makes sense to sell it, the water is let through a turbine from the upper reservoir to the lower reservoir and thereby producing electricity. For the Hydro pumping station the electrical capacity is defined through the attributes of the 2 water reservoirs: 90 The energyPRO desktop in details Height difference: The height in meters between the 2 reservoirs Water reservoir: The volume of the upper reservoir in m3 www.emd.dk User's Guide energyPRO Utilization: The amount in percentage that can be used of the reservoir Figure 2.74: The Hydro Pumping Station input window Based on these attributes the electrical capacity, STcap, is calculated as follow: STcap = V * ρ * g * L * u / (3,6*10^9) [MWh] where V is the volume of the elevated water, m3 ρ is the density of water ≈ 1000 kg/m3 g is gravity, 9,8 m/s2 L is the elevation or height difference, m u is the utilization factor in percentage This capacity is measured according to the elevated water. The electricity output will be lower due to the efficiency of the turbine; likewise, the electricity input will be higher due to the efficiency of the pump. The charging and discharging capacity of the hydro pumping station is set by the electric capacity of the pump and the turbine. For a Hydro pumping station it is also possible to include a water inlet which is used to simulate water coming in to the upper reservoir. The water inlet is selected as a time series which can be either in the form of User's Guide energyPRO The energyPRO desktop in details 91 potential electrical energy (MW/h) or in the form of water running to the reservoir per hour (m3/h). E-Cars The E-cars electrical storage is a special kind of storage that besides the storing capability also simulates electrical car usage. If you have a group of electrical cars you can regard them as a battery capable of storing electricity from the grid in their batteries, but also capable of producing electricity back to the grid. This is very similar to the Battery electricity storage, but 2 things make electrical cars special: 92 The energyPRO desktop in details Driving demand: Compared to a simple battery E-cars will drain the battery as they drive around. So for E-cars electrical storages you have to define the driving demand as a time series. Availability for charging / discharging: An electrical car will only be available for charging/discharging when it is connected to the grid. In energyPRO this can be simulated in 3 different ways: o The simple method: When the driving demand is zero the e-cars are available for charging/discharging. o A more sophisticated method: The peak demand (seen during the month) is equal to zero charging/discharging. Zero demand is equal to full charging/discharging. Any value as percentage of the demand in between peak and zero sets the reciprocal value in percentage of the charging/discharging. o A third method: A user defined time series. 0 is equal to zero charging/discharging. The highest number is equal to full charging/discharging. www.emd.dk User's Guide energyPRO Figure 2.75: The edit window for E-Cars 2.10.4 Cold Storage Cold Storages in energyPRO are modelled using the same principles as are described for the Thermal Storage. Cold Storages differ by storing cooling and hereby operation with lower temperatures. As with a thermal store, you must select which of the production units that have access to the cold storage. This selection is done in the “Operation Strategy” editing window. A cold storage will also often have a loss over time that depends on the amount of cooling in the storage. This loss can also be modelled in energyPRO. 2.11 Electricity Markets 2.11.1 Market Type Electricity markets are added either by right-clicking the folder “Electricity market” and choosing “Add new electricity market” or by right-clicking in the Graphical User Mode’s editing window, selecting “Add” and choose “Electricity Market”. Note that unless the MARKETS module is activated, ONLY one “Electricity Market” may be added to a model. If the MARKETS module is User's Guide energyPRO The energyPRO desktop in details 93 activated any number of “Electricity Markets” may be added. See section 2.11.6 for more on several “Electricity Markets”. When adding the first (and possibly only) “Electricity Market”, it is possible to choose between three market types. Flat Rate Fixed Tariffs Spot Market If you have electricity production but the electricity price is the same all time then choose “Flat Rate”. It is often preferable that energy units produce or consume in certain hours. The reason can e.g. be that the prices paid for electricity may vary significantly within day and night and between weekdays and weekends. In such cases, you need to define an “Electricity Market” and have to choose either “Fixed Tariffs” or “Spot Market”. Fixed tariffs are tariffs such as the Danish triple tariff or a UK “Day and Night” tariff. “Spot Market” is used when optimization is based on fluctuating electricity spot market prices. Figure 2.76: Selecting Market Type. The addition (auto) or (User def.) indicates whether “Operation strategy” is selected to be calculated automatically (Minimizing net heat production costs) or it is user defined. The layout and functionality of the rest of an Electricity Market window depends on the actual choice “Market Type” and choice of “Operation Strategy”. “Electricity Markets” are fundamental for the optimization calculations done by energyPRO In an “Electricity Market”, the hours in the planning period are placed into groups with different priorities. In a cogeneration example the hours with the best electricity prices normally will group those hours as top priority, lower prices will get a lower priority and so on. The definition of an “Electricity Market” is fundamental for the optimization 94 The energyPRO desktop in details www.emd.dk User's Guide energyPRO “Electricity Market” is closely related to the folder “Operation Strategy” calculations done by energyPRO. The “Electricity Market” folder is closely related to the folder “Operation Strategy”, in which the defined “Electricity Markets” is used for setting up an operation strategy for all the production units defined in the project. An example of an “Electricity Market” editing window is shown in Figure 2.77. Figure 2.77: An Electricity Market window. Note that if the selected market type is “Flat Rate”, all hours have the same priority. Saving and loading If you chose to import an earlier saved setup of an “Electricity market” you can use this in your calculation or use it as a starting point, when you are editing data. Right click on the folder “Electricity market” and choose “Load electricity market”. The imported data are shown in the window and can now be edited. If you want to save data, you right click the electricity market you want to save and select save, and specify an expressive name of the file. 2.11.2 Flat Rate If “Flat Rate” is chosen all except the “Market Type” selection frame in the editing window is empty. User's Guide energyPRO The energyPRO desktop in details 95 2.11.3 Fixed Tariffs If fixed tariffs is selected you need to define “priority names” i.e., names of your tariff levels, and you need to define the priority periods connected to the priority names. Priority name The year will often be divided into several periods, maybe hundreds. However, they are normally grouped into very few groups, e.g. Peak load periods, High load periods and Low load periods or Day tariff and Night tariff, as seen on Figure 2.78. These groups are named “Priority names” and are added in the upper right table. Figure 2.78: Periods of priority –Day-Night tariff example. In the simple example shown in Figure 2.78, the “Day tariff” is limited to the period from 07:00 to 21:00, Monday to Friday, including holidays. ALL other hours are then automatically defined as “Night tariff”. In the lower table you define when the already named “Priority periods” are located within the year. A period is specified by one or more lines. It is allowed to make overlaps in the description, because the period, which is first in the Priority name-list (e.g. Day tariff) are selected first and hereby reserving the specified time span. The next periods on the list have only access to the time spans that are not already reserved by “Priority names “with higher priority. Note: You cannot define periods for the last name, in this example Night tariff. All periods not defined in the table are automatically allocated to the last “Priority period” in the example “Night Tariff”. If there are no dates specified for “From Date” and “To Date” the period are valid for the whole year. 96 The energyPRO desktop in details www.emd.dk User's Guide energyPRO A whole day is specified as from 00:00 to 00:00. Figure 2.79: Electricity markets. Fixed tariffs, detailed example. 2.11.4 Spot Market The year will often be divided into several periods, for instance one value for each hour in the year. In the energyPRO optimization, those values have to be divided into a few groups each covering an interval of values. Depending on whether “User Defined” or “Minimizing Net Heat Production Cost” (auto calculation operation of strategy) is selected in the “Operation Strategy” this is done different and the part of editing window right to the “Market Type” is consequently different, see figure below. Figure 2.80: Defining “Spot market”. Left: Operation strategy is user defined. Right: Operation strategy is calculated automatically Common for both the user defined and the auto calculation approach is that they must be based on a selected time series containing spot prices. Note that the time series first must be established as an element in the External conditions folder. In the example below the time series has got the name “EEX2011Phelix”, indicating that the time series is holding a set of electrical spot prices. User's Guide energyPRO The energyPRO desktop in details 97 Figure 2.81: Adding name of time series or time series function Normally you have to create those time series on your own. Delivered with energyPRO there are few examples of time series containing historic electricity spot prices. Spot market – Operation strategy selected as “User defined”. If the “User defined” operation strategy is selected a filter has to be set up to divide the selected time series into subgroups, se Figure 2.82. Figure 2.82: Defining “Spot market”. Operation strategy is user defined. In this example the user has chosen to divide the Spot prices into three price groups. “Good prices”, “Medium prices” and “Below bid. Price”. Good prices are here all spot prices above “36,00 GBP/MWh “, medium prices are prices above “17,00 GBP/MWh” and under “36.00 GBP/MWh”. All prices below “17,00 GBP/MWh” belong to the group “Below bid. Price”. This example could be designed for an energy plant with a co-generation unit and a boiler, where the plant optimized up against electrical spot market prices. Spot market – Operation strategy selected as “Minimizing Net Production Cost”. In Figure 2.83 is shown how the Spot Market is defined, if the Operation strategy is chosen as Minimizing Net Production Cost. Here it is possible 98 The energyPRO desktop in details www.emd.dk User's Guide energyPRO to choose the “Quality of Spot Prognosis”. Rough and Detailed divide the spot prices into subgroups. Better quality means more subgroups. Figure 2.83: Defining “Spot market”. Operation strategy is calculated automatically If “Rough” or “Detailed” are chosen, there will be one price group containing the hours with the highest spot prices. Default this is set to 5% (“Hours in extreme price hours”). Similar there will be a group with the 5% lowest spot prices. The rest of the hours are divided into a number of subgroups/price intervals. The default setting is 5 intervals in “Rough” prognosis and 10 intervals in “Detailed” prognosis. Perfect spot prognosis assumes full knowledge of what the spot prices are to be. When selecting time series as spot prognosis you shall select a time series from the external conditions, which will function as price prognosis. Figure 2.84: Selecting time series as prognosis. 2.11.5 Show As graphics You have the option to show the time series after the filtering, either as a time series or as Graphics. On Figure 2.85 (Upper) is an example of a rough prognosis, where the hours with extreme high prices are in a group of its own. The lower part of the figure shows the prognosis when a time series is selected as prognosis. User's Guide energyPRO The energyPRO desktop in details 99 Figure 2.85: Electricity Markets as graphics if Spot market is selected. Upper: Rough prognosis, Lower: time series as prognosis 2.11.6 More than one “Electricity Market” in a model (MARKETS) If you have an activated license to the energyPRO module MARKETS you will be able to have more markets in the same model. The number of markets is unlimited and the different types of markets can be combined. This is for instance relevant when one CHP engine is selling electricity into the spot market, while another CHP unit is selling electricity to a flat rate tariff. You can have a spot market for your electricity production on CHP and a flat rate market for your electricity consumption. Or, you can have a spot market for one site and a fixed tariff market for the other site (requires REGION). 2.12 Operation Strategy Intelligent operation strategies are core elements in creating costeffective energy systems. The layout of the “Operation Strategy” editing window is closely connected to the “Electricity Market”. You have the option to choose between automatic calculation of operation strategy “Minimizing Net Production Cost (NPC)” and user defined “User defined Operation Strategy”. The figure below shows two examples of operation strategy editing windows for a project with no cooling demand. The upper example is a project with a user defined operation strategy optimized on a flat rate electricity market, while the lower shows a project with an automatic operation strategy optimized against a spot market. 100 The energyPRO desktop in details www.emd.dk User's Guide energyPRO Figure 2.86: Operation Strategy window – Upper simple user defined example – lower auto calculated operation strategy example Heat Production Strategy: energyPRO calculates the optimisation period (month or year) several times. First, it calculates the optimisation period with only the energy units with top priority (e.g. the lowest number) in operation in the chosen priority periods. Hereafter it calculates the optimisation period adding the energy units with next highest priority in operation, etc. This iterative technique takes into account the priority set-up in the Operation Strategy. The two examples in Figure 2.86 are without a cooling demand or fuel producing units enabled. If a cooling demand was added together with cooling producing units, e.g. Electric chillers, a new tab for the “Net Cooling Production Cost” would be added to the operation strategy. This tab will be similar to the tab “Net Heat Production Cost”, except that it would show the priority of production for the cooling at different electricity prices. Similar if “Fuel producing energy units in project” has been enabled in the “Project Identification” a tab called “Fuel Production strategy” would appear, in which you can define the max allowed priority number of the fuel producing unit, which is the highest User's Guide energyPRO The energyPRO desktop in details 101 priority number in the Production Strategy the units consuming the fuel produced will allow the fuel producing unit to run at. For the shown auto calculated operation strategy in Figure 2.86, the tab “Energy Unit Setup” looks as shown in Figure 2.87. Figure 2.87: “Energy Unit Setup” tab for the lower example in Figure 2.86 Heat Rejection allowed: This section is visible only if a heat rejection unit is added. You check the production unit(s) that have access to the heat rejection unit. Miscellaneous: The Operation Strategy window changes its appearance dependent on the following factors: Does the project include electricity demand Does the project include thermal store Does the project contain transmissions Is the operation strategy calculated automatic You have to check allowances and restrictions towards these options. E.g. is the production from an energy conversion unit allowed to be transmitted to another site? Which energy conversion units are allowed to produce to thermal store? Which energy conversion units are allowed to run on partial load etc.? 2.12.1 Operation strategy You have to decide how your “Operation Strategy” should be setup. There are two options “Minimizing Net Production Cost”, which automatically will fill in numbers in the Priority table, and “User Defined Operation Strategy”. Figure 2.88 shows an example of an operation strategy. In both cases the matrix consisting of the tariff names and the production units has to be filled out. If “Minimizing Net Heat Production Cost” is selected then 102 The energyPRO desktop in details www.emd.dk User's Guide energyPRO the Operation Strategy will be calculated based on the “Operation Expenditures” and the “Revenues” that you have defined in your “Economy”. Hence, it is of crucial importance that these are made accurate. These values cannot be edited while “Minimizing net Heat Production Cost” is selected. Choosing “User defined operation strategy” hereafter will keep the calculated values and make the table editable. The functionality of “Minimizing Net Heat Production Cost” is described in the next section. Figure 2.88: Operation strategy table, fixed tariffs. Upper: “User Defined Operation Strategy”. Lower:” Minimizing Net Heat Production Cost”. Operation strategy if Electricity market is “Spot Market” If the “Electricity market” is “Spot Market”, the Operation strategy window is different depending on whether “Minimizing Net Heat Production Cost” or “User Defined Operation Strategy” is selected. If “User Defined Operation Strategy” is selected the editing window and it functionality is identical to if “Fixed tariff” is selected in “Electricity Market”. If “Minimizing Net Heat Production Cost” is selected the operation strategy table is substituted by an graphic representation of the Net Heat Production Cost for energy production units as function of the electricity spot prices. User's Guide energyPRO The energyPRO desktop in details 103 Figure 2.89: Operation strategy table, Spot Market. Upper: “User Defined Operation Strategy”. Lower:” Minimizing Net Heat Production Cost”. Automatic calculation of operation strategy – How is it done? The basic idea behind the automatic operation strategy calculations in energyPRO is that the “Net Heat Production Costs”, and “Net Cooling Production Costs” if a cooling demand is added, are calculated for each production unit in all tariff periods. For instance, if there is six tariff periods, six prices for the “Net Heat Production Costs” and “Net Cooling Production Costs” are calculated as one for each of the production units, forming a decision table. When calculating the energy conversion energyPRO first places as much production as possible on the production unit/tariff period combination represented by the smallest value in the decision table. Hereafter the production unit/tariff period represented by the second smallest net heat production cost will get as 104 The energyPRO desktop in details www.emd.dk User's Guide energyPRO much production as possible, etc. This is done until all demands are met or the production opportunities are exhausted. Also see 3.1 Method of energy calculation in energyPRO. The calculation of the operation strategy is entirely based upon the “Revenues” and the “Operation expenditures” set up by the user to describe the Operation income. Therefore it is of crucial importance that these payments are set up properly, prior to the energy conversion calculation. The energy and economy calculation are tied together and will affect each other. The calculation strategy is calculated for each month in the planning period. The methodology for calculating the operation strategy is an incremental approach where each of the heat-producing units is calculated as stand-alone units producing one MWh-heat, and each of the cooling producing units as producing one MWh-cooling. In this calculation, all the payments in “Revenues” and “Operation expenditures” are evaluated and calculated. The calculation is repeated for each production unit in each electricity tariff period. This is the case for production units with heat production. In Figure 2.90 is shown the heat-producing units in energyPRO. This is CHP, Boiler, Electrical heat pump and User defined. Note that a “User defined” production unit needs a heat production typed into the power curve. Figure 2.90: Net Heat production costs are only calculated for Heat producing Production units. Photovoltaic and Wind farms are always set to a priority higher than all heat-producing units. The heat producing units are calculated first. Thereafter, the cooling producing units are calculated. Of the cooling producing units the absorption chillers calculated first and finally the electric chillers. The priority of the absorption chiller is defined as Max allowed heat production cost. Meaning, that if the Absorption chiller is to produce cheaper than the electric chiller in the same tariff period, then the heat User's Guide energyPRO The energyPRO desktop in details 105 producing unit has to have a heat production cost lower than Max allowed heat production cost. If a payment is the same for all productions units in all tariff periods the payment is ignored. By other words fixed payments not related to the operation of production units are eliminated. In annex 1 is shown how the formulas, that may occur when describing the payments, are interpreted when being used to calculate the operation strategy. Each month new operation strategies are calculated. By selecting a month in the project period, the corresponding operation strategy is calculated and shown in the table as shown in Figure 2.91. Figure 2.91: The operation strategy for an arbitrary month of the planning period can be selected Limitations in use of the automatic calculation of Operation Strategy If either the process production option or the fuel producing units option is enabled, as indicated on Figure 2.92, then only the user defined operation strategy is available. 106 The energyPRO desktop in details www.emd.dk User's Guide energyPRO Figure 2.92: Automatic calculations are not possible if either the process production option or the fuel producing units option are enabled. 2.12.2 Heat rejection table The heat rejection table is only visible if a heat rejection unit is defined (an Energy Conversion Unit). The heat rejection table is located in the Energy Unit Setup tab. Figure 2.93 Heat rejection table layout In the heat rejection table there are three options. These are that the energy production unit 1) has always access to blow off, 2) has never access to blow off and 3) the units has access to blow off only if the unit are able to produce heat at negative heat production costs. An example hereof could be hours with high prices at the spot market. 2.12.3 Miscellaneous table There are five standard columns in the miscellaneous table, those are: 1. Production to thermal store allowed (only visible if a thermal store is specified) User's Guide energyPRO The energyPRO desktop in details 107 2. Transmit to other sites allowed (only visible if there is more than 1 site in a project) 3. Partial load allowed 4. Selected priority in operation strategy (only visible if the operation strategy is auto calculated ) Figure 2.94: Miscellaneous table layout. Upper is when the operation strategy is User defined, and the lower is when it is automatic operation strategy ad 1) State whether the production units have access to the storages. ad 2 ) State whether the production units are allowed to transmit energy to other sites. ad 3) State whether the production units are allowed to run on partial load. ad 4) If the operation strategy is auto calculated this column give the opportunity to overrule the predefined standard settings, which are Boiler: calculated CHP: calculated Elec. Heat pump: calculated User defined unit: calculated Absorption cooler: calculated Electric cooler: calculated Wind farm: High Solar collector: High Photovoltaic: High If an electricity market is added to the model a new column is opened in the miscellaneous table in the operation strategy. This table contain a drop-down box in which it is possible to select between the different electricity markets (It is only possible to have more than one electricity market if MARKETS module is activated). This is done for each production unit that are producing and/or consuming electricity. Figure 2.95 Select the electricity market each of the energy production units are traded at. Here the electricity markets are named “Spot Market” and “Flat Rate”. 108 The energyPRO desktop in details www.emd.dk User's Guide energyPRO If electricity demand(s) are defined in the project a market has to be selected as for the production units. Note that all demands are pooled in this table and subsequently are attached to the same market. Figure 2.96 Select the electricity market for electricity demands(s). 2.12.4 The Island Operation Strategy If you have created an electricity demand in your project, you will in the Operation strategy-window be able to choose "Island operation". Figure 2.97: The island operation mode is visible in the upper right corner of the Operation Strategy when you have electricity demands in your project When "Island operation" is chosen, the operation will not be focused on optimizing the electricity productions at the chosen electricity markets, but will be focused on covering the electricity demand (at “the island”). The "island" is not necessarily a real island, but could be a local area, that has focus on covering its own electricity demand. In such a project there will often be a heat and/or cooling demand to be covered (at “the island”). It has equal priority to cover these demands. The produced heat to cover the heat demand can be stored for a longer period in a thermal store. The produced electricity to cover the electricity demand can be stored for a longer period in e.g. a hydro pumping storage. The produced cooling to cover the cooling demand can be stored for a longer period in a cold store. In the Operation strategy window you may choose User Defined Operation Strategy to determine in which order the production units will be put in operation. You may also choose to accept the suggested operation strategy determined by the net heat production costs. In this version of energyPRO you will then have to decide yourself about the priority of the production units that do not produce heat but produce electricity. For these units you can choose between High priority and Low priority, compared to the production units producing heat. You are NOT able to decide about the priority of a hydro pumping storage. Excess electricity (compared to the electricity demand) will be stored in the hydro pumping storage (if possible). User's Guide energyPRO The energyPRO desktop in details 109 In hours where the production units are not able to cover the electricity demand, the hydro pumping storage will try to deliver the rest (perhaps limited by the capacity of the hydro pumping storage). When "Island operation" is chosen, you can further choose between: NO connection to the electricity market Needed exchange with the electricity market If "Needed exchange with the electricity market" is chosen, production units with excess capacity will be allowed to export (Delivered electricity) and not covered electricity demand will be covered through import (Received electricity). Only production units with a negative number in the “Priority of production” section of the “Operation strategy” are allowed to export. 2.13 Environment This folder is used to define emissions in energyPRO, such as CO2, NOx and CO2. The folder structure under environment is also used to structure the report “Environment, summary”. Emission types can be established by right clicking the mouse standing on the environment root folder offers the option “add new emission”. To each emission type physical units of amounts has to be chosen. This is done in the editing windows, corresponding with the actual emission folders. For each emission type, there are two options for units. Those are: Mass User defined The first one is shown in the figure below. There are five mass units that are allowed. Those are “gram”, “kg”, “ton”, “1000 ton” and “mill. ton”. The “Used in input” unit is the one used when describing specific emission values in the editing window”. The “Used in reports” units is the one used in the “Environment”-report. If the emission type is “user defined”, it is possible to type in a text string instead. This will be used instead of the five predefined mass units, and will appear both in input data and in the reports. 110 The energyPRO desktop in details www.emd.dk User's Guide energyPRO Figure 2.98: Emission type values. Default values for CO2. For each emission type, an unlimited number of emissions can be added. A new emission is added by pointing on the actual emission type folder, right clicking the mouse and choosing add new emission or simple pressing the “Add new emission” on the emission type window, see the figure above. This will open an editing window to specify the emission. This window is similar to the window used in the economy to describe “Revenues” and “Operation expenditures”. Please refer to section 2.15, and to chapter 4 “Functions in energyPRO, where you find a detailed description of the functions to be used in energyPRO. Normally it is simpler to model the emissions in the “Revenues” and “Operation expenditures”. Most cases are covered within two different situations, as emissions are normally directly related to either the amount of used fuel or to the process of energy conversion. The first case is the situation CO2. In the figure below the case is described by choosing “Received fuel”, the fuel “natural gas” and a specific amount of 2,27 kg/Nm3. User's Guide energyPRO The energyPRO desktop in details 111 Figure 2.99: Emission example fuel dependent Note that the “kg” part of the unit comes from emission type unit and the “Nm3” part comes from the unit in which the actual fuel is typed. Figure 2.100: Emission example technology dependent In the second case where emissions is technology dependent, the situation can normally be described by choosing “Production unit”, “Fuel consumption” and the desired production unit in the production unit combo-box, in this example “Gas engine 1”. If the project is in either FINANCE or ACCOUNTS it is also possible to attach an index to the amount of emission per unit. This is useable for 112 The energyPRO desktop in details www.emd.dk User's Guide energyPRO simulating e.g. changing CO2 emission of received electricity over the years. Figure 2.101: Emission example technology dependent 2.14 Economic input data 2.14.1 Facilities in the economic section The facilities in the economy module depend on which energyPRO module that are presently selected in the “Project Identification”. The available economy folders are module-dependent. Basic elements for all modules are the folders “Revenues” and “Operational expenditures”. “Investments” and “Financing” are available in Finance and Accounts only while “Taxation” is an option only in “Accounts”, see Figure 2.102. *) *) **) *) Finance and Accounts **) Accounts only Figure 2.102: Economy input data 2.14.2 Economy – Main folder: The content of the editing window accompanying the economy main folder is module dependent. DESIGN: Currency. FINANCE: “Currency”, “Inflation index” and “Nominal discount rate” and investment key figures option. ACCOUNT: “Currency”, “Inflation index” and “Nominal discount rate” and investment key figures+ Define annual key figures. The input typed in this window will be used when creating the report “Financial Key figures”. The “Currency”, “Inflation index” and “Nominal discount rate” input windows are shown in Figure 2.103. (“Inflation index” and “Nominal discount rate” are only available in FINANCE and ACCOUNTS). User's Guide energyPRO The energyPRO desktop in details 113 Figure 2.103: Economy – Main folder Currency: The name/symbol of the currency (Used for presentation only). Inflation: Select which of your created indexes that describes the inflation. Nominal discount rate: The nominal discount rate is used for calculating the “Present Value” of the investment. See the report Financial Key Figures Indexes Indexes used for economy calculations should be defined in the External Conditions of the Input Data window, and then referenced in the Economy – Main folder window. For more details, please see the description in the “General Input Data” section, External conditions - Indexes Investment key figures If the FINANCE or ACCOUNTS is selected, there are two general project evaluation options available: Present value Internal Rate of Return Note that the present value is calculated using the “Nominal discount rate”. Figure 2.104: Key figures. Present value selected as investment key figure. 114 The energyPRO desktop in details www.emd.dk User's Guide energyPRO The selection is made in the Economy editing window, see Figure 2.104. IRR in energyPRO When you choose to include Internal rate of return in your calculation you get the following warning. Figure 2.105: Warning about Internal rate of return. The IRR calculation in energyPRO is either monthly or annual based. This means that all payments within a month are summed up to one value each month or alternatively all payments within a year are summed up to one value each year. The IRR is then calculated using this time series defined by these monthly or annual sums. Figure 2.106: In energyPRO IRR is either monthly or annually based. If the created time series contain more negative values than the initial investment, there might be more solutions causing the IRR to be ambiguous. Another problem might be that the iteration routine finding the IRR will not converge. In that case a message in the “Financial key figures”-report will tell that the IRR is “Not found”. There will be cases, where the time series start with positive values (income) before the investments will cause the iteration routine finding the IRR will not to converge. The monthly-based IRR might show the most correct IRR while the annual based IRR in some cases will be more robust. In the annual case, some months with negative values might be eliminated when summed up annually. Please remember, that you define yourself all the payments you want to include in the calculation. Therefore it is extremely important, if you want to use Internal rate of return for comparing investments, that you are careful about not including irrelevant payments. More information about IRR in energyPRO is found in section 3.2.3 Define key figures In the ACCOUNTS module you can chose to include or exclude predefined key numbers in the report “Financial Key numbers”. User's Guide energyPRO The energyPRO desktop in details 115 Figure 2.107: Key Figures. Example with “Define annual key figure” defined. If you check the facility “Define annual key figures” you can type in the wanted key figures by defining their names, formulas and presentation (as percentage or as number). Hereto comes the possibility of defining headers. There is a set of predefined function available for creating your formulas. These functions are based on the annual amounts calculated in “Income Statements” and “Balance Sheets”. Hereto come a few functions based on energy the energy conversion, and mathematical standard expressions and functions such as Min, Max etc. In that case type in the header text in the column “Name of key figures” and select the “Header”-option” in the “Shown as” column. You can use the following built-in functions in either their long or short version. The functions all returns annual values. Long version Short version CashAccount CA Depreciations D ExtraordinaryIncome EI FCAnnualMWh(ProductionUnit) FinancialExpenditures FE FixedAssets FA LongTermLiabilities LTL OperationExpenditures OE OtherCurrentAssets OCA OwnersCapital OC QI(value1;value2) Reserves Result Revenues R ShortTermLiabilities STL Tax T 116 The energyPRO desktop in details www.emd.dk User's Guide energyPRO TransferredResult TR Table 2.2: Functions available for defining annual key figures Long version Short version Revenues R OperationExpenditures OE Depreciations D FinancialExpenditures FE ExtraordinaryIncome EI Tax T Result FixedAssets FA CashAccount CA OtherCurrentAssets OCA OwnersCapital OC TransferredResult TR Reserves ShortTermLiabilities STL LongTermLiabilities LTL FCAnnualMWh(ProductionUnit) QI(value1;value2) Table 2.3: Functions for defining annual key figures In chapter 4 Functions in energyPRO is found a detailed description of the functions to be used in energyPRO. 2.15 Revenues and Operational Expenditures Essentially, revenues and operational expenditures consist of picking out results from the energy calculation and multiply these results with unit prices. This is done for all the payments you want specified. An unlimited number of payments can be established. Each of these payments produces one line in the Economy printouts. The Payments can be grouped in payment groups. A group of payments is in the Economy printouts shown as a sub balance of the payments in the group. User's Guide energyPRO The energyPRO desktop in details 117 Figure 2.108: Adding payments or payment groups to “Revenues” and “Operation expenditures”. Add payment group: If you right click, you can add a payment group You can collect payments into groups and in this way organize your economy report just as you like. Each group of payments represent a subtotal in the complete economy report. You can also save the group or the payment and use it in future calculations. If you want to use an earlier saved group of payments, you can choose “Load payment/paymentgroup” in the menu and choose between the saved payments or groups of payments. Remember to check the imported lines of payments for consistency because all of the energy units, fuels and so on from the earlier project not necessary exist with the same names in the present project. Often a saved payment group is usable as a template, where the single payments have to be edited. Add payment: If you right click, you can add a new payment and a default payment window will appear Figure 2.109. The Payment window consists of the three main panels. “Unit selection”, “Price per unit” and “Include in operation strategy”. If the FINANCE or ACCOUNTS module is selected the panels “Development of Price” and “Advanced” are added. 118 The energyPRO desktop in details www.emd.dk User's Guide energyPRO Figure 2.109: Payment Window: Revenues and Operational Expenditures Unit Selection Payment concerns: “Payment concerns” is the key to constructing a payment. Here you have to select one of the following items: Figure 2.110: The Payment concern combo-box The selection of an item in “Payment concerns” combo-box decides the layout of the rest of the editing window. E.g. will combo-boxes be visible or not visible depending on selected item in “Payment concerns” combo-box. The first three items concerns fuels and electricity exchange crossing the system border. The system is defined in section 4.4 Functions used only in Revenues and Operational Expenditures “Delivered electricity” and “Received electricity”, describes the electricity produced minus electricity consumed either by the production plants themselves or by an actually electricity demand. “Received fuel” is the fuel imported to the energy units. User's Guide energyPRO The energyPRO desktop in details 119 The Next Group of items “Production unit” and the various Demands are used when a payments is added to the production of a specific Production unit or to a specific demand. “Fixed payment” is a possibility to create a payment which is independent of the energy conversion and the operation of the actual energy system. Note that the “price pr unit” in this case are interpreted as the total annual payment. You consequently have to type in the annual amount in this field. User defined payment: If you have selected “User defined” in “Payment concerns” you get access to edit the formula field. See also User defined payment selected in “payment concerns” Formula selecting monthly amounts: In this field a formula created by the selections in combo-boxes above are shown. The field is grey and inaccessible except when “User defined” is selected in the “Payment concern” combo-box. Note: If Spot market is selected in “Electricity Market” then choosing “Delivered electricity” in “Payment concerns” then energyPRO automatically suggests the formula that returns the value of the sold electricity. If you do not want that then uncheck the “Spot market payment” option. Figure 2.111: The value of electricity sold to electricity spot market Price per Unit: The price per unit is the price at the start date of the project. The unit label (e.g. (GBP/MWh) is automatically created when going through the unit selection, unless “User defined” is chosen in “Payment concerns”. In this case a unit label will be editable, see Figure 2.112, lower part. The content of that label do not influence the calculations and is for reports only. Figure 2.112: The unit price. Upper: Payment concerns are not “User defined”. Lower Payment concerns is “User defined” Using the drop-down box in right side of the “Price per Unit” box it is possible to choose between a “Fixed monthly price”, which is as shown in Figure 2.112, and “Variable monthly price”. When set to “Variable monthly price” the input window on the left will change to a drop-down 120 The energyPRO desktop in details www.emd.dk User's Guide energyPRO menu from where it is possible to choose the between the “Time series” and “Time series functions” in “External conditions” in the Data Input window. This is shown in Figure 2.113. Figure 2.113: Selection of time series as Price per Unit Include in operation strategy In the automatic operation strategy in energyPRO, as described in section 2.12, all the revenues and operation expenditures will be taken into account when automatically calculating the operation strategy. However you might want to not include some revenues or expenditures in this calculation. In order to exclude these from the automatic operation strategy you will need to deselect the “Payment included in operation strategy calculation”, as is shown in Figure 2.114. Figure 2.114: Include in operation strategy Development of unit price (FINANCE AND ACCOUNTS ONLY): There are three options for the development of the unit price. The “Increased with inflation” is the default setting. The two other options are “Constant” and “Following an Index” Figure 2.115: Development of unit price – thee options Increased with the inflation: The Inflation “index” selected in the “Economy - Main folder” editing window is used. The adjustment frequency is annual (see below) which means that the amounts are constant on annual basis. The amounts increase with the annual inflation primo the following calculation year. Constant: The price remains constant. Following an index: You select one of the indexes that you have created in external conditions. User's Guide energyPRO The energyPRO desktop in details 121 Figure 2.116: Index specification If “Annual” adjustment is selected, the price is constant on annual basis. The amounts increase with the selected index primo the following calculation year. If you select “Monthly”, the price will be adjusted at the beginning of every month. Payment, Advanced (FINANCE and ACCOUNTS ONLY) The advanced facility is used in situations, where payments are restricted to a specific period or displaced (delayed) from the month where they physically do occur. Figure 2.117: The payment advanced Panel Period: The period the payments are active. If the fields remain blank no period restrictions will be imposed. Payment delayed: A payment can be delayed from the month where it physically belongs. The options are: No delay, 1, 2, 3 and 6 months and not paid. Missing payment: If there is specified a delay for the payment, you can put in the amounts which are delayed from the year before the beginning of the planning period. The delayed amount will be divided equally into the first months (number of Payment delayed months) in the first year. User defined payment selected in “payment concerns” In the formula field, you can use standard functions such as Min, Max and Exp and you can use one of the special built-in functions listed below. The created formula will generate monthly amounts for each of the month in the year. You can access the available formulas by pressing . Formulas are added from the list by double clicking. All built-in functions concerning energy conversion return results in MWh or MW. If you want to use unit prices for fuels or demands in another unit, use the converting functions. Please note: If you are using “user defined” the payment unit you type in after the value for “Price per year in financial year” DO NOT influence the calculation at all. The unit is only used to give the user the possibility of having the unit typed on the printouts. The functions available for defining the payments are shown in the following three tables. In chapter 4 “Function in energyPRO” you find a detailed description of those functions. 122 The energyPRO desktop in details www.emd.dk User's Guide energyPRO Name Returns Unit AccDeliveredElectricity (Market,PriorityPeriod) Accumulated monthly amount for delivered electricity to market MWh AccReceivedElectricity (Market,PriorityPeriod) Accumulated monthly amount for received electricity from market MWh AccReceivedFuel(Fuel) Accumulated monthly amount of received fuel MWh DeliveredElectricity(Market, PriorityPeriod) Electricity delivered out of the system to market MWh/month PeakDeliveredElectricity (Market,PriorityPeriod) Monthly peak value for delivered electricity to market MW PeakReceivedElectricity (Market.PriorityPeriod) Monthly peak value for received electricity from market MW PeakReceivedFuel(Fuel) Monthly peak value for received fuel MW SpotPricesXDeliveredElectricity (Market) Monthly value of electricity delivered to the grid from market <currency used in time series> SpotPricesXRecievedElectricity (Market) Monthly Value of electricity received from the grid from market <currency used in time series> ReceivedElectricity(Market ,PriorityPeriod) Electricity received by the system MWh/month ReceivedFuel(Fuel) Fuel received by the system MWh/month Table 2.4: Functions measuring the energy passing the system border. Name Returns HP(eUnit) Heat production from eUnit MWh/month EP(eUnit,PriorityPeriod) Electricity production from eUnit in Period of priority MWh/month CP(eUnit) Cooling production from eUnit MWh/month FC(eUnit) Fuel consumption on eUnit MWh/month EC(eUnit,PriorityPeriod) Electricity consumption on eUnit in MWh/month Period of priority ElectricCapacity(eUnit) Electric Capacity for eUnit TurnOns(eUnit) Number of turn-on for eUnit HoursOfOperation(eUnit) Number of hours of operation for eUnit Table 2.5: Functions getting production information on production units. User's Guide energyPRO Unit The energyPRO desktop in details 123 MW Hours Name Returns HeatValue (Fuel) Unit Calorific value for the fuel MWh/unit UnitOfDemand(Demand) Calorific value for the demand (If the unit e.g. are GJ the function will return 0,2777777 MWh/GJ) MWh/unit Month(no) - Returns the number 1 for month no, 0 for others Figure 2.118: Other functions 2.16 Investment Investment is available FINANCE and ACOUNTS only The number of investments in a project is unlimited in energyPRO. Investments: An Investment can consist of one or more payments. The date specified indicates the month, where the investment takes place. All payments are booked primo month. Figure 2.119: Investment Depreciation The depreciations option is available in ACCOUNTS only 124 The energyPRO desktop in details www.emd.dk User's Guide energyPRO Figure 2.120: Depreciation of investments Type: There are three types of depreciation options available. Linear Saldo User defined The table showing the depreciations is updated automatically while changing data. If user defined is selected the depreciation column in the table will be accessible to input. Note that you can type in an amount, which is valid at the opening balance, which correspond to an existing asset. If the amounts left for depreciation is negative this corresponds to depreciation in advance and will be booked in the Balance Sheet as Reserves. Revaluation of assets: Figure 2.121: Revaluation of assets. 2.17 Financing Financing is available FINANCE and ACOUNTS only User's Guide energyPRO The energyPRO desktop in details 125 2.17.1 Financing – Main folder Cash Account Specify the annual interest for respectively positive and negative amounts. Hereto comes that it is possible to specify the content of the cash account at project start. Figure 2.122: Financing, cash account 2.17.2 Financing – Loans, Owners capital etc. The number of financing elements in a project is unlimited in energyPRO. Financing in an energyPRO project can take place by use of three basic elements: Loan, extraordinary income (e.g. a grant) or owner's capital. All these elements are added by selecting financing and add new financing. In all cases the same default editing window is shown, see Figure 2.123 126 The energyPRO desktop in details www.emd.dk User's Guide energyPRO Figure 2.123: Financing default editing window Description of financing Type: There are five financing options available. Three loan-types: Nominal Loan Foreign Loan Indexed Loan Hereto comes Owners Capital Extraordinary income Figure 2.124: Description of financing: types If “Foreign Loan” or “Index Loan” is selected an index is required. This mean that an index established under “External conditions” has to be in place. User's Guide energyPRO The energyPRO desktop in details 127 Figure 2.125: Description of financing: connect to index Amortization: There are three options available. “Annuity”, “Serial” and “User defined”. If “User defined” is chosen you get access to type in your own amounts for payments and Interest rate in the payment overview table at bottom of window. Figure 2.126: Description of financing: Amortization types. Indexing booked as financial expenses: This option does appear when “Indexed loan” is selected in an ACCOUNTS-project. Figure 2.127: Description of financing: Amortization type with indexing chosen. The Indexing can be booked in one of the following ways: As a financial expenditure in the Income Statement As a fixed asset in the Balance sheet and depreciated through the loan period As a mixture of the above possibilities The percentage stated indicates which of the possibilities you select. For instance 40 % means, that 40 % of the indexing amount will be booked as a financial expenditure in the Income Statement while the rest will be booked as a fixed asset in the Balance sheet and depreciated through the loan period. Disbursements: Disbursements are in calculations assumed to take place at the primo month. 128 The energyPRO desktop in details www.emd.dk User's Guide energyPRO Figure 2.128: Financing disbursements Fees: In this table it is possible to type in as many fees as wanted. Give every fee a describing name. Figure 2.129: Financing fee The fee can be paid along with disbursements or repayments. For a loan with only one disbursement, this will typically be a fee connected to the creation the loan. A fee paid at repayment could e.g. be a fee for administrating the loan. Payment overview This table is updated every time you alter one of the values above. The total payment consists of interest, fee and instalment. The interest percentage stated in this table is the interest percentage for the settled period for payment calculated by use of the annual rate stated. The remaining debt is calculated as the remaining debt after the last payment minus the instalment. If the loan type is “Foreign Loan” or “Index Loan” the remaining debt will be increased by the selected index before calculating interest and a new remaining debt. Figure 2.130: Financing overview table If user defined loan is chosen the three columns “Date”, “Total payment” and “Interest rate” will be accessible for input Figure 2.131. Figure 2.131: Financing overview table User defined loan User's Guide energyPRO The energyPRO desktop in details 129 Remark, it is possible to fill in a beginning remaining debt in the table. 2.18 Taxation You can add one or more taxations to a project just as with investments or financing. You can e.g. build up taxation, which consists of among other a tax payment to the state and a tax payment to the county. Tax is assumed to be paid once a year in a given month in the following fiscal year. Tax payment is reduced by Loss Carried Forward In this standard situation, you can turn into account the loss from a number of previous years. Specify the tax rate and the number of years from which you can utilize eventual losses. Figure 2.132: Taxation. Loss carried forward Remark the window “Tax formula” in which you can see the actual formula corresponding to the specified data. The window is grey and inaccessible until you eventually select “User defined”. Tax payment is User Defined: If you have selected “User defined” in the window “Tax payment” you get access to the formula window. 130 The energyPRO desktop in details www.emd.dk User's Guide energyPRO Figure 2.133: Taxation User defined. In the formula, you can use standard expressions and functions as Min, Max and Exp etc. In addition, you can use one of the special built-in functions listed below. Name Returns ResultBeforeTax The result of the actual fiscal year before tax LossCarriedForward(n) The last n years loss reduced with eventually profits from the fiscal years Increment(amount;n1;n2) This function increments from zero with the value “amount” from fiscal year n1 to n2. Example : Increment(10;2;4) gives the result Fiscal year 1 : Fiscal year 2 : Fiscal year 3 : Fiscal year 4 : Fiscal year 5 : Year(n) 0 10 20 30 30 1 in the fiscal year n, 0 otherwise Example : Year(1)+Year(2) returns 1 in first and second fiscal year, 0 otherwise Table 2.6: Taxation functions available for user-defined formulas. Examples: Example 1: Loss carried forward: Standard situation with 30 % tax and the right to make use of losses from the three previous years: Formula=30.0/100*Max(ResultBeforeTaxLossCarriedForward(3);0) Example 2: If the company is a department of a larger company, the larger company can use a negative result from the department to reduce the tax. In this case, the tax will be paid into the department in years with negative result. Formula= 0.25*ResultBeforeTax User's Guide energyPRO The energyPRO desktop in details 131 Example 3: The tax percentage starts with 30.0 and increase with 1 from the second fiscal year and over the next 4 years: Formula=(30.0+Increment(1.0;2;5))/100*Max(ResultBeforeTax;0) Example 4: The project is tax-free the first two years and hereafter the tax percentage is 30 %: Formula=(Increment(30;3;3))/100*Max(ResultBeforeTax;0) 2.19 Reports 2.19.1 Introduction There are a number of financial and technical reports available in energyPRO. The actual available reports are depending on which energyPRO module, that is selected, the types of energy demands in the project and the selected operation strategy. The reports are context sensitive, which primarily means that irrelevant information is excluded. For instance information about thermal stores are not shown if there are no thermal stores in the project and the report “Duration curve for cooling demand” is not available if no cooling demand is present. The available reports in energyPRO with the ACCOUNTS module chosen are shown in Figure 2.134. *) *) *) *) **) **) **) **) ***) Figure 2.134: The Reports available in energyPRO (ACCOUNTS module chosen) *) Reports are available in FINANCE and ACCOUNTS **) Reports are available in ACCOUNTS only. ***) Operation Strategy Calculation is available only if the operation strategy selected as auto calculated in “Operation strategy”. 132 The energyPRO desktop in details www.emd.dk User's Guide energyPRO Hereto come that the duration curves are only shown if the specific demand type is present in the project The technical reports are represented with yellow folders and the technical with blue folders. Report Header information Common for all the reports are the report header. The information found in these headers is shown in Figure 2.135. The following numbers are referring to the figure. 1. The name of your project file (extension excluded) 2. Project Information given in the Project Identification editing window 3. The name of the report 4. Date and time for report generation 5. Your registration information 6. Your company logo, if chosen as described in section 2.2.1 1. 2. 4. 5. 6. 3. Figure 2.135: Header information in reports 2.19.2 Reports to Clipboard All the reports can be copied to clipboard as graphic by entering a button that copies the report to the clipboard. Most of the reports have also a data export button. If this button is selected the data is copied to the clipboard ready for copying into a spread sheet for instance Excel. Copy to clipboard as data Copy to clipboard as graphic Figure 2.136: It is possible to copy reports to clipboard either as data or as graphics. 2.19.3 Production, Graphical This graphs included in this report depend on the content of your project. The graphs are as follows User's Guide energyPRO The energyPRO desktop in details 133 External conditions. Priorities of the individual production units. Heat production (if Heat production) Electricity Production (if Electricity production) Cooling Production (if cooling production) Fuel storage (if fuel storage is used) Thermal storage (if a Thermal store is used) The report shown in Figure 2.137 shows the production of a CHP-plant in a week in April. The report is invoked by pressing the button. This hereafter the report will be shown. Some reports require selections in a simple setup window before being shown. Figure 2.137: Productions graphical report 134 The energyPRO desktop in details www.emd.dk User's Guide energyPRO The upper graph shows the priorities, which are used for optimizing, the next shows the heat production, the third the electricity production. Finally the last shows the development in the content of the thermal store. 2.19.4 Energy conversion annual This report shows the energy conversion on annual basis. The content of the report is: Demands Productions Transmissions Losses Hours of operations Number of Turn-on Fuel consumptions If “fixed tariffs” is defined in “Electricity marked” the electricity production will be distributed in the defined tariff periods. Figure 2.138: Energy Conversion, Annual report User's Guide energyPRO The energyPRO desktop in details 135 2.19.5 Energy Conversion, monthly This report includes the same information as the “Energy conversion, annual” report, although the structure is a bit different and it includes monthly values for the energy conversion. Where the annual report is structure is organized by demands and productions is this report structured after Production units and fuels. Figure 2.139: Energy conversion, Monthly report 2.19.6 Energy Conversion, summary This report is available if the FINANCE or the ACCOUNT module is chosen. This report is structured as the “Energy conversion, monthly” report, with the difference that the values monthly instead of annual values. 136 The energyPRO desktop in details www.emd.dk User's Guide energyPRO Figure 2.140: Energy conversion, summary 2.19.7 Duration curves for Demands There are demands curves available for the types of demand defined in the project. Figure 2.141 show an example of a duration curve for heat demand. To the left is shown the duration curve. To the right is the productions shown. The watchful observer will notice that the productions do not hour by hour match the demands. The reason is that a thermal store is displacing productions in order to operate the plant more efficiently. The report is invoked by pressing the User's Guide energyPRO The energyPRO desktop in details 137 button Figure 2.141: Duration curve for heat demand (left). Demand curve for heat demand with productions included (right) 2.19.8 Environment The environment report is based on the information you defined in your environment input data folder. Figure 2.142: Environment report 2.19.9 Economy Reports introduction The available reports are module-dependent. As shown in Figure 2.143 there are two reports concerning economy available in all modules, “Cash flow, Monthly”, and “Catalogue of economical Assumptions”. If the FINANCE-module is chosen additional three reports are optional. This is “Cash flow, summary”, “Cash flow, Graphical” and “financial keynumbers”. Finally, further four reports are optional if the ACCOUNTSmodule is chosen. This is “Income Statement”, “Income Statement, Summary”, “Balance Sheet” and “Balance Sheet, Summary” 138 The energyPRO desktop in details www.emd.dk User's Guide energyPRO *) *) *) **) **) **) **) Figure 2.143: Reports financial When previewing the economy reports you have some setup options: Figure 2.144: Economy report design window The first option is to state if you will see all the payments, you defined in your economy input data folders or only those visible in the input data folder structure. The second option is to set up the amount used in the reports. If the “Visible payments in the input data folder structure” is set the report will be different in the two cases shown in Figure 2.145. The project economy is the same but some of the folders are collapsed to the right, and the report will be more aggregated for instance having only one line for “sale of electricity”, while the one to the left are showing the electricity sale in day and night tariffs. User's Guide energyPRO The energyPRO desktop in details 139 Figure 2.145: Designing economy reports using the economy input data folder structure as organizer. Require that the “visible in the input data folder structure”- option is set 2.19.10 Operation income This report is available in DESIGN only. It includes all operational payments, i.e. revenues and operating expenditures. Figure 2.146: Operation income report. 2.19.11 Cash flow, monthly The cash flow, monthly report includes all payments in a project in the month that the payments actual take place. The payments include 140 The energyPRO desktop in details Operational payments o Revenues o Operating expenditures Investments www.emd.dk User's Guide energyPRO Financial payments Eventually tax payments Interest on cash account Figure 2.147: Cash flow monthly report Cash flow summary The cash flow, monthly report includes all payments in a project in the year that the payments actual take place. Include the same items as the cash flow monthly report. The only difference is that the columns are annual numbers instead of monthly 2.19.12 Cash flow, graphical This report is invoked by pressing the button This report shows the development in the cash flow shown graphically. In the example shown in Figure 2.148 shows that the cash account exceeds the debt early 2020 and thereby has an expected payback time of about eight years. The downward going line represents the remaining debt and the upward going line shows the cash account User's Guide energyPRO The energyPRO desktop in details 141 Figure 2.148: Cash flow graphics report 2.19.13 Financial key figures This report states the key financial figures used, as shown in Figure 2.149. Figure 2.149: Financial key figures report 2.19.14 Income statement The Income statement report for the energy company shows the result of the year for the company after depreciations and taxations. 142 The energyPRO desktop in details www.emd.dk User's Guide energyPRO Figure 2.150: Income statement report 2.19.15 Income Statement, summary The Income statement, summary report includes the balance sheet for all years in the planning period. Figure 2.151: Income statement report User's Guide energyPRO The energyPRO desktop in details 143 2.19.16 Balance sheet The last financial report is the balance sheets Figure 2.152: Balance sheet report example 2.19.17 Balance sheet, summary The balance sheet, summary report includes the balance sheet for all years in the planning period. 2.19.18 Catalogue of technical assumptions This catalogue includes most of the technical data in the technical input data folders. The exception is that the time series are only represented by monthly min max and average values. The structure of the catalogue follows the input data folder structure. 2.19.19 Catalogue of economical assumptions This catalogue includes most of the financial data in the economy input data folders. The structure of the catalogue follows the input data folder structure. Formulas used for defining payments are placed in an appendix in the catalogue. 2.19.20 Operation Strategy Calculation This report shows the calculation of the operation strategy in details. The report is invoked by clicking the Operations Strategy Calculation folder in the Reports tree view, shown in Figure 2.153. 144 The energyPRO desktop in details www.emd.dk User's Guide energyPRO Figure 2.153: Selecting Operation Strategy Calculation In the preview, choose the month to be shown (Figure 2.154). Figure 2.154: Selecting a month for the Report Hereafter a report will appear. The report layout is depending on the selected operation strategy. Figure 2.155 show an example based on fixed tariffs, while Figure 2.156 show an example based on spot market optimization. Fixed tariffs The report starts with a main table containing the calculated Operation Strategy. The value in this table is identical with the values found in the “Operation Strategy” editing window. Hereafter follows tables with detailed calculation results for each production unit. Each table contain the calculation of the net heat production costs in all tariff periods. Note that payments that are identical for all productions units in all tariff periods are excluded. This could for instance be a fixed payment not related to the energy conversion. User's Guide energyPRO The energyPRO desktop in details 145 Figure 2.155: Operation strategy calculation an fixed tariff example 146 The energyPRO desktop in details www.emd.dk User's Guide energyPRO Spot prices The first page contains the graphic representation of the net heat production costs as function of the electricity spot prices (Figure 2.156, upper). Hereafter follows one page per energy unit, where the net heat production costs are calculated for all production units (Figure 2.156 lower). Figure 2.156: Operation strategy calculation a spot market example (Upper: Graphical presentation) User's Guide energyPRO The energyPRO desktop in details 147 2.20 Tools 2.20.1 Introduction At present two tools are available. The first is a tool for generating a time series of ambient temperatures and the second tool is a tool for copying energy calculation to the clipboard. The Tools menu is shown in Figure 2.157. Figure 2.157: The Tools menu 2.20.2 Generate ambient temperatures This tool is only expected be used in situations, where time series of ambient temperatures are not available. Generate ambient temperatures is a supplementary tool used for the creation of time series of ambient temperatures. It is a tool for distributing the monthly mean temperatures into a time series so they are useable for the project. Ambient temperatures are e.g. used for distributing an annual heat demand to each day of the year. In a project, you will normally use weather data for an average year. You can use earlier saved sets of Ambient Temperatures as a starting point, when you are editing data. Right click on the window or use the load button. The imported data are showed in the window and can now be edited. Figure 2.158: Generate ambient temperatures 148 The energyPRO desktop in details www.emd.dk User's Guide energyPRO Remember to specify the symbol. It is important for identifying the time series. If you want to save monthly data again you right click and select Save or use the save button. Specify an expressive name of the file. Choose “Generate temperatures”-button to generate the time series to use in the project. In your project, you can choose to load the time series 2.20.3 Copy energy conversion to Clipboard By choosing “Tools” and ”Copy energy conversion to Clipboard” in the main menu, it is possible to copy data from the energy conversion results of a project to the clipboard, and then pasting the results into a spread sheet. There are two categories of export, see the figure below. The first category “As time series” is structured in columns each containing a part of the energy conversion for a production unit or eventually a demand. Each row contains the energy conversion for a specific period. The second option is an output structured as the report “Energy conversion, monthly”. Figure 2.159: Export to Clipboard window As time series If “As time series” is chosen the available resolution options will depend on the actual used energyPRO module. User's Guide energyPRO DESIGN FINANCE ACCOUNT OPERATION Monthly Monthly/Yearly Monthly/Yearly Hourly/Daily The energyPRO desktop in details 149 Figure 2.160: Example of data with monthly resolution pasted to the clipboard and then into Microsoft Excel As Report “Energy Conversion, monthly” If this option is chosen the data for, export to clipboard is structured as the report “Energy conversion, monthly”. If the FINANCE or ACCOUNTS module is chosen it is optional to choose between monthly and yearly data resolution. The option is not available if the OPERATION module is chosen. DESIGN FINANCE ACCOUNT OPERATION Monthly Monthly/Yearly Monthly/Yearly Not available Figure 2.161: Example of data organised as report “Energy conversion, monthly” pasted to a Microsoft Excel spread sheet via the clipboard. 150 The energyPRO desktop in details www.emd.dk User's Guide energyPRO 3 Method of calculation in energyPRO 3.1 Method of energy calculation in energyPRO This chapter describes how energyPRO calculates optimal fuel consumptions, heat productions, electricity productions, electricity consumptions and cooling productions from production units situated in local energy plants. 3.1.1 The optimisation problem energyPRO is a powerful tool in which you can model complicated energy systems, consisting of an unlimited number of demands and energy units. The model of the energy system and the applied operation strategy (user defined or auto calculated) determines the productions and consumptions of the production units. energyPRO helps making the productions optimal, for instance by easy accessible ways of changing the modelled energy system and operation strategy. The performance of sensitivity analyses is easily done by use of energyPRO. It is important to keep in mind that optimising a local energy plant often is a complex task. Normally, the demand for electricity is high in the morning and in the afternoon, lower during the rest of the day and lowest during night time, weekends and holidays. Reflecting on this, the prices paid for the produced or consumed electricity may vary significantly with the time of the day. On the other hand, a heat demand is normally low during summers and many times higher during winters, and a cooling demand will normally be higher in the summer periods and lower in the winter periods. A thermal store or cooling storage is one way of solving this mismatch between the need for electricity and heat/cooling. Another way to add flexibility is to add heat blow-off capacity allowing electricity producing energy units to be used more flexible. Another complexity is that fuel, e.g. biogas, can be restricted in amount and eventually stored in a fuel-storage. A CHP unit might for instance be User's Guide energyPRO Method of calculation in energyPRO 151 able to use two types of fuel e.g. biogas and natural gas, where the biogas is restricted in amount and can be stored in a biogas-storage and the heat can be stored in a thermal store. An energy unit might be operated with or without an economizer. Another complexity can be that the electricity productions are restricted to a certain demand for electricity e.g. the electricity demand in a town. Furthermore, electricity consuming heat pumps increases the complexity of energy system calculations. energyPRO makes it possible to analyse optimal solutions, taking into account all the above-mentioned factors. Figure 3.1: In this figure heat productions and thermal store in a week in May. In the shown example it is assumed, that the demand for electricity is highest in the daytime (high tariff). During night time, in the weekends and on official holidays the demand is reduced even further (low tariff) The price structure for the electrical production reflects this variation, and hence the priority number (Net Production Cost) in the top graph are lower for the CHPs in the day time compared with the night time and weekend. The heating demand is low during the summer and much higher during the winter. A thermal store is used to solve the temporal displacement between the demands for electricity and the demand for heating. 3.1.2 Time series is a fundamental object in energyPRO Project information about has to be available and the energy system has to be modelled, before energyPRO starts calculating optimal energy productions. Directly and indirectly time series are playing is a core 152 Method of calculation in energyPRO www.emd.dk User's Guide energyPRO object in all energyPRO models. This could be weather data, demands, electricity prices, results etc. Figure 3.2: A time series consists of a symbol, a unit and a set of points consisting of Date, Time and Values When you have made a new time series, this time series is available both to model the variation of demands, to influence the power curves of production units and to describe electricity prices on the spot market. During an energyPRO calculation the calculation period is split in to fixed calculation steps where everything is constant. The size of this step is controlled in the Project Identification. If your time series do not match the specified calculation step energyPRO will calculate mean values or closest values for a given calculation step. energyPRO automatically extends your time series If you have described in an energyPRO-model, that demands or production units depends on some external condition (e.g. ambient temperature), energyPRO needs to know for the complete planning period, the values of this external condition. The hard way of doing this is to create your own time series for the complete period. This will normally be inconvenient and unnecessary. Often you have access to information for a period of one year, which you want to extend to the whole planning period - this will automatically be done within the energyPRO calculation. The extension is based on the following principles. User's Guide energyPRO Method of calculation in energyPRO 153 Within one specific year: A time series is well defined between the first time (start time) and the last time (end time). Outside start time and end time, the value is identical with the value at the end time. From one year to another year. The time series are weekly based. This means that Monday in week 2 will adopt the values from Monday in week 2 in the nearest year, etc. energyPRO follows the ISO week date system, where each week begins on a Monday. There are special conditions around New Year. If a given weekday in week 1 in the planning period is not present in the time series, the value for the weekday in week 2 is used. If a given weekday in week 52 in the planning period is not present in the time series, the value for the weekday in week 1 is used. If Monday to Tuesday in week 53 in the planning period is not present in the time series, the value for the weekday in week 52 is used. Finally, if Friday to Sunday in week 53 in the planning period is not present in the time series, the value for the weekday in week 1 is used. The main reason for making the time series weekly based is that some variation described in time series often varies systematically within a week. E.g. electricity demands in weekdays are often significantly different from electricity demands in weekends. Demands are also time series In energyPRO, it is not obvious, that demands are time series, identical to time series for external conditions. That is because you get a lot of help to model the variation of a demand. But if you convert this demand to time series it become obvious, that a time series for a demand is exactly identical to time series for external conditions, also being available by formula expressions to influence the power of production units. 154 Method of calculation in energyPRO www.emd.dk User's Guide energyPRO Figure 3.3: Time series for demands are identical to time series for external conditions. Modelling variation of demands with use of a fixed profile of demand It is possible to state that a demand has to follow a fixed profile of demand. See the bottom table in the editing window on Figure 3.3. If a fixed profile of demand is chosen, daily or weekly, then the demand time series created so far will be modified. The main principle is that the demand on daily (or weekly) basis will remain unchanged, but the distribution within the 24 hours a day (or week) will be redistributed so it follows the stated fixed profile of demand. 3.1.3 Splitting up the planning period (fixed tariffs) Splitting into time periods The period of optimising is divided into time periods, where everything is constant, e.g. ambient temperature, solar radiation, priorities, heat demand, electricity demand, cooling demand, production capacities, fuel deliveries etc. Group time periods for optimization In “Electricity markets”, the time periods can be divided into groups. Such a division is often convenient if electricity prices vary systematically. Each group is labelled by a “Priority name”. In the figure below, there are three priority names. “Peak Load”, “High Load” and “Low Load”. The grouping of the periods is specified by mean of the lower table. The example will divide a year into hundreds of time periods during a year. User's Guide energyPRO Method of calculation in energyPRO 155 Figure 3.4: An example of how to group thousands of time periods into three groups, Peak load, High load and Low load. This information is used when the operation strategy is designed. 3.1.4 Energy conversion units There are two sorts of energy conversion units. The options are a production unit and a heat blow-off unit Production unit Regarding the energy conversion calculations the production units contains the definition of the power curves and eventually some time restrictions. A production unit is described by a set of power curves, which varies for different types of production units. The optional curves are: 156 Method of calculation in energyPRO Fuel consumption, Fuel production, Heat production Process heat production Heat consumption Process heat consumption Electricity production Electricity consumption Cooling production and Fuel production. www.emd.dk User's Guide energyPRO Figure 3.5: Example of description of a production unit, here a standard CHP unit with three power curves: Fuel (consumption), Heat (production) and electricity (production) The power curves are described by one or more lines which together define a set of continuous curves. All numbers in a specific line has to be less or equal to the equivalent value in the line above. The upper line states maximum load, while the lower curve states the minimum load. The power curves might vary from one time period to the next (the power curves might be a function of external conditions, for instance the return temperature of district heating water or the ambient temperature. If the power curves are described by only one line it implies that there is automatically assumed added an extra line containing only zeroes, describing the minimum load (if part load is allowed in the operation strategy). It is also possible to state that the production on a specified production unit depends on other units this can be done either by checking “Operations dependent on other unit” or checking “Enable formulas in power curves” and then using the PaP-functions in the power curves. Heat rejection unit A heat rejection unit is described by a constant heat rejection capacity all year. In the Operation strategy you have to state, which production units have access to the heat rejection unit. 3.1.5 Thermal storage and cold storage A thermal storage and cold storage is in each time period defined by a maximum content measured in MWh of either heating or cooling. In the Operation strategy, you have to state, which production units have access to these storages. User's Guide energyPRO Method of calculation in energyPRO 157 3.1.6 The Operation strategy (example with Fixed tariffs – User defined) The operation strategy consists of two main tabs (three or four if the model contains both a heating demand and a cooling demand and/or fuel producing units). These are “Heat (or cooling, or Fuel) Production Strategy” (or “Net Heat/Cooling Production Cost” when automatic operation strategy are chosen) and “Energy Unit Setup”. These main tabs are shown with only a heating demand and using with Fixed tariff in Figure 3.6 and Figure 3.7. Figure 3.6: An example where the Operation strategy is used for controlling the priority of production between two engines and a boiler. Figure 3.7: “Energy Unit Setup” tab for the same example as in Figure 3.6 158 Method of calculation in energyPRO www.emd.dk User's Guide energyPRO Priorities of productions section In the “Priority of productions” table in the “Production Strategy” tab you find a matrix consisting of Priority periods specified in the “Electricity markets” editing window in the column dimension and the defined production units in the row dimension. In Figure 3.6 it is seen that the production from the two gas engines are prioritised in the rank “Day” indicated by increasing numbers. Furthermore it is seen that, Gas engine 1 is prioritised before Gas engine 2, within the respective period of priority. In the example, the boilers are always prioritised after the engines, and are only allowed to produce if the engines are not able to produce all need heat in the “Day” tariff. Given the matrix in Figure 3.6 energyPRO now first calculates Gas engine 1 in Day and then Gas engine 2 in Day. Finally Existing boilers take the residual productions. Note that if no number is attached to an element in Priority of Productions table the production unit will not operate in that specific priority period. Heat rejection allowed In the “Heat rejection allowed” table in the “Energy Unit Setup” tab you can define which energy conversion units are allowed to reject heat, if the heat cannot be utilized or stored. This table is only shown if a “Heat rejection” has been added. Miscellaneous In this section of the “Energy Unit Setup” tab is specified another matrix, horizontally consisting of some options and vertically of the defined production units. The options are: Production to store allowed (only if a thermal or cold store is defined) Production transmitted to other sites (only if there are more sites in the project) Partial load allowed Selection of electricity market 3.1.7 Calculating a time period under restrictions A usual method of calculating energy productions would be making a chronological hour for hour calculation, taking into account, that e.g. producing in the night might fill the thermal store too early, prohibiting more attractive productions to be placed the day after in the morning. To secure productions in the most favourable periods, energyPRO does it the opposite way. It starts producing in the most favourable periods, not doing it chronologically. This has the consequence that each new production has to be carefully checked to make sure it does not disturb already planned productions, before being accepted. User's Guide energyPRO Method of calculation in energyPRO 159 The year is divided into a fixed number of time periods (depending on the calculation step), which all are tested for possible productions. In this section it is described, how optimal production from a production unit is planned in one time period and it is described how a sufficient derating (reduced load) is determined. As a starting point, an attempt is made to keep the production unit running by sufficient derating the load of the production unit in the whole time period in order to reduce the number of starts. The ability to derate the load might be limited for two reasons. The first reason being that if partial load is not allowed (miscellaneous section in Operation strategy). The second reason is the possibility that a minimum load appears on the power curve(s). Taking into account dependency on another production unit It is possible to state, that production of a unit is only allowed, if no production is planned on another production unit. If there in a certain time period already is planned production on the specified unit, no production will be made on the second unit. Opposite to this, it is possible to state, that production is only allowed, if production on a second unit is already planned. If there in a certain time period is planned production on a second specified production unit, the load of the considered unit is limited to the load on the second unit. Production may be limited to electricity demand In the Operation strategy it is possible to state that the project should run in Island Operation mode with no exchange to the electricity market. In this case electricity production must be limited to the electricity demands. The allowed electricity production is calculated by taking the electricity demand then adding the electricity consumption from higher prioritised production units and finally subtracting the electricity production from higher prioritised production units. The considered production unit is derated, so that it does not exceed the allowed electricity production. Limitation in heat and cooling production It is controlled, that the derating of a production unit is sufficient, so that already planned future productions are not disturbed. That is to say that the thermal or cooling storages are not overfilled in the future due to the heat or cooling production in the considered time period. If production to thermal or cooling storage is not allowed of a specified unit in the Operation strategy, the heat or cooling production from that production unit must not change the planned use of the thermal or cooling store. If you in the Operation strategy has chosen, that the production unit have no access to a heat rejection unit (cooling tower), the heat 160 Method of calculation in energyPRO www.emd.dk User's Guide energyPRO production from the production unit must not change the planned use of the heat rejection unit in the future. Limitation in fuel consumption It is controlled, that the derating of a production unit is sufficient, so that already planned future productions are not disturbed. That is to say that there is sufficient fuel in the fuel storage in the future for already planned productions. If it is possible to reduce load, so that the above-mentioned limitations are met, a new planned production has been found and accepted. 3.1.8 Planning of new productions follows Operation strategy The Operation strategy is where to choose the superior priority of productions. Priority numbers states the order of productions. The units are calculated by increasing numbers. I.e. the unit with the lowest number is calculated first. All possible production on a unit is fully obtained before production with the next unit (with the next priority number) is examined and calculated. Reducing number of starts Given the above priority information there will be a lot of time periods with the same priority and these could simply be started chronologically which would give a ”correct” result with regards to energy conversion. However, we have experienced that the chronological approach produces too many starts which is not desirable since most production units will have some kind of start cost. Reducing starts by giving priority to expansion before new starts If at a given time during an optimization there is both the possibility to expand an already started block and start a new block with the same priority we will always select the expansion before starting a new block. This is of course only the case if the expansion can be done under all the restrictions mentioned in 3.1.7. Reducing starts by adding start costs In the payment lines for a production unit it is possible to add a start cost for each time the unit is started. If such a start cost is defined it will influence the priority of that unit during the optimization. The start cost is simply added to the priority of that unit and thereby making it even more undesirable to start that unit compared to expanding the unit in already started blocks. As an example consider the scenario during an optimization where we can either expand a block at priority 56 or start a new block at priority 45 (without start cost added). Without start costs we would simply start the new block and thereby might generate unnecessary starts. If we User's Guide energyPRO Method of calculation in energyPRO 161 then have a start cost of 20 the new priority for starting up would be 45+20 and hence we now prefer to expand at priority 56 instead. Reducing starts by merging already started blocks Now that start costs can prevent us from starting new blocks we can also consider the other scenario where we want to merge two blocks in order to remove one of the starts. During the optimization we will continuously look at whether 2 blocks can be merged to remove a start. The time periods in between the blocks might not have a good enough priority from the operation strategy to be started, but given the fact that we will remove a start we now reduce their priorities according to the removed start cost. Reducing starts by looking for empty heat or cold storage Even with the start cost considerations there will still be situations where we see too many starts because a production unit keeps starting up every time it “sees” that there is room for it in the heat or cold storage. To prevent these starts we will always delay a start until the heat or cold storage is empty as long as the priority is the same in the next calculation step. This ensures that when the unit is started it can keep running for as long as possible (it could still be restricted by other things). Reducing starts by looking for full fuel storage In the same way a unit could keep starting for a short while whenever there is enough for it to run in the fuel storage. So in this case we will delay the start until the fuel storage is full (again given the next calculation step has the same priority). This gives the unit the longest start block without being restricted by the fuel input. 3.1.9 An example of planning optimal productions in energyPRO The aim with this section is to give an understanding of how productions are calculated in energyPRO and thereby giving you ideas on how to create optimal productions. This introduction is based on a week in April. First, the final planned production for the week will be presented. Hereafter it is shown how the production is constructed by adding priority numbers in the Operation strategy one by one. The principle described in this section is the same regardless of the selected electricity market and whether the Operation strategy is user defined or auto calculated. Planned production In Figure 3.8 is shown a graphic representation of an example with three energy conversion units. These units are two gas engines and a boiler. Furthermore a thermal store has been added. The example has an electricity tariff with three levels attached. 162 Method of calculation in energyPRO www.emd.dk User's Guide energyPRO Figure 3.8: Graphic representation of energy production, a week in April-May We see that the CHP shuts down in the nights, because productions in Low load have low priority. Hereto comes an active use of the thermal store. Figure 3.9: Operation strategy for energy production Priority of productions. We see that the engines are always prioritised before boilers. For the engines, we see that production in peak load hours is always prioritised before high load, which again are prioritised before low load. Finally, that Gas engine 1 is prioritised before gas engine 2 within the same priority of production (for instance peak load). Miscellaneous: The two engines are allowed to produce to the storage, the boiler are not. Partial load are only allowed on the boilers. The Periods of priority in the considered week are shown in Figure 3.10. As seen, there are three levels. The lower level in the graph is Low load, the middle level is High load and the highest level is Peak load. The weekdays Monday to Friday is low load from 0.00 to 6.00 am, high load User's Guide energyPRO Method of calculation in energyPRO 163 until 8.00, then peak load until 12.00, then high load until 20.00 and finally low load until 00.00. Saturday and Sunday is low load all day. Figure 3.10: Electricity Market – Tariffs shown as graphics Planning production step by step (priority by priority) In the following, the above shown example is elaborated by adding priority numbers one by one and the result after adding this will be presented graphically and briefly discussed. Adding Priority 1 - Gas engine 1 in peak load Figure 3.11: Priority 1 chosen Figure 3.12 shows that the heat production from “Gas engine 1” in the five peak load periods, in this week, is well below the demand curve. In other words, the productions are filled in without any sort of restriction or use of the thermal storage. 164 Method of calculation in energyPRO www.emd.dk User's Guide energyPRO Figure 3.12: Graphic representation of energy production priority 1. Adding 2 priority: Gas engine 2 in peak load Figure 3.13: Gas engine 2 in peak load. Priority 2 included Now the heat production from the two gas engines is not always below the heat demand curve. The graphic representation of the content in the thermal store shows that the energy plant is starting to utilize the store in order to secure the production in peak load hours. The storage is here emptied well before the next peak load period occurs. User's Guide energyPRO Method of calculation in energyPRO 165 Figure 3.14: Energy production graphic. Priority 2 included Adding priority 3: Gas engine 1 in high load hours Figure 3.15: Gas engine 1 in high load, Priority 3 included After having included the third priority, Gas engine 1 in high load hours, the production is still not restricted. The use of the thermal store is increasing. 166 Method of calculation in energyPRO www.emd.dk User's Guide energyPRO Figure 3.16: Energy production graphic. Priority 3 included Adding priority 4: Gas engine 2 in high load Figure 3.17: Gas engine 2 in high load. Priority 4 Including the fourth priority “Gas engine 2” in high load hours, there are room for the production without restrictions. We can now conclude that in the actual week it is possible to run the engines in as well all peak load hours as all high load hours and still utilize the produced heat. This is achieved by using the thermal store. User's Guide energyPRO Method of calculation in energyPRO 167 Figure 3.18: Energy production graphic. Priority 4 included Adding Priority 5: Gas engine 1 in low load Figure 3.19: Gas engine 1 in low load. Priority 5 After having included priority 5, “Gas engine 1” in low load hours, it is no longer possible to run the energy plant without restrictions. As seen there are now two periods (in the low load hours), where there are no production on the engines. The use of the thermal store is still increasing. 168 Method of calculation in energyPRO www.emd.dk User's Guide energyPRO Figure 3.20: Energy production graphic. Priority 5 included Adding priority 6: Gas engine 2 in low load Figure 3.21: Gas engine 2 in low load. Priority 6 included The use of “Gas engine 2” in low load hours has priority 6. The result of enabling that priority is that production is established in the first two low load periods, while there are room for the production the two first, but not in the last three. Looking at the development of the content in the thermal store it can be seen that the content builds up in the wellpaid peak and high load hours, so it can be drained in the “poorly”-paid low load hours. User's Guide energyPRO Method of calculation in energyPRO 169 Figure 3.22: Energy production graphic, priority 6 included The inclusion of priority 7 for the boilers in all periods will not result in any production changes in this week because all needed production can be established on the two engines. With the chosen Operation strategy, the boilers will only be active during wintertime with high heat demands, or when engines are out for revision. 170 Method of calculation in energyPRO www.emd.dk User's Guide energyPRO 3.2 Method of economy calculation in energyPRO In this chapter is described, how energyPRO calculates the economy in a project. It is important to remember, that economy in energyPRO basically is monthly based, and that it is possible for you to model exactly the size of each monthly payment in all month of the Planning period, e.g. 30 years (equal to 360 month). Figure 3.23: An example of monthly payments, all being defined by you, to be seen in the report Cash flow, Monthly. 3.2.1 energyPRO calculates nominal payments Please notice that the monthly payments defined in energyPRO is your best guess about the payments taking place in all months in the Planning period. It is not payments converted to the value of the payment in a specific year (it is not fixed prices). Figure 3.24: You are on a monthly basis able to follow how payments in and out of cash account are accumulated. User's Guide energyPRO Method of calculation in energyPRO 171 3.2.2 Net present value calculation Nominal discount rate is given on a yearly basis, e.g. 7,0 % per year. But in the Net present value calculation every monthly payment are brought back to Present (start of the Planning period) on a monthly basis. Therefore the yearly discount factor (e.g. 1,07) is converted to a monthly discount factor (e.g. the yearly 1,07 is converted to the monthly 1,005654), being used for bringing back payments to Present. You are able to see the Net present value of the payments only belonging to the Financing, as a sub balance. Figure 3.25: Internal rate of Return, Net present value and Annual Key Figures is to be found in the report Financial Key Figures. 3.2.3 Internal rate of return What Does Internal Rate Of Return - IRR Mean? The IRR is the discount rate that makes the net present value of all cash flows from a particular project equal to zero. Generally speaking, the higher a project's internal rate of return, the more desirable it is to undertake the project. As such, IRR can be used to rank considered projects. Assuming all other factors are equal among the considered projects, the project with the highest IRR would probably be considered the best. How is the IRR found The IRR is found by iterations using Newton’s method. The series of payments must contain at least one negative value (investment) and one positive value (income) to calculate the IRR. 172 Method of calculation in energyPRO www.emd.dk User's Guide energyPRO To promote that the IRR is found and is determined unambiguous the series of payments must start with an investment followed by payments all positive. If the created time series contain more negative values than the initial investment, there might be more solutions causing the IRR to be ambiguous. Another problem might be that the iteration routine finding the IRR will not converge. In that case a message in the “Financial key figures”-report will tell that the IRR is “Not found”. There will be cases, where the time series start with a positive value (income) before the investments will cause the iteration routine finding the IRR will not to converge. The monthly-based IRR might show the most correct IRR while the annual based IRR in some cases will be more robust. In the annual case, some months with negative values might be eliminated when summed up annually. NOTICE that energyPRO calculates the actual cash flows in the planning periods, and not cash flows expressed in the price level of a certain year. That is to say, that energyPRO calculates the Nominal IRR, whereas you in a spread sheet often calculate Real IRR, expressed in the first year price level. The difference between the Nominal and the Real IRR is in practice equal to the average inflation in the planning period. 3.2.4 Payback time energyPRO only offer you one Pay Back Time. This Pay Back Time is defined as the month, in which you are able to pay back your loans (the month in which the money in the cash account equals remaining debts in the loans). Figure 3.26: The Pay Back Time is defined as the month, in which you are able to pay back your loans. The warning about Internal rate of return is also relevant, if you are going to use Pay Back Time. User's Guide energyPRO Method of calculation in energyPRO 173 Please be very carefull not to include payments, that would exist, even without the investments. Figure 3.27: The warning about Internal rate of return is also relevant, if you are going to use Pay Back Time 174 Method of calculation in energyPRO www.emd.dk User's Guide energyPRO 3.3 Method of solar calculation in energyPRO In energyPRO a solar collector producing heat and a photovoltaic producing electricity can be modelled. Setting up the units is based on time series with solar radiation and ambient temperature, information about location, orientation and performance (found in datasheets from the manufacturer). 3.3.1 Definitions [] Solar altitude angle (90o - z) [] Latitude [] Solar declination angel [] Orientation of inclined plane, south = 0, west = 90 t [] Temperature coefficient for photovoltaic module efficiency [] Angel of incidence of beam radiation on inclined plane [] Hour angel [] Reflection factor z [] Solar zenith angle (Angel of incidence of beam radiation on horizontal) misc [] a [] Losses from the photovoltaic-module to the grid Incidence angle modifier coefficient 2 A [m ] Total solar collector area I [W/m2] Total radiation on a horizontal plane Ib [W/m2] Beam radiation on a horizontal plane Id [W/m2] Diffuse radiation on a horizontal plane Idiff [W/m2] Diffuse radiation on an inclined plane Idir [W/m2] Beam radiation on an inclined plane Io [W/m2] Extraterrestrial radiation on a horizontal plane Iref [W/m2] Ground reflected radiation on an inclined plane Is [W/m2] Total radiation on an inclined plane Isc [W/m2] Solar constant, 1367 W/m2 ISTC [W/m2] Radiation at standard conditions (1000 W/m2) (photovoltaic) K [] Incidence angle modifier a0 [W/(m2 C)2] First-order coefficient in collector efficiency equation User's Guide energyPRO Method of calculation in energyPRO 175 a1 [W/(m2 C)] Second-order coefficient in collector efficiency equation KT [] Ratio of total radiation on a horizontal plane to Extraterrestrial radiation n [] Day of year n0 [] Intercept (maximum) of the collector efficiency NOCT [C] Nominal Operating Cell Temperature (photovoltaic) Ppv [W] Electricity production from a Photovoltaic module Pmax [W] Installed capacity, photovoltaic Pelec [W] Electricity production to the grid from the photovoltaic plant Rb [] Ratio of beam radiation on an inclined plane to beam on horizontal Rd [] Ratio of diffuse radiation on an inclined plane to diffuse on horizontal Rr [] Ratio of reflected radiation on an inclined plane to total radiation on horizontal s [] Inclination of surface ta [C] Ambient temperature tm [C] Solar collectors average temperature Tcell [C] Photovoltaic operation cell temperature TSTC [C] The cell temperature at standard conditions (25 C) (photovoltaic) 176 Method of calculation in energyPRO www.emd.dk User's Guide energyPRO 3.3.2 External conditions External time series are needed to calculate the solar radiation on an inclined plane in energyPRO. These time series include solar radiation. Optimally, the solar radiation is divided into beam radiation, Ib and diffuse radiation, Id. Alternately, the solar radiation comes as total radiation, I. If the solar radiation comes as total radiation the diffuse and the beam radiation can be calculated as follows (Reindl, D.T, et al., ”Diffuse Fraction Correlations” Solar Energy, vol. 31, No 5, October 1990): Interval: 0 KT 0,3 Constraint: Id/I 1,0 I d / I 1,020 0,254 * KT 0,0123 * sin Interval: 0,3 KT < 0,78 Constraint: 0,1 Id/I 0,97 I d / I 1,400 1,749 * KT 0,177 * sin Interval: 0,78 KT Constraint: 0,1 Id/I I d / I 0,486 * K T 0,182 * sin Where KT is the ratio of total radiation on a horizontal plane to extraterrestrial radiation: KT I Io Io is defined as: I o I sc * cos z where Isc is the solar constant, 1367 w/m2 z is the solar zenith angle, described in section 3.3.3. The beam radiation is Ib I I d 3.3.3 Radiation on solar collector or photovoltaic This section describes the calculation of radiation on unshaded surface. Section 3.3.4 contains the effects of array shading. The time series with solar radiation are radiation on horizontal plane. Most often the solar collector or photovoltaic is inclined. Therefore the first task is to convert the radiation on horizontal to the inclined plane. Beam radiation The relation between the beam radiation on an inclined plane and the beam radiation on horizontal is giving by the factor Rb. User's Guide energyPRO Method of calculation in energyPRO 177 Rb cos cos z where z Angel of incidence of beam radiation on horizontal. Angel of incidence of beam radiation on horizontal is specified by the formula: cos z sin * sin cos * cos * cos where is the solar declination angel is the latitude is the hour angel The solar declination angel is approximately specified by: 23,45 * sin 360 * where 284 n 365 n is the day of the year. The hour angel is identified by (”European simplified methods for active solar system design”, Bernard Bourges, July 1990): 15 * (h 12) The beam radiation on an inclined plane is found by the following formula: cos sin * sin * cos s sin * cos * sin s * cos cos * cos * cos s * cos cos * sin * sin s * cos * cos cos * sin s * sin * sin where s is the inclination of the plane is the plane’s orientation. The beam radiation on an inclined plane: I dir I b * Rb Diffuse radiation The ratio between the diffuse radiation on an inclined plane and horizontal is given by Rd 0,5 * (1 cos s) Hereby the diffuse radiation on the inclined plane: I diff I d * Rd 178 Method of calculation in energyPRO www.emd.dk User's Guide energyPRO Reflected radiation The contribution from radiation reflected from the ground is defined as follows: Rr 0,5 * (1 cos s) * where is the reflection factor depends on local conditions, a typical value is 0.2, equal to ground covered by grass. Hereby the reflected radiation becomes I ref I * Rr Total radiation The total radiation on the inclined surface is the sum of the beam, diffuse and reflected radiation: I s I dir I diff I ref 3.3.4 Array shading Without array shading the calculated radiation on an inclined surface is valid for single rows of surface. Often, large scale solar collector or photo voltaic systems will be mounted on the ground in rows. The radiation will be reduced on the subsequent rows. Θz h ls dr β s The reduction of the radiation depends on the following input data or solar data: βgr [˚] The inclination of the ground γgr [˚] The orientation of the ground related to south s [˚] The inclination of the surfaces γsurf [˚] The orientation of the surfaces related to south h [m] The height of surfaces dr [m] The distance between the rows related to the ground φ [˚] The latitude of location Nrows [] The number of rows ω [˚] The solar hour angle Θz [˚] The solar zenith angle User's Guide energyPRO Method of calculation in energyPRO 179 Beam radiation If the inclination of the ground is zero, the surfaces of the solar collectors or PVs are orientated at south and the sun is in south, the length of the shadow can be calculated by the use of sinus relations: ls h dr * sin (90 z ) sin 180 s (90 z ) However, the ground can have any inclination in any direction, the surfaces can have any inclination in any direction and the sun is deviating from south most of the day. We need to find the length of the shadow on the surface in the hour angle plane, ω. l s h Where d r * sin (90 ( z gr, )) sin 180 s' (90 ( z gr, )) lsω is the length of the shadow on the surface hω is the height of the surface drω is the distance between the rows s’ω is the surface’s inclination related to the ground βgr,ω is the inclination of the ground All in the hour angle plane, ω. The height of the surface in the hour angle, hω is found by the following cosine relation: Where hgrω is the height of the surface, when projected down on the ground: The inclination of the ground in the hour angle, βgr,ω is found by: The distance between the rows in the hour angle, drω is found by: βgr,surf is the grounds inclination in the orientation of the surfaces: 180 Method of calculation in energyPRO www.emd.dk User's Guide energyPRO The surface’s inclination in the hour angle related to the inclination of the ground: The part of the total surface area in shadow, Shfrac is calculated as follows Where Nrows is the number of rows. With correction for array shading the beam radiation becomes: Diffuse radiation The shadow impact on the diffuse radiation is visualized below: Sv d’r h Sv1 dr Βgr,surf s Where Sv is the angel of sky view of the rows affected by shading of proceeding row and Sv1 is the sky view of the first row, which is not affected by shading, but where the inclination of the ground in the orientation of the surfaces is taking into consideration. Sv1 is equal to 180 – (s – βgr, surf) The ratio between the diffuse radiation on first row and horizontal, Rd1 is given by User's Guide energyPRO Method of calculation in energyPRO 181 The ratio between the diffuse radiation on subsequent rows and horizontal, Rd is given by Sv is found by the following cosine relation: Where d’r is the distance between the bottom of the row and the top of the preceding row. d’r is found by the following cosine relation: The resulting Rd,sh becomes The diffuse radiation on the inclined surface when taking shading into consideration becomes Reflected radiation The reflected radiation ratio when taking shading into consideration is divided into the beam, Rr,b and diffuse, Rr, d radiation. Further, the ratio is different for the first, Rr1 and the following rows, Rrn. Beam and diffuse reflected radiation on the first rows are given as The reflected radiation on the proceeding rows is calculated as ratio of the reflected radiation on the first row, rp-1. The beam reflected radiation on the proceeding rows depends on the length of the beam on the ground, lsun. The length is zero if the surface is partly in shade, meaning that no beam radiation reach the ground in front of the row. If the length of the beam on the ground is equal to h, rp-1,b is set to 1. The length is calculated as follows: 182 Method of calculation in energyPRO www.emd.dk User's Guide energyPRO And rp-1,b becomes The reflected beam radiation, Rr,b becomes The reflected diffuse radiation on the proceeding rows as ratio of the reflected diffuse radiation on the first row, rp-1,d has been defined as follows The diffuse reflected radiation, Rrn,d becomes The overall reflected diffuse radiation, Rr,d becomes The reflected radiation on the inclined surface when taking shading into consideration becomes 3.3.5 Solar Collector The formula for a solar collector is as follow (without Incidence angle modifier): Y A * I s * no a1 * tm ta a2 * tm ta 2 where User's Guide energyPRO Y: Heat production, [W]. A: Solar collector area [m2] Is: Solar radiation on solar collector, [W/m2] Method of calculation in energyPRO 183 tm: The collectors average temperature, [C], that is an average between the temperature of the cold water entering the collector and the hot water leaving the collector ta: The ambient temperature, [C]. For the best results the ambient temperatures should be hourly. The efficiency of the solar collector is defined by three parameters: no: Intercept (maximum) of the collector efficiency, [-] a1: The first-order coefficient in collector efficiency equation, [W/(m2 C)] a2: The second-order coefficient in collector efficiency equation, [W/(m2 C)2] These 3 parameters are available for collectors tested according to ASHRAE standards and rated by SRCC (ASHRAE, 2003; SRCC,1995), as well as for collectors tested according to the recent European Standards on solar collectors (CEN, 2001). Many examples of collector parameters can be found on the internet (e.g. SPF, 2004). Note: It is important to make sure that collector area entered as a parameter match the area used when determining the values of no, k1 and k2. Typically, efficiency curves are provided for gross area in the US and aperture area in Europe. Furthermore, the model includes Incidence Angle Modifier, IAM or K. The sun is not always located perpendicular to the collector plane; the incidence angle generally changes both during the course of a day and throughout the year. The transmittance of the cover glazing for the collector changes with the incidence angle. Typically, the Incidence angle modifier looks as below: Figure 3.28 The incidence angle modifier 184 Method of calculation in energyPRO www.emd.dk User's Guide energyPRO It can also be defined as follow: K 1 tan a ( ) 2 where is the incidence angel on the collector. a is the measured coefficient. Including K the formula for the heat production from the solar collector becomes: Y A * I beam * K ( I diffuse) * K 60 * no a1 * t m t a a2 * t m t a 2 The radiation is split into beam radiation and diffuse radiation. Since the diffuse radiation per definition has no incidence angel is used the IAM at 60o. 3.3.6 Photovoltaic The electricity production from a Photovoltaic module, Ppv, can be expressed as follows: Ppv PMax * Is I STC * 1 s * Tcell TSTC where Pmax: Installed capacity [W] Is: Solar radiation [W/m2] ISTC: Radiation at standard conditions (1000 W/m2) [W/m2] s : Temperature coefficient for module efficiency [-] Tcell: Operation cell temperature [C] TSTC: The cell temperature at standard conditions (25 C) [C] The operation cell temperature is calculated by the following formular (Antonio Luque and Steven Hegedus (2003)): NOCT 20C Tcell Ta I s * 2 800W / m where: Tat: NOCT: Ambient temperature Nominal Operating Cell Temperature Hereto come losses from the pv-module to the grid, misc, such as miscellaneous PV array losses and other power conditioning losses. User's Guide energyPRO Method of calculation in energyPRO 185 The power production at grid becomes: Pelec = Ppv * (1 - misc) 186 Method of calculation in energyPRO www.emd.dk User's Guide energyPRO 3.4 Method of wind farm calculation in energyPRO The wind farm model in energyPRO cover three different cases. 1. Annual production calculated a. Power curve used directly b. Power curve is scaled to another level 2. Fixed annual production (wind speed is scaled) 3.4.1 Definitions WSm(t) = Wind speed measured (m/s) at time t WSC(t) = Wind speed calculated (m/s) at time t Hm = Height of measurements (m) Hh = Hub Height (m) = Hellmann coefficient mf = Wind speed modification factor PC(WSc(t) = then power from the power curve based on the calculated wind speed at hub height and linear interpolation on power curve. PMaxPC = Max power value found in power curve PMax = Max Power stated P(t) = Production at time t PannualDesired = Annual production desired (MWh) PannualCalc = Annual production calculated (MWh) 3.4.2 Mathematical description Wind speed at hub height Calculated wind speed at hub height in cases 1a and 1b. H (1) WSc (t ) WSm (t ) * h Hm Calculated wind speed at hub height in case 2. User's Guide energyPRO Method of calculation in energyPRO 187 Hh Hm (2) WSc (t ) WSm (t ) * *mf , Where the modification factor is found through iterations Calculation of production at time t (3) P(t ) PC (WSC (t )) (Case 1a) (4) P(t ) PC (WSC (t )) * Pmax / Pmax PC (Case 1b) (5) P(t ) PC (WSC (t )) (Case 2) Where PC (WSC (t )) return then power from the power curve based on the calculated wind speed at hub height and linear interpolation on power curve. Calculation of modification factor H WSc (t ) WSm (t ) * h PC (WSC (t )) * T , where Hm t HYear (6) PannualCalc= t 0 *mf Start guess mf =1 In each Iteration is the annual production calculated (6) and compared with the desired value If PannualCalc > PannualDesired then decrease mf If PannualCalc < PannualDesired then increase mf This is repeated until PannualCalc PannualDesired then mf is found 188 Method of calculation in energyPRO www.emd.dk User's Guide energyPRO 4 Functions in energyPRO 4.1 Introduction This chapter is a reference section for functions and formulas in energyPRO. There are five areas in energyPRO containing formula fields. Is each of those areas there are a set of standard mathematical functions and some specialized functions available. These areas are: Time series functions Demands Energy Units Economy (Revenues and operational expenditures) Economy (Taxation) Economy (Define annual key figures) If functions are available, this is indicated by the Fx-button (Taxation and Define annual key figures excluded). Pressing this button invokes a window telling which functions are available for creating formulas. General functions: The structure in this chapter is as follows. First, the general functions available in all or most of the formula fields in energyPRO is presented, see section 4.2. The general functions are the only functions available in “Time series functions” and “Demands”. Functions concerning load curves: In section 4.3 additional functions used for describing the production units load curves are presented. These functions describes how to access productions and consumptions on other production units Functions concerning operational payments: In section, 4.4 functions available for defining Revenues and Operation Expenditures payments are described. Those functions are divided into three groups. In section 4.4.1 are functions concerning energy conversion on system level described. In section 4.4.2 functions concerning energy conversion on production unit level are described. Finally, section 4.4.3 contain description of miscellaneous functions. Functions concerning Taxation: In section 4.5 are the functions to be uses for defining Taxation payments described. Functions concerning Annual key figures: Finally, in section 4.6 functions used to define “Annual key figures” are described. User's Guide energyPRO Functions in energyPRO 189 4.2 Functions used in all (or more) formula fields Available in all formula fields are standard mathematical functions shown in Table 4.1. Standard mathematical functions + , , * ,/ , ^ Abs(value1) Arctan(value1) Cos(value1) Exp(value1) Frac(value1) Int(value1) Trunc(value1) Ln(value1) Pi Round(value1) Sin(value1) Sqr(value1) Sqrt(value1) Min(value1;value2) Max(value1;value2) Table 4.1: Standard mathematical functions available in all formula fields in energyPRO Hereto come the function Z and the Time series reference function both described below. 190 Functions in energyPRO www.emd.dk User's Guide energyPRO Time series reference Returns values from a time series established under external conditions or demands. Present only available in “Time series functions” and “Production Units”. Symbol(_) Syntax Argument Description Examples Description Symbol The symbol used to define a time series Returning value Value corresponding with date and time from time series established under external conditions or demands Returning unit - Is used when the load curve of a production unit is dependent of a time series. The function extract values from the specified time series. HD(_) extract the values form the time series HD, where HD is the symbol of a time series, e.g. heat demand. T(_)extract the values form the time series T, where T could be the symbol of a time series from external conditions describing the fluctuations in temperatures during a year. Z Z is a step-function that returns a value between 0 and 1 Syntax Z(function,Fmin,Fmax) Argument Description Example Description Function Fmin Fmax The function Minimum value Maximum value Returning value Function value between 0 and 1 Returning unit - Z is a step function, that returns the value 0, when T<Fmin, 1, when T>Tmax, and a linear interpolated value between 0 and 1 when T is between Fmin and Fmax. Z(T(_);0;10;). Use the time series with the symbol T. The argument to T,(_) refers the actual time. In that case the Z-function returns: - 0 if the actual temperature is below zero, - 0.5 if the temperature is 5°C and finally - 1 if the the temperature is 10°C or above 4.3 Functions used only in Production units load curves User's Guide energyPRO Functions in energyPRO 191 The names of functions starting with PaP (Production already Planned) have in common that they extract information about productions/consumptions taking place on production units on which a production already has been planned (in the actual time step). In practice, these values are available on units having a higher priority in the operation strategy than the actual production unit. If units have a lower priority they return a zero. The PaP-functions are: Name Returns Unit PapElcons(name) Already Planned electricity consumption MW PapElProd(name) Already Planned electricity production MW PapCool(name) Already Planned Cooling production MW PapFuel(name) Already Planned Fuel consumption MW PapHeat(name) Already Planned Heat production MW PapProcHeat(name) Already Planned Process Heat production MW Table 4.2:Already Planned functions to be use for describing load curves Name is the specified name the of production unit on which the actual load-curve depend. PapElCons Returns the already planned electricity consumption on a specified unit. Syntax PapElCons(Name) Argument Description Name Name of the production unit or 0 (zero). Zero means all units Returning value Actual electricity production load on specified production unit(s) MW R e t u r n i n g u n i t Description 192 Functions in energyPRO This function is used in situations where the load on the actual www.emd.dk User's Guide energyPRO production unit depends on the electricity consumption load on other production unit(s). Be aware that the production unit(s) addressed must have a higher priority in the operation strategy than the production unit on which it is used, otherwise the function returns a zero Examples The following two examples show the use of PapElCons PapElCons(WoodBoiler) returns the actual load of Electricity consumption on “WoodBoiler” PapElCons(0) return the actual load of electricity consumption on all production units having a higher priority in the operation strategy. PapElProd This function returns the already planned electricity production from a specified production unit. Syntax PapElProd(Name) Argument Description Description Name Name of the production unit or 0 (zero). Zero means all units Returning value Actual load on production unit(s) Returning unit MW This function is used in situations where the load on the actual production unit depends on the electricity production load on other production unit(s). Be aware that the production unit(s) addressed must have a higher priority in the operation strategy than the production unit on which it is used, otherwise the function returns a zero Examples The following two examples show the use of PapElProd PapElProd(CHP) returns the actual load of electricity production from “CHP” PapElProd(0) return the actual load of electricity production from all production units having a higher priority in the operation strategy. User's Guide energyPRO Functions in energyPRO 193 PapCool Returns the already planned cooling production from a specified production unit. Syntax PapCool(Name) Argument Description Description Name Specified of the production unit or 0 (zero). Zero means all units Returning value Actual cooling load on production unit(s) Returning unit MW This function is used in situations where the load on the actual production unit depends on the cooling production load on other production unit(s). Be aware that the production unit(s) addressed must have a higher priority in the operation strategy than the production unit on which it is used; otherwise, the function returns a zero. Examples The following two examples show the use of PapCool PapCool (Cooler) returns the actual load of cooling production from “Cooler” PapCool(0) return the actual load of cooling production from all production units having a higher priority in the operation strategy. PapFuel Returns the already planned production of heat on a specified unit. Syntax PapFuel(Name) Argument Description Description Name Name of the production unit or 0 (zero). Zero means all units Returning value Actual load on production unit(s) Returning unit MW The function might be used in situations where the fuel consumption on the actual production unit depends on the fuel consumption on other production unit(s). Be aware that the production unit(s) addressed must have a higher priority in the operation strategy than the production unit on which it is used, otherwise the function returns a zero. Examples The following two examples show the use of PapFuel PapFuel(Boiler 1) returns the actual fuel consumption on “Boiler 1” PapFuel(0) return the actual fuel consumption on all production units having a higher priority in the operation strategy. 194 Functions in energyPRO www.emd.dk User's Guide energyPRO PapHeat Returns the already planned heat production from a specified unit. Syntax PapHeat(Name) Argument Description Description Name Name of the production unit or 0 (zero). Zero means all units Returning value Actual load on production unit(s) Returning unit MW This function is used in situations where the load on the actual heat production unit depends on the heat production load on other production unit(s). Be aware that the production unit(s) addressed must have a higher priority in the operation strategy than the production unit on which it is used, otherwise the function returns a zero. Examples The following two examples show the use of PapHeat PapHeat(Boiler 1) returns the actual load of heat production from “Boiler 1” PapHeat(0) return the actual load of heat production from all production units having a higher priority in the operation strategy. PapProcHeat Returns the already planned production of process heat on a specified unit. Note: The process heating option is only relevant when the advanced setting option “Transmission of heat from plant through both high and low temperature pipes” in the Project Identification window is checked. Syntax PapProcHeat(Name) Argument Description Description Name Name of the production unit or 0 (zero). Zero means all units Returning value Actual load on production unit(s) Returning unit MW The function might be used in situations where the load on the actual process heat production unit depends on the process heat production load on other production unit(s). Be aware that the production unit(s) addressed must have a higher priority in the operation strategy than the production unit on which it is used, otherwise the function returns a zero. The following two examples show the use of PapProcHeat Examples User's Guide energyPRO PapProcHeat(Boiler 1) returns the actual load of process heat production from “Boiler 1” Functions in energyPRO 195 PapProcHeat(0) Return the actual load of process heat production from all production units having a higher priority in the operation strategy. 196 Functions in energyPRO www.emd.dk User's Guide energyPRO 4.4 Functions used only in Revenues and Operational Expenditures There are three sets of functions relating to the energy conversion within energyPRO. Those are: Functions measuring on the system border Functions measuring on energy conversion unit level. Other Functions In the figure below the system is defined as everything placed within the outer frame. By other words, the “functions measuring on the system border” is the functions measuring the flow passing this border. Figure 4.1:The Energy System In practice the system border is the electrical grid or a specified transformer station, where the interaction between the considered energy system and the outside world is measured. It could for instance be a meter measuring the amount of natural gas entering the system. The functions measuring on productions unit level are strictly related to the specific production units and demands described within the system. It could be a specified boiler, CHP-unit or a specified demand. Below you will find a description of the single functions. When modelling economy it is important to realize that the model is monthly based. This is especially important while modelling with peakfunction and the Electric-Capacity function. Not being aware of this fact might result in misleading values. User's Guide energyPRO Functions in energyPRO 197 4.4.1 Functions measuring on the system border These functions consider the energy system as a black box, and are only dealing with energy and power crossing this border, see the figure below. The arrows are indicating the flows passing the system border. Energy System Electricity Fuels Figure 4.2: Energy System. Flows passing system border This “System” -functions can be interpreted as meters placed on the system border measuring flows crossing the system border. The functions are for instance valuable in situations, where payments are independent of which unit it is concerning. Name 198 Functions in energyPRO Returns Unit AccDeliveredElectricity (Market,PriorityPeriod) Accumulated monthly amount for delivered electricity to market MWh AccReceivedElectricity (Market ,PriorityPeriod) Accumulated monthly amount for received electricity from market MWh AccReceivedFuel(Fuel) Accumulated monthly amount of received fuel MWh DeliveredElectricity(Market, PriorityPeriod) Electricity delivered out off MWh/month the system to the market PeakDeliveredElectricity (Market,PriorityPeriod) Monthly peak value for delivered electricity to market MW PeakReceivedElectricity (Market,PriorityPeriod) Monthly peak value for received electricity form market MW PeakReceivedFuel(Fuel) Monthly peak value for received fuel MW PoPxDE(Market) Monthly value of electricity delivered to the grid from the market <currency used in time series> PoPxRE(Market) Monthly Value of electricity received from the grid from market <currency used in time series> ReceivedElectricity(Market, Electricity received by the MWh/month www.emd.dk User's Guide energyPRO PriorityPeriod) system from market ReceivedFuel(Fuel) Fuel received by the system MWh/month Table 4.3: Functions measuring the energy passing the system border. AccDeliveredElectricity Returns the accumulated monthly amount electricity delivered to the specified market in the specified “Priority period”. Syntax AccDeliveredElectricity(Market,PriorityPeriod) Argument Description Description Market The Name of market. All markets return the accumulated amount for all markets PriorityPeriod The Name of the Priority period name specified in “Electricity markets”. “All Periods” return the accumulated amount in all priority periods Returning value Monthly amount of energy delivered to market Returning unit MWh/month In every calculated time step within a month the amount of electricity delivered to the specified market is calculated. The amount delivered is calculated as the electricity produced subtracted the electricity consumed by production units and consumers within the system. If negative in a time step the value for that time step is set to zero, otherwise it is added to the amount of delivered electricity. The function returns the accumulated value hereof for the actual year in calculation. Also see AccReceivedElectricity. Examples AccDeliveredElectricity(All markets, All Periods) AccDeliveredElectricity(Fixed tariff, Highload) AccReceivedElectricity Returns the monthly amount electricity received from the specified market in a specified “Priority period” Syntax AccReceivedElectricity(Market, PriorityPeriod) Argument Description User's Guide energyPRO Description Market The Name of market. All markets return the accumulated amount for all markets PriorityPeriod The Name of the Priority period name specified in “Electricity markets”. “All Periods” return the accumulated amount in all priority periods for the specified market Returning value Monthly amount of energy delivered to the market Returning unit MWh/month In every calculated time step within a month the amount of electricity Functions in energyPRO 199 received from the specified market is calculated. The amount received is calculated as the electricity produced subtracted the electricity consumed by production units and consumers within the system. If positive in a time step the value for that time step is set to zero, otherwise it is added to the amount of received electricity. The function returns the accumulated value hereof for the actual year in calculation. Also seeAlso see AccDeliveredElectricity. Examples AccReceivedElectricity(Fixed Tariff, All Periods) AccReceivedElectricity(Fixed tariff, Highload) AccReceivedFuel Returns the Accumulated monthly amount of a specified fuel received into the energy system Syntax AccReceivedFuel(Name) Argument Description Examples Description Name The Name of the specified fuel. Returning value Monthly amount of fuel received to the system Returning unit MWh The accumulated amount of a specified fuel consumed by all production units in actual year of calculation. AccReceivedFuel(Natural Gas) PeakDeliveredElectricity Returns the Peak load of electricity delivered to the specified market in the specified “Priority period” Syntax PeakDeliveredElectricity(Market, PriorityPeriod) Argument Description Description Market The Name of market. All markets return the accumulated amount for all markets PriorityPeriod The Name of the Priority period name specified in “Electricity markets”. “All Periods” return the accumulated amount in all priority periods Returning value Monthly peak of electricity delivered to market Returning unit MW/month In every calculated time step within a month the peak of electricity delivered to the market is calculated. This peak is calculated as the maximum value within a month of the actual electricity consumption by production units and consumers subtracted the actual electricity production. Also seeAlso see PeakReceivedElectricity. Examples 200 Functions in energyPRO PeakDeliveredElectricity(Flat rate, All Periods) www.emd.dk User's Guide energyPRO PeakDeliveredElectricity(Fixed Tariff, Highload) PeakReceivedElectricity Returns the monthly electricity peak received from the specified market in a specified “Priority period”. Syntax PeakReceivedElectricity(Market, PriorityPeriod) Argument Description Description Market The Name of market. All markets return the accumulated amount for all markets PriorityPeriod The Name of the Priority period name specified in “Electricity markets”. “All Periods” return the accumulated amount in all priority periods Returning value Monthly peak of electricity delivered to the specified market Returning unit MWh/month In every calculated time step within a month the peak of electricity received from the specified market is calculated. The Peak is calculated as the maximum value within a month of electricity produced subtracted the electricity consumed by production units and consumers within the system. When modelling economy it is important to realize that the model is monthly based. This is especially important while modelling with peak-function and the Electric-Capacity function. If not beeing aware of this fact will result in much higher values than intended. Also see PeakDeliveredElectricity. Examples PeakReceivedElectricity(Fixed tarifft,All Periods) ReceivedElectricity(Fixed tariff, Highload) PeakReceivedFuel Returns the monthly peak of a specified fuel received to the system Syntax PeakReceivedFuel(Name) Argument Description Examples Description Name The Name of the specified fuel. Returning value Monthly amount of fuel received to the system Returning unit MWh The monthly peak of a specified fuel consumed by all production units in the actual year of calculation. PeakReceivedFuel(Natural Gas) SPxDE SPxDE is an abbreviation of Spot Market multiplied with Delivered electricity. The function returns the monthly economic value of electricity delivered to the spot market. User's Guide energyPRO Functions in energyPRO 201 Please remember to set the price pr unit to 1. Note: The function is only relevant if dependent on that Spot market is chosen in “Electricity Markets”. Syntax SpxDE(Market) Argument Market Description Description The Name of market. All markets return the accumulated amount for all markets Returning value Monthly value of energy delivered to the spot market Returning unit <currency> In every calculated time step within a month the amount of electricity delivered to the spot market is calculated. The amount delivered is calculated as the electricity produced subtracted the electricity consumed by production units and consumers within the system. If negative in a time step the value for that time step is set to zero, otherwise it is added to the amount of delivered electricity. The value for each calculated time step is then multiplied with the corresponding value from the time series selected in “Electricity Markets” , and finally summed up monthly. Examples SpxDE(Spotmarket) SPxRE SPxRE is an abbreviation of Spot Market multiplied with Received electricity. The function returns the monthly economic value of electricity received from the spot market. Please remember to set the price per unit to 1. Note: The function is only relevant if spot market is chosen in “Electricity Markets”. Syntax SPxRE Argument Description Description Market The Name of market. All markets return the accumulated amount for all markets Returning value Monthly value of energy delivered to the spot market Returning unit <currency> In every calculated time step within a month the amount of electricity received from the spot market is calculated. The amount received is calculated as the electricity the electricity consumed by production units and consumers within the system subtracted the produced electricity. If negative in a time step the value for that time step is set to zero, otherwise it is added to the amount of received electricity. The value for each calculated time step is then multiplied with the corresponding value from the time series selected in “Electricity Markets”, and finally summed up monthly. Examples 202 Functions in energyPRO SpxRE(Spotmarket) www.emd.dk User's Guide energyPRO DeliveredElectricity Returns the monthly amount electricity delivered to the specified market in a specified “Priority period”. Syntax DeliveredElectricity(Market, PriorityPeriod) Argument Description Description Market The Name of market. All markets return the accumulated amount for all markets PriorityPeriod The Name of the Priority period name specified in “Electricity markets”. “All Periods” return the accumulated amount in all priority periods Returning value Monthly amount of energy delivered to the specified market Returning unit MWh/month In every calculated time step within a month the amount of electricity delivered to the specified market is calculated. The amount delivered is calculated as the electricity produced subtracted the electricity consumed by production units and consumers within the system. If negative in a time step the value for that time step is set to zero, otherwise it is added to the amount of delivered electricity. Also see ReceivedElectricity. Examples DeliveredElectricity(All markets,All Periods) DeliveredElectricity(Fixed tariffs,Highload) ReceivedElectricity Returns the monthly amount electricity received from the specified market in a specified “Priority period”. Syntax ReceivedElectricity(PriorityPeriod) Argument Description Examples Description Market The Name of market. All markets return the accumulated amount for all markets PriorityPeriod The Name of the Priority period name specified in “Electricity markets”. “All Periods” return the accumulated amount in all priority periods Returning value Monthly amount of energy delivered to the specified market Returning unit MWh/month In every calculated time step within a month the amount of electricity received from the specified market is calculated. The amount received is calculated as the electricity produced subtracted the electricity consumed by production units and consumers within the system. If positive in a time step the value for that time step is set to zero, otherwise it is added to the amount of received electricity. ReceivedElectricity(Fixed tariffs,All Periods) ReceivedElectricity(Fixed tariffs,Highload) User's Guide energyPRO Functions in energyPRO 203 ReceivedFuel Returns the monthly amount of a specified fuel received to the system Syntax ReceivedFuel(Name) Argument Description Examples Description Name The Name of the specified fuel. Returning value Monthly amount of fuel received to the system Returning unit MWh The amount of a specified fuel consumed by all production units. ReceivedFuel(Natural Gas) 4.4.2 Functions measuring on energy conversion unit level. These functions are focused on the single elements within modelled energy system. This is the productions units and the demands. The functions measuring on the energy conversion unit level can be considered as meters placed on the single energy conversion units i.e. a specified boiler, a specified CHP-unit or an electricity demand. Energy conversion units Below a description of the functions that are available for the single types of units. Those units are: CHP-unit Boiler User defined Electric heat pump Absorption cooler Name 204 Functions in energyPRO Returns Unit CP(eUnit) Cooling production from eUnit MWh/month CPCap(eUnit) Peak fuel capacity on eUnit MW EC(eUnit,PriorityPeriod) Electricity consumption on eUnit in Period of priority MWh/month ECCap(eUnit) Peak Electricity capacity on MW eUnit EP(eUnit,PriorityPeriod) Electricity production from eUnit in Period of priority MWh/month ElectricCapacity(eUnit) Electric Capacity for eUnit MW www.emd.dk User's Guide energyPRO EPCap(eUnit) Peak Electricity capacity on MW eUnit FC(eUnit) Fuel consumption on eUnit MWh/month FCCap(eUnit) Peak fuel capacity on eUnit MW HC(eUnit) Heat consumption from eUnit MWh/month HCCap(eUnit) Peak heat consumption capacity on eUnit MW HeatBlowoff MWh/Month HoursOfOperation(eUnit) Number of hours of operation for eUnit Hours HP(eUnit) Heat production from eUnit MWh/month HPCap(eUnit) Peak heat capacity on eUnit MW PeakElecLoadAnnual(eUnit) Annual max MWh/month PHP(eUnit) Process Heat production from eUnit MWh/month PHPCap(eUnit) Peak process heat capacity on eUnit MW TurnOns(eUnit) Number of turn-on for eUnit FullLoadHours(eUnit) Number of full load hours for eUnit Hours AccFullLoadHours(eUnit) Accumulates the full load hours over the year Hours AccAllYearsFullLoadHours(eUnit) Accumulates the full load hours over the years in the planning period Hours Table 4.4: Functions getting production information on energy conversion units. CP Returns the monthly amount of Cooling produced on a specified energy conversion unit. Syntax CP(eUnit) Argument Example User's Guide energyPRO Description eUnit The Name of the specified energy conversion unit Returning value Monthly amount of cooling produced on energy conversion unit Returning unit MWh/month CP(Electric Chiller) Functions in energyPRO 205 CPCap Returns the monthly peak cooling production load realised on a specified energy conversion unit. Syntax CPCap(eUnit) Argument Example Description eUnit The Name of the specified energy conversion unit Returning value Monthly peak cooling production load on specified energy conversion unit Returning unit MW CPCap(Absorption chiller) EC Returns the monthly amount of electricity consumed by a specified energy conversion unit in a specified “Period of Priority”. Syntax EC(eUnit,PriorityPeriod) Arguments Description EUnit The Name of the specified energy conversion unit Name of priority period or “All periods” PriorityPeriod Description Examples Returning value Monthly amount of electricity Consumed Returning unit MWh/month Electricity consumed by a specified energy conversion unit in a specified “priority period”-name EC(CHP;PeakLoad) EC(CHP;All Periods) ECCap Returns the monthly peak electrictity consumption load realised on a specified energy conversion unit. Syntax ECCap(eUnit) Argument Example 206 Functions in energyPRO Description eUnit The Name of the specified energy conversion unit Returning value Monthly peak electricity consumption load on specified energy conversion unit Returning unit MW ECCap(Absorption chiller) www.emd.dk User's Guide energyPRO ElectricCapacity Returns the monthly peak electric production load on a specified energy conversion unit. Syntax ElectricCapacity(eUnit) Argument Description Examples Description eUnit The Name of the specified energy conversion unit Returning value Monthly peak electric load Returning unit MW Monthly peak electric load on specified energy conversion unit ElectricCapacity(CHP) EP Returns the monthly amount of electricity produced on a specified energy conversion unit in a Priority period name specified in “Electricity markets”. Syntax EP(eUnit,PriorityPeriod) Arguments Description Examples Description eUnit PriorityPeriod The Name of the specified Energy conversion unit Name of priority period or “All periods” Returning value Monthly amount of electricity produced on energy conversion unit Returning unit MWh/month Electricity produced on a specified energy conversion unit in a specified “priority period”-name EP(CHP;PeakLoad) return monthly electricity production form unit “CHP” in priority period “PeakLoad” EP(CHP;All Periods) return monthly electricity production form unit “CHP” in all periods EPCap Returns the monthly peak electrictity production load realised on a specified energy conversion unit. Syntax EPCap(eUnit) Argument Example User's Guide energyPRO Description eUnit The Name of the specified energy conversion unit Returning value Monthly peak electricity production load on specified energy conversion unit Returning unit MW EPCap(Absorption chiller) Functions in energyPRO 207 FC Returns the monthly amount of fuel consumed by a specified energy conversion unit. Syntax FC(eUnit) Argument Example Description eUnit The Name of the specified energy conversion unit Returning value Monthly amount of fuel consumed by eUnit Returning unit MWh/month FC(Boiler 1) returns fuel consumed by “Boiler 1” FCCap Returns the peak fuel consumption load occurring on a specified energy conversion unit during a month. Syntax FCCap(eUnit) Argument Example Description eUnit The Name of the specified energy conversion unit Returning value Monthly peak fuel load on eUnit Returning unit MW/month FCCap(Boiler 1) returns the highest monthly fuel load occurring on “Boiler 1” HC Returns the monthly amount of heat consumed by a specified energy conversion unit. Syntax HC(eUnit) Argument Examples 208 Functions in energyPRO Description eUnit The Name of the specified energy conversion unit Returning value Monthly amount of heat consumed by a energy conversion unit Returning unit MWh/month HC(Absorption chiller) return the monthly heat consumption on “Absorption chiller” www.emd.dk User's Guide energyPRO HCCap Returns the monthly peak heat consumption load realised on a specified energy conversion unit. Syntax HPCap(eUnit) Argument Example Description eUnit The Name of the specified energy conversion unit Returning value Monthly peak heat consumption load on eUnitenergy conversion unit Returning unit MW/month HCCap(Boiler 1) HeatBlowoff Returns the monthly peak heat blowoff realised on a specified energy conversion unit. Syntax HP(eUnit) Argument Example Description Returning value Monthly heat rejection for accumulated for all heat rejection units in project Returning unit MWh/month HeatBlowOff HoursOfOperation Returns the monthly hours of operation on a specified energy conversion unit. Syntax HoursOfOperation(eUnit) Argument Description EUnit The Name of the specified Energy conversion unit Returning value Monthly hours of operation Returning unit Hours of operation/month Description This function returns monthly hours of operation on a energy conversion unit. Is used when designing operational costs. Example HoursOfOperation(CHP) returns the number of hours of operation on the energy conversion unit CHP User's Guide energyPRO Functions in energyPRO 209 HP Returns the monthly amount of heat produced on a specified energy conversion unit. Syntax HP(eUnit) Argument Example Description eUnit The Name of the specified energy conversion unit Returning value Monthly amount of heat produced on energy conversion unit Returning unit MWh/month HP(Boiler 1) HPCap Returns the monthly peak heat production load realised on a specified energy conversion unit. Syntax HP(eUnit) Argument Example Description eUnit The Name of the specified energy conversion unit Returning value Monthly peak heat production load on specified energy conversion unit Returning unit MWh/month HP(Boiler 1) PeakElectricLoadAnnual Returns the annual peak electric production load on a specified energy conversion unit. Syntax PeakElectricLoadAnnual (eUnit) Argument Description Examples 210 Functions in energyPRO Description eUnit The Name of the specified energy conversion unit Returning value Annual peak electric load Returning unit MW Annual peak electric load on specified energy conversion unit PeakElectricLoadAnnual (CHP) www.emd.dk User's Guide energyPRO PHCCap Returns the monthly peak process heat consumption load realised on a specified energy conversion unit. Syntax PHPCap(eUnit) Argument Example Description eUnit The Name of the specified energy conversion unit Returning value Monthly peak process heat consumption load on specified energy conversion unit Returning unit MW/month PHCCap(Boiler 1) PHP Returns the monthly amount of process heat produced on a specified energy conversion unit. Syntax PHP(eUnit) Argument Example Description eUnit The Name of the specified energy conversion unit Returning value Monthly peak process heat production load on specified energy conversion unit Returning unit MW/month PHP(Boiler 1) PHPCap Returns the monthly peak process heat production load realised on a specified energy conversion unit. Syntax PHP(eUnit) Argument Example User's Guide energyPRO Description eUnit The Name of the specified energy conversion unit Returning value Monthly amount of process heat produced on energy conversion unit Returning unit MWh/month PHP(Boiler 1) Functions in energyPRO 211 TurnOns Returns the monthly amount of turn-on on a specified energy conversion unit. Syntax TurnOns(eUnit) Argument Description Example Description EUnit The Name of the specified Energy conversion unit Returning value Monthly number of turn-on Returning unit Turn-on/month This function returns monthly number of turn-on on a energy conversion unit. Is used when designing operational costs. TurnOns(CHP) returns the number of turn-on on the energy conversion unit CHP FullLoadHours Returns the monthly amount of full load hours on a specified energy conversion unit. Syntax FullLoadHours(eUnit) Argument Description Example 212 Functions in energyPRO Description EUnit The Name of the specified Energy conversion unit Returning value Monthly number of full load hours Returning unit hours/month This function returns monthly number of full load hours on an energy conversion unit. FullLoadHours(CHP) returns the number of full load hours on the energy conversion unit CHP. www.emd.dk User's Guide energyPRO AccFullLoadHours Returns the accumulated amount over a year of full load hours on a specified energy conversion unit. Syntax AccFullLoadHours(eUnit) Argument Description Example Description EUnit The Name of the specified Energy conversion unit Returning value Accumulated number of full load hours over the year Returning unit hours This function returns the accumulated number of full load hours on an energy conversion unit. Typically, it is used when units obtain grant until a certain amount of full load hours, or for service intervals. AccFullLoadHours(CHP) returns the number of full load hours on the energy conversion unit CHP accumulated over the year. AccAllYearsFullLoadHours Returns the accumulated amount over the planning period of full load hours on a specified energy conversion unit. Syntax AccAllYearsFullLoadHours(eUnit) Argument Description EUnit The Name of the specified Energy conversion unit Returning value Accumulated number of full load hours over the planning years Returning unit hours Description This function returns the accumulated number of full load hours on an energy conversion unit. Typically, it is used when units obtain grant until a certain amount of full load hours, or for service intervals. Example AccAllYearsFullLoadHours(CHP) returns the number of full load hours on the energy conversion unit CHP accumulated over the planning period. Demands In Table 4.5 is found the function that are used for getting the dmands Name User's Guide energyPRO Returns Unit CD(coolingdemand) Cooling demand MWh/month ED(electricitydemand) Electricity demand MWh/month HD(heatdemand) Heat demand MWh/month PHD(Processheatdemand) Process Heat demand MWh/month PeakElectricityDemand (Period) The peak value for the month MW for electricity demand for Period Functions in energyPRO 213 Table 4.5: Functions getting demands. CD Returns the monthly cooling demand. Syntax CD(DemandName) Argument Description Example Description DemandName The Name of the specified cooling demand Returning value Monthly cooling demand Returning unit MWh/month This function returns monthly heat demand. CD(Cooling Demand) returns the monthly cooling demand of demand named “Cooling Demand” HD Returns the monthly heat demand. Syntax HD(DemandName) Argument Description Example Description DemandName The Name of the specified Heat Demand Returning value Monthly heat demand Returning unit MWh/month This function returns monthly heat demand. HD(Heat Demand 1) returns the monthly heat demand of demand named “Heat Demand 1” ED Returns the monthly electric demand. Syntax ED(DemandName) Argument Description Examples Description DemandName The Name of the specified Electricity Demand Returning value Monthly electricity demand Returning unit MW/month This function returns monthly heat demand. ED(Electricity Demand) returns the monthly electricity demand of demand named “Electricity Demand” PeakElectricDemand Returns the monthly peak of a specified electric demand. Syntax PeakElectricDemand(DemandName) Argument DemandName 214 Functions in energyPRO www.emd.dk Description The Name of the specified Electricity Demand User's Guide energyPRO Description Example User's Guide energyPRO Returning value Monthly peak electric demand Returning unit MW/month This function returns monthly peak of heat demand. PeakElectricDemand(Electricity Demand) returns the monthly peak of electricity demand of demand named “Electricity Demand” Functions in energyPRO 215 4.4.3 Other Functions Name Returns HeatValue (Fuel) Calorific value for the fuel IndeksFaktor Unit MWh/unit - Index Monthly value of specified index - Month(no) Returns the number 1 for month no, 0 for others - <TimeSeriessymbol>(_) Actual “Timeseries”-value - UnitOfDemand(Demand) Calorific value for the demand (If the unit e.g. are GJ the function will return 0,2777777 MWh/GJ) MWh/unit Table D.4: Other functions HeatValue Returns a conversion factor from MWh to the original unit of the HeatValue used when defining a specified fuel. Syntax HeatValue(FuelName) Argument Description Example 216 Functions in energyPRO Description FuelName The Name of a specified fuel Returning value Conversion factor Returning unit MWh/<unit> Where <unit> is the original unit used when defining the specified fuel This function returns a conversion factor from MWh to original unit of the HeatValue used when defining a specified fuel. This function is normally used for converting the used amount of fuel in MWh to it original unit. HeatValue(Natural gas). Consider that the heat value of the fuel “Natural gas” is defined as 11 kWh/nM3 . Then the function will return 1MWh/11kWh/Nm3 pr MWh equal 1/11000 MWh/Nnm3 www.emd.dk User's Guide energyPRO Indeksfaktor (Danish only) This function is establish for Danish use only. The function is used for calculating the production independent subsidy for CHP production. Syntax Indeksfaktor(TimeseriesSymbol,indexvalue) Argument Description Example Description Timeseries symbol The symbol Name of the specified time series Indexvalues The index Returning value Index factor Returning unit - This function returns returns the monthly “indeks factor” based on then monthly average spot price and an index based om procedevelopment. Indeksfaktor(DK1Spot10;1,223) ice <Timeseriessymbol>(_) Returns the the actual value of the time series Syntax <Timeseriessymbol>(_) Argument Description (_) Returning value The actual value of the time series Returning unit Unit of time series Description This function returns monthly average value of the time series specified with its symbol Example T(_) returns the monthly average value of the specified time series with symbol “T” Month Month is a function returning the value 1 in chosen month and zero in the other months. Syntax Month(number) Argument User's Guide energyPRO Description Number Month number in year 1=January, 2=February etc. Returning value 1 if true 0 if false Returning unit - Functions in energyPRO 217 Description Examples This function returns 1 if the month number in function match the actual month in calculation otherwise it returns 0 (zero). This function is used in situations where an annual payment takes place in a specific month. Month(3). This function return the value 1 if the calculation month is Marts and otherwise the value 0. UnitOfDemand Returns a conversion factor from MWh to the original unit used when defining a specified demand. Syntax UnitOfDemand(DemandName) Argument Description Example 218 Functions in energyPRO Description DemandName The Name of a specified demand Returning value Conversion factor Returning unit MWh/<unit> Where <unit> is the original unit used when defining the specified fuel This function returns a conversion factor from MWh to original energy unit used when defining a specified demand. This function is normally used for converting a demand in MWh to its original unit. UnitOfDemand(HeatDemand 1). Consider that the used “unit of demand” is GJ. Then the function will return 0,2777777 MWh/GJ www.emd.dk User's Guide energyPRO 4.5 Functions used only in Taxation Name Returns ResultBeforeTax The result of the actual fiscal year before tax LossCarriedForward(n) The last n years loss reduced with eventually profits from the fiscal years Increment(amount;n1;n2) This function increments from zero with the value “amount” from fiscal year n1 to n2. Example : Increment(10;2;4) gives the result Fiscal year 1 : Fiscal year 2 : Fiscal year 3 : Fiscal year 4 : Fiscal year 5 : Year(n) 0 10 20 30 30 1 in the fiscal year n, 0 otherwise Example : Year(1)+Year(2) returns 1 in first and second fiscal year, 0 otherwise Table D.7: Taxation functions available for user-defined formulas. Increment This function represent is a step-function to model a linear development of a taxation percentage Syntax Increment(Value,FyearNo1,YearNo2) Argument Description Example Value YearNo1 YearNo2 Annual increment First year with increment Last year with increment Returning value Annual values Returning unit - This function is a step-function to used for modelling changes in taxation rate. The function returns 0 (zero) until the number of first year where it returns the value used for argument. The function then increment with this value each year until number of last year. In the years after it will return the value reached in the last year with changes. Increment(10;2;4) return the following results for Fiscal year 1 : Fiscal year 2 : Fiscal year 3 : Fiscal year 4 : User's Guide energyPRO Description 0 10 20 30 Functions in energyPRO 219 Fiscal year 5 : 30 Fiscal year n : 30 LossCarriedForward Syntax LossCarriedForward(Years) Argument Description Years The number of years for which it is allowed to carry a deficit of a years income statement forward Returning value Amount of loss carried forward to be used in actual year Returning unit <currency> Description In the tax legislation, it is often allowed to carry losses forward. For instance if the income statement in a specific year comes out with a negative result this result may the subtracted the positive result of a forthcoming year bringing down the tax payment of this forthcoming year. The subtraction will be done in the first possible year. Example LossCarriedForward(5). In this case, a deficit in an actual year may be used to bring down tax payments in up to five years. ResultBeforeTax Returns the result of the income statement of the actual fiscal year before taxation. Syntax ResultBeforeTax Argument Description Returning value The result of the actual fiscal year before tax Returning unit <currency> Year A logical function returning 1 if the argument correspond with the actual year number in tax calculation, otherwise it returns 0 (zero) Syntax Year(Yearno) Argument Description Example 220 Functions in energyPRO Description YearNo The year number Returning value 1 if true 0 if false Returning unit - A logical function returning 1 if the argument correspond with the actual year number in tax calculation, otherwise it returns 0 (zero) Year(1)+Year(2) returns 1 in first and second fiscal year, 0 otherwise www.emd.dk User's Guide energyPRO 4.6 Functions used only in Annual Key Figures In an account project there is an option of formatting a report with user defined key figures. To establish those key figures the following functions are available. Long version Short version CashAccount CA Depreciations D ExtraordinaryIncome EI FCAnnualMWh(ProductionUnit) FinancialExpenditures FE FixedAssets FA LongTermLiabilities LTL OperationExpenditures OE OtherCurrentAssets OCA OwnersCapital OC QI(value1;value2) Reserves Result Revenues R ShortTermLiabilities STL Tax T TransferredResult TR Table D.8: Functions available for defining annual key figures Most functions are available in both a long and a short version. Therefore, the function “OperationExpenditures” is equal “OE”. Both functions return the annual operation expenditures. CashAccount Returns the cash account from the income statement. Syntax CashAccount or CA Argument Description Returning value The Cash Account from the income statement of the actual fiscal year Returning unit <currency> Depreciation Returns the Depreciations from the income statement. Syntax User's Guide energyPRO Depreciation or D Functions in energyPRO 221 Argument Description Retur value The operation expenditures from the income statement of the actual fiscal year Returning unit <currency> ExtraordinaryIncome Returns the extraordinary income from the income statement. Extra ordinary income is grants defined in financing. Syntax ExtraordinaryIncome or EI Argument Description Returning value The extraordinary income from the income statement of the actual fiscal year Returning unit <currency> FCAnnualMWh Returns valued from a time series established under external conditions or demands Syntax FCAnnualMWh(Productionunit) Argument Description Examples Description Productionunit The name of a specific energy conversion unit. Returning value The annual fuel consumption measured in MWh Returning unit MWh/year Is to be used if the development in the annual fuel consumption is wanted in the annual key figures report. FCAnnualMWh(Woodboiler) The annual fuel consumption of energy conversion unit named “Woodboiler”. Financial Expenditures Returns the operation expenditures from the income statement. The financial expenditures include payment on loans an interest on cash account. Syntax FinancialExpenditures or FE Argument Description Returning value The financial expenditure from the income statement of the actual fiscal year Returning unit <currency> FixedAssets Returns the Fixed Assets from the balance sheet. The fixed assets is here the value of an investment which is still left for depreciation 222 Functions in energyPRO www.emd.dk User's Guide energyPRO Syntax FixedAsset or FA Argument Description Returning value The fixed asset from the balance sheet of the actual fiscal year Returning unit <currency> LongTermLiabilities Returns the long-term liabilities from the balance sheet. The long-term liabilities equal the remaining debt on loans. Syntax LongTermLiabilities or LTL Argument Description Returning value The long term liabilities from the balance sheet of the actual fiscal year Returning unit <currency> OperationExpenditures Returns the operation expenditures from the income statement. Syntax OperationExpenditures or OE Argument Description Returning value The operation expenditures from the income statement of the actual fiscal year Returning unit <currency> OtherCurrentAssets Returns short term liabilities from the balance sheet. Other current assets are revenues that are delayed. This could be heat produced in the last month of the fiscal year but paid in the start of the next fiscal year. Syntax OtherCurrentAssets or OCA Argument Description Returning value Other current assets from the balance sheet of the actual fiscal year Returning unit <currency> OwnersCapital Returns owners capital from the balance sheet. The owners capital is the owners capital defined as such in financing. Syntax OwnersCapital or OC Argument User's Guide energyPRO Description Returning value The Owners capital from the balance sheet of the actual fiscal year Returning unit <currency> Functions in energyPRO 223 QI Quality index is especially used in Great Britain to describe the “Quality” of an energy energy conversion unit. Syntax QI(el-factor;heat-factor) Argument Description Description El-factor heat-factor Quality coefficient for power Quality coefficient for heat Returning value Index Returning unit None QI defines the Quality Index defined as QI(el-factor;heat-factor) = el-factor*Efficiency power +heat-factor*Efficiency heat Efficiency power = EP/FC Efficiency heat =HP/FC Where: annual power supply (MWhe) EP= HP= annual heat supply (MWhth) FC= annual fuel use (MWh) El-factor is a coefficient for power, related to alternative electricity supply options. Similarly, heat-factor is a coefficient for heat generation, related to alternative heat generation options. These coefficients vary to reflect conditions affecting particular classes of CHP plant. For a project, which supplies electricity only, Efficiency heat is zero. For a project which supplies heat only, Efficiency power is zero. Example QI(200;125) Result Returns the Result from the income statement (after taxation). Syntax Result Argument 224 Functions in energyPRO Description Returning value The result from the income statement of the actual fiscal year Returning unit <currency> www.emd.dk User's Guide energyPRO Reserves Returns the reserves. Syntax Reserves Argument Description Returning value Reserves Returning unit <currency> Revenues Returns the revenues from the income statement. Syntax Revenues or R Argument Description Returning value The revenues from the income statement of the actual fiscal year Returning unit <currency> ShortTermLiabilities Returns other current assets from the balance sheet. Other current assets are operational payments that are delayed. This could be fuel used in the last month of the fiscal year but paid in the start of the next fiscal year. Syntax ShortTermLiabilities or STL Argument Description Returning value Other current assets from the balance sheet of the actual fiscal year Returning unit <currency> Tax Returns the tax payments from the income statement. Syntax Tax or T Argument Description Returning value The tax payments from the income statement of the actual fiscal year Returning unit <currency> TransferredResult Returns the transferred result from the income statement. Syntax TransferredResult or TR Argument User's Guide energyPRO Description Returning value The transferred result from the income statement of the actual fiscal year Returning unit <currency> Functions in energyPRO 225 226 Functions in energyPRO www.emd.dk User's Guide energyPRO Appendices A Import data from a spread sheet to a time series To import data from a spreadsheet into a time series it is important to use a date and time format used in energyPRO . To secure that the recommend way of doing this is to copy a line from an energyPRO time series into a spreadsheet. Start creating a time series for e.g. the ambient temperature in the External conditions folder. Type values for date and time in the first line. Press the Copy all button and the line is copied to the clipboard. Figure A.1: Time series with one value specified Open the spreadsheet to be used. In this example is used a spreadsheet with month, day and ambient temperature specified. User's Guide energyPRO Appendices 227 Figure A.2: Example of spread sheet with ambient temperature specified. Pasting the date and time from clipboard into the spreadsheet. Figure A.3: The date and time from energyPRO is now copied into the spread sheet. Use this format for date and time to create new columns for the ambient temperature: 228 Appendices www.emd.dk User's Guide energyPRO Figure A.4: Columns with the correct date and time format is now created. Now you can copy the columns into the time series in energyPRO: Figure A.5: Data from the spread sheet copied into the time series. User's Guide energyPRO Appendices 229 B How to save as a .pdf file A report can be saved in several formats. If you would like to e-mail the report to someone, the .pdf – format (or Acrobat Reader) often will be appropriate. In the Report Preview, you chose File and Save as. Figure B.1: Choose “File” and “Save as” in the Report Preview In the field “Save as type”, you can select the wanted format in the list. Figure B.2: Select the wanted format in the field “Save as type”. Paste into a document You can copy a report to the clipboard, either an image or as data. In the report, preview window you chose edit and then copy. Open a document and chose paste. 230 Appendices www.emd.dk User's Guide energyPRO C How to change the set-up in the graphic reports It is possible to customize the settings for the graphic reports. Maybe you want to change some colours or maybe you want to make the lines wider. Figure C.1: Graphic report to be changed. Double click on the chart to be able to change the setup. If you double click on the graphic, you got the opportunity to change the settings. Figure C.2: Changing the settings for the graphic. Now there is to edit the graphic. It is beyond the scope of this user’s guide to describe the facilities in details. Please note that in the version of energyPRO you cannot save your new settings as default values. The graphic report will turn into default values again, when you save the project. User's Guide energyPRO Appendices 231 D Interpretation of economy functions in calculation the operation strategy Net heat produciont Net cooling production 0 0 0 0 0 0 0 0 0 0 0 0 Energy conversion unit functions HP EP FC EC HC CP, CoolingProduction HoursOfOperation ElectricCapacity Turnons AccEP 1 ElProd/HeatProd FuelCon/HeatProd ElCon/HeatProd 0 - er ´1 skal den være det ???? CoolProd/HeatProd 1/HeatProd 0 0 0 0 0 0 Elcon/CoolProd 1 1 0 0 0 0 Other founctions HeatValue UnitOfDemand Month Index, Indeksfaktor TSMean, Unchanged Unchanged Unchanged Unchanged Unchanged Unchanged Unchanged Unchanged Unchanged Unchanged Unchanged Unchanged Functions at system level DeliveredElectricity *) ReceivedElectricity *) ReceivedFuel AccDeliveredElectricity AccReceivedElectricity AccReceivedFuel APeakDeliveredElectricity APeakReceivedElectricity PeakDeliveredElectricity PeakReceivedElectricity PeakReceivedFuel EP EC FC 0 0 0 0 0 0 0 0 0 EC 0 0 0 0 0 0 0 0 0 Function Demand functions HD ED CD PHD PeakElecLoadAnnual PeakElectricDemand Spot price functions SpotPricesXDeliveredElectricity Elec-Spotprice * DeliveredElectricity 0 232 Appendices www.emd.dk User's Guide energyPRO SpotPricesXReceivedElectricity Elec-Spotprice * ReceivedElectricity Elec-Spotprice * ReceivedElectricity SPxDE Elec-Spotprice * DeliveredElectricity 0 SPxRE Elec-Spotprice * ReceivedElectricity Elec-Spotprice * ReceivedElectricity Table 0.1: Interpretation of payment functions in energyPRO when calculating operation strategy *) if an electricity demand is present then the operation strategy is planned to cover exactly this demand. The consequence is a changed interpretation of “DeliveredElectricity” and “ReceivedElectricity” Function DeliveredElectricity ReceivedElectricity Return value 0 EC - EP The operation strategy is calculated as with one market with a few exceptions. The exceptions are the concerning the functions “DeliveredElectricity” and “ReceivedElectricity”. An overview of how those functions are interpreted in a two market situation is illustrated on the figure below. The interpretation of those function depend on a) whether an electricity demand is present and b) which market the energy energy conversion unit is attached to.D Where: Heatprod = Heat production capacity ElPprod = Electricity production capacity CoolProd = Cooling Production capacity ElCon = Electricity consumption capacity FuelCon = Fuel consumption capacity All in [MWh] or [kWh] User's Guide energyPRO Appendices 233 234 Appendices www.emd.dk User's Guide energyPRO E Interpretation of economy functions in calculation the operation strategy – Net Cooling production Function Demand functions HD ED CD PHD PeakElecLoadAnnual PeakElectricDemand Return value 0 0 0 0 0 0 Energy conversion unit functions HP EP FC EC HC CP, CoolingProduction HoursOfOperation ElectricCapacity Turnons AccEP 0 ElProd/HeatProd FuelCon/HeatProd ElCon/HeatProd 0 1 1/HeatProd 0 0 0 Other founctions HeatValue UnitOfDemand Month Index, Indeksfaktor TSMean, Unchanged Unchanged Unchanged Unchanged Unchanged Unchanged Functions at system level DeliveredElectricity *) ReceivedElectricity *) ReceivedFuel AccDeliveredElectricity AccReceivedElectricity AccReceivedFuel APeakDeliveredElectricity APeakReceivedElectricity PeakDeliveredElectricity PeakReceivedElectricity PeakReceivedFuel EP EC FC 0 0 0 0 0 0 0 0 Spot price functions SpotPricesXDeliveredElectricity SpotPricesXReceivedElectricity SPxDE Elec-Spotprice * DeliveredElectricity Elec-Spotprice * ReceivedElectricity Elec-Spotprice * DeliveredElectricity User's Guide energyPRO Appendices 235 SPxRE Elec-Spotprice * ReceivedElectricity Table 0.2: Interpretation of payment functions in energyPRO when calculating operation strategy *) if an electricity demand is present then the operation strategy is planned to cover exactly this demand. The consequence is a changed interpretation of “DeliveredElectricity” and “ReceivedElectricity” Function DeliveredElectricity ReceivedElectricity Return value 0 EC - EP The operation strategy is calculated as with one market with a few exceptions. The exceptions are the concerning the functions “DeliveredElectricity” and “ReceivedElectricity”. An overview of how those functions are interpreted in a two market situation is illustrated on the figure below. The interpretation of those function depend on a) whether an electricity demand is present and b) which market the energy production unit is attached to.D Where: Heatprod = Heat production capacity ElPprod = Electricity production capacity CoolProd = Cooling Production capacity ElCon = Electricity consumption capacity FuelCon = Fuel consumption capacity All in [MWh] or [kWh] 236 Appendices www.emd.dk User's Guide energyPRO User's Guide energyPRO Appendices 237