1
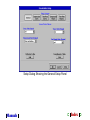
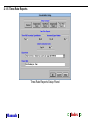
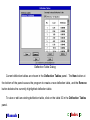
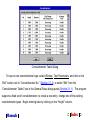
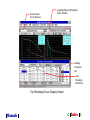
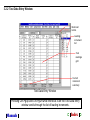
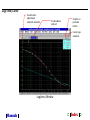
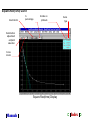
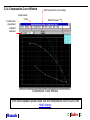
• The selection box listing "Fitted" and "Linear" determines whether the curve is drawn
by using a smoothed, mathematically generated shape (i.e. "Fitted"), or as a series of
straight lines drawn between readings ("Linear"). Each curve drawing option has its
own advantages and drawbacks: The “Fitted” method mathematically smoothes out
any time-rate readings that may not lie on an idealized curve form. For example, if the
sample quit consolidating temporarily due to friction between the sample and the ring,
a couple of data points on the time-rate curve may not accurately follow the actual
consolidation curve for the soil. The fitted curve will minimize the effect of problems
such as this.
However, because the fitted curve is an artificial model for a physical process, there
are curves for which an accurate model cannot be generated. Also, the curve fitting
process is much slower than the process of drawing point-to-point (linear) curves:
because the “Linear” method simply draws straight lines between adjacent time/dial
reading pairs, the time-rate window displays faster. The drawback to the linear method
Manuals
➲ Index ➲