1
Viewing graphs with smyrna
Arif Bilgin and Emden R. Gansner
January 11, 2011
1
smyrna User’s Manual, January 11, 2011
2
Contents
1
Introduction
1.1 File Format . . . . . . . . . . . . . . . . . . . . . . . . . . . . .
1.2 Visualization Modes . . . . . . . . . . . . . . . . . . . . . . . .
1.3 Querying, Filtering and Modifying Graphs . . . . . . . . . . . . .
3
3
4
4
2
Using smyrna
2.1 Opening a graph . . . . . . . . . . . .
2.2 Navigation . . . . . . . . . . . . . . .
2.3 Selection . . . . . . . . . . . . . . .
2.4 3D in smyrna . . . . . . . . . . . . .
2.5 Graphical Node and Edge Attributes .
2.5.1 Defining and setting attributes
2.6 General Graph Manipulation . . . . .
2.7 Topological Fisheye Views . . . . . .
.
.
.
.
.
.
.
.
.
.
.
.
.
.
.
.
.
.
.
.
.
.
.
.
.
.
.
.
.
.
.
.
.
.
.
.
.
.
.
.
.
.
.
.
.
.
.
.
.
.
.
.
.
.
.
.
.
.
.
.
.
.
.
.
.
.
.
.
.
.
.
.
.
.
.
.
.
.
.
.
.
.
.
.
.
.
.
.
.
.
.
.
.
.
.
.
.
.
.
.
.
.
.
.
.
.
.
.
.
.
.
.
.
.
.
.
.
.
.
.
5
5
6
6
6
7
7
7
8
smyrna Controls
3.1 smyrna Settings Widget . .
3.1.1 General Settings .
3.1.2 Labels . . . . . . .
3.1.3 Graph . . . . . . .
3.1.4 Magnifier Settings
3.1.5 Topfish Settings . .
3.1.6 Applying gvpr . .
3.1.7 Setting Attributes .
3.2 The Node List Widget . . .
.
.
.
.
.
.
.
.
.
.
.
.
.
.
.
.
.
.
.
.
.
.
.
.
.
.
.
.
.
.
.
.
.
.
.
.
.
.
.
.
.
.
.
.
.
.
.
.
.
.
.
.
.
.
.
.
.
.
.
.
.
.
.
.
.
.
.
.
.
.
.
.
.
.
.
.
.
.
.
.
.
.
.
.
.
.
.
.
.
.
.
.
.
.
.
.
.
.
.
.
.
.
.
.
.
.
.
.
.
.
.
.
.
.
.
.
.
.
.
.
.
.
.
.
.
.
.
.
.
.
.
.
.
.
.
8
10
10
11
12
14
14
16
17
19
.
.
.
.
.
.
.
21
22
23
23
23
23
23
24
3
4
smyrna Attributes
4.1 usermode . . . . . . . .
4.2 fonts . . . . . . . . . . .
4.3 colors . . . . . . . . . .
4.4 labels . . . . . . . . . .
4.5 alpha values . . . . . . .
4.6 Node shapes . . . . . . .
4.7 Node and Edge Attributes
A Modifying the smyrna GUI
.
.
.
.
.
.
.
.
.
.
.
.
.
.
.
.
.
.
.
.
.
.
.
.
.
.
.
.
.
.
.
.
.
.
.
.
.
.
.
.
.
.
.
.
.
.
.
.
.
.
.
.
.
.
.
.
.
.
.
.
.
.
.
.
.
.
.
.
.
.
.
.
.
.
.
.
.
.
.
.
.
.
.
.
.
.
.
.
.
.
.
.
.
.
.
.
.
.
.
.
.
.
.
.
.
.
.
.
.
.
.
.
.
.
.
.
.
.
.
.
.
.
.
.
.
.
.
.
.
.
.
.
.
.
.
.
.
.
.
.
.
.
.
.
.
.
.
.
.
.
.
.
.
.
.
.
.
.
.
.
.
.
.
.
.
.
.
.
.
.
.
.
.
.
.
.
.
.
.
.
.
.
.
.
.
.
.
.
.
.
.
.
.
.
.
.
.
.
.
.
.
25
smyrna User’s Manual, January 11, 2011
1
3
Introduction
smyrna is an application for viewing graphs. It allows the user to open a window
on a graph; navigate around the graph using pan and zoom; and select nodes and
edges with the mouse. The GUI provides various simple mechanisms for changing
the view of the graph and querying information about nodes and edges. In addition, smyrna allows the user to perform sophisticated querying and manipulation
of graphs.
Although it works with graphs of any size, smyrna was designed to handle large
graphs, on the order of 100,000 nodes and edges. It uses the OpenGL library which
allows it to take advantage of modern video cards’ graphics rendering features.
1.1
File Format
Currently, smyrna supports only the Graphviz DOT language. Please refer to
http://www.graphviz.org/Documentation.php
to get more information about the DOT language of Graphviz and the related attributes.
smyrna assumes the input graph has position information for all nodes. This is
supplied by the pos attribute, whose format is two or three numbers separated by
comma. Thus, for a node start, one might have
start [pos="23.5,288"]
If a graph is laid out using one of the Graphviz graph drawing programs, the position information is attached in this manner. For example, running the command
sfdp -o outgraph.gv ingraph.gv
will lay out the graph described in ingraph.gv and create the file outgraph.gv,
which can be used as input to smyrna.
All smyrna settings are stored as graph attributes. For example, you can change
the background color by setting the bgcolor attribute of the graph. Or the size
of a node can be altered by changing its size attribute. These attributes can
be modified through the smyrna GUI, using the built-in scripting (cf. 2.6), or by
simply changing the graph file itself.
Normally in smyrna, nodes are represented by filled disks, which can vary in
size and color. For smaller graphs, smyrna can render the more complex shapes
and styles available in Graphviz. This requires the nodes and edges in the graph to
have the necessary xdot attributes to describe the rendering. This can be achieved
by running the Graphviz layout with the -Txdot flag, e.g.
smyrna User’s Manual, January 11, 2011
4
sfdp -Txdot -o outgraph.gv ingraph.gv
For more information about xdot attributes and their formats, see
http://www.graphviz.org/doc/info/output.html#d:xdot
1.2
Visualization Modes
Smyrna has three display modes: 2D, 3D and topological fisheye. In 2D mode,
the graph is displayed in the plane. Navigation is limited to panning and zooming.
Any third coordinate in a node’s pos attribute is ignored. In 3D mode, the graph is
displayed using 3D graphics, allowing the user to rotate about the graph in addition
to panning and zooming. Any node whose pos attribute does not have a third
coordinate will be placed in the xy plane.
The topological fisheye mode [GKN05] presents a distorted, fisheye view of
the graph, in which the areas of the graph near to one or more focus nodes are
shown accurately, while the areas of the graph away from the foci become more
“compressed” the further they are from the foci. For large graphs, this allows
the user to see areas of interest clearly and in detail, while eliding detail away
from the foci. Unlike ordinary fisheye techniques, in which the distortion is done
geometrically, with remote nodes being drawn on top of each other, topological
fisheye is a specialized type of semantic zoom in which remote nodes are combined
into meta-nodes with induced edges, thereby maintaining the graph’s topology in
a coarsened form.
1.3
Querying, Filtering and Modifying Graphs
Beyond the simple viewing and navigating around a graph, smyrna also provides
machinery for querying properties of the graph, modifying the graph and creating
new graphs. The main engine for this is gvpr, a scripting language specifically
designed to edit graphs. By using gvpr, you can do almost anything related to
graphs, from counting the number of nodes with an attribute matching a given
regular expression to fairly complex graph algorithms.
One can use gvpr to read and write files. In particular, gvpr scripts can write to
stdout. This is implemented in smyrna but a console window, which is part of
the gvpr control tab (Section 3.1.6).
When gvpr changes the structure or attributes of the active graph, these changes
are reflected in smyrna. Conversely, nodes and edges that are selected have an
attribute selected=1, which gvpr can use to provide actions on selected nodes
and edges.
The use of gvpr is discussed in more detail in Section 2.6.
smyrna User’s Manual, January 11, 2011
2
5
Using smyrna
One starts smyrna as with any program, either using a command interpreter to
execute it or double-clicking on its icon. From the command line, it accepts a
single argument giving the file name of a graph to be viewed.
This will open a main window for smyrna similar to that shown in Figure 1.
The window has a fairly typical layout. There is a menu bar across the top, with
Figure 1: Typical smyrna view.
some additional widgets on the right side of it. There is a control bar of buttons
down the left side. The remainder of the window is the display area.
2.1
Opening a graph
If no file name is given on the command line, one can use File->Open to open
a graph file. This can also be used read in additional graphs. When a new graph
is read in, it is made the active graph, and the previous graph is added to the list
of open graphs. One can make an open graph the new active graph by using the
Active Graph menu at the top right of the main window, picking the desired
graph, and then clicking on the Activate button.
Being able to switch back and forth between open graphs can be useful when
analyzing graphs. However, due to resource consumption, one should avoid having
smyrna User’s Manual, January 11, 2011
6
too many open graphs. You can close a graph the same way that you activate it,
except clicking on the Remove button rather than Activate.
2.2
Navigation
To zoom in and out on a graph, you use the scroll wheel or ball on the mouse. Or
you can use the plus and minus magnifying glasses
on the left-hand icon bar.
To pan, click and hold down the left mouse button, and move the mouse. Releasing the mouse stops the panning.
Sometimes during navigation, you may find yourself in some obscure corner
of the graph, or you’ve lost the graph entirely. By clicking on the top button on
the left icon bar, the view is reset so that the graph is centered in the window, and
just large enough to fill it.
2.3
Selection
Smyrna has a notion of selected nodes and edges. To pick a single node or edge,
right click on it. The color will change to indicate the selection; in addition, an
attribute of the object may be displayed. You can use the Labels tab (Section 3.1.2)
to specify which attribute you wish to see. If right clicked a second time, the object
is unselected. Multiple objects can be selected.
One can also select multiple items by holding down the right mouse button and
sweeping out a region. One can do this multiple times; the selected set is the union
of all selections. What is selected is determined by the E and N buttons on the
control bar, which activate the selection of edges and nodes respectively. Initially,
only nodes can be selected.
The button at the bottom of the control bar can be used to unselect everything.
Choosing Edit->Node List opens the Node List widget (Section 3.2),
which provides a text view of the selected nodes. It also provides the opportunity to save the selected nodes as a subgraph.
2.4
3D in smyrna
To move from a 2D to a 3D view, click the button found in the control bar. Pan
and zoom are achieved the same way they are in 2D. For rotation in 3D, hold down
the left shift key, then click and hold down the left mouse button, and move the
mouse. Returning back to 2D is done by clicking the control bar button .
smyrna User’s Manual, January 11, 2011
2.5
7
Graphical Node and Edge Attributes
To display more information about the graph, especially attributes that may be associated with nodes or edges, one can use various display attributes. The principal
such attribute is color, stored as the color attribute in a node or edge. The attribute can be set already when the graph is read in, or it can be attached using
the Attribute tab or the Script tab of Settings widget. If the color is not explicitly
set, smyrna provides default values which can be set using the General tab of the
Settings widget.
For cluttered drawings, it can sometimes help to play down parts of the graph.
smyrna allows you turn off the drawing of either nodes are edges. There are check
boxes for this also on the General tab. You can also reach a middle ground by
having the edges or nodes drawn, but making them more transparent. To do this,
one uses the Node Alpha and Edge Alpha sliders on the Graph tab.
The Graph tab also provides a Node Size slider. With this, you can uniformly
increase or decrease the size of the nodes. If Node Shape is set to Spherical, you
can set the size attribute of nodes to get a variation in node sizes. The attribute is
used as a scale factor, so a size less than 1 will cause a node to shrink relative to
other nodes while a size greater than 1 will enlarge the node.
For large graphs, lack of screen space means you usually want to see nodes
drawn as small disks. This holds if Node Shape is set to either OpenGL dots or
Spherical. The former is quicker to draw, but at present does not allow varying
sizes among nodes. (The Custom shape is not implemented.) For smaller graphs
with xdot attributes attached, smyrna will use the xdot information to draw the
nodes and edges.
2.5.1
Defining and setting attributes
Attributes can be defined and set in smyrna using either the Attributes tab or gvpr
via the Script tab. For setting atttributes, the former works on the set of selected
nodes.
2.6
General Graph Manipulation
There are controls in smyrna for the most common operations such as navigation,
selection by mouse and simple attribute queries. For more complex selection criteria, and general analysis and manipulation of graphs, smyrna is integrated with
the gvpr graph processor. The main interface to gvpr is provided by the Script tab
(Section 3.1.6), though smyrna also uses gvpr for various internal operations.
To use gvpr, you write a script in the gvpr language, which is then applied
against an input graph. With the language, you can specify operations to be per-
smyrna User’s Manual, January 11, 2011
8
formed when the graph is first scanned; operations to be performed when each
node or edge is visited; and operations to be performed after all node and edge
processing has been done. Node and edge statements can have a boolean guard;
with this, the action is only performed if the guard is true. As a simple example,
the script
N[color=="blue"]{selected="1"}
causes gvpr to mark all blue nodes as selected.
Though gvpr is primarily designed for working with graphs, it incorporates
the C language expression model, and provides many general-purpose C-like functions such as printf and file I/O, string manipulation functions, and associative
arrays. A more complete discussion of the use of gvpr is outside of the scope of
this document. The reader is refered to the gvpr man page for further information.
2.7
3
Topological Fisheye Views
smyrna Controls
In this section, we describe the various controls making up the smyrna interface.
Figure 2 shows an example of the main smyrna display.
Across the top of the main window, there is a fairly standard menu bar. The
File pull-down menus offers the choices Open, Save, Save As and Quit. These
should be self-explanatory. The View menu allows you to make the console window a subwindow of the main smyrna window. The View menu also lets you open
the Node List widget, which gives information about the currently selected nodes.
This is considered in detail in Section 3.2. The Help menu provides access to
information about using smyrna but at present does nothing.
The Edit menu consists of two items: Smyrna Settings and Attributes. The
first activates the smyrna Settings Widget described in Section 3.1. This widget
provides access to the parameters controlling smyrna’s behavior, as well as providing some high-level manipulation of the graph. The second provides a short-hand
access to the Attributes tab (Section 3.1.7) of the Settings Widget.
On the right of the menu bar are controls for handling the loaded graphs. The
currently active graph is shown. The names of all available graphs are provided
in the associated pull-down menu. To switch between graphs, the user can pick
another graph from the menu, then click on the Activate button. Alternatively,
clicking on the Remove button closes the graph. This doesn’t appear to work.
The top buttons along the left of the main window serve as simple controls for
certain common actions.
smyrna User’s Manual, January 11, 2011
9
Figure 2: Typical smyrna view.
The top button is used to re-center the display.
The next two buttons allow you to zoom in and out.
The fourth top button is yet another shortcut for opening the Attributes tab (Section 3.1.7) in the Setting widget.
The bottom buttons are used to toggle between states in smyrna.
E N The top two, E and N, determine whether edges and nodes are selected when
doing an area selection. Programmatic selection or single selection by mouse
still works even if these are unset.
The buttons toggle between 2D and 3D display modes. If the pos attributes
of the nodes has only two coordinates, the z value is taken to be 0, and the
graph appears in the XY plane.
The fish buttons toggle between the normal and topological fisheye views
(Section 2.7).
The last button unselects all selected objects.
smyrna User’s Manual, January 11, 2011
10
3.1 smyrna Settings Widget
This is the main control panel for controlling the display parameters in smyrna.
It also provides two tabs for interacting with the graph: a high-level interface for
dealing with graph attributes, and a general-purpose interface for applying gvpr on
the graph. We discuss each tab individually in the following subsections.
Note that is necessary to click on the Apply button to cause the changes to
take effect.
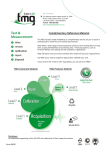
3.1.1
General Settings
The General Settings tab is shown in Figure 3. It provides control control over
the default color schemes, and whether or not nodes and edges are drawn or can
be selected. Clicking on one of the colors brings up a color selection widget that
allows you to modify the color.
Figure 3: The General Settings tab.
Background Color Specifies the background color of the window.
smyrna User’s Manual, January 11, 2011
11
Border Color Specifies the border color. If enabled, smyrna draws a rectangle
about the graph to indicate its limits. This attribute specifies what color is
used.
Grid Color specifies the color of grid points. If enabled, smyrna draws an array
of grid points behind the graph.
Default Node Color gives the color used to draw nodes, unless specified explicitly in the input graph.
Default Edge Color gives the color used to draw edges, unless specified explicitly
in the input graph or a color theme is selected.
Selected Node Color specifies the color used for selected nodes.
Selected Edge Color specifies the color used for selected edges.
This tab also provides check boxes to enable or disable various properties.
These can be used to turn off the drawing of nodes, edges, the border or the grid.
In addition, the ability to select nodes or edges using the GUI can be disabled.
smyrna provides a collection of color themes which can be selected using the
Color Theme menu. This specifies a color theme used to color edges with no
color attribute. Edge color calculations are based on an edge’s len attribute. A
different edge attribute can be specified using the Edge Attr. for Color
text box.
The Show Edges menu can be used to determine when edges are drawn.
Normally, an edge is drawn if any part of it appears within the view windows.
Sometimes, for clarity or efficiency, it is better to only draw those edges with at
least one node with the view.
3.1.2
Labels
The Labels tab is shown in Figure 4. This tab provides control over labels used
in smyrna. The Font menu can be used to set the face and standard size of the
OpenGL font used to display text labels. The Default Node Label Color
and Default Edge Label Color items can be used to specify which colors
are used for node and edge labels, respectively.
The user can tailor what attribute is used as the label for nodes and edges. This
is done via the Node Label Attribute and Edge Label Attribute
text boxes. For example, a graph representing Internet communication may benefit
from using a node attribute such as IPaddress or hostname. Note that, by default,
smyrna User’s Manual, January 11, 2011
12
Figure 4: The Labels tab.
the label comes from the pseudo-attribute name. For nodes, this is the name of the
node; for edges, the name is constructed from the names of its head and tail nodes.
Labels are shown when an object is selected. In addition, if the Show Node
Labels box is checked, labels are displayed for all nodes whenever one zooms in
close enough. Close enough is determined by the Labeling Level widget. The
smaller the number, the sooner labels appear as you zoom in.
3.1.3
Graph
The Graph tab is shown in Figure 5. With this tab, the user can affect more technical aspects of the graph view. The Node Shape menu allows the user to specify
how nodes are drawn.
OpenGL dots Nodes are drawn as filled circles as efficiently as possible. All
nodes will have the same size.
Spherical Nodes are drawn using OpenGL spheres. The advantage over OpenGL
smyrna User’s Manual, January 11, 2011
13
Figure 5: The Graph tab.
dots is that each node can have its own size specified by the size attribute.
The disadvantage is that it is not as efficient.
Custom At present, the choice is not implemented.
This tab provides three sliders. The Node Alpha and Edge Alpha sliders
control the transparency of nodes and edges. Set to 1.0, the object is opaque; set
to 0, the object is invisible. A typical use would be to set the edge alpha to a
small value rather than to turn off edge drawing entirely. The edges would still be
visible, but would obscure the drawing as much. These values are multiplied with
any alpha valued supplied with an edge’s or node’s color. The Node Size slider
can be used to uniformly scale the node size. Note that the node sliders have no
effect for custom nodes.
The Advanced Mode and Anti-aliasing check boxes toggle the advanced user mode and the use of anti-aliasing.
smyrna User’s Manual, January 11, 2011
3.1.4
14
Magnifier Settings
The Magnifiers tab is shown in Figure 6. This controls the magnifying glass parameters. The radius of the fisheye magnifier is specified using the Radius field. The
Figure 6: The Magnifiers tab.
Distortion field allows you control the distortion in the lens. Larger distortion
causes greater magnification.
3.1.5
Topfish Settings
The Topfish tab is shown in Figure 7. This allows you to specify the parameters
associated with a topological fisheye view of the graph as discussed in Section 2.7.
The # Of Fine Nodes field allows the user to set the number of the fine nodes
The Fine Node Label Attribute indicates what node attribute is used to label fine
nodes. The Coarsening factor and Distortion Factor fields control
some technical parameters of the view; refer to the paper for more details.
There are six check boxes.
smyrna User’s Manual, January 11, 2011
15
Figure 7: The Topfish tab.
Dist 2 Limit Distance to limit value of the algorithm What does this mean?
Animate Toggles whether animation is used to handle the transition from an old
focus to a new focus. Although more expensive, animation helps to preserve
the mental map of the graph.
Label Fine Nodes Indicates whether fine nodes are labeled.
Color nodes What does this do?
Label Coarse Nodes What does this do?
Label Focus Indicates whether the focus node is labeled. The focus node label is
displayed prominently whether or not the labeling of fine nodes is enabled.
The two Color extremes widgets allow you to set the colors used for the
finest and coarsest nodes. Colors of intermediate nodes are interpolated between
these two colors.
smyrna User’s Manual, January 11, 2011
3.1.6
16
Applying gvpr
The Script tab is shown in Figure 8. This is the main control for using gvpr scripts
to manipulate the active graph as discussed in Section 2.6. The top text window
Figure 8: The gvpr tab.
can be used to enter and edit a gvpr script. By then clicking on the Run gvpr
button, the script is run on the active graph. As usual, to update smyrna’s data
structures, you will need to click the Apply (or OK) button, and then click on the
main smyrna window to cause the the display to be refreshed.
By default, any changes are done directly to the active graph. Often, this is
appropriate. During exploratory data analysis, though, the user may wish to keep
the original graph unaltered in order to return to it later. Rather than trying to undo
any changes made, it is simpler to mark the Clone Current Graph checkbox.
In this case, a clone of the original graph is made. Then, the gvpr is applied to the
cloned graph, which then becomes the new active graph. The original graph can be
retrieved using the Active Graph menu at the top of the main smyrna window.
The obvious drawbacks to this mode are that there is the extra time needed to clone
smyrna User’s Manual, January 11, 2011
17
the graph, and the extra memory use for each copy.
A gvpr script accepts arguments, which are available via the ARGV[] array.
Normally, these would be provided on the command line. Here, the user can use
the middle Arguments text window to supply these.
In addition to manipulating a graph, a gvpr script can also perform I/O to a
stdout stream. This output appears in the console window, which is labeled
Output. The console window opened as part of the main smyrna window using
the View menu is another view of the same stream.
Finally, the Load and Save buttons support the re-use of gvpr scripts. Specifically, the Load button can be used to read in a file, whose contents are stored in
the gvpr script text window, overwriting any previously stored script. Conversely,
the Save button can be used to write the contents of the script text window into a
file for later use.
3.1.7
Setting Attributes
Manipulating attributes is a common task when using smyrna. Any such operations
can be done using gvpr. However, it seems reasonable to support this activity with
a simpler interface. The purpose of the Attribute tab is to provide this interface,
though it should be noted that the actual work is done using gvpr.
Figure 9 shows the initial state when the Attributes tab is opened. Note that
the caption indicates that some collection of nodes and edges has been selected.
To start, use the radio buttons to specify what type of graph object you wish to
Figure 9: The Attribute tab.
work with. Then type in the attribute’s name in the Attribute Name field. As
you type, the tab interface changes dynamically in response to your typing, giving
feedback concerning what it knows about available attributes. If what you have
typed is the prefix of a known attribute, all attributes with that prefix will appear in
smyrna User’s Manual, January 11, 2011
18
a list below. In Figure 10, the character ’s’ causes the various known node attributes
starting with ’s’ to be shown.
Figure 10: Typing in the Attribute tab.
Searching and modifying attributes If the current text fully matches a known
attribute, the background color of the Attribute Name field will appear
in green. In the example shown in Figure 11, the shape attribute has been
recognized and the default value is shown. In addition, you will see three
additional buttons: Apply, Apply All and Search.
Figure 11: A recognized attribute.
The Apply button is used to replace the attribute values of selected objects
of the specified object type. In our example, we have chosen the shape
smyrna User’s Manual, January 11, 2011
19
attribute, and have specified a value of box in the Value field. If we then
click the Apply, smyrna will set the shape value of all selected nodes to the
given value. Note that if no objects have been selected, the Apply button
will not be active.
The Apply All button is identical to the Apply button except that the
attribute change is performed on all objects, not just the selected ones.
The Search button is used to select objects of the specified object type
based on attribute values specified by regular expressions. For example, suppose that you have a network graph with IP addresses attached to each node.
You can type IP in the attribute name box, 10.* in the value box, and click
on the Search button. This will select all nodes whose IP address begins
with 10.. Regular expression matching is, obviously, based on the regular
expressions supported in gvpr.
Adding new attributes If, as you type, the attribute name is not currently set in
the graph for the specified object type, the Attribute Name field will be red
and a button with a plus sign (’+’) will appear, as in Figure 12. You can then
type in a value into the Default Value field, click on the ’+’ button and
the appropriate attribute will be created with the given default value, and all
objects of the given type that value for the attribute. Here, we have specified
a default value of ”yes” in the Default Value field. If we now click on the ’+’
button on the right, smyrna will create this new node attribute.
Figure 12: An unknown attribute.
3.2
The Node List Widget
It is often useful to be able to focus on certain nodes, and look at some of their
associated attributes. This can be done using gvpr(3.1.6), but this type of query
smyrna User’s Manual, January 11, 2011
20
is important enough that smyrna provides the special-purpose Node List widget.
This is opened by using the Edit menu. Figure 13 shows a typical view of the
widget. It lists all of the currently selected nodes. Selection could have been down
by clicking on the nodes, sweeping out a region, or via gvpr. The list always
Figure 13: The Node List widget.
gives the names of the selected nodes. You can specify additional attributes to
be displayed by setting the graph’s datacolumns attribute, which is a commaseparated list of the desired attribute names. Thus, in the example shown, the
graph has datacolumns="category,customer". To select new columns,
just run gvpr. For example, to switch the current two columns and add the tier
attribute, you would run the gvpr script
BEG_G{datacolumns="customer,category,tier"}
Note that, at present, you will need to close and then re-open the Node List widget
to get the new columns.
The widget provides four buttons that can sometimes be useful in this context.
The subgraph may be interesting enough that you wish to view it off-line. By
clicking the Save button, you can save the nodes as a separate graph. The Save
smyrna User’s Manual, January 11, 2011
21
with Edges button, the graph saved with the selected nodes and all edges in the
original graph between two selected nodes. The Hide All button will make all
of the selected nodes invisible; the Show All button makes them all visible.
4 smyrna Attributes
This section describes the various attributes used to control how smyrna works.
Unless otherwise noted, all attributes belong to the root graph.
The following table lists the principal attributes used by smyrna.
smyrna User’s Manual, January 11, 2011
Name
bgcolor
bordercolor
bordervisible
gridcolor
gridsize
gridvisible
defaultlinewidth
selectednodecolor
selectededgecolor
usermode
drawnodes
drawedges
drawlabels
defaultnodealpha
defaultedgealpha
defaultnodeshape
labelglutfont
nodelabelcolor
edgelabelcolor
nodelabelattribute
edgelabelattribute
labelwithdegree
labelnumberofnodes
shownodelabels
showedgelabels
colortheme
defaultnodecolor
defaultedgecolor
edgecolorattribute
nodesize
nodesselectable
edgesselectable
Description
Background color
Border color
Draw graph border (boolean)
Grid color
Grid size
Draw grid (boolean)
Default line width
Color of selected nodes
Color of selected edges
Advanced mode (boolean)
Draw nodes (boolean)
Draw edges (boolean)
Show node labels (boolean)
Overall alpha scale for all nodes. This value is
multiplied by a node’s alpha value.
Overall alpha scale for all edges
OpenGL dots (0); spheres (1); custom (2)
Glut font id to use to render labels
node label color
edge label color
Node attribute used as node label
Edge attribute used as edge label
Labels of high-degree nodes with rendered before
the ones with lower degree (boolean)
Maximum number of node labels to be rendered
Show node labels (boolean)
Show edge labels (boolean)
Color theme id for edges with no color attribute. If
unset, color is based on edge length; if set, edgecolorattribute is used
Default node color
Color of edges with no color attribute. Active only
when colortheme attribute is set to ”-1”
Set this attribute when you need a different value
other than edge length to calculate color themes
for edges
Overall node size scale
Enable visual selection tools for nodes
Enable visual selection tools for edges
Most of these attributes are self-explanatory.
4.1
usermode
What does this attribute do?
22
Default
white (#ffffff)
#38eb29
1
#6033d8
30
0
1
#8ce61d
#ffc0cb
1
1
1
1
0.8
0.5
0
0
#8ce61d
#8ce61d
name
name
0
45
1
1
1
blue
purple
50
1
1
smyrna User’s Manual, January 11, 2011
4.2
23
fonts
Explain font ids
4.3
colors
Explain color theme ids, default node and edge colors and edgecolorattribute
4.4
labels
name as pseudo-attribute
labelwithdegree labelnumberofnodes
4.5
alpha values
Explain defaultedgealpha defaultnodealpha
4.6
Node shapes
The node shape attribute determines the look, flexibility and performance associated with how nodes are displayed. If defaultnodeshape is set to 0, smyrna
uses OpenGL dots. This gives the best performance, but does not allow variations
in size. A value of 1 causes smyrna to use spherical node shapes. For large graphs,
this will cause some slowdown when panning and zooming. On the other hand,
one can set the size of each node individually via a node’s size attribute. Finally,
if 2 is used, smyrna will draw nothing.
smyrna User’s Manual, January 11, 2011
24
This table lists the attributes used by smyrnain the topological fisheye mode.
Name
topologicalfisheyefinenodes
topologicalfisheyecoarseningfactor
topologicalfisheyedistortionfactor
topologicalfisheyeanimate
topologicalfisheyelabelfinenodes
topologicalfisheyecolornodes
topologicalfisheyelabelfocus
topologicalfisheyefinestcolor
topologicalfisheyecoarsestcolor
Description
Number of the fine nodes in topological fisheye view
Coarsening factor of topological fisheye
Distortion Factor
Animate transitions (boolean)
Show fine node labels
Color nodes (boolean)
Show focus node labels (boolean)
Color of fine nodes
Color of coarse nodes
Default
50
2.5
1
1
1
1
1
red
green
The following attributes affect the magnifying glass widget.
Name
defaultfisheyemagnifierradius
defaultfisheyemagnifierdistort
Description
Radius of magnifier glass
Distortion value of magnifying glass
Default
350
5
The larger the distortion, the larger the magnification factor.
4.7
Node and Edge Attributes
At present, it is assumed that the input graph has been laid out. In particular, each
node should have a pos attribute specifying 2 or 3 real numbers giving the x and
y and, if applicable, z coordinates of the node.
edge pos If an edge does not possess a pos attribute, the edge will be drawn
as a line segment connect its end vertices.
If a node or edge has a color attribute, that will be used as its color. Similarly, a node may have a size attribute, which will affect the node’s size if
defaultnodeshape == 1.
If a node or edge has a visible attribute, that will be used to determine
whether to draw the object or not. By default, the object is drawn. To make an
object invisible, set visible = 0.
smyrna also checks for a draw attribute for nodes, edges and graphs. This is
assumed to be a valid xdot string describing how to render the object. If the graph
has a draw attribute, this will be drawn first to serve as a background for the
node and edges of the graph.
smyrna User’s Manual, January 11, 2011
A
25
Modifying the smyrna GUI
Explain attrs.txt and attr widgets.dot and mouse actions.txt
Note template.dot
References
[GKN05] E. R. Gansner, Y. Koren, and S. North. Topological fisheye views for
visualizing large graphs. IEEE Transactions on Visualization and Computer Graphics, 11:457–468, 2005.