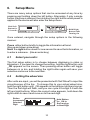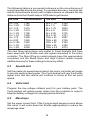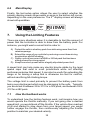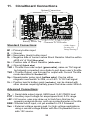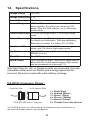
1
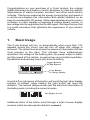
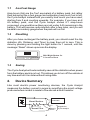
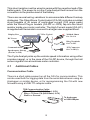
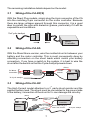
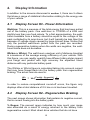
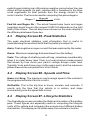
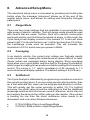
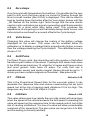
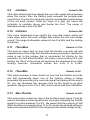
The Cycle Analyst
V2.3 User Manual
The Cycle Analyst 2.3
The Cycle Analyst is designed and produced
in Canada by:
Grin Technologies Ltd.
20 E 4th Ave
Vancouver, BC, Canada
V5T 1E8
ph:
(604) 569-0902
email: [email protected]
web: http://www.ebikes.ca
Author and Illustrator: Justin Lemire-Elmore
Copyright © 2013
Table of Contents
1.
Basic Usage . . . . . . . . . . . . . . . . . . . . . . . . 3
2.
Device Summary . . . . . . . . . . . . . . . . . . . . 4
3.
Installation . . . . . . . . . . . . . . . . . . . . . . . . . 6
4.
Display Information . . . . . . . . . . . . . . . . . . 8
5.
Additional Resetting Options . . . . . . . . . . 10
6.
Setup Menu . . . . . . . . . . . . . . . . . . . . . . . . 11
7.
Using the Limiting Features . . . . . . . . . . 13
8.
Advanced Setup Menu . . . . . . . . . . . . . . . 15
9.
Using Advanced Features . . . . . . . . . . . . 19
10. Operation in Wet and Cold Conditions . . 21
11. Circuitboard Connections . . . . . . . . . . . . . . 22
12. Specifications . . . . . . . . . . . . . . . . . . . . . . 23
2
Congratulations on your purchase of a Cycle Analyst, the original
digital dashboard and battery monitor designed to meet the specific
requirements of electric bicycles, scooters, and other small electric
vehicles. This device measures the energy consumption and speed of
a vehicle and displays this information and related statistics on an
easy-to-read backlit LCD screen. When appropriately wired to a motor
controller, it is also capable of imposing a custom speed, current, or
low voltage limit by regulating the throttle signal. We hope that you find
it a useful accessory that optimizes the experience of your electric
vehicle.
1.
Basic Usage
The Cycle Analyst will turn on automatically when more than 10V
appears across the circuit, and will turn off when this voltage is
removed. The default screen shows five pieces of information that are
most relevant to the rider. This includes three instantaneous
quantities: the voltage of the battery pack, the power output in watts,
and the speed of the vehicle; as well as two accumulated quantities:
trip distance and net amp-hours (Ah) from the battery.
Toggles Between
Ah and Distance
Press Buttons
to Change Display
A quick left or right press of the button will scroll through other display
screens of interest, while holding the right button will reset trip
statistics. The second display shows just the electrical information of
the battery pack, including the current in amps.
2nd Display Screen
Additional clicks of the button scroll through a total of seven display
screens, which are discussed in detail in section 4.
3
1.1
As a Fuel Gauge
Amp-hours (Ah) are the 'fuel' equivalent of a battery pack, but rather
than behaving like a fuel gauge and estimating how much fuel is left,
the Cycle Analyst instead tells you exactly how much you have used,
starting from 0 and counting upwards. For example, if you have an 8
Ah battery pack, and the Cycle Analyst shows 6.1 amp-hours
consumed, you would know there are just under 2 Ah remaining in the
battery. This will become quite intuitive after a few rides, and you will
be able to accurately gauge when the pack will run flat.
1.2
Resetting
After you have recharged the battery pack, you should reset the trip
statistics (Ah, Distance, and Time) to clear them all to zero. This is
done by pressing and holding the right button for 1 second, until the
message “Reset” shows up across the display.
Hold Right Button for
1 Second to Reset
1.3
Saving
The Cycle Analyst will automatically save all the statistics when power
from the battery pack is cut out. This allows you to turn off the vehicle at
any time and turn it on later without losing data.
2.
Device Summary
Like most electric power monitoring devices, the Cycle Analyst
measures the battery current in amps by amplifying the small voltage
produced when current is made to flow across a shunt resistor.
Battery
+
-
Motor
Controller
Shunt Resistor
V+
Current Flow
Shunt +
Shunt -
4
Signals for
Cycle Analyst
This shunt resistor must be wired in series with the negative lead of the
battery pack. The power to run the Cycle Analyst then comes from the
connection to the positive lead of the battery.
There are several wiring variations to accommodate different hookup
strategies. The Stand Alone Cycle Analyst (CA-SA) includes a molded
shunt capable of 45 amps of continuous current (100 amps peak)
while the Direct Plug-in models (CA-DP or -DPS) tap into the shunt
resistor inside your motor controller. The High Current model (CA-HC)
is supplied with terminals to connect to a larger user-supplied shunt.
60” Wire Typical
Display Box
Molded Shunt
for CA-SA
DC Power
Ring Terminals
for CA-HC
Communications
JST Connector
for CA-DP(S)
Speedometer Pickup
(Not in CA-DP)
The Cycle Analyst picks up the vehicle speed information using either
a spoke magnet, or in the case of the CA-DP device, through the hall
sensor signals from a brushless motor controller.
2.1
Additional Cables
Communication Cable
There is a short cable present on all the CA’s for communication. This
can be used both for logging data from the serial data stream using an
Analogger or similar device, or for reprogramming the CA with new
firmware using a USB-TTL adapter cable.
TRS Communication Cable:
Tip = RX into CA (9600 Baud, 0-5V)
Ring = TX from CA (9600 Baud, 0-5V)
Sleeve = Ground
To Analogger
or USB Adapter
5
DC Power Cable
There is an additional short cable from the device terminated with a
5.5x2.1mm power plug. This is connected to your battery voltage and
is protected by a 500mA polyfuse. It can be used for powering the
Lumenator headlights or other devices (such as DC-DC converters,
Analoggers) that run off your full battery voltage and draw less than 0.5
amps. It can not be configured as a 12V output.
Vbatt, 500mA Max
-
+
Protective Cap
This cable comes with a rubber cap to protect against corrosion or
inadvertent short circuits. It is important to leave the rubber cap on
the plug when you don’t have it connected to a device, especially if
you are running more than 48V.
3.
Installation
The Cycle Analyst display box comes with a mounting bracket for
installation on the handlebar of your bicycle. This bracket can rotate in
two axis to adjust the display position and fits bars from 22 to 36mm in
diameter.
Rotate to Adjust
Handlebar
Clearance
Cable Ties
Spoke Magnet
In the case of the CA-SA, CA-DPS, and CA-HC models, there is also a
speedometer pickup cable and spoke magnet. The pickup attaches to
the fork with two cable ties, and must be mounted to pass within 6mm
of the magnet for the speed readings to register. The magnet should
pass by the middle section of the sensor pickup, at the small band.
For systems like scooters or motorcycles that don’t have spoked rims,
a standard magnet can be attached with epoxy to a suitable location
on the wheel.
6
The remaining installation details depend on the model:
3.1
Wiring of the CA-DP(S)
With the Direct Plug models, simply plug the 6-pin connector of the CA
into the matching 6-pin connector on the motor controller. Because
there are large voltages present through this connector, it is a good
idea to protect the pins with dielectric grease, particularly if it will be
exposed to wet conditions.
To Cycle Analyst
Motor
Controller
3.2
Wiring of the CA-SA
With the Stand Alone version, wire the molded shunt in between your
battery and the motor controller. This is most conveniently done by
attaching connectors on the shunt leads which match your battery
connectors. If you have a switch in the system, it is best to wire the
shunt after the switch so that the Cycle Analyst powers down.
CNTRLR
To Motor
Controller
-
- BATT +
(Fuse)
+
On/Off
Switch
+
-
Battery
Connectors
To Cycle Analyst
3.3
Wiring of the CA-HC
The High Current model attaches to a 3rd party shunt resistor and the
positive battery lead. The shunt must be connected to the ground side
of the battery; connection of the shunt to V+ can damage the circuitry:
(Fuse)
+
+
-
Battery
+
Red to V+
On/Off
Switch
White to +Shunt
Blue to -Shunt
7
-
Motor
Controller
Black (Gnd) can go to
either side of shunt.
To Cycle Analyst
4.
Display Information
In addition to the screens discussed in section 1, there are 5 others
that show a range of statistical information relating to the energy use
of your vehicle.
4.1
Display Screen #3 - Power Information
Watt-hrs: This is a measure of the total energy that has been pulled
out of the battery pack. One watt-hour is 1/1000th of a kWh and
slightly less than one food calorie. To a first approximation, the watthours available from a battery should be equal to the voltage of the
pack multiplied by its amp-hours, but it will typically be less than this
because of voltage droop caused by large current draw. Notice that
only the positive watt-hours pulled from the pack are recorded.
During regenerative braking when the watts are negative, the watthours value does not decrease.
Wh/km or Wh/mi: The watt-hours used per unit of distance travelled
is a measure of the average energy efficiency of your vehicle. With
this figure, you can readily quantify how different riding styles impact
your range and predict with high accuracy the expected travel
distance with any particular battery pack.
The Wh/km or Wh/mi figure is calculated taking into account current
that may have flowed back into the battery pack from regenerative
braking. The actual formula used is:
Wh
Dist
=
1
Wh FwdAh - RegenAh Dist
FwdAh
)
(
In order to reduce computational round-off errors, the figure only
displays after a total distance of 0.5 km or mi has been travelled.
4.2
Display Screen #4 - Regenerative Braking
The next screen shows information that pertains to negative current,
that is current flowing into the battery pack.
% Regen: The percent regen indicates by how much your range
was extended as a result of energy returned to the battery from
regenerative current. Most direct drive vehicles that do not have
8
explicit regen braking can still produce negative current when they are
driven at high speeds. As well, vehicles with a freewheel in the drive
could regenerate for brief periods from the energy stored in the
motor’s inertia. The formula used for computing this percentage is:
%Regen
RegenAh
= FwdAh - RegenAh
X 100
Fwd Ah and Regen Ah : The actual forward amp hours and regen
(negative) amps hours to the nearest 0.0001 Ah alternate on the right
side of the screen. The net amp-hours shown on the main display is
the difference between these two.
4.3
Display Screen #5 - Peak Statistics
The peak electrical statistics yield information that is useful to
understanding the electrical limits that the battery is subject to.
Amin: Peak negative or regen current that was captured by the meter.
Amax: Maximum amperage that was drawn from the battery.
Vmin: The voltage of a battery pack will sag, sometimes considerably,
when it is under heavy load. Vmin is a local minimum measurement
that shows by how much your pack’s voltage droops under load.
Typically Vmin and Amax occur at the same point, and the maximum
power draw can be computed from Vmin*Amax.
4.4
Display Screen #6 - Speeds and Time
Smax and Savg: The maximum and average speed of the vehicle in
the programmed units of km/hr or mi/hr.
0h00m00s: This is the trip time in hours, minutes, and seconds. It
counts only the time that the vehicle is in motion, and stops
incrementing once the speed falls to zero.
4.4
Display Screen #7 - Lifecycle Statistics
The final display screen provides the lifetime information of the battery
pack. These figures are especially useful in computing the lifecycle
costs of the vehicle and comparing the economics of different battery
chemistries. This display is not shown when the vehicle is in motion.
9
Cycl: The cycles value increments when the meter is reset. Provided
that the meter is reset each time the battery is charged then this will
indicate the number of charge and discharge cycles on the pack. In
order to prevent false cycle counts from cases where frequent
resetting is performed, the value is only incremented if more than 1.6
amp-hours was drawn at the time of the reset.
TotAh: The total battery amp-hours is a running sum of battery use
over its life to the nearest 1Ah.
TotMi or TotKm: This is the odometer function, showing the total
distance that has been travelled on the battery pack.
5.
Additional Resetting Options
In addition to a regular reset to clear the trip distance, time, and amphour data (see Section 1.2), there are two other reset possibilities.
5.1
Peak Reset
In some instances for diagnostic and performance testing, it is
desirable to clear only the peak statistics (Amax, Amin, Vmin, and
Smax) without resetting anything else. This can be accomplished by
holding the right reset button when the display is showing Amin, Amax,
and Vmin. The message "PEAK STATS RESET" will appear on the
screen and only the previously mentioned values will be cleared.
5.2
Full Reset
When it is time to switch battery packs, then the battery cycle count,
lifetime amp-hours, and total distance can be zeroed by performing a
full reset on the system. This is accomplished by continuing to hold the
button for 6 seconds after "RESET" is displayed. The message "FULL
RESET" will appear to indicate that all stored data has been cleared
from memory. Notice that a Full Reset does not restore any of the gain
or calibration values that may have been changed in the setup menu.
The default values for these are shown in Section 8.
10
6.
Setup Menu
There are many setup options that can be accessed at any time by
pressing and holding down the left button. Alternately, if only a single
button interface is desired, then holding the right button while power is
applied to the device will also enter the setup menu.
Hold Left
Button for
2 Seconds
or
Hold Right
Button while
Turning On
Once entered, navigate through the setup options in the following
manner:
Press either button briefly to toggle the information at hand.
(like up and down arrow keys)
Hold the right button down for one second to save that information, or
to enter a submenu. (like an enter key)
6.1
Select your units:
The first setup option is to choose between displaying in miles or
kilometers. If you want to change the setting, hold the right button until
_OK appears on the screen. Then pressing either button will toggle
between mi or km, and holding the right button again will save your
selection and move to the next item.
6.2
Setting the wheel size
After units are input, you will be presented with 'Set Wheel' to input the
circumference of the tire. To change this to your actual wheel size,
hold the right button until _OK appears in the bottom right hand corner.
Then the first digit will flash, and you can cycle it through 0-9 with the
left and right buttons. When the correct value appears, hold down the
right button to save it and move on to the next digit.
Button
Increments
Selected
Digit
Hold Button
for _OK to
Save and go
to Next Digit
11
The following table is a convenient reference on the circumference of
several popular bicycle tire sizes. For greatest accuracy, measure the
actual circumference directly with a tape measure or compare the trip
distance from the CA with map or GPS data to get it exact.
Tire Size
Circumference
Tire Size
Circumference
16 x 1.50
16 x 1 3/8
20 x 1.75
20 x 1-3/8
24 x 1-1/8
24 x 1-1/4
24 x 1.75
24 x 2.00
24 x 2.125
26 x 1-1/8
26 x 1-3/8
1185
1282
1515
1615
1795
1905
1890
1925
1965
1970
2068
26 x 1-1/2
26 x 1.5
26 x 1.75
26 x 2.0
26 x 2.25
26 x 2.35
700c x 23
700c x 28
700c x 32
700c x 38
700c x 2.0
2100
1995
2035
2075
2115
2131
2097
2136
2155
2180
2273
The next three setup items only matter to Cycle Analysts that have
been wired with the throttle over-ride signal connected to the motor
controller. The Direct Plug-in models already have this appropriately
connected, but the Stand Alone and High Current version require
additional wiring for these settings to have any effect.
6.3
Speed Limit
Set the maximum speed beyond which the motor controller will cease
to provide useful output power. The Cycle Analyst will vary the throttle
signal such that the vehicle will continue to cruise at this set point
speed.
6.4
Volts Limit
Program the low voltage rollback point for your battery pack. The
Cycle Analyst will reduce power drawn from the controller in order to
keep the battery voltage from dropping below this limit.
6.5
Max Amps
Set the upper current limit. If the Cycle Analyst senses current above
this value, it will scale down the throttle appropriately to reduce the
amperage draw.
12
6.6
Main Display
Finally, the last setup option allows the user to select whether the
primary display screen shows watts or amps in the bottom left corner,
depending on the user preference. The 2nd display screen will always
show both quantities.
Select
Watts
or
Amps
7.
38.4 V 25.6 kph
3.13 A 6.214 Ah
Using the Limiting Features
There are many situations when it is desirable to limit the amount of
power that the controller is able to draw from the battery pack. For
instance, you might want a current limit in order to:
A) Protect the cells in a battery pack from delivering more than their
rated amperage
B) Extend the range of your vehicle by reducing current draw during
acceleration and hill climbing
C) Safely cycle at low current a NiMH or NiCad pack that has been
sitting unused for a long period
D) Keep the motor's power within a legally stipulated power limit
A speed limit can help make any electric bicycle abide by the legal
speed caps that exist in most jurisdictions while not affecting
performance below that speed. It can also be useful for extending the
range or for taming a setup that is otherwise too fast for comfort,
without sacrificing hill climbing torque.
The voltage limit is used primarily to prevent the battery pack from
being over discharged which can be damaging to the cells. Typically,
you would set it between 29 to 31V for a 36V pack, and between 39 to
41V for a 48V pack.
7.1
How the feedback works
To understand how the limiting features work, just imagine how you
would operate the throttle manually. If you are going over a desired
speed limit, you would back off the throttle. If the vehicle then reached
a hill and started to slow down from your target speed, you would
further engage the throttle, thus continuously adjusting the throttle
position to maintain your desired velocity.
13
The Cycle Analyst behaves similarly. When it senses that any one of
the limiting quantities has been exceeded, then the throttle output
signal starts to decrease from its resting value of ITermMax until the
limit is no longer exceeded. A simple circuit is required so that the
controller only sees the lower value of the throttle signal or the Cycle
Analyst signal. This is generally achieved with a diode as follows,
which is included in the ThD output pad:
Diode
5V
Throttle
Resistor
Throttle Output of
Cycle Analyst
G
Throt Signal
Throttle Signal
inside Controller
2 - 10 k
There are various setup options which control the speed at which the
Cycle Analyst responds to these signals. If the settings are too fast,
then the control can be twitchy or oscillate around the desired value,
while gain settings that are too low will cause a lag time before the
limiting kicks in.
7.2
PI Controller
Each of the three limiting features is implemented as a digital Intergral
or Proportional/Integral (PI) controller. The actual output for speed
regulation is computed as follows:
ITerm = Previous ITerm + IntSGain*(Set Speed - Actual Speed)
Clamp: ITermMin < ITerm < ITermMax
Throttle Ouput = ITerm + PSGain*(Set Speed - Actual Speed)
Similar values are calculated with the current limit and low voltage
limit, and the smallest of the three over-ride terms is the throttle output
voltage. If this output is less than the user’s throttle voltage, then it is
the Cycle Analyst which is ultimately controlling the vehicle.
7.3
Tuning the feedback
The ability of the Cycle Analyst to limit the speed, current, or low
voltage in a fast yet smooth manner depends on setting the
appropriate Gain terms for the feedback loop. The default values work
well for ebike setups in the 300-600 watt power range. For more
powerful systems, they will usually lead to the vehicle oscillating
around the programmed set point rather than holding steady. In this
case, it is necessary to tone down the appropriate feedback gains in
the advanced setup menu.
14
8.
Advanced Setup Menu
The advanced setup menu is accessed by pressing and holding the
button when the message 'advanced' shows up at the end of the
regular setup menu, and allows for setting less frequently changed
parameters.
8.1
Range Mode
There are two mode settings that are available to accommodate the
wide scope of electric vehicles. The high range mode should be used
with shunts that are under 1mOhm, such as in electric motorcycles
and small electric cars that draw hundreds of amps. In this mode, the
Cycle Analyst will display current to the nearest 0.1 A and will show
power in kW. For shunts that are over 1 mOhm but less than 10 mOhm,
the LowRange mode must be selected. This will increase the
resolution to 0.01 A and shows your power in Watts.
8.2
Averaging
In an electric vehicle, the current and voltage can fluctuate rapidly
under normal use, making the instantaneous values difficult to read.
These values are averaged before being display. Short averaging
times allow you to get a better real time feel for the power fluctuations,
while longer averaging times produce a stable reading that is easier to
record. The range is 1-7, which correlates to 0.02 seconds to 1.3
seconds between display updates. The default setting is 5 (0.28 sec).
8.3
Set Rshunt
The Cycle Analyst is calibrated by programming a resistance value for
the current sensing shunt. If you are using a known shunt resistor, then
as a first estimate this value can be programmed directly in mOhm.
This will usually get the meter accurate to within 3%. For highest
accuracy, the shunt value should be calibrated so that the displayed
amperage matches that of a known current reference, which may not
be precisely the same as the mOhm rating on the resistor. If the current
is reading too low then the shunt resistance value needs to be
decreased, and vice versa. Allowed values are:
· 0.78 to 9.999 mOhm in Low Range Mode
· 0.078 to 0.9999 mOhm in High Range Mode
15
8.4
Zero Amps
Over time and with temperature fluctuations, it is possible for the zero
point to drift, such that even when no current is flowing through the
shunt a small number (like 0.03A) is displayed. This can be reset to
zero by holding down the button after the 'zero amps' screen until the
_OK flashes on the bottom right. Note though that the wire shunts
used in motor controllers are prone to generating small thermoelectric
voltages for a short while after being used. This produces the
appearance of a lingering current that slowly decays back to zero, and
it should not be confused for a current offset in the Cycle Analyst.
8.5
Volts Sense
Changing this value will change the scaling of the battery voltage
displayed on the screen. This value can be modified either for
calibration or to display a voltage that is proportionally higher or lower
than the voltage powering the Cycle Analyst. The calibrated value is
close to 31.0.
8.6
Set # Poles
For Direct Plug-in units, this should be set to the number of hall effect
transitions per rotation of the wheel. Crystalyte 400 series hubs have
8, the 5300 series hubs have 12, while the ‘H’ series and Crown motors
and most generic hubs have 23 poles. For units that use a
speedometer sensor and spoke magnet, #poles should be set to 1,
unless you have multiple magnets on the wheel. Max poles is 99.
8.7
PSGain
Default = 0.08
This is the Proportional Speed Gain for the over-ride output. It can
decrease the response time and reduce overshooting the set point
speed, but at the risk of causing rapid vibrations if it is too high. The
range can vary from 0 to 0.99 V/kph or V/mph.
8.8
IntSGain
Default = 200
This value determines how rapidly the over-ride output will ramp down
when the speed of the vehicle exceeds the limit speed. Increasing this
value will speed up the response time for the speed control, but at the
risk of causing oscillations. Too low of a value will allow considerable
overshoot of the speed limit. The gain value can range from 0 to 999,
and the scaling is currently arbitrary.
16
8.9
IntAGain
Default = 300
This value determines how rapidly the over-ride output will ramp down
when the current from the battery pack exceeds the programmed
current limit. Too low of a value will result in considerable overshooting
of the set point current, while too large of a gain will cause the
controller to oscillate above and below the limit. The range of
allowable values is from 0 to 999.
8.10
IntVGain
Default = 800
This value determines how rapidly the over-ride output signal will
scale down when the pack voltage falls below the set low voltage
cutout. The range of allowable values is from 0 to 999, and the scaling
is arbitrary.
8.11
ITermMax
Default = 3.79V
This puts an upper limit on how high the throttle over-ride will drift
upwards when none of the limit values are being exceeded. Ideally this
value is set to the voltage that is considered full throttle by the
controller. For hall effect throttles, full power occurs at about 4V, and
limiting the ITerm to this value will speed up the response time of the
limiting features. Allowable values are from 0 to 4.99V.
8.12
ITermMin
Default = 0.0V
This value imposes a lower bound on how low the throttle over-ride
can drift downwards when one of the limiting values is being
exceeded. By preventing the over-ride signal from going all the way to
0V, you can decrease the recovery time for the signal to go back
upwards. Range is from 0 to 4.99V, and must be less than ItermMax.
8.13
Max Throttle
Default = 4.99V
This value puts a maximum cap on the throttle output signal. It can be
used to simulate a lower speed motor by simply clamping the throttle
signal to a value between 0 to 5V. Be aware that the majority of hall
effect throttles only operate from 1V to 4V, and so the desired setting to
reduce the speed would fall in this range (less the diode voltage drop).
17
8.14
Set Ratio
Default = 0.100
This is the amplification ratio between the high gain and low gain
current amplifiers on the circuit board. It is usually around 0.10, is
factory calibrated, and should not be changed.
8.15
Serial Output
Default = 1Hz
This allows you to select between either a 1Hz or a 5Hz transmission
rate on the Tx serial data output pad. 1Hz is good for general purpose
datalogging, while the faster 5Hz rate can be useful for dynamic
analysis of vehicle performance.
8.16
Set TotDist, Set TotAhrs, Set TotCyc
The next three screens enable you to preload or edit your life cycle
usage statistics: the total odometer distance, the total amp-hours you
have taken from the pack, and the total number of discharge and
charge cycles on the battery.
8.17
Aux Voltage Function
Default = OFF
This allows you to set the function of the auxiliary input voltage line
(Pad labeled POT) on the Cycle Analyst circuit board. You can choose
whether this line is ignored (default) or if it is used for on-the-fly
regulation of either the speed limit or the current limit via a
potentiometer or other variable voltage source.
8.18
Aux Threshold
Default = 0.99V
The auxiliary voltage input is scaled over a 3V input range to be
compatible with hall effect throttles. You can set the threshold where
this voltage kicks in. For instance, if the threshold is 0V, then the input
range is 0-3V. If the threshold is set to 1V, then the input range from
zero to full scale is 1-4V, matching the range of most ebike throttles.
8.19
Vshutdown
Default = 10V
This setting controls the voltage point at which the CA saves all data
and powers down. If the value is too low, data may not save correctly. It
is possible to operate down to a 7V shutdown if the backlighting LED is
bypassed with a short.
18
9.
Using Advanced Features
There are several advanced features on the Cycle Analyst, but making
use of these may require soldering to the circuit board. Incorrect wiring
can damage the unit and it is only recommended for those who are
familiar and comfortable with electronics.
9.1
Using the Data Output
The TRS communications cable transmits a serial data stream with
the current stats of the vehicle. The format is tab-deliminated ASCII
text at a 9600 baud rate. After power-up, the CA outputs a header line,
and then at a rate of once a second or 5 times a second (see section
8.15) it transmits the amp-hours, voltage, amperage, speed, and
distance as shown here:
Ah
3.296
3.299
3.302
3.306
3.308
3.307
:
V
47.62
47.49
47.43
47.85
49.36
49.55
:
A
10.04
13.22
13.45
6.02
-1.43
-3.69
:
S
15.32
16.41
17.30
17.52
17.17
16.05
:
D3
8.9132
8.9175
8.9220
8.9268
8.9317
8.9365
:
The data is at 0-5V CMOS voltage levels, making it easy to interface
directly to other microcontrollers. In order to log the data to a regular
computer or laptop, it is necessary to either level shift the signal to be
compatible with RS-232 voltages and run it to the computer serial port,
or use a TTL->USB converter for feeding into the USB port.
PC or Laptop
TTL->USB Adapter
Alternately, the data can also be saved while riding
directly to an SD memory card using the separate
Cycle Analogger device:
Data on MicroSD card
9.2
On-the-fly Current or Speed Limit
There are situations where it may be desirable to adjust the speed or
current limit of the Cycle Analyst without having to change the settings
in the setup menu. This can be accomplished by wiring a
potentiometer such that it sends a voltage signal to the POT pad:
(R2 2K7)
5V
Aux Signal
R1
5K Pot
Gnd
The optional resistor R2 is used to reduce the potentiometer wiper
range from 0-5V to just 0-3V so that the entire turn range is utilized. In
the advanced setup menu, you can select whether this voltage
regulates the current limit or the speed limit, and it will scale the limit
between 0 and the speed/current limit programmed in the setup menu.
9.3
Current Throttle or Cruise Control
In other cases, it may be advantageous to use the Cycle Analyst to
directly regulate the motor controller rather than just limiting the power
via a throttle over-ride function. The example below shows how to wire
up a “current throttle”, such that the regular throttle signal is
intercepted by the Cycle Analyst, which takes this as the command
current. The Cycle Analyst then sends it’s own throttle output signal
along to the controller.
Input Signal from Throttle
Throt Output
Signal from CA
ThO
+5V G POT
(Optional 5V
Throttle Power)
Throttle
(CA PCB)
Motor
Controller
Gnd
5V Throttle Power from Controller
In this manner, if full throttle is set to be 20 amps, then by riding half
throttle, you could ensure exactly 10 amps are drawn from the battery
regardless of the vehicle speed, giving the user more direct control
over their power usage. Similar setups can be used to implement
accurate speed control systems. Note that it is essential to set the
AuxVoltage input (see 8.17) to either the current or speed limit first,
otherwise the system will take off at full power when turned on.
20
9.4
Firmware Programming
The Cycle Analyst V2.3 and later devices have an onboard bootloader
that enables firmware updates via the communications cable, with no
need to flash the device using a dedicated microchip programmer.
Instructions and downloadable software for updating the firmware will
be provided on the www.ebikes.ca website as new firmware
becomes available. Firmware programming requires a USB->TTL
cable, or for those who are old school, a TTL->RS-232 level shifter and
a vintage computer equipped with a serial port.
10.
Operation in Wet and Cold Conditions
The Cycle Analyst enclosure contains a clear sealed window to protect
the circuitboard and LCD from water exposure. There is generally no
problem using the meter in light rain or heavy rain, so long as the meter
is upright if the with the cables exiting downwards. The open holes in
the bottom allow the device to breath to prevent condensation issues.
That said, there have been occasional instances of water ingress into
the button keypad circuitry that has caused the buttons to misbehave.
If this happens, please contact your dealer for a replacement front
enclosure casing. Also, if the enclosure is ever opened up, it is
important to re-apply a bead of silicone sealant around the seam so
that it is properly waterproofed again on reassembly.
The LCD screen is specified to operate between -10oC to 50oC. At the
colder end of the temperature range, the response time of the LCD
segments is slow, and so rapidly changing digits and screen changes
will appear as a blur. The underlying operation of the internal circuitry
is unaffected. At high temperatures in direct sunlight, the display
characters may become quite dark, but will return to normal once the
unit has cooled off.
21
11.
Circuitboard Connections
Standard Connections
Optional Connections
Battery Power Tap
Character LCD Header
Standard Connections:
(Solder Jumper
for using Vex
Voltage Sensing)
B1 = Primary button input
G = Ground
B2 = Secondary (back) button input
S- = Negative side of current sense Shunt Resistor. Must be within
±400 mV of Gnd (blue wire)
S+ = Positive side of Shunt Resistor (white wire)
G = Ground (black wire)
ThD = Throttle Over-ride output (green wire), same as ThO signal
but already connected via a diode to pull down user’s throttle.
ThO = Throttle Output, use this pad for output with Current Throttle
mode described in Section 9.2
Sp = Speedometer pulse input (yellow wire). Can be either
magnetic reed switch to Gnd, or a 0-5V / 0-12V hall signal
V+ = Positive lead to battery pack (red wire), can be shared with
other devices requiring battery power that draw under 500mA
Advanced Connections:
Tx = Serial data output signal, 9600 baud, 0-5V CMOS level
POT = Auxiliary input voltage for amps/speed limit, 0-5V range.
+5V = 5V source, user may draw up to 5mA from this line for
powering external device, such as a potentiometer or throttle.
EBK = Ebrake cutoff input, not yet enabled in V2.3 firmwarel
Vex = External voltage sensing pad, for high voltage applications
using a remote voltage divider with the CA powered from a
safe 12V source.
22
12.
Specifications
Voltage Range
10-150V
Voltage Resolution 0.1V
Current Draw
10mA
Current Range
±200 mV/Rshunt. For instance, with a 2mÙ
sense resistor, the maximum current is 100
amps. With a 0.5mÙ resistor, up to 400 amps,
and so forth
Current Resolution 0.01A in low range mode, 0.1A in high range
mode
Current Accuracy
Temperature coefficient and accuracy depend on
the shunt and calibration. With pre-calibrated
Stand Alone model, it is within 2% ± 0.06A
Trip Ah and Wh
Up to 1999 Ah and 19999 Wh in low range
mode, and 10x this in high range mode.
Up to 1999 km or mi. Odometer rolls over at
99999 km or mi
0 to 9999 mm
Trip Distance
Wheel Size
Speed Range
Up to 600 kph or mph. There is an upper limit of
about 500 Hz for the speed sensor input, which
can be increased by removing C12
Note that if any Ah, Wh, or Distance limits are exceeded, then the
calculated values such as Wh/km and average speed will be
incorrect. Be sure to reset after each battery recharge.
CA-DP(S) Connector Pinout :
Cycle Analyst Side
Controller Side
1 = Vbatt (Red)
2 = Ground (Black)
3 = Shunt - (Blue)
4 = Shunt + (White)
5 = Speed (Yellow)*
6 = Throttle Over-ride (Green)
-1-2-3-4-5-6-
6-Pin JST-SM Series Connector
*In CA-DPS devices, the yellow wire is not soldered on the circuitboard, as
the external speedo sensor uses the Sp pad.
23