1
their names, the watersheds and their names, the county boundaries and the location of the
wastewater outfalls by checking the boxes on the left side of the screen.
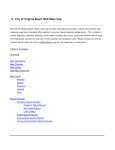
View active and inactive sites by TCEQ Region (or major city)
Click Query by Region Map
This will take you to a page showing
all 16 of the TCEQ Regions and
list. Click on the basin you would
like to see on either the map or the
list. This will take you to a map of
Texas with all the basins shown in
different colors and drops marking
historic and current sampling sites
for the selected TCEQ Region only.
The region boundaries are not
shown on the map. Gray drops are
historic monitoring sites. Red drops
are current monitoring sites. Scroll
over the drops to see the name of
the site and click on the drop to
select the site and see the recorded
data. You can choose to see only
the active sites, only the inactive
site, the streams and their names,
the watersheds and their names, the
county boundaries and the location
of the wastewater outfalls by checking the boxes on the left side of the screen.
Created: April, 2012
5