1
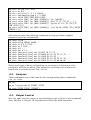
sp_circ
sp_circ
sp_circ
sp_circ
sp_circ
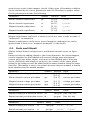
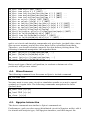
sc SCX [SCY SCZ]
bc 0|1
gc|rc|cc|lc X Y Z VALUE
vpe|vpm|ipe|ipm X Y Z PORT
vd|id PORT DIRX DIRY DIRZ
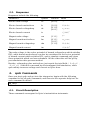
sp_stim vs|is PORT
sp_stim vs|is PORT
sp_stim vs|is PORT
[PW [PER]]]]]]
sp_stim vs|is PORT
[PHASE]]]]]
[ac [MAG [PHASE]]] [dc [VALUE]]
[ac [MAG [PHASE]]] [pwl T1 V1 [T2 V2 ...]]
[ac [MAG [PHASE]]] [pulse V1 V2 [TD [TR [TF
[ac [MAG [PHASE]]] [sin VO VA [FREQ [TD [THETA
spdc also provides the following commands to help you draw complex
geometric patterns conveniently.
sp_draw
sp_draw
sp_draw
sp_draw
sp_draw
sp_draw
sp_draw
sp_draw
sp_draw
sp_draw
sp_draw
ls|rm ...
mv|cp PARAM VALUE ...
im X Y Z FILE ...
ex Z FILE ...
all ...
new X Y Z ...
[mov|ext][drw] shf N DIST TX TY TZ ...
[mov|ext][drw] rot N PHASE PX PY PZ TX TY TZ ...
[mov|ext][drw] pnt N SCALE PX PY PZ ...
[mov|ext][drw] axs N SCALE PX PY PZ TX TY TZ ...
[mov|ext][drw] pln N SCALE PX PY PZ NX NY NZ ...
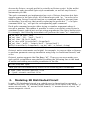
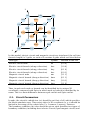
Notice each type of data's cell position; to set value to a datum out of its
position(s) will take no effect. One method to avoid this is to extend your
pencil size to at least the cell size, 2×2×2.
4.2.
Analyses
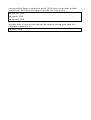
These commands are as the same as the corresponding Spice commands
(.op, .ac, .tran).
sp_op
sp_ac lin|oct|dec N FSTART FSTOP
sp_tran TSTEP TSTOP [TSTART]
4.3.
Output Control
Not only spdc can plot curves of waveform/spectrum as Spice's .plot command
does, but also it can plot 3D distributions of data like field simulators.