1
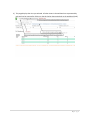
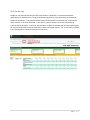
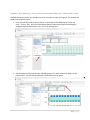
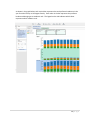
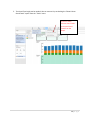
As shown in the graph below, each vertical bar represents the total professor headcount in the
year for either Faculty or Contingent Faculty. Each colour in the bar represents the professor
headcount belonging to an academic rank. The legend on the side indicates which colour
represents which academic rank.
29 | P a g e