1
EXAMPLE: CONNECTING LUG
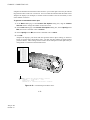
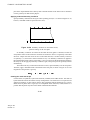
computes the minimum and maximum values shown in your contour plots and evenly divides the
range between these values into 12 intervals. You can control the minimum and maximum values
Abaqus/CAE displays (for example, to examine variations within a fixed set of bounds), as well
as the number of intervals.
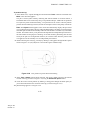
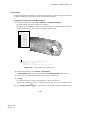
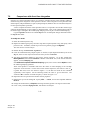
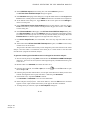
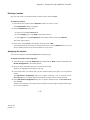
To generate a customized contour plot:
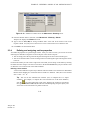
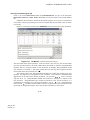
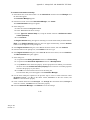
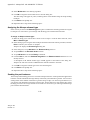
1. In the Basic tabbed page of the Contour Plot Options dialog box, drag the Contour
Intervals slider to change the number of intervals to nine.
2. In the Limits tabbed page of the Contour Plot Options dialog box, choose Specify beside
Max; then enter a maximum value of 400E+6.
3. Choose Specify beside Min; then enter a minimum value of 60E+6.
4. Click OK.
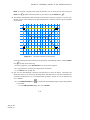
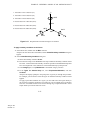
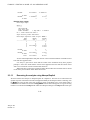
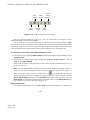
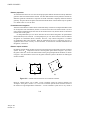
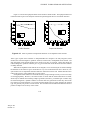
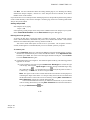
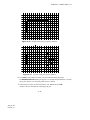
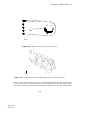
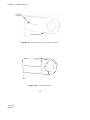
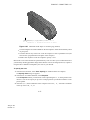
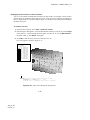
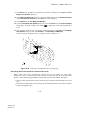
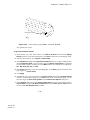
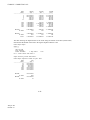
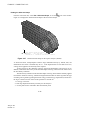
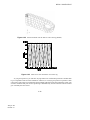
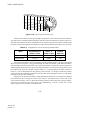
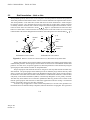
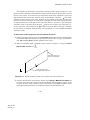
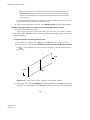
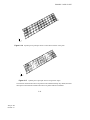
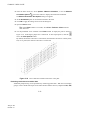
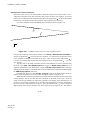
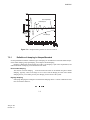
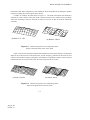
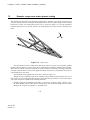
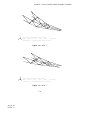
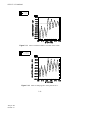
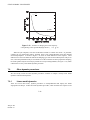
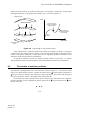
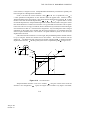
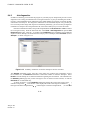
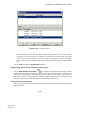
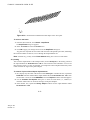
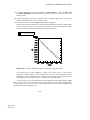
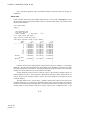
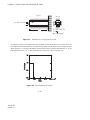
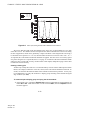
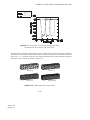
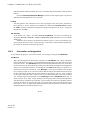
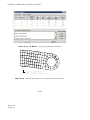
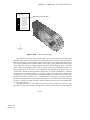
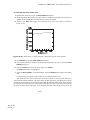
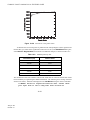
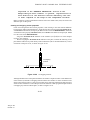
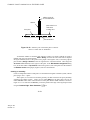
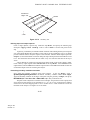
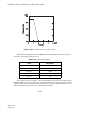
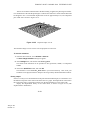
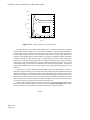
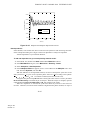
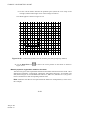
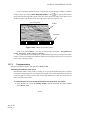
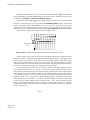
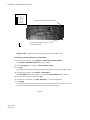
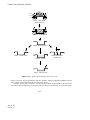
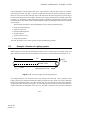
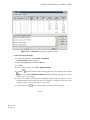
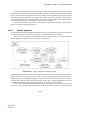
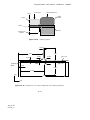
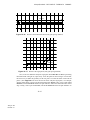
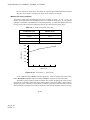
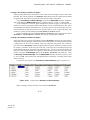
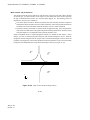
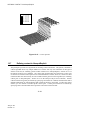
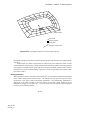
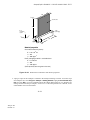
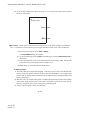
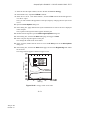
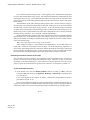
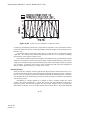
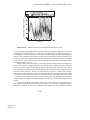
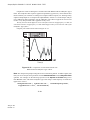
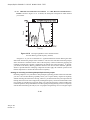
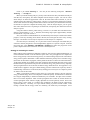
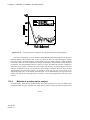
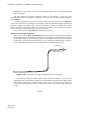
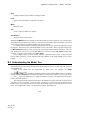
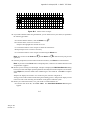
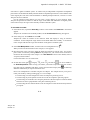
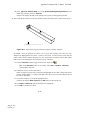
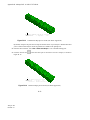
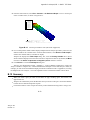
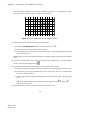
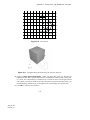
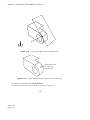
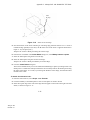
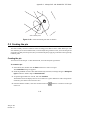
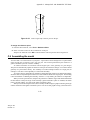
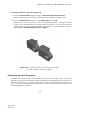
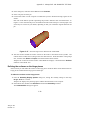
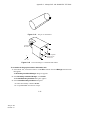
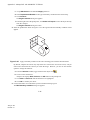
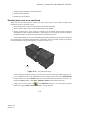
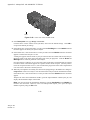
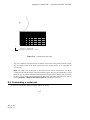
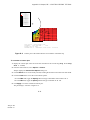
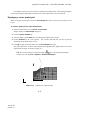
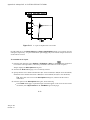
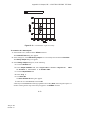
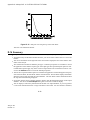
Abaqus/CAE displays your model with the specified contour option settings, as shown in
Figure 4–32 (this figure shows Mises stress; your plot will show whichever output variable
you have chosen). These settings remain in effect for all subsequent contour plots until you
change them or reset them to their default values.
S, Mises
(Avg: 75%)
+4.262e+08
+4.000e+08
+3.622e+08
+3.244e+08
+2.867e+08
+2.489e+08
+2.111e+08
+1.733e+08
+1.356e+08
+9.778e+07
+6.000e+07
+3.666e+06
2
3
1
Step:
LugLoad, Apply uniform pressure to the hole
Increment
1: Step Time =
1.000
Primary Var: S, Mises
Deformed Var: U
Deformation Scale Factor: +2.964e+01
Figure 4–32
Customized plot of Mises stress.
4–32
Abaqus ID:
Printed on: