1
TCAD Driven CAD
A Journal for Process and Device Engineers
Yield Analysis and Performance Optimization
Using FastBlaze and SPAYN
Introduction
In previous Simulation Standard articles (Nov 97 & Nov 98)
FastBlaze has been presented as a new, highly efficient
approach to simulating advanced HEMTs and MESFETs.
Conventional device simulators often suffer from slow
execution times, leading to a trade off between mesh
density and physical model complexity against CPU
run time and convergence. This requires engineers to
compromise accuracy to achieve a reasonable throughput.
By focusing solely upon FET simulation, FastBlaze has
been able to greatly optimize the physical solution
procedure, enabling the use of the most sophisticated
physical models while maintaining a fast execution
(typically less than 1 minute for a full set of DC ID-VDS
curves) This speed enables both complex and extensive
experimental designs to be completed on a reasonable time
scale, permitting experiments that would be prohibitively
expensive for more traditional device simulators.
Experimental Design
In this exercise we illustrate the power of FastBlaze,
when coupled to SPAYN by implementing a simple
but large experimental design.
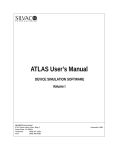
We took a relatively complicated double-recessed,
double delta-doped pHEMT structure (Figure 2.) and
randomly varied 9 of the physical input parameters
(see Table 1).
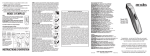
Figure 1. Scatter plot showing VDbrk vs. gmpk from Monte Carlo experiment.
There are two common distribution choices for Monte
Carlo experimental design, a uniform random distribution
suits device optimization, as the input parameter plane
is more efficiently covered, however, by using a
Gaussian profile, which is more representative of natural
variations in the device, we can also perform yield
analysis directly upon the experimental output.
Continued on page 2....
Cap Doping
Supply Doping
AlGaAs
Lg
A
B
INSIDE
RL
GaAs
New Model for Simulation of Exposure Process in
Complex Nonplanar resist-Substrate Structures . . . . . 4
InGaAs
Fast, Physical, Predictive and Calibrated Modeling
of Ion Implantation . . . . . . . . . . . . . . . . . . . . . . . . . . . . 5
Delta1 Doping
CW
GaAs
Delta2 Doping
Figure 2. Double recessed, double δ-doped pHEMT structure.
Volume 12, Number 8, August 2000
Calendar of Events . . . . . . . . . . . . . . . . . . . . . . . . . . . . . 10
Hints, Tips, and Solutions . . . . . . . . . . . . . . . . . . . . . . . . 11
SILVACO
INTERNATIONAL
predictor (input) variables
Lg
RL
CW
A
rf
d1
d2
d3
d4
gate length
second recess length
InGas channel thickness
total recess depth
recess fraction, B/A
cap doping density
supply doping density
1st δ doping density
2nd δ doping density
response (target) variables
gmpk
VDbrk
peak transconductance
break down voltage
Table 1. Input and response variables for the experiment.
Figure 4 shows histograms of both gmpk and VDbrk for
the nominal and optimized cases. The qualitative
improvement in the parameters is immediately observable, with the mean gmpk increasing from 410 to 490
mS/mm and VDbrk from 24 to 28 V. Further there is no
significant change in the standard deviation of either
distribution.
Figure 3. Scatter plot showing VDbrk vs. gmpk for both the
nominal and optimized device structures.
Device Optimization
When the results from the Monte Carlo experiment are
investigated in SPAYN the user can identify "good"
devices by visually inspecting the scatter plots. In
Figure 1 a device has been chosen with both high gmpk
and breakdown. SPAYN then displays each of the input
variables for that simulation in a pop-up box.
Yield Analysis
Since both experiments were performed using Gaussian
distributions the output distribution functions can be
evaluated directly to obtain the yield values.
A simple yet effective method of optimization is then to
center the input values on this "good" device and re-run
the whole experiment. Figure 3 displays the combined
scatter plots for both experiments, showing a marked
improvement in both gmpk and VDbrk.
In our example we choose an arbitrary "fail" point for
the breakdown voltage and integrate both the nominal
and optimized distributions to calculate the expected
yield from a wafer. Choosing a minimum of 20 Volts
Figure 4. Distribution analysis. Here the mean value of both VDbrk and gmpk have been increased in the optimized structure with
no significant change in the standard deviations.
The Simulation Standard
Page 2
August 2000
RL
CW
Lg
1.00
Lg
-0.30
0.49
A
d1
d3
gmpk
VDbrk
0.35
0.47
-0.39
-0.50
RL
-0.30
1.00
-0.32 -0.32
-0.07 -0.24
-0.27
0.27
0.62
CW
0.49
-0.32
1.00
A
0.46
-0.32
0.44
0.44
0.15
0.37
0.44
-0.32
-0.44
1.00
0.09
0.34
0.40
-0.35
-0.58
rf
0.11
-0.07
d1
0.35
-0.24
0.15
0.09
1.00
0.08
0.11
-0.17
-0.27
0.37
0.34
0.08
1.00
0.30
-0.28
-0.40
d3
0.47
gmpk
-0.39
-0.27
0.44
0.40
0.11
0.30
1.00
-0.34
-0.41
0.27
-0.32 -0.35
-0.17 -0.28
-0.34
1.00
0.32
VDbrk -0.50
0.62
-0.44 -0.58
-0.27 -0.40
-0.41
0.32
1.00
0.46
rf
0.11
Table 2. A bridged correlation matrix for the combined
nominal and optimized experimental data.
breakdown the yield from the nominal structure is
92.2% where as the optimized is greater than 99%. If the
minimum is shifted to 22 Volts, the nominal structure's
yield drops to 80% where as the optimized is still
greater than 98%.
Source
DF
MS
Fcrit
P-val
Adj. R2
1. Linear model
9
613.4
274.7
v.sig.
.63
2. Extra due to
interactions (xy) terms
36
21.6
9.7
v.sig.
.71
3. Extra due to
quadratic (x2) terms
9
18.6
8.4
v.sig.
.73
4. Extra due to
interactions (xyz) terms
84
3.7
1.7
not sig.
.78
5. Extra due to
interactions (xy2) terms
72
2.8
1.3
not sig.
.76
6. Extra due to
cubic (x3) terms
9
4.5
2.0
not sig.
.75
Error (residual)
742
2.2
Total
961
Table 3. Analysis of variance (ANOVA) for VDbrk.
model. If a more complete ANOVA analysis was
required, an engineer might also add or remove
individual parameters.
There are several model selection criterion available,
the most commonly used being p-value and adjusted R2.
SPAYN Parameter Analysis
The previous examples demonstrate a straight forward
optimization technique, however, the inter-dependencies
of each input parameter have not been analyzed.
SPAYN provides the tools for investigating these
relationships via the correlation matrix.
From the ANOVA table (table 3) all of the p-values up
to model 3. are highly significant, hence our regression
model should include all linear (x), interaction (xy) and
quadratic terms (x2). Adding extra parameters to the
regression equation (models 4,5 and 6) produce
non-significant p-values, indicating that it is not worth
including them in the model.
SPAYN can also be used to generate an analytical "black
box" model of this data set through regression analysis.
This is more computationally efficient than FastBlaze
however is strictly limited to this structure.
As an alternative we can also use the adjusted R2 value
as the selection criterion. In this case model 4 should be
used i.e. all linear (x), interaction (xy), quadratic (x2)
and interaction (xyz) terms.
For more information on the techniques described
below please refer to the SPAYN User's Manual.
Continued on page 6....
Correlation
SPAYN can be used to investigate the inter-parameter
dependencies through the correlation matrix. An
abridged matrix showing the most significant variables
is presented in Table 2.
This is useful when determining which parameters will
have a larger influence in the regression models. In this
case we can see that the gate length, second recess
length and the total recess depth are highly correlated
with VDbrk (|r| > 0.5).
Regression
Regression analysis can be performed within SPAYN to
generate response surfaces for the target parameters.
These regression equations can then be used to predict
new values for the response variables far more efficiently
than by using any physical simulator.
Using VDbrk as the response variable and the 9 predictor
parameters from Table 1, an analysis of variance
(ANOVA) was performed to identify the most suitable
August 2000
Figure 5. Residual analysis of model 4.
Page 3
The Simulation Standard
New Model for Simulation of Exposure Process in
Complex Nonplanar Resist-Substrate Structures
1. Introduction
Predictive and efficient lithography
simulation is an important component of
the semiconductor industry efforts to develop
the next generation of deep submicron
technologies. Emerging technologies are
based on elements with very small feature
sizes and extremely complex and nonplanar
topographies. Therefore lithography
processing has to provide high resolution
with large depth of focus. Simultaneously
such effects as nonplanar reflections and
notching as well as refractive index
dependence on local absorbed dose are
very critical for printing small mask elements using short wavelength radiation.
This work presents a new approach for simFigure 1. The distribution of intensity (dose) in the resist over a non-planar
ulating the exposure process, which takes substrate. The resist refraction index is not modified during the exposure.
into account these effects in complex nonplanar resist-substrate structures. The
2. Model
method is based on numerical solution of the Helmholtz
equation for the electric field in the media with complex
The exposure model previously implemented into
refractive index n(x,y,z,I), where I is the dose previously
Optolith is based on the Ray Tracing Method (RTM).
absorbed at the point. Propagation of initial electromagRTM cannot accurately calculate diffraction on small
netic field and fields reflected from the material interfeatures and does not allow to account for optical
face elements are calculated using the Beam
nonlinearities of the photoresist. The new exposure
Propagation Method (BMP) [1]. Because the method is
model has been developed to achieve several goals:
very general it can be used for different types of radiation (UV, EUV, X-ray) as well as for multiexposure
1.
More accurate simulation of the
processes and multilayer and nonlinear resists. The
exposure process by taking into
method is implemented as a separate module, which is
account diffraction effects.
interfaced with imaging and developing modules of
2.
Include a capability to simulate non-linear
Optolith. Complete exposure simulations for a typical
effect of the intensity distribution on
2D structure take 2-20 sec on a Sun Ultra-10 workstation.
the local optical properties of the
resist material.
3.
Improve the simulator performance.
The Beam Propagation Method (BPM) is
used to solve the Helmholtz equation for
electromagnetic field inside the structure.
During the simulation the field distribution
is formed as the superposition of incident
light, all the reflections from all elements of
the resist-substrate interface and secondary
reflection(s) from the upper resist surface.
The formal descriptions of the BPM can be
found in [1]. In [2-4] some applications using
BPM are described too.
Figure 2. The distribution of intensity (dose) in the resist over a non-planar
substrate. The resist refraction index is modified during the exposure from for
unexposed resist to for completely exposed one.
The Simulation Standard
Page 4
August 2000
In this model the Helmholtz
equation for the electric field E into
the media with complex refractive
index n(x, y, z)
∇2 E + k2 n2 E = 0
where k is the wave number, is
solved in two main stages:
1. First, the diffraction over a
small spatial step along the
propagation is calculated thus
obtaining the new field amplitude
distribution without absorption
taken into account;
2. Then the actual field distribution is computed as a product
of this amplitude distribution
and the distribution of the complex absorption over the step.
Figure 3. The resist development profile corresponding to the dose distribution in Figure1.
∂MPAC
Here
= -CI(x, y, z, t)MPAC , where I(x, y, z, t) is
∂t
the current intensity distribution, C is the Mack’s
C-parameter. This effect is calculated by accumulating
the total dose in several steps so the intensity distribution
is formed as the sum of distributions obtained for each
step. In this case, the previously accumulated intensities
are used to compute current values of the refractive
index for each point inside the resist area.
Let the wave is propagated along z-axis. We find the
solution as a quasi plane wave E=A(x, y, z)exp(inkz)
with slowly varied amplitude A ( A is modified with z
slower than phase term inkz). In this case, the Fourier
image of current distribution A in the plane z=z 0 is
defined as
FA(kx, ky)=∫ A(x, y, z0)exp[-i(kxx+ kyy)]dxdy .
3. Changes in Optolith Syntax
After propagating over a small step each component of
obtains additional phase shift corresponded to the
value of kz= k2-k2x - k2y. Thus, the amplitude distribution
at z = z0 +∆z (without accounting for absorption) can be
written as
Several additional parameters have been included in
the OPTOLITH syntax to control the new model. The
BPM parameter in the EXPOSURE statement specifies
that Beam Propagation Method is to be used during
exposure simulation. This parameter is now default. If
the RTM parameter is specified instead the old Ray
Tracing Method will be used.
A(x, y, z0+∆z) = ∫ FA(kx, ky)exp(ikz∆z)exp[i(kxx+ kyy)]dkxdky.
Due to difference of actual optical properties from ones
for vacuum, the field at the new plane z = z0 +∆z is
computed simply:
To simulate the dose effect on the resist optical properties
the difference of the complex refraction index for
exposed and unexposed resist has to be specified. It is
assumed that standard value of the refraction index
corresponds to the case of unexposed resist. The following
OPTICAL statement:
E(x, y, z0+∆z) = A(x, y, z0+∆z)exp{ik[n(x, y, z)-1}∆z}.
The algorithm is repeated recursively step-by-step over
all simulation domain. The same calculations are
applied to reflections from all segments of the resist
boundaries. And the whole procedure is repeated
NUM.REFL times, where NUM.REFL is specified in the
EXPOSURE statement.
optical name.resist=RESIST1
delta.real=0.1 delta.imag=-0.03
i.line
specifies that the real part of the refraction index
increases by 0.1 for completely exposed resist while the
imaginary part of the refraction index (absorption) is
reduced by 0.03 for completely exposed resist.
This approach allows the dependence of the refraction
index n on intensity I to be taken into account. The
following formula for n(x,y,z,I) is implemented:
n(x,y, z, I)=nunexposed +(nunexposed -nunexposed)[1-MPAC(x,y, z, I)].
August 2000
Page 5
The Simulation Standard
second case, this maximum is visibly
lower due to modification of the resist
properties during the exposure. These
quantitative differences in the intensity
distributions result in completely different resist development profiles (see
Figure 3, 4). In the first case the feature is
unresolved (Figure3) while in the second case (Figure4) the whole lithography process was successful.
New capabilities of the Optolith simulator
allow to determine the characteristics of
actual resists as well as to optimize
parameters of the technological process.
Figure 4. The resist development profile corresponding to the dose distribution in Figure2.
4. Example
References
[1] J. Van Roey, J.van der Donk, P.E. Lagasse. Beam-propagation
method: analysis and assessment. J. Opt.Soc. Am.,
Vol.71, No. 7, July 1981, p. 803.
The figures illustrate influence of the "dose effect" on the
developed profile. Artificial conditions were simulated
to outline the importance of the dose effect. In Figure 1
and 2 the intensity distributions in the resist over a
non-planar substrate are shown for the cases of constant
[2] J. Z. Y. Guo, F. Cerrina. Modeling X-ray proximity lithography.
IBM J. Res. Develop., Vol. 37, No. 3, May 1993, p. 331.
[3] A. Erdmann, C. L. Henderson, C. G. Wilson, W. Henke.
Influence of optical nonlinearities of the photoresist on the
photolithographic process: basics. SPIE Proc., Vol. 3051,
1997, p. 529.
refraction index n0 = 1.4 + i . 0.02 (Figure 1) and the
index varied with dose from n0 for unexposed resist to
n1 = 1.4 + i . 0.04 for completely exposed one (Figure 2).
The exposure level near the center of the substrate
deepening differs substantially for these two cases. In
the both cases there is the local maximum of the intensity
due to reflections from the slope walls. However, in the
[4] A. Erdmann, C. L. Henderson, C. G. Wilson, R. R.
Dammel. Some aspects of thick film resist performance
and modeling. SPIE Proc., Vol. 3333, 1998, p. 1201.
...continued from page 3
The computational demands for evaluating a regression
model are minimal when compared to a full physical
simulation, hence we chose model 4 from the ANOVA
table.
Conclusions
By looking at the input parameters from the simulated
"good" devices we can draw some conclusions about
general design criteria for this type of device. First we
have obvious changes, decreasing the gate length and
increasing the second recess length to increase gm and
breakdown respectively. The recess fraction, the ratio of
1st and total recess depths should be fixed for this
structure at 0.8. Finally, the doping density of the 1st
delta should be lowered to increase breakdown, whilst
raising the density of the 2nd delta to maintain gm.
After fitting the regression equation a residual analysis
is performed to check the model. This is accomplished
by plotting the residuals against the estimated values
and also individual predictor variables (see Figure 5)
A visual inspection of these plots should not reveal any
discernible trends. If any patterns were apparent this
would indicate a poor model and further analysis
would be required.
The SPAYN statistical analysis was used to confirm the
device optimization and corresponding improvement
in yield. Further, the correlation matrix revealed which
input parameters are most significant.
Finally the response surface was then used in place of
FastBlaze to re-generate the original Monte Carlo data.
Note: 1000 samples were simulated in under 1 second
on a Sun ULTRA 10 workstation. V Dbrk was then
compared between the two data sets, the first generated
by FastBlaze and the second via the SPAYN regression
model. A deviation of less than 5% was typically
observed, illustrating the validity of this approach.
The Simulation Standard
An analysis of variance was performed to select an
appropriate regression model which was checked with
a residual analysis. Figure 5 shows no discernible
trends indicating a good model. Finally the regression
equation was used to predict new values for the
response variables with good accuracy validating the
model selection.
Page 6
August 2000
Fast, Physical, Predictive and Calibrated Modeling
of Ion Implantation
Introduction
Ion implantation has become a critical step for controlling
ultra-shallow junctions, in sub-0.1mm CMOS technology.
In a Research & Development environment,
Technology Computer Aided Design (TCAD) is
involved in the device optimization loop and requires
efficient and predictive implantation modeling with
frequent updating of the range of validity. For this
purpose, semi-empirical models using statistical
distributions are mainly chosen, because this kind
of simulation is faster than the physically based
Monte-Carlo (MC) approach. We propose a methodology
which can be applied to ion implantation modeling
with easy build-up, and which gives a predictive
capability in the explored experimental domain. This
calibration strategy will enhance the efficiency of
analytical modeling by the combination the use of SIMS
profile and the statistical qualities of Design of
Experiments (DoE). Thus, only a few extra experiments
are needed to extend the ion implantation simulation
domain, in order to take into account the most advanced
Figure 1: Input deck used for Dual Pearson 4 moments extraction.
process conditions accurately. Our methodology is carried
out for low energy B and As implantation, which is the
case in practice for ultra-shallow junction engineering.
Calibration of Ion implantation modeling
The results provided by a TCAD simulator are a function
of both the experimental conditions and of the parameters
of the used model, parameters which may themselves
depend on the experimental conditions. In the case of
analytic simulation of ion implantation, the tuning of
the parameters (for example the moments of the statistical
distribution) is often necessary, because they incorporate
the experimental uncertainties. On the contrary, for MC
computations, parameters are purely physical, so do not
need to be adjusted.
Figure 2: View of the Optimizer windows during extraction procedure.
August 2000
Page 7
The problem of predictive calibration of TCAD simulators
has been previously addressed and an original methodology
has been proposed [1]. The main idea is that a simulation
can be considered as calibrated not only if the set of
model parameters is fitted to particular experiments,
The Simulation Standard
but also if the sensitivity of
these parameters to the experimental process parameters, is
determined. With this aim, the
use of Design of Experiments
(DoE) and Response Surface
Modeling (RSM) permits the
choice of the most significant
experiments, to finally generate
an empirical model for the parameters of the implantation model.
Nowadays, the parameters of
the most advanced analytical
ion implantation models, like
the Dual-Pearson 4 (DP4) [2],
are linearly interpolated in
lookup tables to produce fast
and accurate simulation.
Figure 3. Coefficients of the analytical model for each SVDP model parameter as a function of the
process parameters.
Results
However, these lookup tables suffer from several drawbacks:
The advantages of RSM could then fulfill the requirements of
predictive calibration of ion implantation analytical models.
As already explained in [4], we have used the ability of
DeckBuild to include any UNIX command inside any
simulator input file. This feature authorizes users to
include their own external routines inside DeckBuild.
This is what we did in ATHENA to specify the values of
the moments of the SIMS Verified Dual Pearson (SVDP)
mode. The external routine contains the polynomial
model that describes the SVDP model parameter (Rp
for example) as a function of the process parameters
like dose and energy (see Figure 3.). Figure 4 and 5 are
an illustration of the profile obtained using this
methodology for respectively Arsenic and Boron, SIMS
profile was superimposed for comparison purpose.
Application to Advanced Analytical Models
In Figure 6, we show the global improvement over the
whole As and B profile database, as compared to the
(i)
default values in TCAD software must be calibrated
and extended over the whole interesting range, to
make the modeling results closer to the specific
experimental conditions of each fab, in particular
the dose loss;
(ii) the global consistency of the table is not maintained
when further parameter values are incorporated;
(iii) a great number of experiments is required to obtain
discrete sets of model parameters that cover the
experimental domain with a sufficient accuracy.
We applied our strategy to the DP4 ion implantation
modeling: we attempted to find a quadratic modeling of
the parameters (Rp, DRp, skewness, kurtosis,...), of the DP4
models. To do that we have applied the following strategy:
●
DoE on which SIMS profile will be extracted.
The domain of variation is shown on Table 1.
Factors Energy Dose As BF2 (at. cm-2)
range
3 to 10
3 1013 to 1015
Dose B (at. cm-2) Tilt (deg)
1 1013 to 5 1014
7
Twist (deg)
27
Table 1: Experimental ranges for As, BF2 and B.
●
Use of the SILVACO OPTIMIZER to extract
moments of DP4 from experimental SIMS profile
(Figure 1 and 2).
●
Modelisation (RSM) of the DP4 moments. We
found that the RSM of these models parameters, as
function of the experimental process condition are
satisfactory. Indeed the adjusted R_ criterion value,
which indicates the quality of the empirical models,
is rarely below 0.8.
The Simulation Standard
Figure 4: Arsenic profile in TonyPlot before and after calibration,
comparison with SIMS profile.
Page 8
August 2000
Figure 5: Boron profile in Tonyplot before and after calibration,
comparison with SIMS profile.
simulations performed with the SVDP model of
ATHENA [3]. The improvement is evaluated by the
Root Mean Square Relative Error:
Figure 7: Comparison of the use of calibrated profiles on a
device characteristic.
where yexpi and ysimi are respectively the ith experimental
and simulated concentration values of a n points
discretization of the profile.
Conclusion
In this study, we have presented an original and efficient
methodology for global ion implantation modeling. The
advantages of this methodology are a lower number of
experiments, confidence in the values of the calibrated
model parameters, and the rapid implementation of
new data within our process simulator ATHENA.
However it is of great importance to notice that the aim
of this paper was to show a calibration methodology
and not necessary to give new parameters for the SVDP
implant model. Indeed it is not guaranty that replacing
the default values by the values obtained from this
work will give better results in all cases. The reason is that the confidence we have in the results
done in this work could not be maintained if we
take the values "out of their context". This is due
to the high degree of dependency of the way of
doing calibration (DoE used, optimizer setup..),
making measurements and more important the
Fab itself.
Influence on Device Characteristics
It is often recognized in the TCAD word that an accurate
simulation of electrical MOSFET characteristics is
primarily due to a good process simulation. This is
illustrated as an example in the Figure 7 where we have
made the same ATLAS simulation with two different
ATHENA process simulation. One using the default
value of the moments of the SVDP model and the other
one using the calibrated one.
References
[1] G. Le Carval - SISPAD’97 - pp 177-180
[2] A. F. Tash - J. Electrochem. Soc. 136(3) 1989 - pp
810-814
[3] SILVACO International - ATHENA User’s Manual
Figure 6: RMSRE for Arsenic and Boron which show the reduction after
calibration, of the difference between SIMS profile and simulation.
August 2000
Page 9
[4] SILVACO Simulation Standard May 2000
The Simulation Standard
Calendar of Events
August
September
1
2
3
4
5
6
7
8
9
10
11
12
13
14
15
16
17
18
19
20 2000 Topical on Hetro
Structure Microelectronics –
Kyoto, Japan
21 2000 Topical on Hetro
Structure Microelectronics –
Kyoto, Japan
22 2000 Topical on Hetro
Structure Microelectronics –
Kyoto, Japan
23 2000 Topical on Hetro
Structure Microelectronics –
Kyoto, Japan
24
25
26
27
28 Intl Conf on Solid State Devices
and Materials, Sendai, Japan
29 Intl Conf on Solid State Devices
and Materials, Sendai, Japan
30 Intl Conf on Solid State Devices
and Materials, Sendai, Japan
31
1
2
3 Japan Applied Physics Hokkaido, Japan
4 Japan Applied Physics Hokkaido, Japan
5 Japan Applied Physics Hokkaido, Japan
6 Japan Applied Physics Hokkaido, Japan
SISPAD 2000-Seattle WA
7 Japan Applied Physics Hokkaido, Japan
SISPAD 2000-Seattle WA
8 SISPAD 2000-Seattle WA
9
10
11 ESSDERC, Cork, Ireland
12 ESSDERC, Cork, Ireland
13 ESSDERC, Cork, Ireland
Int’l w/s on Power and Timing,
Opt and Sim.-Germany
14 Int’l w/s on Power and Timing,
Opt and Sim.-Germany
15 Int’l w/s on Power and Timing,
Opt and Sim.-Germany
16
17
18
19
20
21
22
23
24
25 BCTM BiPOLAR- Minneapolis
26 BCTM BiPOLAR- Minneapolis
27 BCTM BiPOLAR- Minneapolis
28
29
30
Bulletin Board
III/V Compound Conference in Japan
Silvaco is heading to Japan August 20th through 23rd
for the 2000 Hetero-Structure Microelectronics
conference. Held this year in the Kyoto Research
Park, our Japanese office will be introducing
attendees to Silvaco products and answering
questions about Silvaco’s powerful suite of tools.
Solid State Device and Materials
Conference in Japan
August 28th through 31st Silvaco’s Japanese
office is headed to the Sendai International
Center for the International Conference on Solid
State Device and Materials. With benchmarks in
reliability and speed, Silvaco tools enable developers
to reduce the time spent on jobs and eliminate
inefficiencies. Silvaco welcomes the opportunity
Success Continues at Silvaco
As summer comes to a close Silvaco is ramping
up for another busy fall stacked with exciting
conferences worldwide. Life never slows at
Silvaco, as development continues at breakneck
speeds, and with the power to simulate the
largest designs and the speed to keep users’
design flows moving, Silvaco’s pride lies in its
customers’ successes.
If you would like more information or to register for one of our our workshops, please check our web site at http://www.silvaco.com
The Simulation Standard, circulation 18,000 Vol. 11, No. 8, August 2000 is copyrighted by Silvaco International. If you, or someone you know wants a subscription
to this free publication, please call (408) 567-1000 (USA), (44) (1483) 401-800 (UK), (81)(45) 820-3000 (Japan), or your nearest Silvaco distributor.
Simulation Standard, TCAD Driven CAD, Virtual Wafer Fab, Analog Alliance, Legacy, ATHENA, ATLAS, MERCURY, VICTORY, VYPER, ANALOG EXPRESS,
RESILIENCE, DISCOVERY, CELEBRITY, Manufacturing Tools, Automation Tools, Interactive Tools, TonyPlot, TonyPlot3D, DeckBuild, DevEdit, DevEdit3D,
Interpreter, ATHENA Interpreter, ATLAS Interpreter, Circuit Optimizer, MaskViews, PSTATS, SSuprem3, SSuprem4, Elite, Optolith, Flash, Silicides, MC
Depo/Etch, MC Implant, S-Pisces, Blaze/Blaze3D, Device3D, TFT2D/3D, Ferro, SiGe, SiC, Laser, VCSELS, Quantum2D/3D, Luminous2D/3D, Giga2D/3D,
MixedMode2D/3D, FastBlaze, FastLargeSignal, FastMixedMode, FastGiga, FastNoise, Mocasim, Spirt, Beacon, Frontier, Clarity, Zenith, Vision, Radiant,
TwinSim, , UTMOST, UTMOST II, UTMOST III, UTMOST IV, PROMOST, SPAYN, UTMOST IV Measure, UTMOST IV Fit, UTMOST IV Spice Modeling,
SmartStats, SDDL, SmartSpice, FastSpice, Twister, Blast, MixSim, SmartLib, TestChip, Promost-Rel, RelStats, RelLib, Harm, Ranger, Ranger3D Nomad, QUEST,
EXACT, CLEVER, STELLAR, HIPEX-net, HIPEX-r, HIPEX-c, HIPEX-rc, HIPEX-crc, EM, Power, IR, SI, Timing, SN, Clock, Scholar, Expert, Savage, Scout,
Dragon, Maverick, Guardian, Envoy, LISA, ExpertViews and SFLM are trademarks of Silvaco International.
The Simulation Standard
Page 10
August 2000
Hints, Tips and Solutions
William French, Applications and Support Manager
Q. Can ATLAS be used to simulate advanced III-V or
II-VI materials ?
A. Yes. ATLAS now supports a wide range of materials in
its database. This database covers single elememt conductors,
binary compounds and quaternary compounds. A complete
list of all materials can be found in Appendix B of the
ATLAS Users Manual Vol. II.
It should be noted however, that many of these materials
are quite recent and do not have a comprehensive set of
physical parameters or physical models yet available.
Atlas can still be used to simulate these devices but
requires three contributions from the user.
First, the user should ensure that a complete set of physical
parameters are available. To illustrate this the material
InAlAs will be invoked within an input deck. To check
the required physical parameters are available before a
simulation is started the following command should be
written within the input deck
MODEL PRINT
This will then produce in the runtime output window of
deckbuild the following table when two regions are present, GaAs and InAlAs :
REGIONAL MATERIAL PARAMETERS:
Region
:
1
2
Material :
GaAs InAlAs
Type
: semicond. semicond.
Epsilon
:
13.2
0
BAND PARAMETERS
Eg (eV)
:
1.42
2.1
Chi (eV) :
4.07
0
Nc (per cc) : 4.35e+17
1
Nv (per cc) : 8.16e+18
1
ni (per cc) : 2.12e+06 2.29e-18
Gc
:
2
2
Gv
:
4
4
Ed (eV)
: 0.044 0.044
Ea (eV)
: 0.045 0.045
RECOMBINATION PARAMETERS
Lifetime (el): 1e-09
1
Lifetime (ho): 2e-08
1
Auger cn : 5e-30
0
Auger cp : 1e-31
0
Auger kn :
0
0
Auger kp :
0
0
Copt
: 1.5e-10
0
An**
:
6.29
110
Ap**
:
August 2000
105
IMPACT IONIZATION MODEL PARAMETERS
(SELBERHERR MODEL)
betan
:
1.82
1
betap
:
1.75
1
egran
:
0
0
an1
: 1.9e+05 8.6e+06
bn1
: 5.75e+05 3.5e+06
an2
: 1.9e+05 8.6e+06
an2
: 5.75e+05 3.5e+06
ap1
: 2.22e+05 2.3e+07
bp1
: 6.57e+05 4.5e+06
ap2
: 2.22e+05 2.3e+07
bp2
: 6.57e+05 4.5e+06
SATURATION VELOCITIES
Vsatn (cm/s) : 7.7e+06 1e+06
Vsatp (cm/s) : 7.7e+06 1e+06
1e+06
1e+06
As shown, the material InAlAs does not have certain
parameters predefined such as epsilon and Chi. The
user is required to define these parameters, all the Band
Parameters and any Recombination and Impact
Ionization Parameters required in the model definitions.
In this case the necessary ATLAS statement could be:
material
material=InAlAs
permittivity=13.9
nc300=1.5e17 nv300=8.1e18 affinity=3.6 eg300=1.47
taun0=1.2e-9 taup0=1.2e-9
Second, the physical parameters inbuilt into
ATLAS/Blaze cover GaAs, AlGaAs, InGaASP, SiGe and
SiC. For advanced materials either constants values
need to be used or the C-interpreter is required. For
instance, the bandgap in these materials is a function of
either the x or y or both mole fractions. If a graded mole
fractions is required in a device the user has to use the
C-interpreter to define the variation of bandgap with
the x or y mole fraction.
Third, there are a limited set of physical models available
within ATLAS/Blaze, such as for mobility. The C-interpreter
should therefore be applied by the user to define
relevent and accurate physical models for the material
they are studying.
Call for Questions
If you have hints, tips, solutions or questions to contribute, please
contact our Applications and Support Department
Phone: (408) 567-1000
Fax: (408) 496-6080
e-mail: [email protected]
Hints, Tips and Solutions Archive
Check our our Web Page to see more details of this example
plus an archive of previous Hints, Tips, and Solutions
www.silvaco.com
30
Page 11
The Simulation Standard
Your Investment in Silvaco is
SOLID as a Rock!!
While others faltered, Silvaco stood SOLID for
15 years. Silvaco is NOT for sale and will
remain fiercely independent. Don’t lose sleep,
as your investment and
partnership with Silvaco will only grow.
SILVACO
CONTACTS:
I N T E R N AT I O N A L
Silvaco Japan
[email protected]
USA HEADQUARTERS
Silvaco Korea
[email protected]
Silvaco International
4701 Patrick Henry Drive
Building 2
Santa Clara, CA 95054
USA
Phone:
Fax:
408-567-1000
408-496-6080
[email protected]
www.silvaco.com
Silvaco Taiwan
[email protected]
Silvaco Singapore
[email protected]
Silvaco UK
[email protected]
Silvaco France
[email protected]
Silvaco Germany
[email protected]
Products Licensed through Silvaco or e*ECAD
Ve n d o r P a r t n e r