1
CHAPTER 16. CORRECT PACBIO READS (BETA)
83
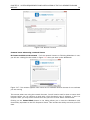
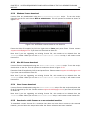
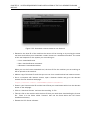
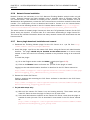
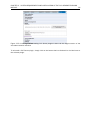
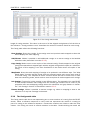
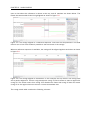
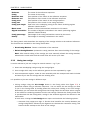
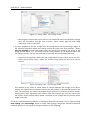
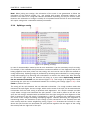
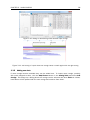
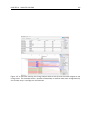
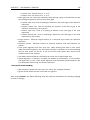
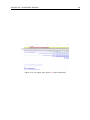
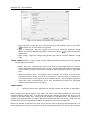
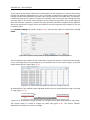
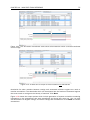
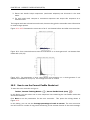
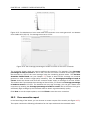
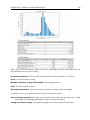
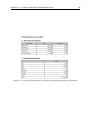
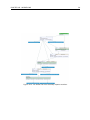
Figure 16.5: The error-correction report is useful for evaluating the quality of the input data and
the performance of the error-correction.
Nucleotide distribution: Fraction of the reads covered by each nucleotide, A, C, G and T.
Count: The total number of reads.
Minimum, maximum, average, N50 and N90: Read length statistics.
Total: The total number of bases.
Read length distribution: A graph showing the number of contigs of different lengths.
In addition to this, some statistics about the error correction are given:
Seed read length threshold The length of the shortest seed read used as seed read - picked
according to the Coverage percentage of reads to correct (see above).
Average correction coverage The average coverage by correction reads on seed reads.