1
SysUpTime User Manual
Version 6
SysUpTime User Manual
1
Copyright iDeskCentric Inc.
Contents
SYSUPTIME USER MANUAL
1
CONTENTS
CHAPTER 1. INTRODUCTION & INSTALLATION
SYSTEM REQUIREMENTS
CHAPTER 2. USER INTERFACE
LOGIN WINDOW
MAIN WINDOW
MENU
NETWORK EXPLORER WINDOW
NETWORK TOPOLOGY WINDOW
PROPERTIES WINDOW
DASHBOARD WINDOW (WEB CLIENT ONLY)
CHAPTER 3. USER AND VIEW MANAGEMENT
USER MANAGEMENT
CHANGE PASSWORD
USER PERMISSIONS
MANAGE ORGANIZATION
CREATE CUSTOM VIEW
CHAPTER 4. NETWORK DISCOVERY
START DISCOVERY
STOP DISCOVERY
PERIODICAL DISCOVERY
PARTIAL REDISCOVERY
DISCOVERY REPORT
SAVE CURRENT TOPOLOGY AS BASELINE
COMPARE CURRENT TOPOLOGY WITH BASELINE
DEVICE MANAGER
CHAPTER 5. EVENT SYSTEM
TRAP RECEIVER SERVER
ALARM BROWSER
CHAPTER 6. PERFORMANCE MANAGEMENT
ADD A NEW MONITOR
Common Form Values
Monitor Types
DNS Monitor
Database Query Monitor
Directory Monitor
E-Mail Monitor
Monitor MS Exchange Server
Command Executor Monitor
File Monitor
FTP Monitor
Log File Monitor
LDAP Monitor
Ping Monitor
SysUpTime User Manual
2
2
4
5
7
7
8
9
11
12
17
17
18
18
18
19
19
20
22
23
27
27
27
27
27
28
28
30
30
31
36
37
38
47
47
47
48
49
52
53
55
56
57
58
59
Copyright iDeskCentric Inc.
SNMP Monitor
Port Monitor
Web Sites
Radius Monitor
Telnet and SSH Monitors
WMI Monitor
Windows Event Log Monitor
MONITORS SNAPSHOT
CHANGE DEFAULT VALUES OF MONITORS
MANAGE MONITORS
BULK ADD MONITORS
PERFORMANCE GRAPH/CHART
CONTENT MATCH
MANAGE SNMP MATH EXPRESSIONS
SCHEDULED DOWN TIME
CHAPTER 7. REPORT
QUICK REPORT
SCHEDULED REPORT
CHAPTER 8. CONFIGURATION
CHECK MAP NODE STATUS
CHECK PORT UTILIZATION
PERFORMANCE CONFIGURATION
SMTP SERVER CONFIGURATION
ALARM CONFIGURATION
General
Event
Alarm Deduplication
Trap Clearing
Alarm Escalation
SNMPv3 Params
Email Template
DATABASE DATA
CHAPTER 9. TOOLS
IMPORT HP OPENVIEW EVENTS (TRAPD.CONF)
SysUpTime User Manual
60
66
67
67
68
69
70
71
71
73
73
74
76
80
81
82
82
84
85
85
85
87
88
89
89
90
94
95
96
96
97
98
99
99
3
Copyright iDeskCentric Inc.
Chapter 1. Introduction & Installation
SysUpTime network monitor is a powerful agentless network/systems
management product. It provides users out-of-box capabilities to efficiently and
proactively manage any network of any size. It consists of three major
components: server, database, and client. All three of them can be installed on the
same machine or different machines.
Figure: Overview of SysUpTime Network Monitor
SysUpTime User Manual
4
Copyright iDeskCentric Inc.
System Requirements
Windows 7, Vista, Windows 2003 Server, Windows XP SP1 or later, or
Windows 2000. Or Redhat Linux 9.0 or later versions.
200 MB of disk space. More is required if you need to store performance
and SNMP trap data.
512 MB of RAM required. 1024 MB or more recommended.
On windows, you need to log in as a system administrator in order to install
SysUpTime.
SysUpTime server will run as a Windows service that automatically starts up
when Windows is booted. By default, the SysUpTime service is run under the
Local System account, which has no privileges on other machines. You need to
specify an administrator account for the SysUpTime service if
You will create monitors that need to execute WMI commands or remote
Windows commands (such as rexec).
Or you will configure actions (reboot, kill process, etc) that control remote
Windows machine.
On Windows:
You need to log in as a user with administrator privilege in order to install
SysUpTime server. SysUpTime server is installed as a Windows Service .
The server will be automatically started when Windows is booted. If you
need to use WMI performance monitors and some other features, the
SysUpTime service must run under an administrator account instead of the
default system account.
SysUpTime User Manual
5
Copyright iDeskCentric Inc.
On Linux:
o
o
o
o
o
Download the sysuptime.sh from our website.
Login as root user.
Do “chmod +x sysuptime.sh” to assign the executable permission to it.
Run sysuptime.sh
To start SysUpTime server, execute
$INSTALL_DIR/server/bin/runserver.sh
o To start SysUpTime‟s desktop client, execute
$INSTALL_DIR/client/bin/runclient.sh
If you have a firewall between SysUpTime server and client, then TCP port 9502,
9503 and 9504 need to be open.
SysUpTime User Manual
6
Copyright iDeskCentric Inc.
Chapter 2. User Interface
Login window
When SysUpTime client starts up, it prompts user to enter user name and
password. There is a default account with user name „admin‟ and password
„admin‟. It is recommended to change this default account to enhance security.
The value of the server field is the host name or IP address of the SysUpTime
server. A user can manage accounts after logging in if his account has enough
privilege.
In a clustered environment, the server‟s value must be empty, otherwise the client
only connects to a specific server instead of all available SysUpTime servers in
the cluster.
login window of desktop client
SysUpTime User Manual
7
Copyright iDeskCentric Inc.
Main Window
Main window consists of five major components:
Menu
Toolbar
Network Explorer
Network Topology View
Node Properties
You can move windows to different locations. For instance, the alarm browser
window is located beside network topology window when it is opened. You can
click its tab and hold the mouse to move it under topology window, so that you
can see the incoming traps without switching.
SysUpTime User Manual
8
Copyright iDeskCentric Inc.
Menu
File Menu:
o Manage Probes: Manage data of probes. Only available in the master‟s
client of MSP edition.
o Node List: Display all the nodes in a table.
o Export Node List: Export nodes to a CSV file.
o Export Current Map: Export current map to a JPG file
o Export All Maps: Export all the maps to JPG files
o Exit: Exit client
Edit Menu(only apply to desktop client)
o Delete Map Object: Delete selected map object
o Merge Two Nodes: Merge two selected map objects into one object. For
example, for a computer with two network interfaces but without SNMP
agent, automatic discovery will treat it as two different nodes. In this case,
you can use merge function to merge them into one node.
o Background Image: Insert or remove a background image for top level
map.
o Find Node: Find a node based on its name, IP address, MAC address or
other properties. If the node is found in the maps, it will be highlighted.
View Menu (only apply to desktop client)
o Rearrange Map
Map can be automatically rearranged. After map rearranged, you will be
prompted to save the changes when leaving current map or switching to
view mode.
o Forward/Backward
These two menu items are for navigating between maps.
Forward: Go to the next map.
Backward: Go to the previous map.
SysUpTime User Manual
9
Copyright iDeskCentric Inc.
o Zoom in/Zoom out
These two menu items let you change the magnification of maps.
o Restore
Restore the current map to its original size.
Tools Menu
Menu items will be described in later chapters.
Configure Menu
Menu items will be described in later chapters.
Window Menu
It allows users to open network explorer and properties windows.
Help Menu
“Apply license” menu item can be used to apply a new license file. Only
administrators can apply license.
SysUpTime User Manual
10
Copyright iDeskCentric Inc.
Network Explorer Window
IP view
In this tab, nodes are sorted
based on their IP addresses.
If a node has multiple IP
addresses, then each IP address
will be represented as a node in
the IP tree.
Function View
Nodes are sorted based on their
functions.
If a node serves multiple
functions, then each function will
be represented as a node in the
function tree.
Figure: IP View Pane
SNMP MIB
Display MIB trees and provide
easy ways to do SNMP
operations. Select a topology
map node, and then right click on
a MIB tree node and you can
select operations like MIB table
view, graph view, adding
performance monitor etc.
The graph function can plot a
real time graph for the selected
MIB instance.
“Add Performance Monitor”
menu allows you to quickly add
an SNMP monitor.
Figure: SNMP MIB Pane
This functionality is not available
in the free edition.
SysUpTime User Manual
11
Copyright iDeskCentric Inc.
Network Topology Window
Device Panel and Topology Map
Device panel is only available in edit mode. It provides icons that can be dragged
to topology map. Icons represent network devices or links. If you right click on an
icon and click on the “More Icons” menu, more icons will show up.
During network discovery, each discovered node will be assigned an appropriate
icon. The type of icon is determined by the device‟s value of SysModel property.
If no matching icon is found, then a generic icon is used. For example, if a node is
a Windows 2000 machine, a win2000 (
tell the device type easily.
)icon is assigned to it. So users can
Users can add more icons or modify existing ones themselves. All icons are store
in the following directory:
$INSTALL_DIR\SysUpTime\server\image\topology
The sub directories denote the device types. For instance, …\topology\server
directory contains all the icons for servers. If you want to add a new icon, say,
Mac OS X, you can add a file named osx.gif (or other image file types such as
jpg). The new icons will take effect after next network discovery is finished.
SysUpTime User Manual
12
Copyright iDeskCentric Inc.
Right click on a node, depending on whether it is SNMP enabled, the following
popup menu will show up:
SysUpTime User Manual
13
Copyright iDeskCentric Inc.
To Parent Map
Rediscover It
Ping/Trace
Route/Telnet/SSH
Add Performance
Monitor
Graph View for
Selected MIB Object
Port View
SNMP Info
MIB Browser
Ignore Past SNMP
Traps
View All Uncleared
Alarms
Snapshot
Properties
SysUpTime User Manual
Jump to parent map.
Rediscover this node.
Use Ping/Trace Route, Telnet or SSH to check node
status.
Add a new monitor for this node
Plot graph for selected MIB object of the SNMP MIB
pane.
If node supports SNMP, it will display information
about all the ports of this node, including bandwidth
utilization, error percentage, etc.
If node supports SNMP, it will query SNMP agent to get
values and show them in a new dialog window. This
menu can be customized by modifying the
$INSTALL_DIR/client/config/snmpinfo.conf configure
file. You can add or remove menu items.
Launch MIB browser window.
If node has uncleared traps and the alarm browser is
open, node‟s color is red. You can use this menu item to
change it back to normal color.
View all the uncleared traps of this node in the past 24
hours.
Launch a new window to display information about this
node and its monitors.
Launch a properties window.
14
Copyright iDeskCentric Inc.
Editing Map
Every change you made to the map will be saved immediately. Right click on the
map to open context menu, and select a map editing operation.
To add a new device to the current map, you just need to drag the icon from
device panel to the map. When adding a new node, system will prompt user to
enter some parameters and it then automatically does a discovery against the new
node. If the node is not reachable, system will prompt user to discard it or not. If
the map is subnet, the newly added node will be automatically connected to
subnet.
If the map is top level map, you can drag a link to connect it with another device.
After a link is created, you can set its properties, and set the interfaces this link is
associated with. When the end interfaces of a link are not configured, the link is
red and the link positions will not be preserved even after save unless it is
correctly configured. Its color will be changed to blue after interfaces are properly
configured. If a node has only one interface, it will be automatically assigned to
the link. If a node has more than one interface, user needs to pick one of them and
assign it to the link. If a node has no unoccupied interface, then you need to add
one for it.
SysUpTime User Manual
15
Copyright iDeskCentric Inc.
Node Snapshot
Node snapshot lets users take a quick look at the status of the selected node.
In web client, the equivalent is the node “Status”. Right click on the map‟s node
to bring up a context menu, then select “Status” to view node‟s current status.
The upper panel displays properties of the node. The lower panel displays monitor
and host information. The type of chart of a monitor can be configured in the
“Add Monitors” dialog.
Pressing “Refresh” button will update the monitor and host information.
SysUpTime User Manual
16
Copyright iDeskCentric Inc.
Properties Window
Properties window displays the
properties of selected node. In
view mode, properties are grayed
out and cannot be modified. The
user needs to switch to edit mode
in order to change the properties
of nodes.
Network explorer window has to
be open, otherwise properties
window will not be updated.
Dashboard Window (Web client only)
Dashboard window displays important data such as status of nodes, recent alarms, and
top ten lists of monitors.
SysUpTime User Manual
17
Copyright iDeskCentric Inc.
Chapter 3. User and View Management
User Management
Each user is assigned one of the three privileges: admin, operator and observer.
By default, admin privilege has all the permissions and observer group has
minimum permissions. You can change their privileges in the “User Permissions”
window.
Each user is associated with zero or more organizations, which are tied to
different topology views.
User name must start with a letter or digit. And „@‟ is not allowed in user names.
The maximum length of user name is 20 characters. Number of allowed users
depends on the license type.
You can suspend a user by clicking the checkmark of the “Active” column.
After SysUpTime is installed, a default user “admin” with password “admin” is
created. You should change its password to a secure one to enhance security.
Change Password
Change current user‟s own password.
SysUpTime User Manual
18
Copyright iDeskCentric Inc.
User Permissions
This window is used to assign permissions to different groups. By definition,
administrator group has all privileges, and observer group has read-only
privileges.
For trap module, although observer group does not have privilege to change a
trap‟s properties, it still can view all the traps.
Manage Organization
An organization can have one or more users, and it can be associated with one or
more network views. A user can only open the views assigned to his organization.
SysUpTime User Manual
19
Copyright iDeskCentric Inc.
Create Custom View
Figure: Create a new custom view
Custom views can be used to create user-defined maps. It lets you create your
own set of devices based on device type, location, or other selection criteria. Each
custom view can be associated with an organization, so users who are not in the
right organizations cannot access the custom view. Administrators have access to
all the custom views.
Topology view is the global view and contains all the nodes. Nodes in the custom
views are the same as those in the topology view. If you edit the properties for a
node in the topology view, the node in other views will change as well. However,
if you delete a node from a custom view, it will not be deleted from topology
view.
SysUpTime User Manual
20
Copyright iDeskCentric Inc.
Custom views, unlike subnet map, can be rearranged and background image can
be inserted after switching to edit mode.
Custom view can be opened through “File/Open View” menu.
Figure: A custom view with five nodes
SysUpTime User Manual
21
Copyright iDeskCentric Inc.
Chapter 4. Network Discovery
Network discovery is an important step for network management. An accurate
topology map is vital for identifying network problems.
Major features of SysUpTime‟s discovery module:
o
o
o
o
Support for layer 3 and layer 2 discovery.
Accuracy.
CIM (Common Information Model) based object model.
Support for multiple protocols including SNMPv1/v2c/v3, PING, Netbios,
HTTP, etc.
o Unique mediation layer technology ensures unlimited extensibility. New
device support can be easily added by user.
o Periodical discovery.
o Automatically merge topology of a new discovery with the old one.
Manually added/hidden nodes will be preserved in new topology.
The menu of network discovery is shown below:
SysUpTime User Manual
22
Copyright iDeskCentric Inc.
Start Discovery
This dialog is for specifying discovery settings. The settings will be stored in
database so next time the user does not have to reenter them. If periodical
discovery is enabled, it will use the settings as well.
o Seed
It is the starting point of discovery. If no seed is specified, the default
gateway will be used.
SysUpTime User Manual
23
Copyright iDeskCentric Inc.
If the seed IP address is not reachable, SysUpTime will ask user to
continue discovery or not. If yes, the first IP address of the subnet will be
used as seed.
o Discover Public IPs
If selected, discovery will discover public IP addresses. Otherwise, all
public IP addresses will be ignored.
o Max Hops from Default Gateway
It is the number of maximum hops from SysUpTime server‟s default
gateway. Nodes with more hops will be ignored.
o Timeout
Timeout value for PING and SNMP queries in seconds. The minimum
value is one second. Smaller timeout value can speed up discovery, but it
may skip some unresponsive nodes.
o Number of Threads
Number of threads for discovery. More threads can speed up discovery
process but it may add too much network traffic.
o Ignore non SNMP enabled devices
If selected, all nodes without active SNMP agent or correct SNMP
community names will be ignored.
o Remove Existing Topology Data
If selected, previous discovery results and manually modified maps will be
discarded.
If not selected, SysUpTime will try to merge the new discovery result with
the old maps. All manually added/hidden nodes will be preserved. For
instance, if you hide a node, this node will be still invisible even if it is
discovered again. However, for manually deleted nodes, they will show up
again if they are discovered.
o Detect Network Services
If selected, network services such as FTP, HTTP and others will be
detected if they are active on the nodes being discovered.
SysUpTime User Manual
24
Copyright iDeskCentric Inc.
o SNMP Agent Properties
If SNMP agents to be discovered are SNMPv3 agents or SNMPv1/v2c
agents with non-default community names („public‟), then you need to add
their properties so that their SNMP values will be discovered.
o Discovery Filters
If you don‟t want to discover everything in your networks, then filter is a
great tool to limit discovery scope. Or if there are some subnets that
cannot be automatically discovered, you can set filters to force discovery
engine to discover them.
Filter can be set by the following conditions:
IP Range or IP address
Four formats are supported:
Subnet Format
IP range ends with „.*‟ or „.0‟ . For instance, “192.168.1.*”
or “192.168.1.0” mean all the IPs between 192.168.1.1 and
192.168.1.254.
Partial Subnet Format: Two IPs in the same subnet,
separated by „-„.
For example, “192.168.1.10 - 192.168.1.100” means all
the IPs between 192.168.1.10 and 192.168.1.100, inclusive.
CIDR Format
For example, “192.168.1.0/24” means all the IPs
between 192.168.1.1 and 192.168.1.254; “192.168.1.0/25”
means IPs between 192.168.1.0 and 192.168.1.127.
Individual IP: A single IP address.
If the value is empty, it means ALL IP addresses.
sysName
Value of SNMP MIB-II sysName.
SysUpTime User Manual
25
Copyright iDeskCentric Inc.
„*‟ and „?‟ are allowed for wildcard match. „*‟ matches an
arbitrary string of characters, and the string can be empty. „?‟
matches any single character.
For instance, “*” matches all system names; “test*” matches any
string starting with “test”; “te?t” matches “test”, “te1t”, or other
strings with similar pattern.
sysDescr
Value of SNMP MIB-II sysDescr
„*‟ and „?‟ are allowed for wildcard match.
Device Types
User can select one or more system types. System type is
determined by the value of sysObjectID. There is a list of
predefined mapping of sysObjectID‟s value to device type. And
new mapping can be configured through “Tools/Discovery/Device
Manager” menu.
Mode
IGNORE
Ignore all the nodes meeting the criteria.
MUST
Discovery engine must discover all the nodes meeting the
criteria.
If there are any conflicts between IGNORE and MUST mode,
MUST will take precedence. If filter settings conflict with other
discovery settings, filter settings take precedence.
Import filter button
Import „MUST‟ discovered IP or IP range list from a text file. File
format: each IP or IP range take one line.
SysUpTime User Manual
26
Copyright iDeskCentric Inc.
Here is an example:
IP Range
sysName
192.168.1.0
172.16.1.0
Windows*
192.168.2.10 –
192.168.2.150
192.168.3.1
sysDescr
Device Types
Host, Server
Mode
MUST
IGNORE
IGNORE
IGNORE
Discovery engine will discover all nodes except hosts or servers whose IPs are:
1. between 172.16.1.1 and 172.16.1.254 and
2. between 192.168.2.10 and 192.168.2.150 and
3. 192.168.3.1
The discovery should explicitly discover the 192.168.1.0 subnet.
Stop Discovery
Stop network discovery. However, network topology may not be accurate if
discovery is stopped in the middle.
Periodical Discovery
Discovery can be scheduled to occur periodically. Periodical discovery will reuse
settings of last discovery. If no manual discovery is done, periodical discovery
will use default settings. Periodical discovery starts at 00:00.
Partial Rediscovery
If a subnet or node‟s properties have changed and the changes do not affect others,
you can use partial rediscovery to update a subnet or node instead of launching a
full-scale rediscovery.
To invoke a partial rediscovery, right click on a node or subnet and select
“Rediscover It” menu.
Discovery Report
It shows a summary of the last network discovery.
Save Current Topology as Baseline
Save the current topology data, which can be used later to find changes.
SysUpTime User Manual
27
Copyright iDeskCentric Inc.
Compare Current Topology with Baseline
Compare current topology data with the saved baseline. It shows a report of
changes.
Device Manager
SysUpTime supports thousands of devices and applications. It also provides
excellent extensibility so that users can easily add new device support through
device manager. One requirement is new device must support SNMP. If a device
is supported, its properties, including device type, model, and other information
will be identified during network discovery.
The built-in devices cannot be modified or deleted. However, users can add a
device with the same sysObjectID value to overwrite the existing settings.
SysUpTime User Manual
28
Copyright iDeskCentric Inc.
The sysObjectID value is required and it will be used as a key to identify devices
during network discovery.
sysDescr contains: Enter keyword that sysDescr (SNMP MIB-II object) includes.
This field is necessary if two different devices with the same sysObjectID values
but different sysDescr values.
Other Properties: User can enter custom properties of new devices. Each property
has an OID, which will be used to query SNMP agent to get its value.
SysUpTime User Manual
29
Copyright iDeskCentric Inc.
Chapter 5. Event System
SysUpTime‟s event system is a powerful tool for processing SNMPv1/v2c/v3
traps/informs and internally generated performance events.
Event system consists of three major components: database tables for storing
events, trap receiver server on the server side, and alarm browser window on the
client side.
Trap Receiver Server
By default, trap receiver server will be automatically started when SysUpTime
server starts up. However, if you do not need trap receiver, you can disable it. To
disable trap receiver, edit
$INSTALL_DIR/server/server/default/conf/server.properties and change to
trapReciever=no.
The default port number of trap receiver is 162. On some platforms, this port may
already be occupied by some other application, then trap receiver cannot be
started unless you stop the application that takes port 162 first. If SysUpTime
server is running on Linux/UNIX, it must have root privilege in order to start trap
receiver at port 162.
In a clustered environment, there can be more than one trap receiver servers. In
this case, SysUpTime client connects to all trap receiver servers and display all
the received traps.
SysUpTime User Manual
30
Copyright iDeskCentric Inc.
Alarm Browser
On the SysUpTime client side, alarm browser is not opened the first time you
start SysUpTime client. Click “Tools/Alarm Browser/Open Alarm Browser”
menu to open it. If the alarm browser is open when you exit client, its state is
preserved and it will be opened next time you start client. By default, alarm
browser window can hold up to 1,500 traps. If number of alarms exceeds this
number, oldest ones will be removed.
Depending on the configuration, incoming alarms are stored in database or
discarded. You can use alarm browser window to view historical alarm data.
SysUpTime can be configured to periodically delete old alarms.
Alarm browser is divided into two panels. The upper panel shows summaries of
alarms. The lower one shows details of selected alarm. The status bar on the
bottom shows the current status of alarm browser.
SysUpTime User Manual
31
Copyright iDeskCentric Inc.
The following popup menu will show up if right clicking on a row. The menu
items there have the same effects as those under Tools/Alarm Browser.
SysUpTime User Manual
32
Copyright iDeskCentric Inc.
Menu Items of Alarm Browser Window:
Open Alarm
Browser
Close Alarm
Browser
Start Trap
Receiver Service
Stop Trap
Receiver Service
Set Filters
Display Historical
Alarms
Clear Selected
Rows
Change Severity
Send Email
Delete
Hide
Hide All
Ping
Trace Route
SysUpTime User Manual
Open alarm browser window. If alarm browser window is
already open, it will be brought to the front.
Close alarm browser window. The trap receiver on the
server side is not affected and continues to process
incoming alarms.
Start trap receiver for receiving SNMP traps.
Stop trap receiver.
Set filters to reduce alarms on the screen. Filter settings
are tied to the user name. That is, filter values are the same
for a user after he logs out and logs in again.
Load historical alarms from database and show them. If
number of traps is over 1,500, only the first 1,500 traps
are retrieved.
Clear selected one or more alarms. User will be prompt to
enter comment. Comment will be added to detail panel if
clearing succeeded. Other clients can see the change
immediately.
Change the severity of selected alarm both on the client
side and database. Other clients can see the change
immediately.
Send selected alarm via email. SMTP server needs to be
configured beforehand.
Permanently delete selected alarm both on the client side
and database. Other clients can see the change
immediately.
Hide selected rows. It does not affect alarms in the
database and other client will not be affected.
Hide all the traps. It does not affect alarms in the database
and other client will not be affected.
Ping the alarm originator to see if it is reachable.
Trace route the alarm originator.
33
Copyright iDeskCentric Inc.
There are five levels of severity: normal, warning, minor, major, and critical. And
their corresponding colors are:
Alarm Severity
Normal
Warning
Minor
Major
Critical
Color
white
yellow
orange
pink
red
Incoming alarms are sorted into five predefined categories depending on the event
configuration: Threshold, Error, Status, Application, Troubleshooting alarms. If
an incoming alarm is not configured, then it does not belong to any categories and
will be placed in the “All Alarms” tab. An alarm needs to be configured through
“Tools/Configure/Alarm /Event” to set its category. New categories can be added
in event configuration.
SysUpTime User Manual
34
Copyright iDeskCentric Inc.
In the upper panel of the alarm browser window, by default, the alarms are in
chronological order with the most recent alarm at the top of the list. You can sort
alarms by clicking the table header. The table columns are listed below:
Ack
It indicates whether the trap is acknowledged or not.
Acknowledging a trap means somebody is working on the network
issue but this issue has not been resolved yet.
Click the check mark of Ack column to acknowledge the trap. You
will be prompted to enter comment. The comment will be seen in
the detail panel.
Clear
When one client acknowledges a trap, the trap status is changed to
acknowledged in other active clients.
It indicates whether the trap is cleared or not. Cleared trap means the
network issue has been completely resolved. When a trap is cleared,
the color is changed to white.
Click the check mark of Clear column to clear the trap. You will be
prompted to enter comment. The comment will be seen in the detail
panel.
When one client clears a trap, the trap status is changed to cleared in
other active clients.
Severity
Source
Time
Message
Trap‟s severity.
The IP address of the trap sender.
The time when the trap was received.
Brief description of the trap.
Other functionality, such as trap de-duplication, event configuration, trap clearing,
and alarm escalation will be described in the configuration chapter.
SysUpTime User Manual
35
Copyright iDeskCentric Inc.
Chapter 6. Performance Management
It is important to measure network and systems performance in order to manage it.
SysUpTime‟s performance management warns you proactively of potential
problems in the managed environment. Performance management monitors
network performance variables to ensure that it is maintained at an acceptable
level. Network throughput, user response time, and line utilization
are good examples of variables that are monitored.
SysUpTime periodically collect and monitor performance variables. When a
performance threshold is exceeded, an alarm is posted in the alarm browser
window and its associated actions will be performed. There are two different
ways to manage threshold in SysUpTime:
o Self-learning Dynamic Statistical Baseline (based on historical data)
SysUpTime continuously examines what has happened in the past, learns
from it, and creates a dynamic baseline of "normal" performance data. In
operation, SysUpTime then computes and looks for deviations from those
normal parameters. The automated self-learning baseline approach
eliminates time-consuming manual threshold administration by
automatically generating dynamic thresholds for thousands of monitors.
o Multi-level Fixed Thresholds
It allows user to set multiple thresholds (based on time) with each
threshold corresponding to an alarm severity level. Each threshold can be
associated with a time frame. For instance, for weekdays, we can set a
threshold of 80 with severity level of major, 75 with severity of minor; and
for weekends, we can set a threshold of 60 with severity level of major, 55
with severity of minor.
Take for another example that you have configured your system to alert
you if your router‟s interface utilization reaches 80 percent. But, what if
your router has been running at a 79 percent for all week? If your system
is not configured to send you an alarm below 80 percent, you will not even
notice this potentially dangerous anomaly in your router till trouble
actually strikes. A proactive stance would be to not let such a situation
arise. You can set multiple thresholds for alarms, one at the critical point
and another before that when the load reaches, say 10 percent before the
critical point.
SysUpTime User Manual
36
Copyright iDeskCentric Inc.
Add a New Monitor
This window lists available monitor types. Press “New” button to create a
new monitor.
To easily create core performance monitors (such as CPU, memory, disk,
bandwidth) easier, you can use SNMP or WMI monitor wizards to do this
job. Wizards just ask you enter a few parameters and then automatically
create monitors for you, and it will save you a lot of time. When you use
wizards to create monitors, you cannot specify all the parameters of
monitors. You can use “Manage Monitors” screen to modify each
monitors‟ settings.
SysUpTime User Manual
37
Copyright iDeskCentric Inc.
Common Form Values
The following figure is the first screen of creating a new PING monitor:
SysUpTime User Manual
38
Copyright iDeskCentric Inc.
Host Name
Specify the host name of IP address of the network node to be monitored. If
user enters an IP address, system will try to resolve it to a DNS name and use
DNS name internally.
Some monitors allow multiple host names separated by comma or semicolon.
Monitor
Name
Polling
interval
Decrease
polling
interval by
x times
A meaningful name for this monitor.
Threshold
settings
Actions
User needs to press “Configure” button to set up threshold.
Depends on
If this monitor depends on another one, it cannot run until the other monitor‟s
state meets the specified condition. For example, if it depends on monitor A,
and the “Depends condition” is “Ok”, then it can run only when monitor A‟s
performance threshold is not exceeded; if the “Depends condition” is
“ERROR”, then it can run only when monitor A is in alarm or error states.
The interval between pollings.
The default value is 1, which means polling interval stays constant. For
instance, if the value is 5 and the polling interval is 10 minutes. When the
threshold is exceeded, the polling interval will be changed to 2 minutes. The
polling interval will go back to normal when rearm occurs.
Configure actions for this monitor only. Actions will be triggered when an
event (alarm or rearm) occurs. You can use
“Tools/Configure/Alarm/Event/Performance monitor” to configure global
actions for all performance monitor.
Multiple levels of dependency are supported. That is, monitor A can depend on
monitor B, and monitor B can depend on monitor C.
A monitor can only depend on zero or one monitor. However, it can be
depended by zero or more monitors.
Example:
We want to monitor the state of three Windows services A, B and C. Service A
and B depend on C. If C fails, A and B will fail too. We can create three
monitors for A, B and C, and make A and B depend on C. So if C fails, we
will receive only one alarm instead of three.
Group
A monitor can belong to a group. If later this group is deleted, all monitors in it
will be removed.
Monitor
Type
Snapshot
This value will be used for grouping similar monitors. It will be used in the
reporting and top-N functions, such as top 10 nodes by CPU utilization.
Optional. Chart properties of this monitor in snapshot. Press “Configure”
SysUpTime User Manual
39
Copyright iDeskCentric Inc.
properties
button to configure it.
Save run
results to
database
Test run
Specify whether to save data in database. Data can be used later for reporting,
trending, graphing, etc.
Advanced
options
By default, a monitor will start immediately and run 7X24 for unlimited times.
You can change all those options.
Specify whether to do a test run, which can help determine if all monitor
settings are correct.
SysUpTime User Manual
40
Copyright iDeskCentric Inc.
Edit Metrics:
This screen lets you configure threshold and other parameters specific to
this metric. Press “=>” button to configure threshold for selected metric.
After configuring metric is finished, it will be placed to the right panel. It
can be edited again by pressing the “Edit...” button.
Actions
Actions will be triggered when an event (alarm or rearm) occurs. The
following actions are supported:
SysUpTime User Manual
41
Copyright iDeskCentric Inc.
Email
Send emails based on different time frame
HTTP Action
Post to a web site using either GET or POST methods. Form data
can be specified for POST method.
Run Command
Execute a SysUpTime server side command. You can embed
token $ip in the command. Token $ip is the IP address of the
host being monitored. This is a sample command that uses $ip:
ping $ip
Run Remote Command
Use SSH/Telnet/RPC to login and then execute a command on
remote computer, including Windows and Linux/UNIX
machines. You can embed token $ip in the command. Token $ip
is the IP address of the host being monitored.
Computer Action
Reboot/Power off a remote computer, including Windows and
Linux/UNIX machines.
Service Action
Start/Stop/Restart a service on a remote computer, including
Windows and Linux/UNIX machines.
Kill Process Action
Kill a running process on a remote computer, including Windows
and Linux/UNIX machines.
Alarm Sound
Play sound on the client side. So the SysUpTime client needs to
be up and running.
Only MP3 sound file format is supported. To add new sound
files, you can just copy new MP3 files to this directory:
$INSTALL_DIR/server/server/default/deploy/app.war/sound
SysUpTime User Manual
42
Copyright iDeskCentric Inc.
Authentication is usually required if you need to access remote machine.
The following dialog is for entering user/password information. Protocol
field is for specifying the protocol that will be used for communicating
with the server. The supported protocols are SSH/Telnet/Windows RPC.
Windows RPC should be selected if the remote machine is a Windows
machine. Windows RPC is not available if the SysUpTime server runs on
Linux.
Buttons:
Test Run
Save As Default
Actions
Load Default
Actions
SysUpTime User Manual
Perform a test run. The selected actions will be
performed. For instance, if one of the selected
actions is rebooting a machine, SysUpTime
server will try to reboot it. This way can test if
there are any incorrect parameters in action
settings.
Save the current actions to database, which can
be used later so you don‟t have to enter the same
action next time.
Load the default actions (saved beforehand) from
database.
43
Copyright iDeskCentric Inc.
Configure Threshold:
This screen is for configuring alarm and rearm threshold.
Enable threshold:
By default, threshold checking is enabled. If disabled, monitor will only
collect data.
SysUpTime User Manual
44
Copyright iDeskCentric Inc.
Threshold:
Fixed Threshold
Threshold is fixed. You need to know what is normal and what is out
of range first in order to set fixed threshold.
Press “Advanced” button to configure different fixed thresholds with
different severity level for time ranges. For example, if your web
server‟s traffic varies dramatically on weekdays and weekend. You
can set a threshold for weekdays, and another threshold for weekend.
Adaptive Statistical Threshold
It uses dynamic rolling baseline to manage threshold. Baseline data is
collected over a period of time, and baseline data is constantly updated
as new data is collected. Threshold is automatically set based upon
standard deviations of collected baseline data, or the average value of
the past data. No alarm will be raised if minimum set of baseline data
has not been collected.
The duration of the baseline period should be sufficiently long to span
a similar variety of operating modes as will likely occur in the future.
Baseline interval is the length of time over which one set of data that
will be baselined is collected.
The threshold is measured by number of standard deviations. If the
collected data follows a Normal distribution, a range covered by one
standard deviation includes about 68% of the total data; a range of two
standard deviations about 95% of the total data; and of three standard
deviations about 99.7% of the total data. For example, suppose a
baseline value for a Ping monitor's round-trip time is 10 seconds and
the standard deviation is 2 seconds. If the threshold is three times the
standard deviation, then the monitor will remain in a good condition as
long as it is round-trip time does not exceed 16 seconds. This can be
represented as a formula of:
if(round-trip > (baseline + (multiplier * stddev)) then threshold is
exceeded
Substituting the numbers from the example above gives:
if(round-trip > (10 + (3 * 2)) then threshold is exceeded
SysUpTime User Manual
45
Copyright iDeskCentric Inc.
For instance, we plan to use statistical threshold to monitor a business
web site. We create a web site monitor with polling period of 5
minutes and set its threshold to be 3 standard deviations. We assume
the web traffic patterns are similar on a weekly basis. So we set the
baseline interval to 7 days. By default, the minimum set of baseline
data is 5, and the maximum set of data is 10. We choose to use the
default values. After monitor is started, it collects data for 35 days
(because the minimum set of data is 5 and the baseline interval is 7
days), and then starts to computer statistical values and checks for
threshold violation. If system collects data at 10:00 AM on Monday,
system will use the previously collected sets of Monday 10:00 AM
performance data to compute standard deviations and check if
threshold is exceeded. If threshold is not exceeded, this new data will
be added to baseline data and used later for computing statistical
values. So baseline data is constantly updated and can always adapt to
current situations.
Press “Advanced” button to configure boundaries for baseline data.
Sometimes it is necessary to set boundaries for baseline data to ensure
that baseline data is normal.
Rearm Threshold:
Configure threshold for rearm event, that is, clearing alarm event. The
rearm indicates that the monitored object has returned to a normal state.
When rearm conditions are satisfied, a rearm event will be posted to alarm
browser window and it can automatically clear corresponding threshold
alarm.
SysUpTime User Manual
46
Copyright iDeskCentric Inc.
Monitor Types
DNS Monitor
The DNS monitor checks a domain name server. It verifies that the DNS
server can respond to requests and domain name can be correctly resolved.
Metrics Configuration:
Host name to be
resolved
Resolving host
result
Enter a host name, such as “www.google.com”.
This name will be passed to DNS server to be
resolved to an IP address.
Optional. Enter one or more IP addresses
corresponding to the host name, separated by
semicolon.
Threshold Configuration:
Round trip time
The response time of DNS query
Database Query Monitor
Send SQL queries to Database server and measure response time and/or
check content of response. Major database servers such as Oracle, MS
SQL Server, Sybase, DB2, MySQL, and PostgreSQL are supported.
Metrics Configuration:
Database name
SQL statement
Name of the database.
An SQL statement to be used for query.
Threshold Configuration:
Record rows
Content match
Result column 1
Result column 2
SysUpTime User Manual
Number of rows returned from SQL query.
Check the result of the SQL query.
Check the first column of the result of the SQL
query.
Check the second column of the result of the
SQL query.
47
Copyright iDeskCentric Inc.
Directory Monitor
The Directory monitor watches an entire directory and reports on the total
number of files in the directory, the total amount of disk space used, and
the time (in minutes) since any file in the directory was modified. This
information is useful if you have limited disk space, you want to monitor
the number of files written to a specific directory, or you want to know the
activity level in a certain directory.
Metrics Configuration:
Directory
path
Enter the directory that you want to monitor. The
directory is relative to the SysUpTime server. To
monitor a directory on a remote machine in a
Windows NT/2000 network, enter the UNC name for
that directory. For example:
\\192.168.1.100\sharedDir.
If checked, subdirectories will be counted.
Check
subdirectories
This option affects all the threshold metrics. If
Check for
checking failed, an error will be raised.
directory
changes
Three modes:
No checking
SysUpTime does not check for directory changes.
Compare to last contents
SysUpTime compare the directory with the
previous results.
Compare to first contents
SysUpTime compare the directory with the first
results.
Check
metrics
It doesn‟t matter if the mode of “Check for directory
changes” is “No checking”.
Three options:
File name
When checking for directory changes, only file
names are considered.
File name and size
When checking for directory changes, only file
names and their sizes are considered.
File name, size and modified time
When checking for directory changes, only file
SysUpTime User Manual
48
Copyright iDeskCentric Inc.
names, their sizes and modification time are
considered.
Threshold Configuration:
Number of files
Directory age
Total size of the
directory
Check if the number of files in the monitored
directory exceeds a given number.
Check if the age of the monitored directory exceeds
a given number of minutes.
Check if the total size of the directory exceeds a
certain number of bytes.
E-Mail Monitor
The E-Mail monitor checks an email Server via the network. It verifies
that the email server is accepting requests, and also verifies that a message
can be sent and retrieved. It does this by sending a standard email message
using SMTP and then retrieving that same message via a POP3 user
account. Each message that SysUpTime sends includes a unique key
which it checks to insure that it does not retrieve the wrong message and
return a false OK reading. If SysUpTime is unable to complete the entire
loop it generates an error message.
SysUpTime User Manual
49
Copyright iDeskCentric Inc.
Metrics Configuration:
Action
Select the action the E-Mail Monitor should take with
respect to the mail server. The Send &
receive option will allow you to send a test message to
an SMTP server and then receive it back
from the POP3 or IMAP4 server to make sure the mail
server is up and running. Use the Receive
only option to check the incoming POP3 or IMAP4
email servers for a message that was sent
previously. This check is done by matching the content
of the previously sent message. The Send
only option checks that the receiving email server has
accepted the message.
Note:
If the Receive only option is selected, you should use
this monitor for a dedicated email account that is NOT
being accessed by any other email client. If another
email client attempts to retrieve email messages from
the account that the E-Mail Monitor is monitoring in
Receive only mode, the monitor and the other mail
client may lock each other out of the account such that
neither is able to retrieve the messages.
Send E-Mail configuration
SMTP server Enter the hostname of the SMTP server to which the
test mail message should be sent (for example,
smtp.foo.com).
User name and password if SMTP server requires
User name/
authentication.
Password
The email address to which the test message is sent
From
from.
The email address to which the test message should be
To
sent.
The subject of the test email message.
Subject
The body of the test email message.
Body
The full path name of a file to add as an attachment to
Attachment
the test email message.
Encoding of the email body. The default is Cp1252
Encoding
(Latin).
Timeout value for sending the test message.
Timeout
SysUpTime User Manual
50
Copyright iDeskCentric Inc.
Receive E-Mail configuration
The protocol used for receiving emails, either POP3 or
Protocol
IMAP4.
Mark deleted If checked, fetched messages will be deleted on the
server side.
The host name or IP address of POP3 or IMAP4 server
Server
User name and password if server requires
User name/
authentication.
Password
Timeout value for receiving the test message.
Timeout
For “Send and receive” mode only, SysUpTime waits
Delay
after message has been sent and then starts fetching the
email.
Threshold Configuration:
Send time
Receive time
Round trip time
Receive content
match
SysUpTime User Manual
The time used for sending out the email. It is not
valid for “Receive only” action.
The time used for receiving emails. It is not valid
for “Send only” action.
The time used for sending and receiving emails.
Check content of the received emails. It is not valid
for “Send only” action.
51
Copyright iDeskCentric Inc.
Monitor MS Exchange Server
If you want to check the SMTP/POP3/IMAP4 functionality of Exchange
server, you can create Email monitors. For example, you can create an
Email “Send and Receive” monitor to check if a user can send out an
email via SMTP and receive the email via POP3 or IMAP4.
For Exchange server with version earlier than Exchange server 2000, you
can create SNMP monitors to check metrics of it. For Exchange server
2000 and later versions, you can create Exchange server monitors to
monitor critical Exchange services and performance counters (Information
Store, mailboxes, SMTP service, etc.).
SysUpTime User Manual
52
Copyright iDeskCentric Inc.
Command Executor Monitor
Run command on the server side and compare the output against threshold.
Metrics Configuration:
Encrypt
the
command
Timeout
If checked, command to be executed will be encrypted.
This is necessary if commands contain sensitive data such
as passwords. The command is not editable if this option is
checked.
Timeout value for executing the command.
Threshold Configuration:
Response time
Content match
The time used for executing the command.
Check the result of the command.
Here is an example of content match for command “ping
www.google.com”. On windows, the command line output is listed below:
“
Pinging www.l.google.com [64.233.161.147] with 32 bytes of data:
Reply from 64.233.161.147: bytes=32 time=490ms TTL=233
Reply from 64.233.161.147: bytes=32 time=470ms TTL=232
Reply from 64.233.161.147: bytes=32 time=476ms TTL=232
Reply from 64.233.161.147: bytes=32 time=477ms TTL=233
Ping statistics for 64.233.161.147:
Packets: Sent = 4, Received = 4, Lost = 0 (0% loss),
Approximate round trip times in milli-seconds:
Minimum = 470ms, Maximum = 490ms, Average = 478ms
“
There is an empty line in the beginning of the result but it will be ignored
(All the leading blank lines are ignored). If we want to check the response
time from the first “Reply from” line, we can set:
SysUpTime User Manual
53
Copyright iDeskCentric Inc.
And in the threshold configuration screen:
Although the token fetched is “time=490ms” which contains both letters
and digits, it will be converted to digit and check against threshold (600.0)
in this case.
SysUpTime User Manual
54
Copyright iDeskCentric Inc.
File Monitor
The file Monitor reads a specified file. In addition to checking the size and
age of a file, the file monitor can help you verify that the contents of files,
either by matching the contents for a piece of text, or by checking to see if
the contents of the file ever changes.
Metrics Configuration:
File path
No error
if file not
found
File
encoding
Check for
content
changes
Enter the fully qualified name of the file to be monitored.
For example, c:\docs\doc1.doc.
If checked, no alarm will be raised when the file being
monitor does not exist.
The encoding of the file if it is a text file.
If checking failed, an error alarm will be raised.
Three modes:
No checking
SysUpTime does not check for content changes
Compare to last contents
Compare the contents to the last one.
Compare to saved contents
Compare the contents to the saved contents. If the
saved contents change after monitor starts, the change
will not be honored.
Threshold Configuration:
Content match
File size
Status
SysUpTime User Manual
Check the content of the file.
Check the size of the file.
Check if error occurs.
55
Copyright iDeskCentric Inc.
FTP Monitor
The FTP monitor attempts to log into an FTP server and retrieve a
specified file. A successful file retrieval assures you that your FTP server
is functioning properly.
In addition to retrieving specific files, the FTP monitor can help you verify
that the contents of files, either by matching the contents for a piece of text,
or by checking to see if the contents of the file ever changes compared to a
reserve copy of the file.
Metrics Configuration:
Remote
host
File path
File
encoding
Check for
content
changes
The host name or IP address of the FTP server.
The file name to retrieve, for example /pub/readme.txt
The encoding of the file if it is a text file.
If checking failed, an error alarm will be raised.
Three modes:
No content checking
SysUpTime does not check for content changes.
Compare to last contents
Compare the contents to the last one.
Compare to saved contents
Compare the contents to the saved contents. If the
saved contents change after monitor starts, the change
will not be honored.
Threshold Configuration:
File content
match
File size
Round trip time
SysUpTime User Manual
Check the content of the received file.
Check the size of the received file.
Check the round trip time of receiving a file.
56
Copyright iDeskCentric Inc.
Log File Monitor
The log file monitor watches for specific entries added to a log file by
looking for entries containing a text phrase or a regular expression.
Metrics Configuration:
File path
No error
if file not
found
File
encoding
Check
from
beginning
Enter the fully qualified name of the file to be monitored.
For example, c:\docs\doc1.doc.
If checked, no alarm will be raised when the file being
monitor does not exist.
The encoding of the file if it is a text file.
If checking failed, an error alarm will be raised.
This setting controls what SysUpTime will look for and
how much of the target file will be checked each time that
the monitor is run. Three modes:
Never
Check only newly added records, starting at the time
that the monitor was created (not when the file was
created). This is the default behavior.
First time only
Check the whole file once when the monitor is first
created, then only for new records on each subsequent
monitor run. Use this option to check a file that
already had entries before the monitor was created or
started.
Always
Always check the contents of the whole file.
Threshold Configuration:
Content match
Size
SysUpTime User Manual
Check the content of the file.
Check the size of the file.
57
Copyright iDeskCentric Inc.
LDAP Monitor
The LDAP monitor verifies that a Lightweight Directory Access Protocol
(LDAP) server is working correctly by connecting to it and performing a
"simple" authentication. Optionally, it can check the
result for expected content.
Metrics Configuration:
Remote
host
Object
Query
LDAP
filter
Search
SysUpTime User Manual
LDAP server data.
LDAP service provider
Host name or IP address of LDAP server, or a URL string such as
ldap://server:389
Security principal
User name.
Security credentials
Password.
Use this box to enter an object query to look at a LDAP object other than
the default user dn object. For example, enter the mail object to check for
an e-mail address associated with the dn object entered above. You must
enter a valid object query in this text box if you are using a LDAP filter.
Enter an LDAP filter in this text box in order to perform a search using a
filter criteria. The LDAP filter syntax is a logical expression in prefix
notation meaning that logical operator appears before its
arguments. For example, the item sn=Smith means that the sn attribute
must exist with the attribute value equal to Smith. Multiple items can be
included in the filter string by enclosing them in parentheses, such as
(sn=Smith) and combined using logical operators such as the & (the
conjunction operator) to create logical expressions. For example the filter
syntax (& (sn=Smith) (mail=*)) requests LDAP entries that have both a
sn attribute of Smith and a mail attribute.
More information about LDAP filter syntax can be found at
http://www.ietf.org/rfc/rfc2254.txt and also at
http://java.sun.com/products/jndi/tutorial/basics/directory/filter.html
Three modes:
58
Copyright iDeskCentric Inc.
The named object: Search the named object.
One level of the named context: Search one level of the named
context.
Subtree at the named context: Search the entire subtree rooted at
the named object.
Specifies the attributes that will be returned as part of the search. Empty
Return
Attributes value indicates that all attributes will be returned.
scope
Threshold Configuration:
Content match
Round trip time
Check the content of the received file.
Check the round trip time of LDAP query.
Ping Monitor
Ping monitor sends ICMP PING requests to check the status of network
nodes.
Metrics Configuration:
Timeout
Timeout value for PING requests, in milliseconds.
Threshold Configuration:
Packet round
trip time
Packet success
rate
SysUpTime User Manual
The round trip time of the PING request.
For each run, monitor sends three PING requests
and calculate the success rate. The delay between
PING requests is one second.
59
Copyright iDeskCentric Inc.
SNMP Monitor
SysUpTime provides comprehensive SNMP monitoring capacities. The
SNMP monitor issues SNMPv1/v2c/v3 requests to retrieve the values
from SNMP agents and check against preset threshold values.
SNMP monitor wizard hides the complexity of SNMP. It provide an easy
way to create SNMP monitors of core performance metrics such as CPU,
memory, network utilization.
Requirements for using the SNMP monitor include:
SNMP agents must be deployed and running on the servers and
devices that you want to monitor
The SNMP agents must be supplied with the necessary Management
Information Bases (MIBs) and configured to read those MIBs/
You need to know the Object ID's (OIDs) of the parameters you want
to monitor.
Metrics Configuration:
OID/Expression Enter SNMP OID or math expression, which specify
which value should be retrieved from the SNMP
name
agent.
Port number
Community
Timeout
Retries
Version
See the following OID/Expression section for more
details.
The port number of SNMP agent.
The community string of SNMP agent. The default
value is “public”. If its value is empty, the default
value will be used instead.
Timeout value for PING requests, in milliseconds.
Number of retries for SNMP requests after requests
fail.
The SNMP version number of SNMP agent.
Threshold includes comparison of numeric value and content match. For
instance, you can create a monitor with numeric threshold to check
interface utilization of a node, or a monitor with content match threshold
to check whether the SNMP sysDescr string has been changed to another
value.
SNMP OID/Expression
If OID ends with “.s” (such as 1.3.6.1.2.1.25.4.2.1.2.s ), it means all the
values under this subtree (1.3.6.1.2.1.25.4.2.1.2) will be retrieved, and the
SysUpTime User Manual
60
Copyright iDeskCentric Inc.
values will be treated as string data type and concatenated into a string
separated by new line character.
If OID ends with “.d” (such as 1.3.6.1.2.1.25.4.2.1.2.d ), it means all the
values (must be numeric) under this subtree (1.3.6.1.2.1.25.4.2.1.2) will be
retrieved, and the sum of the values will be calculated and returned.
If OID ends with “.”, it means it is a tabular object whose index needs to
be supplied. If you have this type of OID in an expression, you will be
prompted to enter its index value.
Each expression has a name, expression body and description. Expression
name can only start with a letter. Expression can have one or more
variables, with each variable corresponding to an SNMP OID. After
querying SNMP agent, the variables will be replaced with the values
corresponding to their OIDs. And then those variables will be fed into the
expression to calculate the final value of the expression.
SysUpTime User Manual
61
Copyright iDeskCentric Inc.
The following functions are supported in expression:
double abs(double a)
Returns the absolute value of a double
value.
float abs(float a)
Returns the absolute value of a float value.
int abs(int a)
Returns the absolute value of an int value.
long abs(long a)
Returns the absolute value of a long value.
double acos(double a)
Returns the arc cosine of an angle, in the
range of 0.0 through pi.
double asin(double a)
Returns the arc sine of an angle, in the
range of -pi/2 through pi/2.
double atan(double a)
Returns the arc tangent of an angle, in the
range of -pi/2 through pi/2.
double atan2(double y, double x)
Converts rectangular coordinates (x, y) to
polar (r, theta).
double ceil(double a)
Returns the smallest (closest to negative
infinity) double value that is not less than
the argument and is equal to a
mathematical integer.
double cos(double a)
Returns the trigonometric cosine of an
angle.
double exp(double a)
Returns Euler's number e raised to the
power of a double value.
double floor(double a)
Returns the largest (closest to positive
infinity) double value that is not greater
than the argument and is equal to a
mathematical integer.
double log(double a)
Returns the natural logarithm (base e) of a
double value.
double max(double a, double b)
Returns the greater of two double values.
float max(float a, float b)
Returns the greater of two float values.
int max(int a, int b)
Returns the greater of two int values.
long max(long a, long b)
Returns the greater of two long values.
double min(double a, double b)
Returns the smaller of two double values.
float min(float a, float b)
Returns the smaller of two float values.
int min(int a, int b)
Returns the smaller of two int values.
long min(long a, long b)
Returns the smaller of two long values.
double pow(double a, double b)
Returns the value of the first argument
raised to the power of the second
argument.
double random()
Returns a double value with a positive
sign, greater than or equal to 0.0 and less
than 1.0.
double rint(double a)
Returns the double value that is closest in
value to the argument and is equal to a
mathematical integer.
long round(double a)
Returns the closest long to the argument.
int round(float a)
Returns the closest int to the argument.
double sin(double a)
Returns the trigonometric sine of an angle.
double sqrt(double a)
Returns the correctly rounded positive
square root of a double value.
double tan(double a)
Returns the trigonometric tangent of an
angle.
For example, we can use max function to calculate the interface utilization
for full-duplex point-to-point media:
max(ifInOctets, ifOutOctets) * 8 / ifSpeed * 100
SNMP monitor can query agent using an OID or expression. You can
choose one from a list of predefined expressions, or create a new
expression. For example, ifutil is defined as:
(ifInOctets + ifOutOctets) * 8 / ifSpeed * 100
SysUpTime User Manual
62
Copyright iDeskCentric Inc.
ifInOctets, ifOutOctets and ifSpeed are tabular objects whose OID ends
with “.” in the expression, so you need to supply an index for them.
Expression also supports string values. If values of variables are string
type, their values are concatenated in this way:
If they are scalar objects (only one value for each variable), there
values are concatenated into value1<>value2<>…(“<>” is the
delimiter). The order of values are determined by the order of variables
in the variable list.
Here is an example:
This example concatenates sysDescr and sysLocation variables. A
sample result is:
Linux lserver 2.6.9-5.0.3.ELsmp #1 SMP i686<>Unknown<>
If they are tabular objects, values are concatenated line by line, with
columns separated by „<>‟. For instance, if we have two variables and
their values are
“A
B
C”
and
SysUpTime User Manual
63
Copyright iDeskCentric Inc.
“1
2
3”
The final result is
“A<>1<>
B<>2<>
C<>3<>”
A real world example is an expression for checking the running status
of a process on Linux. If the default NET-SNMP agent is running, you
can configure its snmpd.conf file to let it report the status of processes.
For example, we want to monitor the sshd process, so we add a line to
the snmpd.conf:
proc sshd
Then the prTable should report sshd‟s running status, as shown below:
To monitor if a process is OK, we need to check both “prNames” and
“prErrorFlag” columns to make sure that the process‟ name is there
and its prErrorFlag‟s value is 0 (no error).
We create the following expression:
SysUpTime User Manual
64
Copyright iDeskCentric Inc.
The OIDs of prNames and prErrorFlag end with “.s” because we need
to get all the values under the subtrees.
A sample result is:
sshd<>0<>
firefox<>0<>
gvim<>0<>
In the threshold screen, we set the condition to be “Not Contains” and
the threshold value is “sshd<>0<>”. Then if sshd process is down, the
value will be changed to “sshd<>1<>” and an alarm will be raised.
Note:
The order of the result is not determined by the expression in this case.
That is, the result would be the same if you changed the expression
from “prNames + prErrorFlag” to “prErrorFlag + prNames”. The
order is determined by the variable order in the “Variable Name” table.
If you moved prErrorFlag to be the first variable, the result would be
“0<>sshd<>”.
SNMP Counter Objects
All SNMP counter data types are converted to rate. For instance, in the
aforementioned ifutil expression, ifInOctets and ifOutOctets are counters,
the values of them in the expression will be their rates, that is
SysUpTime User Manual
65
Copyright iDeskCentric Inc.
ifInOctets = ( ifInOctets(t2) – ifInOctets (t1) ) / (t2 – t1)
ifOutOctets = ( ifOutOctets(t2) – ifOutOctets (t1) ) / (t2 – t1)
where t2 and t1 are the time of two pollings. Rate cannot be computed if
there is only one value. So the first value of an expression with counter
variables will be always unavailable.
In SNMP agent, SNMP counter value will be reset if it reaches its
maximum value. SysUpTime can handle a single counter wrap properly. If
two counter wraps occur between two polling data, the result will be
wrong. So you need to set a proper polling interval if SNMP counter is
involved. The maximum value of a 32 bit counter is 4,294,967,296. For
the ifInOctets counter, it will reach maximum value and reset in about 6
minutes if the link speed is 100Mbps, and about 30 seconds if the link
speed is 1Gbps.
If you want to use the raw values of counter objects instead of their rates,
the variable names must start with “raw_”, for example, “raw_ifInOctets”.
If the counter object is actually a gauge object, which means its value can
fluctuate, but it was mistakenly defined as a counter object in the MIB,
you can use a variable name starting with “g_”, then this variable will be
treated as a gauge instead of counter.
Port Monitor
Port monitor verifies that a connection can be made to a network port and
measures the length of time it takes to make the connection. Optionally, it
can look for a string of text to be returned or send a
string of text once the connection is made.
Metrics Configuration:
Port
Timeout
String to
send
SysUpTime User Manual
Port number to connect to.
Timeout value for network connection, in milliseconds.
String to be sent. It can be one line or multiple lines. New
line characters will be preserved if present. If it is empty,
this port monitor will not send out any strings and just
check if the socket connection is OK.
66
Copyright iDeskCentric Inc.
Threshold Configuration:
Port content
match
Port response
time
Check the content of response.
Check the response time.
Web Sites
Send one or more HTTP/HTTPS requests to monitor web servers. It can
be used to monitor the performance and availability of web servers, and
performance of multi-step web transactions (banking, shopping carts, etc.).
Functionality includes:
Availability check
Performance check
Content verification
POST URL Monitoring (Form submission)
Password protected sites
Follow Redirection
Radius Monitor
The Radius monitor checks that a RADIUS server is working correctly by
sending an authentication request and checking the result.
Metrics Configuration:
Remote
host
Secret
phrase
Retries
Timeout
Select or create a host to be monitored.
The secret phrase used to encrypt all requests to this
RADIUS server
Number of retries after queries fail.
Connection timeout value.
Threshold Configuration:
Content match
Round trip time
SysUpTime User Manual
Check the result.
Check the response time.
67
Copyright iDeskCentric Inc.
Telnet and SSH Monitors
Use Telnet or SSH to connect to remote Linux/UNIX server and issue
commands and check the results against thresholds. The more secure
version of SSH, SSH2, is supported. Telnet/SSH monitors are powerful
tools to monitor the detailed status of servers. For instance, they are
commonly used to monitor the CPU, memory, process information of
Linux/UNIX servers.
Metrics Configuration:
Select or create a host to be monitored.
Remote
host
Command The command to be issued after connected to the host.
Threshold Configuration:
Content match
Response time
SysUpTime User Manual
Check the result of the command.
Check the response time.
68
Copyright iDeskCentric Inc.
WMI Monitor
The WMI monitor is used to monitor the status of Windows machines.
WMI monitors are powerful tools to monitor the detailed status of
Windows machines. For instance, they are commonly used to monitor the
CPU, memory, process information of Windows servers.
SysUpTime User Manual
69
Copyright iDeskCentric Inc.
Windows Event Log Monitor
The Windows Event Log monitor watches Windows Event Logs (System,
Application, Security or others) for newly added entries. It can scan
Windows Event logs on local or remote computers and look for specific
Event Sources, Categories, and Event IDs as well as for patterns in the
Description of the Event.
The Windows Event Log Monitor examines only log entries made after
the time that the monitor is created. Each time the monitor runs thereafter,
it examines only those entries added since the last time it ran. You can
choose to filter out messages that are not important.
Metrics Configuration:
Remote
host
Timeout
Log name
Type
Source
Category
Event ID
User
Computer
Select or create a host to be monitored.
Timeout value.
Select all or one of Application, Security, System or userdefined log.
Event severity.
Event source.
Event category.
Event ID
Value of the user field of the event.
Value of the computer field of the event.
Threshold Configuration:
Content match
Response time
Match count
SysUpTime User Manual
Check the result of the event query.
Check the response time.
The total number of retrieved events.
70
Copyright iDeskCentric Inc.
Monitors Snapshot
Monitors snapshot gives a snapshot of the current state of all the active monitors.
The results can be automatically refreshed periodically.
Change Default Values of Monitors
The default values, such as timeout and port, come from an XML located at
$INSTALL_DIR/server/server/default/conf/client-monitor.xml. You can use any
text editors to change default values or add new monitor types.
Example 1: Add a new Ping monitor whose timeout value is 30 seconds
<ServiceCommunity name="PING">
<ServiceFamily name="PING">
<Service name="PING" tooltip="tooltip_ping">
<Metrics name="PING" protocol="PING" length="190" height="30">
<Parameter name="timeout" input="JTextField"
validation="com.yxkj.mainframe.performance.PositiveIntValidator"
unit="MILLISECONDS">
5000</Parameter>
<ConfigThreshold name="PACKET_RTT" unit="MILLISECONDS"/>
<ConfigThreshold name="PACKET_SUCCESS_RATE"/>
</Metrics>
</Service>
<!---NEW -
<Service name="PING" tooltip="tooltip_ping">
<Metrics name="PING" protocol="PING" length="190" height="30">
<Parameter name="timeout" input="JTextField"
validation="com.yxkj.mainframe.performance.PositiveIntValidator"
unit="MILLISECONDS">
30000</Parameter>
<ConfigThreshold name="PACKET_RTT" unit="MILLISECONDS"/>
<ConfigThreshold name="PACKET_SUCCESS_RATE"/>
</Metrics>
</Service>
</ServiceFamily>
</ServiceCommunity>
SysUpTime User Manual
71
Copyright iDeskCentric Inc.
Example 2: Add a new Telnet monitor for Linux
This new monitor uses “ps aux | wc | awk „{print $1}‟” command to check the
number of processes running on Linux machine.
<Service name="TELNET_PROCESSES_LINUX" isHostDisabled="true" tooltip="tooltip_telnet_linux_process" >
<Metrics name="TELNET" protocol="TELNET" length="190" height="30">
<Parameter name="remote_host" input="JComboBox"
validation="com.yxkj.mainframe.performance.NonNullValidator"/>
<Parameter name="command" input="JTextField"
tooltip="tooltip_command"
validation="com.yxkj.mainframe.performance.NonNullValidator">
ps aux | wc | awk '{print $1}'
</Parameter>
<ConfigThreshold name="TELNET_CONTENT_MATCH" isFixedOnly="true" isMulti="true"
condition="exclude"/>
</Metrics>
</Service>
After you change the client-monitor.xml, you can press “Refresh” button in the
“Add Monitors” dialog to reload it.
SysUpTime User Manual
72
Copyright iDeskCentric Inc.
Manage Monitors
Buttons are listed below:
Chart
New
Clone
Remove
Edit
Test run
Import
Export
Plot performance graph for selected monitor.
Create a new monitor.
Select an existing monitor and clone it. This
feature makes it easy to monitor similarly
configured devices.
Select one or more rows and remove them. You
need to hold down CTRL key and select
multiple rows.
Select a row and edit it.
Select a row and do test run.
Import monitors from an XML file.
Export selected one or more monitors to an
XML file.
You can click on the checkmark of the “Is Suspended” column to suspend a
monitor. You will be prompted to enter monitor resumption time. If you do not
want to resume this monitor at a later time, you can just disable resumption.
Bulk Add Monitors
The export/import buttons on the “Manage Monitors” dialog can be used to bulk
add monitors. This is a typical way:
1. Create a sample monitor.
2. Export it to an XML file.
3. Use your favorite text editor to open the XML file. Each “Monitor”
section represents a monitor. Copy the “Monitor” section and change the
monitor name and other parameters to create a new monitor. The monitor
name must be unique.
SysUpTime User Manual
73
Copyright iDeskCentric Inc.
4. Import the XML file.
Performance Graph/Chart
Performance graph can help you view the current and historical values of a
monitor in a graph.
If the monitor has multiple metrics, you will be prompted with the following
dialog window:
You can choose one of them, or hold down CTRL key and select multiple metrics.
All the selected metrics will be plotted in the same graph.
To zoom into an area, move the mouse pointer to the area you wish to select, click
on the left mouse button, and hold it down to select the rectangle. To go back to
SysUpTime User Manual
74
Copyright iDeskCentric Inc.
the original state, right mouse click on the graph and select “Auto Range/Both
Axes” menu.
To maximize the graph, you can double click its tab, and double click again to
restore to its original size.
Graph Legends:
Normal
Alarm
Between Alarm
and Rearm
Rearm
Unavailable
Error
Threshold
Normal data.
Alarm occurs.
Alarm has not been cleared.
Rearm event occurs. Status goes back to
normal.
Data temporarily unavailable. But no error
occurs.
Error such as timeout occurs.
Threshold bar
Besides showing current values in graph, you can press the “Import”
button on the graph‟s toolbar to import and plot historical data.
SysUpTime User Manual
75
Copyright iDeskCentric Inc.
Content Match
For monitors such as HTTP, SNMP, Telnet and Port, you can check the contents
of the results. You can check if a phrase is contained in the whole result, or in a
particular line and column, or compare the numerical value of a phrase with a
threshold value.
Regular expression is supported. For instance, you can use “site[1-9]” to match
“site1”, “site2”, ..., “site9”.
There are three types of content match:
1. Simple Content Match
Whole content
Check whole content.
Line
Line number. The default value „-1‟ means checking the whole
content. All the leading blank lines are ignored.
Token
Token number. The default value „-1‟ means checking the whole
line.
Token Delimiter
Token delimiter, required if token number is not „-1‟. The default
value „$whitespace‟ means white space.
SysUpTime User Manual
76
Copyright iDeskCentric Inc.
Example:
For the following result:
Pinging nt-e.gxn.net [195.147.246.32] with 32 bytes of data:
Reply from 195.147.246.32: bytes=32 time=357ms TTL=107
If we want to check the value of time, we can use the following values:
The token value is “time=357ms” . If the threshold is to compare it with a
numerical value, this token will be automatically converted to 357.
2. Multiple Conditions
Multiple conditions can be specified. For instance, if you want to check if
line 1 of the result contains „foo1‟ and line 2 contains “foo2”, then you can
set the conditions like this:
Or if you want to check if line 1 of the result contains „foo1‟ or line 2
contains “foo2”, then you can set the conditions like this:
SysUpTime User Manual
77
Copyright iDeskCentric Inc.
Because thresholds are already specified in conditions, there is no need to
configure the threshold value in the final screen of the monitor
configuration.
3. Expression
Sometimes, we need to use a math expression to calculate the final value
of some data. For instance, one way to calculate user CPU usage on Linux
is to issue this command “top -n 1 | head -3”. The following is a sample
output:
top - 15:20:13 up
Tasks: 208 total,
Cpu(s): 7.8% us,
7:17, 21 users, load average: 0.51, 0.41, 0.47
1 running, 207 sleeping,
0 stopped,
0 zombie
1.8% sy, 0.1% ni, 89.4% id, 0.7% wa, 0.0% hi, 0.3% si
The CPU usage is 7.8 + 1.8 + 0.1 = 9.7, which is based on the values of
the second, fourth and sixth tokens on the third line. This screen shows an
expression that calculates the result of “user + sys + nice”:
SysUpTime User Manual
78
Copyright iDeskCentric Inc.
“user” value is taken from the second token of line 3, “sys” value from the
forth token of line 3, and “nice” value from sixth token of line 3.
SysUpTime User Manual
79
Copyright iDeskCentric Inc.
Manage SNMP Math Expressions
This window is divided into two pane: favorite expressions and others. You can
select an expression and click up or down arrow button to move it between two
panes.
There are some math expressions being used in SNMP monitors. You can create
new expressions or edit existing ones. If an expression contains tabular objects,
you need to provide index suffix for it, and then a new expression with the index
suffix appended to its name will be added automatically. For example, if you use
ifutil expression, and then you choose index to be “.2”, then a new expression
named “ifutil.2” will be created automatically.
SysUpTime User Manual
80
Copyright iDeskCentric Inc.
Scheduled Down Time
To specify a time period during which all performance monitors will be
suspended. If you know the maintenance window, you can use this feature to
easily pause all monitors.
SysUpTime User Manual
81
Copyright iDeskCentric Inc.
Chapter 7. Report
Quick Report
It allows user to take a quick look at the report of one or more monitors, or a topN report that lists monitors sorted by alarm percentage or average values.
Top-N Report
The top-N report is a powerful tool that you can use to identify problem elements.
A top-N report is a tabular report that lists top N or all monitors sorted by average
values or alarm percentage.
If it is categorized by metric, you can select one of the metric types. If all the
monitors listed, you can hold down CTRL key and select multiple monitors.
SysUpTime User Manual
82
Copyright iDeskCentric Inc.
Monitor Data
This type of report shows the historical data of one or more monitors. You can
hold down CTRL key and select multiple metrics.
Options:
Report Type
Filter
From/To
Graphs
Data Tables
Warning
Tables
SysUpTime User Manual
Choose top-N report ( percentage of alarms or average
result values) or monitor data report.
All monitors or top-N monitors.
Select the time period of the report
Print graph and chart.
Print a table of all collected data.
Print a table of alarm data.
83
Copyright iDeskCentric Inc.
Buttons:
Send Now Send the report to an email account. SMTP server needs
to be configured beforehand.
View the report in a new window.
View
Scheduled Report
You can configure scheduled reports that will be generated periodically. If you do
not need them, you can pause them or just delete them.
For each scheduled report, you need to specify a title. Report can be generated
daily, weekly, monthly or daily (month to date). For weekly or monthly reports,
reports will be generated at 00:00.
The generated report will be in PDF format and sent to specified email accounts.
SMTP server needs to be configured beforehand.
SysUpTime User Manual
84
Copyright iDeskCentric Inc.
Chapter 8. Configuration
Check Map Node Status
If enabled, there will be a background thread periodically ping nodes in maps. If a
map node fails to respond to ping request, its color will be changed to red.
Check Port Utilization
If enabled, there will be a background thread periodically check the bandwidth
utilization of devices (including nodes and links) in the topology map. Devices
must support SNMP, otherwise no values can be obtained. The bandwidth
utilization values will show in the tooltip of a device or link. The color of them
will change if utilization value exceeds the configured thresholds.
By default, only routers and switches will be checked. You can add more device
types.
The bandwidth is calculated based on the bandwidth of the network interface. The
formula is
Bandwidth Utilization = 100 * Current Bandwidth / Total Bandwidth
SysUpTime User Manual
85
Copyright iDeskCentric Inc.
The total bandwidth values come from SNMP agents. Sometimes the values are
not correct. For instance, suppose your WAN router‟s WAN interface supports
100Mbps, the actual bandwidth may be only 10Mbps. In this case, you can switch
to edit mode and change the bandwidth value of the interface of the node or link.
Then bandwidth utilization value will be calculated based on the new value.
The period cannot be too small (such as a few seconds). Too small value will
result in inaccurate utilization values.
The tooltips of links and nodes that support SNMP will show the current
bandwidth and utilization values. The values also show up in the properties
window, and they are periodically updated when new values come from the
server.
SysUpTime User Manual
86
Copyright iDeskCentric Inc.
Performance Configuration
Keep connection
open
User Agent
HTTP Proxy
Minimum set of
data
Maximum set of
data
SysUpTime User Manual
If checked, network connection will not be closed after
each run of SSH, FTP and Telnet monitors. Next run will
re-use the previous connection.
The User-Agent field of HTTP(s) requests used in URL
sequence monitors.
The proxy settings for all URL monitors.
Minimum set of data required for calculating statistical
values.
Maximum set of data for calculating statistical values. If
maximum is reached, the oldest set of data will be
discarded.
87
Copyright iDeskCentric Inc.
SMTP Server Configuration
Two SMTP servers can be configured. If the primary server fails, the secondary
server will be used for sending emails. If only primary server is configured, then
emails cannot be sent if it fails.
User name and password are required only if SMTP server requires authentication.
If SMTP server requires SSL, the “Use secure SSL connection” must be checked.
After you configure SMTP server, you can press “Send Test Mail” to send a test
email.
SysUpTime User Manual
88
Copyright iDeskCentric Inc.
Alarm Configuration
General
Trap Receiver Port
Configure the port number of trap receiver. The default value is 162.
Some other applications may already take port 162, so make sure that
port 162 is unoccupied otherwise trap receiver cannot be started. If
SysUpTime server runs on Linux/Unix platform, make sure
SysUpTime server is run in an account with root privilege.
Unknown Traps
Unknown traps mean that they are not defined in
“Tools/Configuration/Alarm /Event” panel. You can configure
whether to store the unknown traps to database and send them to
SysUpTime clients.
Message format is the format of message displayed in the upper panel
of alarm browser window. The allowed tokens are listed below:
$ip
$probe
$en
$oid
$tm
$ts
$sp
$ge
$#
$vb.n
$vb.*
IP address of trap sender.
Probe name. MSP edition only.
Enterprise value.
Value of snmpTrapOid.
Time.
SNMP agent‟s sysUpTime value.
Specific value of SNMPv1 trap.
Generic value of SNMPv1 trap.
Number of variable bindings.
Value of nth variable binding. For instance, $vb.1
means the first variable binding in the SNMP variable
binding list; $vb.2 the second variable binding.
Values of all variable bindings.
Table: Allowed tokens
Tokens can be combined. For example, “$oid, $vb.*” means showing
snmpTrapOid and all variable bindings.
Trap Forwarding
Forward trap to remote trap receiver
SysUpTime User Manual
89
Copyright iDeskCentric Inc.
If checked, traps will be forwarded to remote trap receiver.
SNMPv2/v3 traps will be converted to SNMPv1 traps to
preserve the IP address of original trap sender.
Forward trap via email
Each trap will be converted to email and then forwarded to one
or more email accounts. Each email account is associated with
a time range. So traps can be forwarded to different email
accounts based on time.
Node’s Color Change on Traps
If the IP address of a received trap can be found in the network
topology, then the corresponding node will turn red.
Event
It is for configuring SNMP traps and internal events. Traps that are not
configured are regarded as unknown traps.
Each event is identified by a unique Object ID. For SNMP traps, event ID
is the same as snmpTrapOid. For instance, SNMP cold start is identified
by oid .1.3.6.1.6.3.1.1.5.1.
Add Enterprise
It‟s used to categorize events. Each event belongs to an enterprise
category. Enterprise has a unique enterprise ID, and a meaningful
enterprise name. The IDs of its child events must start with the
enterprise ID.
Modify
If the selected item is enterprise, clicking “Modify” button will
bring up a dialog for modifying enterprise. If the selected item is
an event, clicking “Modify” button will bring up a dialog for
modifying event.
Delete
Delete the selected item.
SysUpTime User Manual
90
Copyright iDeskCentric Inc.
New/Modify Event Dialog:
SysUpTime User Manual
91
Copyright iDeskCentric Inc.
Event Name
Event
Identifier
Mode
Name of this event.
Event ID, starting with enterprise ID(non-editable).
Sources
IP addresses of the trap originator. Selecting “All
Sources” means that we do not check source IP address
when identifying this event.
Severity
Fixed
One of {normal, warning, minor, major, critical}
Store And Display In Category: Store it into
database and forward it to client for displaying.
You can choose a category from the list.
Store Only: Only store it into database
Ignore: This event will be discarded.
Based on Variable Binding
Severity is determined by the values of variable
binding. Higher severity level takes precedence. That
is, if you specify multiple conditions, if the condition
of a higher severity level is met, the severity will be
its value.
Forward to
Trap Receiver
Actions
(Server Side)
Specify a remote trap receiver.
Actions will be triggered on the server side when an
event (alarm or rearm) occurs. The following actions are
supported:
Send Email
Send emails based on different time frame
HTTP Action
Post to a web site using either GET or POST methods.
Form data can be specified for POST method.
Allowed tokens such as $ip, $vb.1 can be used in
URL. They will be converted to corresponding
values.
Run Command
Execute a server side command. Allowed tokens such
as $ip, $vb.1 can be used in command. They will be
converted to corresponding values.
SysUpTime User Manual
92
Copyright iDeskCentric Inc.
Run Remote Command
Use SSH/Telnet/RPC to login and then execute a
command on remote computer, including Windows
and Linux/UNIX machines. Allowed tokens such as
$ip, $vb.1 can be used in command. They will be
converted to corresponding values.
Computer Action
Reboot/Power off a remote computer, including
Windows and Linux/UNIX machines.
Service Action
Start/Stop/Restart a service on a remote computer,
including Windows and Linux/UNIX machines.
Kill Process Action
Kill a running process on a remote computer,
including Windows and Linux/UNIX machines.
Alarm Sound
(Client Side)
Play a sound on the client side upon receiving this event.
The SysUpTime client must be running and connected to
the server.
Message
Format
Specify message format. See the “Allowed tokens” table
for available tokens.
Run Command Execute a command on the client side when receiving
this event. The SysUpTime client must be running and
(Client Side)
connected to the server.
Description
SysUpTime User Manual
Brief description of this event
93
Copyright iDeskCentric Inc.
Alarm Deduplication
SysUpTime can filter out duplicate alarms. Alarm deduplication function
is not enabled by default. If a alarm is considered duplicate in the specified
time window, then it will be discarded.
Here is an example. In the above figure, the time window is 60 seconds.
For the SNMP cold start trap, if trap sender‟s IP addresses are the same,
then it is considered to be duplicate alarms. For instance, if an SNMP cold
start trap is received at 10:00:00 AM sent from 172.16.1.90, then any new
cold start traps from 172.16.1.90 received before 10:01:00 will be
discarded. However, if a new cold start trap from 172.16.1.90 received at
10:01:01, it is not regarded as a duplicate trap.
SysUpTime User Manual
94
Copyright iDeskCentric Inc.
Trap Clearing
A trap can be configured to be automatically cleared by other traps.
Here is an example. In the above figure, it defines a linkDown trap can be
cleared by a linkUp trap when the following conditions are satisfied:
1.
linkUp trap must be received within 60 minutes after linkDown
trap is received
2.
The first variable binding of linkUp trap (ifIndex) must be equal
to the first variable binding of linkDown trap.
3.
linkUp trap must be from the same trap source IP address as the
linkDown trap
Predefined PM_REARM section is for automatically clearing internally
generated threshold traps. If you do not need this function, you can delete
the whole section.
SysUpTime User Manual
95
Copyright iDeskCentric Inc.
Alarm Escalation
There may be times when technical personnel are unable to respond to an
alarm or simply do not see the alarm. Alarm escalation makes sure that an
unanswered alarm can be rerouted to other designated locations. This
reduces the risk of a major problem being ignored.
Escalation chain is supported. If an alarm is not cleared within a particular
period, one person is contacted, and another person will be contacted if the
alarm is still not cleared later, etc.
In the above example, it defines the following alarm escalation rule:
If an alarm whose severity is critical, and it is not cleared for one hour,
then an escalation email will be sent to [email protected]. It the
alarm is not cleared for two hours, an escalation email will be sent to
[email protected]. You can send escalation email to different
email accounts based on time.
SNMPv3 Params
You need to add SNMPv3 trap senders‟ properties if you have incoming
SNMPv3 traps. There is no need to configure it if there are only
SNMPv1/v2c traps.
SysUpTime User Manual
96
Copyright iDeskCentric Inc.
Email Template
By default, alarm notification messages will be sent out as a text and
HTML format, which usually are long messages. However, some services
such as SMS restrict the length of messages. You can enable email
template feature to use custom email message.
The body part of the emails can be configured through the following
screen. The subject part of the emails can be configured through
“Tools/Configure/Alarm/Event”, selecting an event and pressing
“Modify” button, and modifying the “Message format” field.
Figure: Configure Email Template
Allowed tokens:
$ip
$name
$val
$severity
$type
$rtype
$en
$oid
$tm
$ts
$sp
SysUpTime User Manual
IP address of trap sender.
Name of performance monitor.
The current value of performance monitor.
Severity of this event.
The type of performance monitor events. Possible values
are arm, rearm or error.
The result type of performance monitor.
Enterprise value.
Value of snmpTrapOid.
Time.
SNMP agent‟s sysUpTime value.
Specific value of SNMPv1 trap.
97
Copyright iDeskCentric Inc.
$ge
$#
$vb.n
$vb.*
Generic value of SNMPv1 trap.
Number of variable bindings.
nth variable binding. For instance, $vb.1 means the first
variable binding in the SNMP variable binding list; $vb.2
the second variable binding.
All variable bindings.
Table: Allowed tokens
Database Data
It configures how long SNMP trap data and performance data should be kept in
database.
SysUpTime User Manual
98
Copyright iDeskCentric Inc.
Chapter 9. Tools
Import HP OpenView Events (trapd.conf)
This tool is located at $INSTALL_DIR\server\bin\import_events.bat. It is a
command line tool for importing your existing HP OpenView‟s event
configuration data into SysUpTime network monitor, so that you do not have to
enter them manually.
If you execute it without arguments, the following usage will show up:
Usage: import_events.bat eventFileName
The eventFileName is the fully qualified file name of OpenView‟s event
configuration file (trapd.conf).
After data is imported into SysUpTime network monitor, you may need to restart
the SysUpTime server service.
SysUpTime User Manual
99
Copyright iDeskCentric Inc.
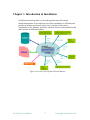
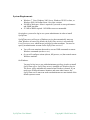
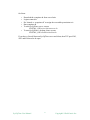
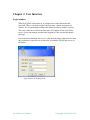
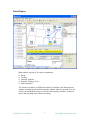
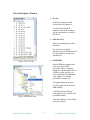
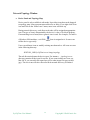
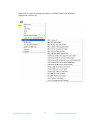
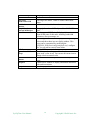
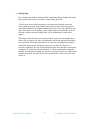
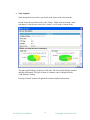
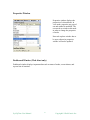
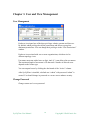
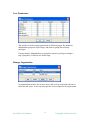
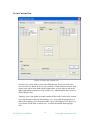
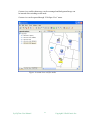
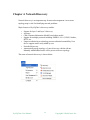
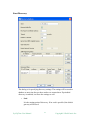
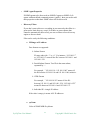
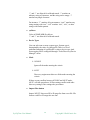
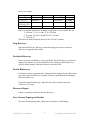
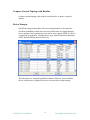
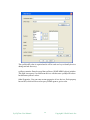
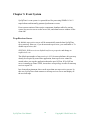
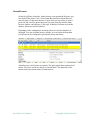
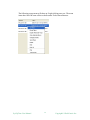
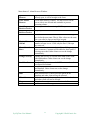
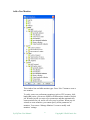
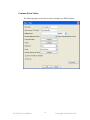
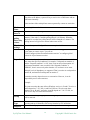

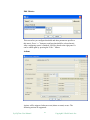
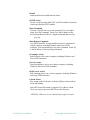
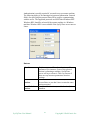
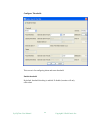

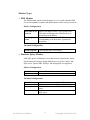
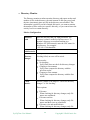
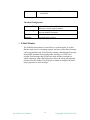
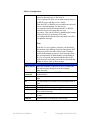
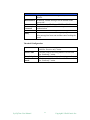
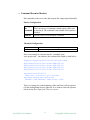
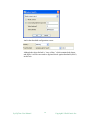
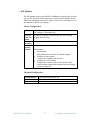
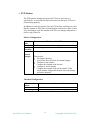
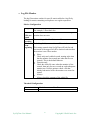
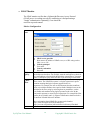

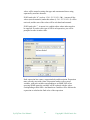
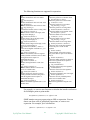
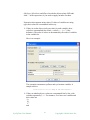
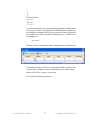
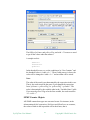
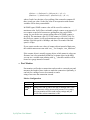
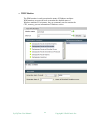
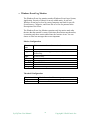
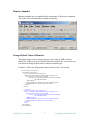
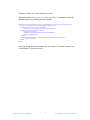
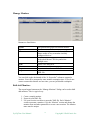
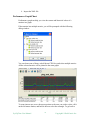
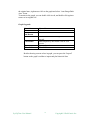

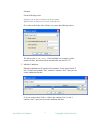
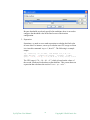
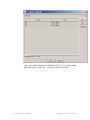
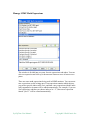
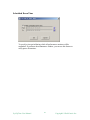
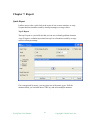
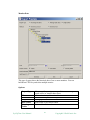
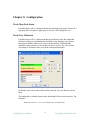
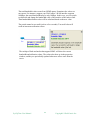
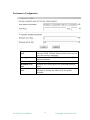
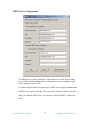
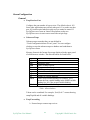
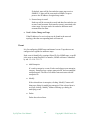
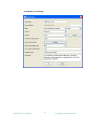
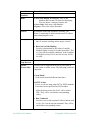
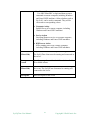
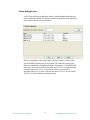
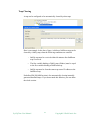
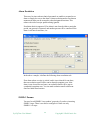
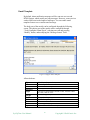


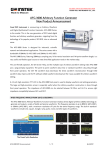


![How To Make A Noise [free version - July 2007]](http://vs1.manualzilla.com/store/data/005953668_1-8b501b70130f0a85eac6cc9cd6ff18b6-150x150.png)