1
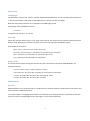
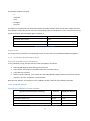
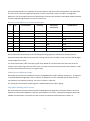
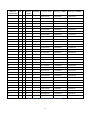
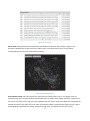
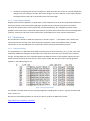
Figure 2-5: Tweet View
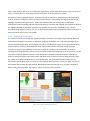
Tweet View: Directly below the PhaseView lies the Tweet View (bottom left), shown in Figure 2-5. It
provides a detailed look at tweet content in tabular form. The tweets shown here are the subset
corresponding to the currently selected time interval.
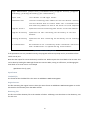
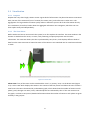
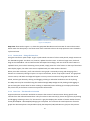
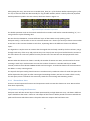
Figure 2-6: Social Network View
Social Network View: This view represents users and their tweets (Figure 2-6). In this graph, users are
represented by dots, or nodes, and are connected by lines, or edges. These edges represent a reference of
one user to the other via the use of the ‘@’ tag within the text of their tweet. The edges are undirected, but
colored the same as the node of the user who mentioned the other. Examining this graph can give a good
understanding of how different tweets propagate across users, and which users are most active.
15