1
Table of Contents
1.
Project Overview.......................................................................................................................................... 1
2.
User’s Manual .............................................................................................................................................. 5
3.
2.1
Four-Phase Classification ................................................................................................................. 5
2.2
Visualization................................................................................................................................... 14
Developer’s Manual ................................................................................................................................... 18
3.1
Four-Phase Classification ............................................................................................................... 18
3.2
Visualization................................................................................................................................... 19
3.3
Inventory of Repository Files ......................................................................................................... 24
References ......................................................................................................................................................... 25
Table of Figures
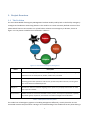
Figure 1-1: Four Phases of Emergency Management.......................................................................................... 1
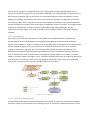
Figure 1-2: Project flowchart ............................................................................................................................... 2
Figure 1-3: Project visualization overview........................................................................................................... 3
Figure 2-1: Dataflow of our four phase classification pipeline............................................................................ 5
Figure 2-2: MakeTrainingData Usage Manual ..................................................................................................... 8
Figure 2-3: MakeTestData usage manual .......................................................................................................... 10
Figure 2-4: Phase View ...................................................................................................................................... 14
Figure 2-5: Tweet View ...................................................................................................................................... 15
Figure 2-6: Social Network View........................................................................................................................ 15
Figure 2-7: Map View ........................................................................................................................................ 16
Figure 2-8:
Selecte time intervals superimposed on a single ThemeRiver .................................................... 17
Figure 2-9: Social network and map views corresponding to the previous figure............................................ 17
Figure 3-1: Original tweets data ........................................................................................................................ 19
Figure 3-2: Example of mistakes in input data .................................................................................................. 20
Figure 3-3: Mouse events .................................................................................................................................. 21
Figure 3-4: Creating a jqGrid component .......................................................................................................... 22
iii