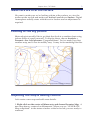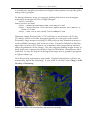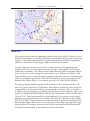
1
Digital
Atmosphere
METEOROLOGICAL ANALYSIS SOFTWARE
USER MANUAL
Digital Atmosphere
USER MANUAL
Edition 001
May 27, 2007
Software and documentation
Copyright © 1995, 2007 Weather Graphics Technologies
All rights reserved
Information in this manual is subject to change without notice and does not
represent a commitment on the part of Weather Graphics Technologies. The
software described in this manual is furnished under a license agreement. The
software may be used only in accordance of the terms of this license agreement.
It is against the law to copy this software on any medium except as specifically
allowed in the license agreement. No part of this manual may be copied, photocopied, reproduced, translated, distributed or converted to any electronic or
machine-readable form in whole or in part without prior written approval of
Weather Graphics.
Weather Graphics Technologies
P. O. Box 450211, Garland TX 75045
(800) 840-6280
Our E-mail addresses are located at
http://www.weathergraphics.com/contact.htm
World Wide Web — www.weathergraphics.com
Contents
Tutorial / 1
Setting up our area of interest / 1
Loading some weather data / 2
Make sure we’re at the surface / 3
Looking at the big picture / 3
Adjusting the map & adding content / 3
Measuring distances / 4
Looking at station plots / 4
Cutting down on crowding / 5
Overlaying more contours / 5
Seeing the wind flow / 6
Conclusion / 6
Display components / 7
Main menu / 7
Speed buttons / 7
Toolbox / 9
Status box / 12
Workchart / 13
Popup menus / 13
Distance and track cursor / 13
File menu / 15
New Workchart / 15
Import Directory / Specific File / 15
Import GRIB / 15
Clear data directory / 17
Set font mode / 17
Get archived data / 19
Quality control / 19
View raw data / 21
Print / 22
Print setup / 22
Calculator / 22
Recompile tables / 23
Preferences / 23
Exit / 23
Map menu / 25
Erase map / 25
Load basemap / 25
Save basemap / 25
Generate basemap / 26
Blank map / 28
Import map from file / url / 28
Import shapefile / 29
Copy markings onto basemap / 31
Copy chart to clipboard / 32
Export chart / 32
Cursor city distance / 33
Information / 33
Set comment / 34
Make topography / 34
Import planetary map / 34
Add overlay / 35
Annotations / 38
Data menu / 41
Retrieve data / 41
Data plots / 44
Custom data plots / 45
Table plots / 46
Television plots / 47
Warnings / 48
Frontal depiction / 48
Fleetcode / 50
Sferics / 51
Convective outlooks / 52
Hurricane tracks / 53
Troubleshoot data / 54
Soundings / 54
Extract model data / 54
Analysis menu / 57
Edit analysis scripts / 57
How analysis works / 57
Radar menu / 61
View radar data / 62
Load radar data / 63
Save radar data / 63
Import radar data / 63
Set NEXRAD station / 64
Quick pick / 64
Set date-time / 65
Base reflectivity / 65
Reflectivity / 66
Velocity / 66
Spectrum width / 68
Derived products / 68
Climatology menu / 71
Extract data / 71
Graph / 71
Hurricane tracks / 72
Tornado tracks / 72
GPS menu / 75
Status / 75
Start / 75
Stop / 75
Recenter map automatically / 76
Settings / 76
Other important information / 76
Window menu / 77
Add/remove toolbars / 77
Remove last product / 77
Help menu / 79
Register / 79
Preferences / 81
General tab / 81
Meteorological tab / 82
Maps tab / 84
Station plots tab / 86
Analysis tab / 87
Styles tab / 89
Miscellaneous 1 tab / 91
Miscellaneous 2 tab / 92
Annotations tab / 92
GRIB data / 115
Grid definition file / 115
Fixing GRIB problems / 115
Sources / 117
New NWS GRIB filename convention / 117
Old NWS GRIB filename convention / 118
Documentation / 119
Scheduler scripting / 121
Scripting basics / 121
Valid script commands / 122
Valid product types / 127
Sample scripts / 128
Analysis scripting / 129
Scripting locations / 129
Command sentences / 129
Examples / 130
Summary of commands / 131
Analysis theory / 137
General description / 137
Processing functions / 138
Objective analysis functions / 139
Numerical operators / 142
References / 144
Tabular weather data / 145
Start sequence / 145
Parameter list / 145
Sample listing / 146
Valid parameters / 146
More on Australian AXF data / 147
Exported analysis grids / 149
Language support / 151
About weather data / 153
Surface plot configuration / 101
Raw data samples / 155
Airways (SAO) data / 155
SD RAREP radar reports / 155
FD winds aloft data / 155
Rawinsonde data / 156
Weather watches / 156
Convective outlook / 157
Model output data / 157
Color gradient fills / 105
Version change summaries / 159
APPENDIX / 93
Printing / 95
Importing radar graphics / 97
Points / 107
Map attribute file structure / 109
Field and product codes / 111
DIGITAL ATMOSPHERE INTRODUCTION
T
hanks for trying out Digital Atmosphere. This software, initially developed
in 1992 and rewritten under Windows in 1996, encompasses thousands of
hours of programming by one person and is the unique result of twenty
years of forecasting experience, working with various meteorological workstations and mainframes, and many years of amateur observation activities and
storm chasing. This manual is designed to help you get up and running with this
advanced but easy-to-use weather analysis program. It will start out by taking
you on a short overview of Digital Atmosphere. Following that, each menu command is explained in detail. Finally there is an extensive appendix with possibly
all the miscellaneous information you could ever want.
What is Digital Atmosphere?
It’s a powerful weather prediction tool. It’s hands-down the leading weather
software program for Windows, and is used by the National Weather Service,
the Air Force and Navy, dozens of television stations and consulting firms,
and hundreds of amateurs and hobbyists. Its powerful and rapidly expanding capabilities will let you monitor developing weather anywhere on Earth
— around the globe, or right in your own local area.
Digital Atmosphere is essentially a geographical display program that
ingests raw weather bulletins disseminated by the National Weather Service
to Internet sites, satellite feeds, and weather databases. Using this data, it
produces stunning plots and analyses that are equivalent to those found on
multi-million dollar workstations.
The maps and other products you create with Digital Atmosphere are fully
customizable. You can define the geographic area you wish to map and
specify the map’s resolution. You decide how much detail you want shown in
your maps, from country borders only to rendered topography with county
lines and roads overlaid. You choose what weather data you want displayed,
how the data is displayed, and in many cases what algorithms are used to
analyze the data. Whatever your meteorological graphics needs, Digital Atmosphere can create exactly the map you desire, using only the parameters
you desire.
Digital Atmosphere specifications
Data formats supported
* Land synoptic (WMO FM 12 SYNOP)
* Ship synoptic (WMO FM 13 SHIP)
* METAR (WMO FM 15 METAR)
* Buoy (WMO FM 18 BUOY)
* Upper air (WMO FM 35 TEMP)
* Aircraft data report (ACARS) (WMO FM 42 AMDAR)
* NMC frontal depiction transmission format (ASUS1 KWBC)
* FLEET code (WMO FM 45 / 46)
* Gridded binary (GRIB) (WMO FM 92-IX)
* NEXRAD Level III (ICD 2620001) WSR-88D NEXRAD format
* Australian AXF comma-delimited observational data and similar formats
* NHC Hurricane Warning bulletins
System requirements
Operating system: Windows 2000, XP, or Vista.
Processor: Pentium or better recommended.
RAM: 128 MB or better recommended.
Disk space: Minimum 50 MB.
Source of data: Internet access recommended, which allows access to
any of numerous free university and government data sites.
Special notes: Windows 3.1, Win32s, and earlier versions of Windows
are not supported. Compatibility with Windows 98 and ME is unknown;
compatibility with Windows 95 is unlikely.
Other information
Lines of source code: 152,217 lines totalling 2.01 MB (as of May 2007).
Langauge written in: ObjectPascal.
Date of original release: January 1, 1996.
Predecessors: WeatherGraphix (MS-DOS, released 1993), WeatherPro
(MS-DOS, released 1992), RadarScan (MS-DOS, released July 4, 1992),
SFCPLOT.PRG (C-128, created 1987).
Did you download a copy over the Internet?
Copies of Digital Atmosphere downloaded over the Internet are 30-day trial
versions. They are fully-functional version for 30 days. There are no separate
“registered” and “demo” versions, and there’s nothing else to download or
install! However, you must register Digital Atmosphere within 30 days of
installing it or quit using it. If you don’t register, at the 30-day point the soft-
ware will disable certain features such as quality control, scripting, climatology, and loading/saving of maps.
When you register, you will receive a key number that you enter into Digital
Atmosphere. This prevents it from expiring, or if the program has already
expired, it restores full functionality indefinitely.
We hope that our low price and our commitment to continued development
work is an incentive to register. We’ve served weather enthusiasts for 14
years with affordable prices and highly-accessible support rather than inflated markups and shoddy service, which is common in the software industry.
If you send us an E-mail, you’ll always get an E-mail reply from us, usually
within 24 to 48 hours (sometimes longer, but a reply will come). There’s also
a support forum at <http://www.weathergraphics.com/forum> .
Your registration is greatly appreciated!
Rights
There are no restrictions, no licenses, and no royalties, on the use of maps
produced by Digital Atmosphere. They are considered to be your creations.
Pricing and ordering
Please visit <www.weathergraphics.com> for up to date information,
plus pricing and ordering methods.
Please be aware that you cannot reach us at our pre-2004 addresses: (sales@
weathergraphics.com, [email protected], tim@weathergraphics.
com, etc). We had to deactivate these addresses due to excessive incoming
spam. Please make use of our new address (visit our Contact page at the
website above). Always check that page if you think you’re having trouble
contacting us, as email addresses may have changed. We answer all E-mail,
though on rare occasion it may take several days.
Standard and Professional versions
For quite some time we have needed to raise prices significantly to cover the
costs of development. Digital Atmosphere was fixed at $68 from 1996 to 2004,
and its features now greatly eclipse what was available then. However we
also recognize the need to provide an economical version of Digital Atmosphere. Therefore we provide a Standard and a Professional version.
Here are the differences between the two versions.
Standard version
Maps: Limited to vector-mapped workcharts (same as in previous versions
of Digital Atmosphere). New York City aeronautical coverage only.
Menu scripts: Limited to a maximum of 30 dynamic scripts in your menu.
Registration: We send you a key for the program to work beyond 30 days.
Professional version
Maps: Includes CD packed with 4 scales of aeronautical-grade raster basemap charts (5 for south central US) - excellent for radar tracking!
Menu scripts: Unlimited scripts in your menu.
Registration: No key is required. Ideal for industrial and government use.
Can be moved from machine to machine. Licensing is on the honor system.
Vector basemaps. This graphic
uses the native built-in mapping
capabilities of Digital Atmosphere,
showing boundaries, county lines,
and highways.
Raster basemaps. The same
storms viewed with the 1:500K
TPC topographic raster map
set that comes with Digital
Atmosphere Professional. The
Professional version uses the
basic vector maps by default, but
these topographic maps can be
displayed upon request.
CHAPTER 1
Tutorial
Let’s begin with a quick tutorial to help you get up and running. You will
need a connection to the Internet. If you have no Internet connection you
may go to File > Import a File and select the folder “tutorial” to import and
view some data.
If you are not viewing this chapter on paper, we suggest printing out this
help page and following along (if you’re in Windows Help, just go to File >
Print Topic... to print this page).
Setting up our area of interest
For the purposes of this tutorial let’s start with a map of the eastern
United States.
1. Go to Map > Generate.
2. For Projection, choose Orthographic. You should use Orthographic
for nearly all of your charts.
3. Set Latitude to 40. The map will
be centered on latitude 40 in the
northern hemisphere, which is
positive.
4. Set Longitude to -85 (negative
eighty). The map will be centered on longitude 80 in the
western hemisphere, which is
negative.
5. Set Scale to 2000 miles. The map
width, hence, will be 2000 miles.
6. Set Image Width to 800 pixels.
7. Set Image Height to 600 pixels.
8. Leave Color Style on “Regular
analysis style”. Likewise, make
no changes to Advanced Properties.
9. Click OK and wait about 10 to 60
seconds while the map draws.
You’ll know it’s done when you
Map configuration panel for this tutorial.
Chapter One / TUTORIAL
see “GENERATE: Map completed” in the Status Window at the
lower left of the screen.
Loading some weather data
Now that we have a map area defined, we need some weather data to
look at. Do the following:
1. Go to Data > Retrieve data. You will see an Internet retrieval panel
pop up.
2. Make sure only the following item is checked:
METAR from COD (US only)
3. At the top right of the panel, it should show “1 resource selected”. If it
shows more than that, see if there are boxes you forgot to uncheck.
4. If you don’t know the current UTC time, skip this step. If you do,
check the @Y, @M, @D, @H, @N to see if it shows the correct year,
month, day, hour, and minute value, respectively. If the difference
is more than 10 minutes, check your Windows time and time zone
settings.
5. Click Retrieve. Weather data will be retrieved from the College of DuPage server and will then be decoded and imported. This will take
about 20 seconds on most computers.
If any errors occur when retrieving the data, such as “file not found” or
other server errors, chose a different METAR source in Step 2.
Chapter One / TUTORIAL
Make sure we’re at the surface
We want to make sure we’re looking at data at the surface, so view the
toolbar at the top left and make sure Active Level shows Surface. Digital
Atmosphere usually starts with this set to Surface and no adjustment is
required.
Looking at the big picture
Meteorologists usually like to get their first look at a weather chart using
isobars (lines of equal pressure). To display these, choose Analysis >
Pressure > Sea level pressure. Congratulations! You’ve made your first
weather map, and it was incredibly easy. It may look something like this:
Adjusting the map & adding content
Let’s create a new map and add some details.
1. Right-click on the center of Minnesota, and choose Recenter Map. A
new map draws, centered on Minnesota! When you see “GENERATE:
Map completed” in the status window at the lower left, you are ready to
continue.
Chapter One / TUTORIAL
2. Click Map > Add Overlay > Highways. You will see Interstate highways appear on the map.
3. Now click Map > Erase Map. You will notice that the county outlines
have disappeared. This is a very important concept. The basemap is
persistent, but map annotations, weather charts, and so forth are not.
Fortunately if you want to preserve the counties as a permanent annotation until the next time a map is generated, here is how to do it.
4. Click Map > Add Overlay > Highways. You will see Interstate highways appear on the map again.
5. Click Map > Copy markings onto basemap. Now all annotations
drawn on the map are permanent until the next time a map is generated.
6. Click Map > Erase and you will note that the highways remain on the
map.
Measuring distances
Did you know you can measure distances with Digital Atmosphere?
Simply put the cursor over a certain spot on the map, and hold down the
left mouse button as you move the mouse around. Notice that you see
a box and a line that moves with you. The line helps show you the path
between your two points. The box defines an area, which you will use
later to quality-check a group of observations.
At the bottom of the window, however, note that the status bar is displaying the latitude and longitude of each point, and the bearing and
distance between the two! The line drawn on the map is actually a great
circle line, and on global map views you will notice that it forms an arc
rather than a line. This arc is actually the shortest distance between the
two points, and it just appears as an arc because of the map projection
distortion.
Looking at station plots
Station plots are little “packets” of data that appear on the map at various locations, showing the actual observed conditions at that location.
Plotting them in Digital Atmosphere is a snap. Just click on Data > Data
plots. Instantly the map is filled with a smorgasbord of information.
Chapter One / TUTORIAL
The station plot above indicates a temperature of 82 degrees, and a dewpoint of 53 degrees (dewpoint is proportional to moisture). Winds are
blowing from the southeast at 5 kt, as the wind barb always points into
the wind. The sky is 50% covered with cloud. The sea-level pressure
is 1014.3 mb. The numbers that make up the sea-level pressure figure
are in tens, units, and tenths; this value is then prefixed with either 900
or 1000, whichever brings the value closest to 1000 mb. So 450 = 45.0 =
1045.0 mb, while 550 = 55.0 = 955.0 mb.
In the center circle, the amount of shading is proportional to the amount
of clouds. You’ll also note that some stations have a square; this means
the observation was made by a computerized station. Some stations
might have a red color; this means bad (IFR) weather, while some are
blue which means marginal (MVFR) weather. The coloring is determined
strictly by visibility and cloud height and is more for the use of pilots
and experienced meteorologists, though they can clue you in on where
significant weather is happening.
Cutting down on crowding
We can easily change the density of station plots this to improve legibility or increase the information shown. On the tool panel take the Data
Plot Crowding slider and move it to 50. Now go to Map > Erase map, and
choose Data > Data Plots again. You’ll notice a lot of stations have disappeared! The chart is much more legible, but there is less information.
You can use the data plot crowding slider to control how many observations are shown. Most meteorologists try to max out the setting without
making the plots so crowded the data is unreadable. Let’s move the slider
back where it was: move the Data Plot Crowding slider to 80.
Overlaying more contours
Choose Analysis > Temperature > Temperature (deg F). Now choose
Analysis > Pressure/Height > Sea level pressure. Nice! You just added
Chapter One / TUTORIAL
the same field seen earlier on top of the map. This illustrates how you
can view different meteorological fields at the same time.
Seeing the wind flow
It is possible to visualize the wind field. Go ahead and click on Map >
Erase map. Now choose Analysis > Wind > Wind speed (barbs). You’ll
see a pretty cool gridded array of wind patterns! It’s the ideal thing to
depict how the air is moving.
Also try Map > Erase map and then Analysis > Wind > Streamlines.
Conclusion
That completes the quick tour of Digital Atmosphere. This tour was only
intended to give you a feel for how Digital Atmosphere works. You’ve
covered all of the basic functions, and now you can build on your knowledge by playing around with the software and reading through this help
guide. There’s almost no way you can “break” Digital Atmosphere just
by experimenting. Have fun!
CHAPTER 2
Display components
Before we continue, let’s look at five major components of the Digital Atmosphere screen in the illustration below. It’s important to be familiar with each
of these parts, since we will refer to them occasionally through the manual.
This chapter discusses each component in detail.
Main menu
The main menu is where you issue most commands for Digital Atmosphere. This dropdown menu structure works just like most other
Windows programs. Each main menu command will be described in the
following chapters in this manual, so we won’t discuss them in detail at
this time.
Chapter Two / DISPLAY COMPONENTS
Speed buttons
The speed buttons are provided as a convenient way of accessing frequently-used main menu commands. You can find the meaning of each
one by simply resting the cursor on a button (a popup hint will appear).
Each button corresponds to a main menu command, summarized as follows (going left to right).
Import a file -- Accomplishes the same thing as File > Import file
Import a directory -- File > Import directory
Print -- File > Print
Preferences -- File > Preferences
Internet retrieval -- Internet > Retrieve Data
Load a map -- Map > Load Map...
Erase workchart -- Map > Erase Map
Data plot -- Data > Data Plots
Quality control -- File > Quality Control
Calculator -- File > Calculator
Zoom in -- Zooms in on the map (not for raster basemaps)
Zoom out -- Zoom out from the map (not for raster basemaps)
Generate basemap -- Map > Generate map
Chapter Two / DISPLAY COMPONENTS
SLP. Performs a sea-level pressure analysis.
°F. Performs a temperature analysis in degrees Fahrenheit.
°C. Performs a temperature analysis in degrees Celsius.
Toolbox
The toolbox is designed to hold controls and features which are not suited to
the main menu, and for which the user needs rapid access. There are three
main panels: the control panel, the fronts panel, and the scripting panel. Each
will be described below.
Workchart tab
Active level. This controls the current level. It
should be set to Surface except when viewing
upper air data.
Time selection. This controls how the valid
time for surface data and upper air data are
chosen. Digital Atmosphere will choose the
most popular time rounded to the time quantity selected. So if all data is valid for 1600
UTC except for one observation valid at 1533
UTC, the latter observation will be included
if a “1 hour” rounding is selected, and discarded if “20 minutes” is selected. If you wish
to override time selection, you can choose
“manual” to be prompted for a time each time
you generate a product, or you can choose a
specific numerical time.
Data plot crowding. Controls how many station plots appear on the
map when you select Data > Data plots. Slide to the left for fewer
station plots, or slide to the right for more (or click All, which sets the
slider to 100%).
Clock. Shows the local date/time (LOC) and the Greenwich Mean
Time date/time (UTC). These are taken from your Windows time
10
Chapter Two / DISPLAY COMPONENTS
settings. If they look erroneous, it is not a problem in Digital Atmosphere. From your Windows start bar, go to Start > Settings > Control
Panel > Date Time and make sure the correct time is set and the correct time zone is shown.
GRIB. This panel allows you to import and view GRIB data. Click
Import to choose a file to view. Make sure either plot or contour are
selected, and choose Select Field to view the desired GRIB field.
Fronts tab
View fronts. Displays whatever frontal
bulletin currently resides in the QUEUE.
FRT file. This bulletin may be imported from
the Internet (see “using original sources of
data” below) or may be created by the user
(see “create” and “making your own maps”
below).
Start new overlay. Erases any drawings in
progress or that may have been done earlier,
and starts a new overlay.
Enable drawing mode. When enabled, command inputs are taken from the mouse while
on the workchart and lines or features are
drawn.
Isopleth. When pressed, any line being
drawn terminates and further drawing is
begun using an isopleth (a thin black line).
Cold front. When pressed, any line being
drawn terminates and further drawing is begun using a cold front.
Warm front. When pressed, any line being drawn terminates and
further drawing is begun using a warm front.
Stationary front. When pressed, any line being drawn terminates
and further drawing is begun using a stationary front.
Occluded front. When pressed, any line being drawn terminates
and further drawing is begun using an occluded front.
Chapter Two / DISPLAY COMPONENTS
11
Trough. When pressed, any line being drawn terminates and further
drawing is begun using a trough.
Low. When pressed, any line being drawn terminates. Any click on
the workchart will produce a low pressure area.
High. When pressed, any line being drawn terminates. Any click on
the workchart will produce a high pressure area.
Text. When pressed, any line being drawn terminates. You will be
prompted for text and allowed to place it on the workchart.
Suspend highs/lows. Highs and lows are omitted from the map.
Helpful hints
Drawing a front. So that the barbs point the correct way, as you draw
the line cold air must always be on your right side (except when
drawing warm fronts); the easiest way to remember this rule is to always start from the center of a low pressure area and work your way
to higher pressure. Simply set the cursor on the first point, choose
“__ front”, then move along the front and right-click Frontal depiction tools > Add front point at each point to define 3 or more points
along the front. The front will be drawn as
you go along, and will be smoothed automatically as a spline.
Drawing highs and lows. Simply right-click
on the map and choose Frontal Depiction
Tools > Add high/low to mark the position
of a high or low pressure area. You will be
prompted for a central pressure in millibars.
You can leave this blank if you wish not to
specify one.
Scripting tab
This panel is meant for advanced users who
want the ability to script or to construct
elaborate analysis commands. See the
Appendix under Scheduler Scripting and
Analysis Scripting for full details.
Scheduler command. Enter a single script
command manually (see the section in the
Appendix for more information). It will be
executed immediately.
12
Chapter Two / DISPLAY COMPONENTS
Scheduler: Run. Immediately executes a selected script file.
Scheduler: Create. Creates a new script file. This is basically a plaintext editor that loads and saves the file with a script extension.
Scheduler is off/on. Turns the scheduler on and off. Turn it on for
the scheduler to take effect. It will trigger the execution of script files
at the times you select.
Scheduler display window. Shows the current schedule that will
be executed if you turn the scheduler on. The first four digits are the
UTC time at which the script will be executed. Following this is the
script file that will be executed at that time.
UTC time readout. Displays the current UTC time so you can see
whether a script might execute soon.
Analysis command. Advanced users may type in an analysis command here (or paste it from a text editor). When you press the <ENTER> key, the command will be executed. See the Appendix for help
on building an analysis command script.
Status box
This panel shows all status messages displayed
by Digital Atmosphere while it is in operation.
When Digital Atmosphere first starts, it reports
the version number, the Windows version, and
the amount of virtual memory available and in
use. The box periodically clears itself to conserve
memory.
To clipboard
Copies the contents of the Status Box to the clipboard.
Show memory use
If enabled, Digital Atmosphere will report the
available memory after each user interaction. This
is useful for tracking rare occurrences of memory
leaks, which in Windows 2000 and XP will manifest
itself in the form of degraded performance over
time and increased hard disk access. Generally this
Chapter Two / DISPLAY COMPONENTS
13
number will fluctuate, but if there is an overall downward trend, this
may indicate a problem. Digital Atmosphere consults the system statistics through GlobalMemoryStatus WinAPI calls, using the formula M =
dwTotalPhys - dwAvailPhys.
Workchart
The workchart is the large graphical space that is used to display maps,
plots, and contours. There can only be one workchart open at any one
time.
You may resize the map by dragging the borders with the mouse. Digital Atmosphere will remember the map dimensions even if the program
is exited and restarted.
Popup menus
Digital Atmosphere allows you to issue specific commands by rightclicking on the map. This action defines a location. When you do this, a
popup menu will appear and you will have the following options that
apply to the workchart or the defined location:
14
Chapter Two / DISPLAY COMPONENTS
Cursor slaving
This causes slave cursors to appear on all available workcharts which are
centered on the same geographical position as the position being indicated by the cursor. This is useful for comparing features on different types
of radar products. You may turn cursor slaving on and off. It is best to
leave it off when not in use.
Graphic showing a slaved cursor between two charts.
Recenter map
This is the only popup menu function that currently exists. It will cause
the basemap to be redrawn, centered at the location you have selected.
To refine this further, you may use the Zoom In or Zoom Out speed buttons or use Map > Generate.
Marks
This allows you to define reference marks on the map to be recalled
later at any time. Use Set mark to define a new mark. Use Draw mark
to draw all marks in memory. Use Clear memory to erase all defined
marks from memory.
Distance and track cursor
Digital Atmosphere has a sophisticated interface for measuring distances. Simply drag the mouse: hold down the left mouse button at your
desired start point, and move the cursor across the screen. You will see
a bounding box, and within that, a great circle path (see the illustration).
Also in the status bar at the bottom of the screen you will see path data
appear, . When you let go of the cursor, the bounding box and great
circle path disappear, but the latest path data remains on the status bar.
Bounding box. This defines a rectangular screen region that is used for
certain operations within Digital Atmosphere, most notably quality control (File > Quality Control).
Chapter Two / DISPLAY COMPONENTS
15
Great circle path
Within the bounding box, you will see a diagonal line that connects the
two corners of the bounding box (your start and end location). It may
have a small or great amount of curvature. This is a great circle path:
literally the shortest path between the start location and the mouse location. It represents the path that would occur if you found two points on a
globe and connected them with a string. Airplanes always try to adhere
to great circle paths when routes and weather permit, thus you can use
this feature to find the most likely route for long-distance flights. A great
circle path may have a curved look at wide map views, especially toward
the edges of the screen, due to inherent distortions in the map projection.
Only on the gnomic projection would a great circle path be a perfectly
straight line (Digital Atmosphere does not support gnomic projections).
Path data
Shows the coordinates of the start and end points for the great circle
track, the initial bearing from the starting point, and the distances in
nautical miles, statute (“normal”) miles, and kilometers
Special note
If you want to see distance and direction from cities close to the cursor,
see Map > Cursor City Distance to get a display of this information. The
path data will be replaced by the city information whenever Map > Cursor City Distance is enabled.
16
17
CHAPTER 3
File menu
These menu commands are reserved for functions that operate on data files
or are significant to Digital Atmosphere’s operation.
Update all workcharts
Causes the contents of each open workchart to be updated with the current product. As of 2007 this command is still being tested and is not
guaranteed to work properly.
New Workchart
Causes a new workchart (a separate map) to be spawned.
Import Directory / Specific File
Digital Atmosphere is a tool that lets you create weather charts using
current raw data. Therefore, you need to get raw data into Digital Atmosphere. We refer to this process as raw data import. Once you import
data into Digital Atmosphere (via any of the possible methods explained
below), the program will continue to work only with that data until you
perform another import. In other words, the data will still be in Digital
Atmosphere if you exit from the program and then run it again later.
Once you perform a second import all the data from the first import is
deleted and is no longer available.
The Import Directory command imports all files contained in the selected directory, while Import Specific File imports one single file. The data
files chosen should consist of text bulletins containing METAR, synoptic,
SAO, FD winds aloft, buoy reports, rawinsonde, or other compatible
data. After the data is imported, it can then be plotted or analyzed.
If you use the Internet, you can avoid all use of this command by using “Internet”, “Retrieve Data”. Digital Atmosphere will automatically
execute an import when data is retrieved.
18
Chapter Three / FILE MENU
Never import a directory containing binary files, programs, or over 100
files. The results may be unpredictable.
Import GRIB
GRIB is a standard format for binary data interchange between weather
agencies, most notably for the exchange of numerical model forecast
data. Digital Atmosphere offers the ability to view this data. Although
we strive to give you substantial amount of protection from the sheer
complexity of the data, a working knowledge of GRIB is important to
getting the most from this data. A full chapter on GRIB data is contained
in this manual and it deserves study.
A few data sources may store the data in a compressed format, such as
*.ZIP or *.BZ2 (BZip2). You will need to decompress the data using a
third-party program before it can be used in Digital Atmosphere.
Once Digital Atmosphere has examined the file, you will see a dialog
similar to this one:
You must then choose which field you want to see. The specific field you
chose will be extracted. To view the field, click on either Contour or Plot
in the Toolbox window (see illustration).
For full information see the chapter “GRIB Data”.
Chapter Three / FILE MENU
19
NOTICE
Because of the complexity of GRIB data and the fact that it is
not fully supported by Digital Atmosphere yet, Weather Graphics
Technologies will not provide assistance in locating, retrieving, or
using GRIB data. It is provided as-is. Comments are welcomed
but we may not be able to respond to questions. If you need help,
please access our public discussion group on our website at www.
weathergraphics.com/forum.
NOTICE
GRIB2 data is not yet supported by Digital Atmosphere.
Clear data directory
This is a utility command that clears out the data subdirectory <DigitalAtmosphere>/data. Normally it does not need to be used unless suspicious plots or contours occur and the user wishes to flush out all data.
This ensures that File > Import does not inadvertantly retrieve files that
do not belong. It can also prepare the data directory in case the user
wishes to place numerous files into the directory to be imported.
Once the directory has been cleared, data that has already been imported
and stored in native binary format will remain unaffected, but “Import
directory” will not work at all until new data is placed in the data directory (via a file copy or via the Data > Retrieve command).
Font mode
This forces Digital Atmosphere to use one of two font modes when creating station plots and contour labels:
Truetype - This includes all regular fonts on the user’s computer.
The exact font is obtained from the Preferences > Styles setting tied to
the workchart in use, and may be modified to use a wide variety of
font names and sizes.
20
Chapter Three / FILE MENU
NCEP FONTS
DIGITAL ATMOSPHERE NATIVE FONTS
Alphanumeric characters use any Window Truetype font.
Chapter Three / FILE MENU
21
NCEP/NMC Raster - This is a special set of fonts that we extracted
from NCEP weather software source code. This font dates back to at
least 1968, and can give a more professional look to certain charts.
About NCEP fonts
The NCEP raster fonts (called “raster” because they are not scalable like
most Windows fonts) are stored in several key files as described below.
They were used on NMC (National Meteorological Center) charts from
the 1960s and are still in use today in certain National Center for Environmental Prediction products. They are stored in BMP format, so users
may edit them as needed. These were extracted from NCEP source code
written by ESSA or NOAA programmer Gloria Dent around 1970 and
may very well be some of the oldest computer fonts in use anywhere.
See the illustration on the facing page.
Other settings
Additional settings for contouring may be found in Preferences > Analysis > Isopleths.
Get archived data
If you have the Surface Archives or Upper Archives disc sets from
Weather Graphics Technologies, you can use this option to retrieve data
on the disc instantly. Digital Atmosphere will decompress and ingest the
desired datasets, enabling you to plot maps of any date and time between 1961 and 1990 (and earlier and later in some cases).
In the above example, we’ve specified that we want data for September 4,
1972 at 1700 UTC (Greenwich Mean Time). It is assumed that the Surface
Archives 1961-73 disc is in the drive (if the wrong disc is in the drive, you
will get an error). Once the “Import” item is selected, the data will be
imported. You can then use commands such as Data > Plots and Analysis
> Sea Level Pressure to view the data.
Quality control
If you’re a newcomer to meteorology, you’ll quickly discover that not
all weather data is 100% accurate. Errors can get into raw weather data
either through transmission problems, communications interference, human error, or simply the observer hitting the wrong key when typing up
22
Chapter Three / FILE MENU
the report. These can either be unnoticable or may corrupt an analysis.
Fortunately, Digital Atmosphere provides a tool to help fix the problem.
To perform quality control, simply drag the mouse over the location
where erroneous data is suspected. A box will appear, as shown below:
When you select File > Quality Control or press the QC Speed Button,
the quality control panel will appear, as seen below:
You may then edit the values shown and correct any entries that look
suspicious. Always use a value of -9999 to indicate missing data. Press
Stop Search at any time when you are done changing data and your
changes will be saved.
Chapter Three / FILE MENU
23
Note that the data shown in the QC Panel is dependent on what the
active level is (as is shown on the Time Toolbar). If the active level is a
non-surface level, Quality Control will only display upper-air data. If the
active level is a surface level, Quality Control will display only surface
data.
The options you have are:
Accept Entry — Saves the report as shown, including any modifications you might have made. Once you hit Accept Entry, all changes
become permanent.
Ignore Changes — Ignores any changes that you’ve made to the
report and move to the next one.
Delete Report — If the individual report is so corrupted that you
know you won’t want to use it, you’ll probably want to delete it. This
is the button to use.
Stop Search — Stops sifting through the file, saving any values that
you’ve already entered.
Note that QC displays all data within the bounding box (even if it’s filtered out on the map), so you may need to press “Accept entry” numerous times until you find the station you want. One way of avoiding this
problem is to make the initial QC box as small as possible so that you get
only the station you want. Likewise, it’s possible that multiple reports
for one station might be in the data; you can change the bad data for each
one or just delete the duplicate reports.
Since QC changes the formatted binary data files, you will lose your
changes if you re-import the original data.
View raw data
Sometimes you will want to go back and look at the original data. Not
only is this handy; it is recommended so that you can review observations for vital clues (such as observer remarks), as well as look through
any forecast data you might have captured.
The file that is shown is the internally-saved clean data file produced by
the most recent File, Import command. The original raw data file is not
24
Chapter Three / FILE MENU
referenced and does not have to be present. If you don’t like this interface, you can view the same data file using any text editor and setting it
to examine DATA.USR in your Digital Atmosphere directory.
The View Raw Data panel also has a “Find” function that lets you search
for stations and keywords in the file.
Print
Sends the currently selected workchart to the printer. See the Appendix
chapter on Printing.
Print setup
Sets the default printer behavior for this Digital Atmosphere session. See
the Appendix chapter on Printing.
Calculator
Do you need to find a wind chill value? A mixing ratio? A theta-E? No
problem. Digital Atmosphere’s meteorological calculator lets you plug in
values and find a result. Simply choose the conversion you want at the
top, enter the values in the center panel, then press Calculate.
Note about actual pressure.
When an entry box asks you for Actual Pressure, this indicates the actual
pressure of the parcel (QFE), not the sea-level pressure, unless you’re re-
Chapter Three / FILE MENU
25
ally at sea level! You can find your “actual pressure” by simply calculating “Station Pressure (mb)” and entering your altimeter setting (pressure
in inches as provided in public weather reports) and your elevation in
feet. An example: In Denver, Colorado, your elevation is 5300 ft and the
pressure is 29.96 inches. This yields a “station pressure” or “actual pressure” of 834.8 mb. You can then use this value in calculations which ask
for “actual pressure”.
Recompile tables
This option is used to recompile station index listings from scratch. Most
users don’t need to use this command since compiled tables are already
provided with Digital Atmosphere. It is used only when you have made
editing changes to the station listings in digatmos.stn and you want
these changes to be enabled.
To modify digatmos.stn, you’ll need a standard text editor (such as
MS-DOS EDIT or Notepad). Always be absolutely sure that you save the
file as a ASCII (text) file or you will corrupt your installed copy. When
you have finished your changes, you can use File > Recompile Tables
at any time to regenerate the internal listings. It takes about about 1 to
5 minutes depending on your computer speed. Once the procedure is
finished, Digital Atmosphere will make use of the new changes.
You may use Recompile Tables as many times as you wish.
CAUTION
SPECIAL NOTE: Effective with Digital Atmosphere Original V2.2
(released in 1998), a new station table format was being used,
which contains changes in columns and data fields. Never try to
import older DIGATMOS.STN formats, as you will corrupt your
installed copy.
Preferences
See the special chapter PREFERENCES.
26
Chapter Three / FILE MENU
Exit
Exits Digital Atmosphere. The background map will be saved and it will
automatically appear the next time you run the program. The last data
set you imported will continue to be available.
27
CHAPTER 4
Map menu
These map commands are used for all mapping operations relating to Digital
Atmosphere.
Erase map
Erases the workchart. Use this command whenever you want to erase
weather data from the map and start with a clean map.
Load basemap
Loads a workchart from your disk drive. You will need a previouslysaved workchart (which can be saved using the Save Map command).
Save basemap
Saves the workchart for future access within Digital Atmosphere. This
also saves any markings, annotations, weather data, and contours that
are on the map already as a permanent part of the map, so if you intend
to load this map later without any weather data, you’ll need to use the
Erase Map command to get rid of the data before you save it. If you want
to save the map for your projects, presentations, and so forth in one of
several graphics formats, you should instead use Map > .
An important consideration is that only Windows bitmap (BMP) files
can be saved, and they are rather large. File sizes can range anywhere
from 300 to 700K in 8-bit color mode to several megs in 24-bit color
mode. Avoid saving too many unless you have plenty of disk space. If
you’re using on-the-fly disk compression (such as Stacker, DoubleSpace,
DriveSpace, etc), these images will take up about 80% less disk space
than they do when uncompressed.
28
Chapter Four / MAP MENU
FOR ADVANCED USERS
Save Map produces one image file (a Windows bitmap, *.BMP)
and a very small map attribute file (*.DMF). The DMF file is necessary to load the map into Digital Atmosphere and should stay in
the same directory as the DMF file. The internal structure of DMF
files is explained in the Appendix. Once the *.BMP file is saved,
you are free to use any graphics editor to tweak or annotate the
image. Note that you must re-save it as the same type of graphics
format it was in (a BMP with a color depth of 24 bits), or Digital
Atmosphere will produce an error message when it attempts to
load the image.
Generate basemap
The Generate Basemap panel is used to generate all workcharts from
scratch. This is the primary way that new maps for new workchart
areas can be created. The only alternate way to create such maps is to
right-click on a map and choose “Recenter map”; the workchart will be
adjusted to the new center. Digital Atmosphere offers many different
options, described below, to provide the exact map position and scaling
factors desired.
Projection
For standard vector geography drawn by Digital Atmosphere, choose
Orthographic. The chart will be drawn according to the color style that
you select below in Color Style. To select raster graphics (only for Professional Version users), choose one of the raster charts listed. For more
information about raster graphics, see “About raster graphics” below.
Latitude / longitude.
Sets the center point of the chart to be drawn.
Scale
Sets the width of the map in nautical miles.
Image width / height
Sets the image width and height of the map to be drawn in pixels. A
good value for most purposes is a width of 900 and height of 600. The
image width and height controls are a powerful feature for presenting
a depiction of a very large area or for publication purposes. Scrollbars
will appear on very large maps to help you navigate around them. It is
Chapter Four / MAP MENU
29
recommended that you do not use image sizes greater than 3000 to 5000
pixels, as this takes up a lot of system resources. Memory consumption
increases exponentially with an increase in both height and width.
Color style
Selects a color scheme with which you want this chart to be permanently
associated. The color settings in this file will apply to this chart and any
subsequent fields drawn to it. Once this is selected you cannot change it
without generating a new workchart. Color styles may be edited in the
File > Preferences > Styles panel or by direct-editing files in the Digital
Atmosphere /styles directory.
Advanced properties
You may use the advanced properties settings to distort the appearance
of the map drawn (orthographic only). This can be extremely helpful for
aligning a workchart with a satellite photograph.
Offset - The offset is in pixels and controls how far the map is shifted
up/down or left/right from the center map point that you create (the
default is 0).
Aspect - Independently controls the scaling factor for the map in
both the X and Y dimension (the default is 1); which is useful if a
wider or narrower map is desired.
Rotation - Allows the map to be rotated by a given value in degrees
(decimal degrees may be used; positive is clockwise).
Quick-pick
Use the quick-pick panel to quickly select a map location based on a
known station. Enter the station’s identifier (ICAO or WMO) in the
“station” box, or choose a location preset. The zoom level and map size
controls will move the scale and image width/height, respectively, to one
of several preset values.
About raster graphics
Our prepackaged raster graphics are considered a premium feature and
are only available in their entirety in the Professional Version (on CDROM). Raster graphics are highly useful for real-time radar analysis of
storms due to the vast amount of geographical information they convey.
In the standard Digital Atmosphere version, coverage is only available
around the New York City area for evaluation purposes. In the Professional version there is coverage of the entire United States (except 1:250K
Joint Operation Graphic which is limited to the south central U.S.) All
raster graphics are drawn in the Cartesian projection (which causes slight
but inconsequential distortion in the northern and southern U.S.).
30
Chapter Four / MAP MENU
Image of supercell with raster maps (Professional Version) underneath. This uses the 1:500,000 Tactical Pilotage Chart series that covers the U.S.
Blank map
Creates a workchart with absolutely no graphical content, i.e. completely
blank. Digital Atmosphere is, however, aware of the cartographic details
of the workchart pane and can still plot to it.
Import map from file / url
Imports an existing basemap into Digital Atmosphere without changing the geographical coordinates. This command is mostly for advanced
users who are importing satellite photos into Digital Atmosphere. Users
should always use Load Basemap instead of Import Map unless they
understand what they are doing.
This command simply swaps out the current workchart map image with
a graphic obtained from the chosen file. You may select between GIF,
JPG, PNG, and BMP formats. Note that Import Map expects the coordinate system to remain the same, so you must be positive that the existing
Digital Atmosphere map matches closely with the image that you are
about to load. Considerable experimentation may be necessary.
Chapter Four / MAP MENU
31
The URL choice (instead of Import from File) is useful when the graphic
that is to be loaded consists of live weather data, such as a satellite image.
Import shapefile
A shapefile is a universal map format developed by ESRI. It is designed
to store nontopological geometry and attribute information for the spatial features in a map dataset. These consist of points, lines, and polygons. Used with Digital Atmosphere, it gives you complete flexibility to
develop basemaps that are designed by yourself or a third-party source.
You can use it to display customized boundaries for important land areas
and forecast regions.
To import a shapefile, click on Map > Import shapefile . A file explorer
dialog will open, allowing you to navigate to the shapefile that you want
to use. The shapefile will be overlaid on the existing map. It will not
replace your current map. If you want to eliminate the existing Digital
Atmosphere map, use Map > Blank Map before using this command.
Be aware that the data from a shapefile is treated as an overlay. To use it
as a permanent graphic in your workcharts, you must use Map > Copy
Markings Onto Basemap after displaying it.
Shapefile attribute selection
If an attribute (*.dbf) file was paired with your shapefile, you will see a
popup screen that looks like this:
The meanings are as follows:
32
Chapter Four / MAP MENU
Field to display as text - This dialog allows you to select a text field
of each feature (such as a forecast office name, etc) to be displayed as
text. Select which field you want displayed. To ignore this (such as
if you’re just drawing boundaries), just leave all fields set to none.
Longitude source - You may also select an optional latitude/longitude source, if the data explicitly contains a Latitude and Longitude
field (not all of them do). If you are certain that there is a Latitude
/ Longitude field in the dataset, you may choose them. Otherwise
leave them set to “none” and the text will be displayed either on the
last point plotted or in the middle of the polygon or polyline bounding region.
Tips
Here are some valuable tips for working with shapefiles:
n If you don’t want to pick an attribute every time you display a shapefile, you may delete or rename the associated *.dbf file so that it is not
detected.
n A shapefile only holds one feature class of data. It cannot, for example,
hold county outlines and city outlines as separate entities.
You do not need to have *.dbf and *.shx (attribute) files to use a shapefile;
you only need the *.shp file.
n Shapefile creation is not a simple task but may be accomplished in
programs like ArcView, MapObjects, MapMaker, and Manifold.
n To delete the existing Digital Atmosphere basemap, use Map > Blank
Map before importing a shapefile. Otherwise the shapefile will be
painted on top of the map.
n Digital Atmosphere does not export shapefiles at all.
n Be careful using street-level data, as Digital Atmosphere is not designed for extremely tight zooms. Digital Atmosphere is not a streetlevel mapping system.
Important notes
A lot of money is floating around in GIS (geographical information
systems) technologies, and there seems to be very little interest in the
free exchange of shapefiles. Therefore don’t be surprised if you can’t
find a shapefile or if you see prices that will break your budget. On the
other hand there are a good number of free shapefiles around, especially
for odd regions, but you may have to scavenge government and private
websites to find them.
We cannot help you find shapefiles. However some possible sources
include:
http://www.manifold.net/download/freemaps.html
http://www.nws.noaa.gov/geodata/
http://data.geocomm.com/catalog/index.html ($)
Chapter Four / MAP MENU
33
Also use search engines like Google to search for “GIS data” for your
area. Look in government city, transportation, and planning web pages.
Some forward-thinking cities such as Austin offer their data publically
(see ftp://coageoid01.ci.austin.tx.us/GIS-Data/Regional/
coa_gis.html for an example), but extremely localized shapefiles such
as these may be too small of a scale to be useful with weather data. Also,
some local governments in the U.S. have withdrawn GIS data due to due
to post-2001 paranoia or government entanglements with contractors
and private interests.
Railroad network for Texas, generated from Texas Department of Transportation shapefile.
Copy markings onto basemap
This function “merges” all information on the map, including contours,
plots, and annotations, so that they all become part of the basemap itself.
This is useful only when you have overlaid county lines or highways, or
extra geographic information from shapefiles, and you wish to retain the
markings. All of the markings are lost when a new basemap is regenerated, so it may be desirable to save the new map for later use using Map
> Save.
34
Chapter Four / MAP MENU
Copy chart to clipboard
This is the easiest way of transferring a workchart to another software
program. When you choose this, the workchart is placed in the Windows
clipboard. From there, you can paste it into any of your favorite graphics
programs.
Export chart
This command is exactly identical to Save Map, except that no map
attribute file (*.dmf) is saved. Therefore it is designed to save maps for
use in other Windows applications. The output format can be selected
under “Save as type”. As an alternative to using Export Chart, you may
prefer to use Copy to Clipboard and paste the image into your favorite
program.
Here are the different filetypes you can save.
n GIF (Graphics Interchange Format). This is recommended for general
purpose graphic saves where file size is most important. This is best for
important documents and desktop publishing. The palette is only 8-bit
(255 colors) so you may see unwanted changes in color and hue. Pixel
quality though is superb and it is excellent for handling fine detail (such
as station plot models).
n JPG (JPEG). This is recommended for general purpose graphic saves
where color accuracy is most important. It offers good compression, but
details may be lost. This is a “lossy” compression scheme, which means
that some pixel detail is lost. Filesize however is vastly smaller than other
formats when the image is complex. The palette is 24-bit, but color is
not accurate bit-for-bit due to the lossy compression scheme. Some fine
detail (such as plot models) may have very slight illegibility. Compression settings can be modified in File > Preferences > Maps > . Go there to
change the permanent setting.
n PNG (Portable Network Graphics). This is recommended for accurate (lossless) renditions of the graphic where lossiness is not acceptable,
but a slight disk space penalty is fine. However some older browsers
(mainly from before 2000) do not recognize PNG graphics.
n BMP (Windows bitmap). This is recommended for accurate (lossless)
renditions of the graphic where large filesizes are acceptable. The widespread use of BMP files are not recommended as there is no compression
Chapter Four / MAP MENU
35
and images may consume large amounts of disk space (a 2000 x 1500
pixel image will use 10 MB, as compared to 1 MB or less with JPEGs and
GIFs). Note that it creates 24-bit bitmap files that are not compatible with
older graphics viewers, especially those written before 2000 and nearly
all written before 1996.
Cursor city distance
For United States locations, this causes the status line (at the bottom of
the screen) to display the coordinates from the nearest town or city to the
cursor position. This allows you to quickly judge the distance to a storm
or other target from the closest town. You may adjust the sensitivity to
large vs. small towns by changing the cursor city sensitivity factor in
Digital Atmosphere’s Preferences > Misc tab. This sensitivity may vary
from state to state, as we have not fine-tuned the data, and some experimentation will be required. The source of the city data is digatmos.cty,
which is in text format and may be freely modified by users for applications in non-U.S. countries.
Click this selection to enable it (a checkmark will appear next to the
menu option), and click it again to disable it. You will need to disable
this function if you want to see bound box coordinates, paths, and path
information generated by dragging the mouse on a map.
Information
Displays detailed information about the map currently shown. Included
is the map width and height (in both pixels and nautical miles), the
center latitude/longitude of the map, and the corner latitude/longitude
points. All negative latitudes indicate the southern hemisphere, and all
negative longitudes indicate the western hemisphere.
36
Chapter Four / MAP MENU
Set comment
Sets an annotation that will be prefixed to the legend of a workchart
when data or contours are drawn. You can enter any information you
want. A typical purpose is for specifying exact dates.
Make topography
Renders a topographic representation (terrain features) of the Earth on
your map projection. After the topography is drawn, Digital Atmosphere
then re-overlays the basic geography data. The topography draw operation may take a few minutes on slower computers.
Example of topography rendering for United States.
Import planetary map
A planetary map is a popular name for a graphic image that covers from
-180 to 180 degrees longitude from left to right, and 90 to -90 degrees
latitude from north to south. It may come in many different scales and
resolutions, but the important thing is that it covers the entire world. It
Chapter Four / MAP MENU
37
is a relatively simple procedure for Digital Atmosphere to map the globe
using such a graphic.
To find a planetary map, we suggest putting this into a search engine,
especially an image one like Google Images:
earth texture
Some sources include:
http://planetpixelemporium.com/earth.html
http://arstechnica.com/reviews/4q00/macosx-pb1/macos-xbeta-12.html
http://www.oera.net/How2/TextureMaps2.htm
Planetary maps that are 1440 x 720 will have a resolution of 0.25 deg
(15 miles), which will offer marginal quality for synoptic scale charts.
Extremely large maps exceeding 10,000 pixels in any dimension may exceed available memory and cause an error. It may be helpful to find images that are not in JPG format, as sometimes the compression artifacts
cause degradation of the image. We also suggest finding bright maps, as
dark maps are common but make it hard to read data, annotations, and
contours. It may be helpful to bring dark maps into a graphics program
to lighten them up.
Note that when a planetary map loads, Digital Atmosphere will not automatically replot the basemap. If you wish to do this, select Map > Add
Overlay > Basemap.
Example of a 2500 x 1250 pixel planetary map used as an underlay.
38
Chapter Four / MAP MENU
Add overlay
Redraws the workchart basemap without erasing the contents of the
workchart.
Basemap
Overlays the basic geography basemap.
Counties
Overlays United States counties, parishes, and certain city border information. After this is done, the basic geography is re-overlaid onto your
map. The source file is highly detailed, condensed from U.S. Geological Survey data, and has an accuracy of 1 mile. There are about 175,000
points in the county boundaries file, so it may takea few minutes to plot
on slower computers.
The County Name plot overlays the names of the counties. The names
are truncated according to the zoom factor so that they fit within the
county. Users can edit the locations of these county labels as well as their
text content by editing the plaintext file DIGATMOS.CXT with any text
editor (such as Windows Notepad).
Highways
Overlays United States interstate highways onto the map. The secondary highways option overlays United States U.S. and state highways
onto your map. This is a detailed process and may take a few minutes on
slower computers.
Cities
Overlays predefined city marks and labels onto your map as a reference.
Before you can use this successfully you will need to define the cities
you want drawn by editing the file DIGATMOS.CIT with any text editor
(such as Windows Notepad). The columns used are as follows:
Col Contents
1-2 Latitude of city in degrees
3-4 Latitude of city in minutes
5 N or S latitude sign
7-9 Longitude of city in degrees.
10-11 Longitude of city in minutes.
12 E or W longitude sign
14-33 Name of city as you want it to appear
Chapter Four / MAP MENU
39
The DIGATMOS.CIT file contains some default cities that are formatted
per the above specifications, which you may find useful to refer to as a
template when adding new cities.
Point
Overlays a specified point on your map from a given file. Files should
have the name ____.pls, where ____ is any chosen name. In other words,
use the file extension *.pls. This is not required but will help keep your
filenames organized. See the chapter on Point Overlays for information on how to construct point files.
Aeronautical route
You may display an aeronautical route using this panel. Follow the
format:
CC/III or
CC/III-CC/III or
CC/III-CC/III-CC/III...
US/LAX-US/JFK
where CC is the country designator (FIPS 10-4 two-letter country code),
with a solidus, followed by III, the identifier. The identifier may be an
airport, VOR, or waypoint. The following will plot a route from Los
Angeles to New York:
Add station reference
The station reference control panel allows you to add markings on your
map that show available weather stations. You can use this to develop
locator charts for your forecast desk, and help find stations that are not
reporting data or are being omitted by the data provider. The source of
all station reference information is the Digital Atmosphere station file
(digatmos.stn). The control menu, in which you may select types of stations as well as the general appearance, appears as shown below:
n Plotted symbol. This is fairly self-explanatory. The mark on top
of each weather station may be drawn as a square, circle, triangle,
a hollow form of these, a cross, or a user-defined character (such as
the letter X). The color and width of all marks are controlled in File >
Preferences > Styles under the “stl” (station reference lines) row.
n Size of symbols. Controls how small or how large the symbol
mark will be plotted. A value of 3 is recommended for most purposes. You should change this when plotting extra large or extra small
maps.
n Label 1 and Label 2. Digital Atmosphere can plot a text label next
to each station symbol. This can contain the ICAO (4-letter alphabetical code), the WMO (5-digit numeric code), or the station name. The
40
font used for labels is controlled in File > Preferences > Styles under
the “stt” (station reference text) row.
n Category. You may want to plot only radar sites, or only upper air
sites. If these are annotated as such in the digatmos.stn file, they can
be plotted.
n Filter according to station status. The station lists do contain stations which have been flagged as obsolete (which is done when an
equal sign is in column 5 of the station tables). Use this dropdown to
change how Digital Atmosphere responds to such a condition, if at
all.
n Anti-crowding. In urban areas, symbols and labels may overlap
each other. Use this to control the crowding of symbols next to one
another. Pressing the All button sets the factor to 100 (full cluttered),
plotting all stations.
n Plot only stations in this country/province. Use this text field
to force Digital Atmosphere to ignore all symbols except those in
locations that you specify. The country code should be in ISO 3166
format (equalling those in columns 51-53 of the station tables, such
as CAN for Canada), and state/province codes should be equal to a
2-letter abbreviation used in columns 55 -56 of the station tables (e.g.
NY for New York). Press Clear to reset these values to accept all stations.
Range rings
Overlays NEXRAD radar range rings. The primary use of this is to establish the limit of radar coverage for hurricanes off the coastal regions.
Custom overlay
Overlays a custom overlay onto the map. This is done in the WeatherGraphix style, with custom geography residing in the file DIGATMOS.
PLR. Edit this file manually (using an ASCII text editor such as Windows
Notepad) to make changes. Note that longitude in the west hemisphere
is negative, so files imported from WeatherGraphix will need to have the
longitude signs inverted. The color of the line is controlled by the “roads
and custom lines” setting in File > Preferences > Map.
Date stamp
Overlays the date stamp at the top of the map.
41
Annotations
This allows temporary annotations to be set which override the annotations set in Preferences > Annotations.
Change credits
Sets text to be plotted in the lower left as a credit. This will temporarily
override the credits set in File > Preferences > Annotations until the value
is deleted or the program is restarted.
Change title
Sets text to be plotted as a title. This will temporarily override the title
set in File > Preferences > Annotations until the value is deleted or the
program is restarted.
42
43
CHAPTER 5
Data menu
The data commands display non-analyzed meteorological fields. The available options are shown briefly below.
Retrieve data
This module retrieves weather data through the Internet and automatically imports it for you. This means you can immediately begin plotting
and analyzing.
To use Retrieve Data, you must already have a connection to the Internet through your service provider before this command will work. If
you are using a firewall program, be sure to grant Digital Atmosphere
permission to use the Internet. Most users do not use proxy servers, but
if you do, enter the information in File > Preferences > Miscellaneous.
When you select Retrieve data, you will be presented with a dialog box
containing a list where you can check off the items you want to download (see illustration) from a product list. Once you press Retrieve, the
chosen products will be downloaded and stored in your data directory.
Then you can use File, Import Directory to see the results.
Since Internet sites sometimes change, you can fully edit the list of products and data directly from this dialog box by highlighting the item you
wish to change and clicking the Edit Site button or the Delete Site button.
44
Chapter Five / DATA MENU
You can also add a new site by clicking the Add Site button. You will
then be prompted to enter the site name and URL for the data.
Time tokens
Many sites, especially for surface and upper air data, have a filename
that is dependent on the Greenwich Mean time of the observation.
To support this, Digital Atmosphere lets you insert time tokens into a
filename. For example, if you entered a product that had a URL address
of http://www.weatherdata.com/@Hdata.txt, Digital Atmosphere would
automatically substitute the current UTC (GMT) hour in place of the @H.
So if it was 9 pm EST (02Z), Digital Atmosphere would retrieve http://
www.weatherdata.com/02data.txt.
Here is a complete list of all the UTC time token combinations you can
use:
Character 1 - mode
@ This hour
$ Last hour
Character 2 - time
M Month
D Day
H Hour
X Rawinsonde hour (rounds down to 00 or 12)
S Main synoptic hour (rounds down to 00, 06, 12, or 18)
I Intermed synop hour (rounds to
00/03/06/09/12/15/18/21)
F Frontal hour (for ASUS1 KWBC frontal position
bulletin) (rounds to 01/04/07/10/13/16/19/22)
*** note that some servers do not ***
*** produce a ASUS1 at 22Z ***
Although Digital Atmosphere automatically figures the current time
tokens before you retrieve data, you may want to override them. This is
handy if you want to see data for an earlier hour. All you have to do is
change the numbers that are displayed in the time token panel.
Solving incorrect time problems
If the time tokens always show a slightly incorrect hour, check your Preferences menu under the General tab and make sure the “Daylight Saving” checkbox is marked in accordance with whether daylight savings
time is in effect. If the hours are significantly off, go to your Windows
control panel, look under Date/Time, and make sure your computer is
set to the correct time zone. Then make sure your system clock is set to
a current time which is valid for that time zone. For example, if you live
in New York and typically have your computer clock set to Greenwich
Chapter Five / DATA MENU
45
Mean Time, you will have to set the Windows time zone to “GMT”
rather than Eastern Time.
Automatic directory search
If you begin a URL with %1, such as
%1http://www.mysite.com/data/mydat
this instructs Digital Atmosphere to search the directory to find the most
recent file. In this case it would search http://www.mysite.com/data/ .
The filename on the end (in this case “mydat”) is used as a wildcard to
find matching files (so files like mydatafile.txt and mydata084.dat would
be included, while wxdata.dat would be discarded. If you omit the
filename, all files in the data directory are included in the search. It is not
advisable to use this directory search function with all the products in
your Internet table, because with university servers processing METAR
and SYNOP data, coding errors may result in the creation of extraneous
files that do not contain data. The directory search function is recommended instead for certain NEXRAD and other products on certain
servers when there is no way to effectively predict the filename. Also be
aware that some servers are unable to present directory listings due to
security reasons.
Pointer page search
If you carry a URL with two parts, separated by a space, it indicates that
a pointer search will be done. This is commonly used for dynamicallygenerated web pages where the target URL is not known.
The first portion is the pointer URL and the second part is the pointer
search string, as shown here:
pointerurl pointersearch
If Digital Atmosphere encounters this, it will go to the URL indicated by
“pointerurl”, then will search that page for any text fragment containing
“pointersearch”, obtain the location where this occurs within quotation
marks, and add this to the pointer URL to construct a new URL.
For example, this URL:
http://www.spc.noaa.gov/products/outlook/day1otlk.html
/products/outlook/archive/
is used by Digital Atmosphere to obtain convective outlooks. Obtaining
the first page, we open it and find this HTML fragment:
CLICK TO GET <a href=”/products/outlook/archive/2006/
KWNSPTSDY1_200612301300.txt”>WUUS01 PTSDY1</a> PROD
Digital Atmosphere extracts the “/products/outlook/archive/2006/
KWNSPTSDY1_200612301300.txt” part and appends it to the pointer
URL to get the final URL of:
46
Chapter Five / DATA MENU
http://www.spc.noaa.gov/products/outlook/archive/2006/
KWNSPTSDY1_200612301300.txt
Solving access problems. Digital Atmosphere must have access to a true
Internet connection in order to retrieve data. If for some reason you can’t
retrieve data through Digital Atmosphere, all is not lost. You can still use
your Internet browser to get products, then save them to your Digital
Atmosphere data directory, which is most users have had to do up until
1997!
Technical tip
Do you want to swap data product lists with other users? No problem;
we’ve made it easy. Simply give them a copy of your DIGATMOS.SLZ
file (it’s in your Digital Atmosphere directory). If they replace their DIGATMOS.SLZ file with yours, they’ll get your list of data products. We
sometimes offer updated DIGATMOS.SLZ files on our web site to give
you the latest set of data products.
Password security
Note that you can set a password privately by using the DIGATMOS.
PWD file (if there isn’t one, you may create it). This will make your
scripts secure and prevent passwords from showing up in the status
windows. This file must be located in the Digital Atmosphere directory.
Make entries as follows:
token=value
So if you have a login for your blog site, you might have something like
this in your DIGATMOS.PWD file:
myusername=joeblow
mypassword=12341234
When Digital Atmosphere encounters %%something%% in your URL, it
will replace it with the values you defined in DIGATMOS.PWD. Thus, in
the example above %%myusername%% would get replaced with joeblow,
and %%mypassword%% would get replaced with 12341234.
Update Internet table
Causes Digital Atmosphere to update itself with the most current Internet resource table from Weather Graphics. As of May 2007 this command does not work.
47
Chapter Five / DATA MENU
Data plots
Overlays data plots on the workchart.
Symbols shown conform to standard international convention. A
weather type of double solidus (//) indicates unknown precipitation as
reported in an automated METAR observation.
The meteorological level at which the data applies is dictated by the
Level setting on the Toolbar.
Custom data plots
Plots data on the workchart from a custom data file.
Note that whether a point of data is plotted DOES depend on the Preferences > Station Plots > Plot All Stations settings. To see absolutely all
datapoints, check this setting so all points are plotted, otherwise they will
be plotted in a way that minimizes overlapping.
A custom data file comprises a package of data that can be readily imported into Digital Atmosphere. You can create this data by any means
(using third-party programs).
The custom data field must always be placed in the file CUSTOM.DAT in
your Digital Atmosphere directory. It should be structured according to
the following example:
THUNDERSTORM DAYS (ALL MONTHS)
US AL:Bir 722280 33.567 -86.750
US AL:Oza 722269 31.283 -85.717
US AL:Hun 723230 34.650 -86.767
US AL:Mon 722265 32.383 -86.367
57
73
54
56
*
*
*
*
Here is a breakdown of each row and column:
Row 1
A header that will be used by Digital Atmosphere
to title the field
Row 2+
Data, as explained below in “data row format”
48
Chapter Five / DATA MENU
Data row format:
Col Contents
1-19 Not used. User may put location names here.
21-29 Latitude (degrees and thousandths)
31-39 Longitude (degrees and thousandths)
41-49 Primary data value
51-59 Secondary data value
- Southern hemisphere uses negative latitude
- Western hemisphere uses negative longitude
Ingesting a scalar field
When a simple scalar field (such as temperature, pressure, wind speed,
etc) is imported, the value must be placed in the primary data value field,
and the secondary data value field must contain an asterisk character: *.
Ingesting a vector field
If a numerical value is detected in the secondary data value field, Digital
Atmosphere will assume a vector field (such as wind u/v component) is
being ingested. The primary data value must assume a direction relative to true north (such as wind direction), and the secondary data value
must assume a magnitude (such as wind speed). When vector data mode
is being used, analysis calculations will use wind barb symbology to
represent data elements.
Table plots
Plots weather data from tables generated by third-party sources. Various
weather agencies, such as the Australian weather service, generate lists
of rainfall and temperature data. Digital Atmosphere has the capability
to import these based on the settings in the table template file (DIGATMOS.TPL in your Digital Atmosphere directory). A list of valid data
types will be shown only if the most recent import operation has found
data defined in the template file .
In the data file itself, any table containing weather data should have each
line of data corresponding to a geographical point, and must have a latitude, longitude, and anywhere from 1 to 50 data values for that point.
Template file entries:
#DEF starts the definition of a table. Give the table a name in T1; this
name is used for display purposes.
Chapter Five / DATA MENU
49
#LEG defines a line that can be used as a legend for the table (such as a
line that contains a date or valid time). Specify a keyword that is to
be located on the line. When encountered, it will be used in legends
#FLG is a scrap of text which, when encountered during importing, tells
Digital Atmosphere that it is about to encounter a table. This flag
must be encountered before any data can be imported. Specify the
scrap of text in T1.
#BEG is a scrap of text which, when encountered during importing, tells
Digital Atmosphere that a data table is starting right now. Put the
scrap in T1, and define the column where it must be seen in V1 and
the length of the scrap in V2. Data import always ends on an empty
line.
#DAT is specified for each data element that appears on a line. Give the
field a name in T1 (this is used only for display purposes). Define the
beginning column of the data in V1 and the length of the data in V2.
#MIS specifies characters that are used to denote missing data.
#LAT specifies where the latitude (decimal only) is found. Put the column start position in V1 and the field length in V2.
#LON is similar to #LAT but for longitude.
Example:
#DEF
#LEG
#FLG
#BEG
#MIS
#LAT
#LON
#DAT
#DAT
#DAT
#DAT
#DAT
#DAT
#DAT
- - Australian rainfall data
- - Observations
- - IDCLRD00001
66 2 :- - +
67 6
60 6
1 10 Date
12 6 Stn_num
23 40 Name
81 5 Precipitation_mm
87 1 PP
89 1 DC
91 1 OF
Television plots
50
Chapter Five / DATA MENU
Plots large-font displays of temperatures. The word “television” does not
mean that they are for television use, but rather that the temperatures are
displayed in a format that looks a lot like that seen on TV.
Very important! Before you can use this option successfully, you will
need to configure the DIGATMOS.PLL file correctly with any text editor
(such as Windows Notepad).
DIGATMOS.PLL is in your Digital Atmosphere directory. The structure
is as follows, where the first column is the ICAO identifier (for METAR
data) and the second column is the WMO station identifier (for SYNOP
data). The third column is the name of the station (city) as it should appear on your weather map.
KORD
KSEA
KSFO
KLAX
KBOI
KABQ
72530
72793
72494
72295
72681
72365
Chicago
Seattle
San Francisco
Los Angeles
Boise
Albuquerque
The font used by this plot type is specified in the style definition for your
workchart.
Warnings
Plots warnings that were imported from the most recent data import.
NOTICE
This module has not been working since 2001 due to development work on other parts of this software. We will re-enable it as
soon as practical.
Frontal depiction
This option allows plotting of georeferenced fronts, highs, and lows. The
features are georeferenced, therefore you can always plot them later even
if you zoom in or quit the program. You will lose your frontal depictions
if you again create a depiction or if you import original ASUS1 data.
Chapter Five / DATA MENU
51
An important word about frontal positions!
Computers cannot be used to automatically “create” frontal positions!
There are only two possible ways of displaying frontal positions: through
an analysis entered by you (see Toolbox section under Fronts) and
through weather bulletins created from human-derived frontal positions.
The ability for a computer to independently analyze for fronts does not
exist except perhaps in experimental form, and it is a poor method for
analyzing the subtleties and complexities of the atmosphere. One of the
reasons Digital Atmosphere was created is to help forecasters analyze
all aspects of the atmosphere rather than provide a shortcut to finding
fronts. Even if you use frontal positions obtained by someone else, you
still may get contradictory positions that may not work well with your
own analysis. A good cautionary essay on centralized analysis charts
can be found in “A Case for Detailed Surface Analysis”, by Doswell and
Sanders, at http://www.nssl.noaa.gov/~doswell/sfcanal/surface_analysis.
html .
Using original sources of data
Raw sources of data consist only of the ASUS1 KWBC numerical text
bulletin produced by the National Weather Service. This bulletin must
have been imported and found with its headers intact before it can be
plotted. The bulletin is usually found on Unidata servers under data/surface/front or a similar directory, or by the bulletin header name itself. A
couple of links are provided in Digital Atmosphere’s Internet > Retrieve
Data window, which should be used if possible. Note that the presence
of this bulletin does not imply thatMaking your own maps. By using the
Create or Append options above, you can create your own frontal depiction maps. To pull up the drawing commands, simply right-click on the
map and choose “frontal depiction tools”. You will see a menu like the
one below.
Sample of ASUS bulletin
If your frontal depiction does not deliver the correct results, you can go
in and hand edit this bulletin in QUEUE.FRT using any text editor.
515
ASUS1 KWBC 111919
CODSUS
VALID 111118Z
HIGHS 1030 41165 1030 38154 1027 45135 1025 31138 1035
6143 1022 3730 1033
5589 1030 6286
LOWS 979 46169 1017 38139 997 4257 997 3865 980 63172
987 66144 998 75113
1005 36102 1013 35112 998 7168
OCFNT WK 46169 46170 45171
COLD WK 45171 44170 42169 40169 40169 39168
52
Chapter Five / DATA MENU
WARM WK 45171 46172 47174 46178
COLD WK 38139 36140 33144 31149 31153
STNRY WK 4418 4525 4531 4741 4748 4653 4457 4160
TROF 4257 4151 3647 3145 2845
COLD WK 3865 3763 3463 3164 2869 2673 2478 2384
COLD WK 66144 64142 62142 59142 53145 48149 45153 42156
40162
STNRY WK 55116 59117 62121 65129 67138 69144 69155 68167
68176
STNRY WK 6291 6395 64101 64110 63117
OCFNT WK 76114 77111 78104 7895 7786 7680
COLD WK 36102 34103 32104 31106
TROF 36101 35101 32100 30101 28102 26102
COLD WK 7680 7574 7168 6866 6565 6365 5969 5672
STNRY WK 37103 38104 40106 40109 41111 43114 44117
WARM WK 38101 3999 3897 3795 3791
TROF 48112 51112 55112
TROF 5294 5095 4896 4498 4199
TROF 5571 5270 4968 4767
NNNN
Fleetcode
Imports FLEETCODE format data. It produces graphics like those shown
below. All fronts and isobars are plotted as spline curves, and due to the
limited resolution of the data they may not display optimally. There is no
way to alter how a spline plots except to change the scale of the workchart.
To the author’s knowledge, FLEETCODE data is produced only for
Europe. It comes in under the ASXX21 Family of Services header. One
source ready for use is provided in the default Internet tables.
Chapter Five / DATA MENU
53
Sferics
This option plots sferics (lightning strike) data from SFLOC data if it has
been downloaded. Currently this data is available only for the European
region. Using this information, Digital Atmosphere will plot lightning
strikes to the nearest half-degree (about 40 km resolution).
Europe imposes restrictions on the commercial use of lightning data
and recovers its cost through end-user charges. Though SFLOC data is
publically available, you must contact the data supplier to inquire about
your status if you are using the information on a commercial basis. The
responsibility rests with the user to ensure that they are not violating any
rules or national regulations. The SFUK bulletin’s point of contact is the
British Met Office (http://www.meto.gov.uk / tel. +44 (0)1392 885680).
Europe’s primary lightning network consists of five stations in the UK,
one in Cyprus, and one in Gibraltar. The stations listen for static and use
triangulation of the time delay to pinpoint the location. This is encoded
to the nearest half-degree, yielding a resolution of about 40 km. The commonly-available British bulletin (SFUK) has a domain of 40W to 40E and
30N to 70N. The time period for each bulletin is 30 minutes, and a new
bulletin is generated every 30 minutes. The SFUK is based on the WMO
FM 32-I SFLOC code form but is adapted under a national variation. The
British Met Office does have a new system online that can pinpoint lightning within 100 meters, however this data is not publically distributed.
Contact the Met Office if you need access to this data.
54
Chapter Five / DATA MENU
Convective outlooks
This option plots convective outlooks (thunderstorm forecasts) issued by
the National Weather Service’s Storm Prediction Center (SPC) in Norman, Oklahoma. These are centralized human-produced forecasts issued
several times a day, and are used to help provide guidance to National
Weather Service forecast offices. They are also used frequently by storm
chasers, pilots, and hobbyists.
To use this option, you must have imported a convective outlook as part
of your raw data set or from one of the choices in Internet > .
Advanced users can modify the color scheme by changing the contents
of the file DIGATMOS.CCC in the Digital Atmosphere directory using a
standard text editor such as Notepad (never use a word processor such
as Microsoft Word or you will corrupt the file). This file contains self-explanatory instructions for modifying the hexadecimal numbers used to
determine colors of the various threat boundaries.
If there are any problems ingesting a bulletin, the problem is most likely
an error in the composition of the bulletin. It is not necessary for the
header to be intact, but the “STORM PREDICTION CENTER” title must
appear in the bulletin along with the convective outlook type, valid
times, and standard bounding locations of each threat area.
Sample of convective outlook:
Chapter Five / DATA MENU
55
492
ACUS2 KMKC 041803
SWODY2
MKC AC 041801
STORM PREDICTION CENTER...NWS/NCEP...NORMAN OK
DAY 2 CONVECTIVE OUTLOOK...REF AWIPS GRAPHIC PGWI47
KWBC.
VALID 051200Z - 061200Z
THERE IS A SLGT RISK OF SVR TSTMS TO THE RIGHT OF A LINE
FROM 40 ESE P07 BGS CDS 55 NE AMA EHA LAA GLD HLC SLN
CNU SGF JBR MKL TUP LUL 35 SE HUM ...CONT... 30 S CRP
25 S LRD.
GEN TSTMS ARE FCST TO THE RIGHT OF A LINE FROM 30 ENE
ELO 50 NW EAU DBQ HUF LUK HTS TRI 65 S TYS ATL ABY
AQQ ...CONT... 40 SW DMN 50 WNW ONM GUP 60 ESE PGA
U17 VEL 45 NNE CAG CYS SNY ANW JMS 70 NNE DVL.
MODELS INDICATE UPPER CLOSED LOW OVER NORTHERN BAJA
WILL EVOLVE INTO A SHORT WAVE TROUGH AND ACCELERATE
EASTWARD INTO THE SOUTHERN PLAINS SUNDAY/SUNDAY NIGHT.
THIS IS IN RESPONSE TO VIGOROUS NORTHERN BRANCH SHORT
WAVE TROUGH NOW OVER THE PACIFIC NORTHWEST... AND
PROGGED TO CONTINUE TO DIG INTO THE CENTRAL ROCKIES
BEFORE SHIFTING EASTWARD INTO THE CENTRAL PLAINS.
AS THESE SYSTEMS INTERACT...AND UPSTREAM SHORT WAVE
DIGS ACROSS THE NORTHERN PACIFIC COAST INTO THE GREAT
BASIN...MODELS INDICATE EVOLUTION OF LONG WAVE
Troubleshoot data
This produces a panel that shows what types of data have been found in
Digital Atmosphere. You can use it to determine whether Digital Atmosphere has correctly downloaded and imported various types of data.
56
Chapter Five / DATA MENU
Troubleshoot Data panel.
Hurricane tracks
This option plots hurricane tracks from the National Hurricane Center
(NHC) or Joint Typhoon Warning Center (JTWC) forecast/advisory bulletin (WTNT, WTPZ, WTPN, WTIO, and WTXS). This shows the current and forecast location of hurricanes, typhoons, and tropical storms.
A track connecting each forecast point is created using a mathematical
spline.
The source bulletin needs to be the NHC forecast/advisory or JTWC
warning with coordinates and forecast positions. They can be automatically downloaded via the Internet > Retrieve panel. If there is any
problem with a bulletin not plotting, it may be due to an error in the way
the bulletin is written. Decoding these bulletins into machine-readable
format is not always error-free.
Currently there is no support for bulletins from other global hurricane
centers.
Technical information
The import module locates hurricane bulletins based on the National
Hurricane Center header (KNHC) or the Joint Typhoon Warning Center
Chapter Five / DATA MENU
57
header, and saves them to the queue.hur holding file. When Data > Hurricane Tracks is requested, the hurricane module reads queue.hur and
displays any available bulletins. Here is a sample of a hurricane track
bulletin:
WTNT22 KNHC 060837
TCMAT2
TROPICAL DEPRESSION LARRY FORECAST/ADVISORY NUMBER 19
NWS TPC/NATIONAL HURRICANE CENTER MIAMI FL AL172003
0900Z MON OCT 06 2003
TROPICAL DEPRESSION CENTER LOCATED NEAR 17.3N 94.0W AT
06/0900Z
POSITION ACCURATE WITHIN 50 NM
PRESENT MOVEMENT TOWARD THE SOUTH-SOUTHWEST OR 200
DEGREES AT 3 KT
ESTIMATED MINIMUM CENTRAL PRESSURE 1005 MB
MAX SUSTAINED WINDS 20 KT WITH GUSTS TO 25 KT...
DISSIPATING
12 FT SEAS.. 0NE 0SE 0SW 100NW.
WINDS AND SEAS VARY GREATLY IN EACH QUADRANT. RADII
IN NAUTICAL MILES ARE THE LARGEST RADII EXPECTED
ANYWHERE IN THAT QUADRANT.
REPEAT...CENTER LOCATED NEAR 17.3N 94.0W AT 06/0900Z
AT 06/0600Z CENTER WAS LOCATED NEAR 17.5N 93.9W
FORECAST VALID 06/1800Z 16.9N 94.1W...INLAND...
DISSIPATING
MAX WIND 20 KT...GUSTS 25 KT.
FORECAST VALID 07/0600Z...DISSIPATED
REQUEST FOR 3 HOURLY SHIP REPORTS WITHIN 300 MILES OF
17.3N 94.0W
THIS IS THE LAST FORECAST/ADVISORY ISSUED BY THE
NATIONAL HURRICANE CENTER ON LARRY UNLESS REGENERATION
OCCURS.
FORECASTER PASCH
Troubleshoot data
This interface shows at a glance which datasets are available from the
most recent import operation. If a dataset is shown as empty, it cannot
be plotted. Note that some data may be shown which does not really
exist, due to wide variations in coding formats. You should consult this
to check on any problems before reporting a problem about data not
plotting. If no data is shown, check your source, the URL it came from (if
any), and make sure the system clock settings are correct on your computer since some products are time-dependent.
58
59
CHAPTER 6
Analysis menu
The Analysis commands comprise a powerful tool which can display isobars, isotherms, wind grids, and much more. All imported weather data is
examined, objectively analyzed, filtered and smoothed, and then displayed
graphically.
Beginning with the Workstation series of Digital Atmosphere in 2004, users
can now construct their own analysis fields and displays through a highly
sophisticated scripting language. Users can also modify the predefined
analysis commands available in the Analysis Menu by using Analysis > Edit
analysis scripts or by directly editing digatmos.mnu.
For more information see the appendix under Analysis scripting.
Edit analysis scripts
This opens up an editor that shows the script command assigned to each
analysis option in the Analysis dropdown menu. This simply edits the
digatmos.mnu file.
For information on how to devise an analysis script command, see Appendix > Analysis Scripting .
How analysis works
To fully understand how the analysis routines work, you have to know
a little bit about the theory behind them. All meteorological fields can be
described as a series of waves. For example, assume that at a certain time
the coldest spot in the country is International Falls, MN at 12°F and the
hottest spot is Death Valley, CA at 96°F. Draw a long line on your map
that passes through both of those points. If you graph the temperatures
along this line and gather data from cities along the line, your temperature graph will show unique undulations, rises, and falls. These are
mathematical waves in the temperature field.
Assume that you find that the temperature 200 miles on each side of
Death Valley (along the line) is 94 deg F. You could then assume most of
the southwest United States is hot. The temperature graph would show
60
Chapter Six / ANALYSIS MENU
a gradual rise towards Death Valley and a gradual fall as you move
away. But what if the temperature 200 miles on each side is instead 52
deg F? With Death Valley being at 96, this would appear on your graph
as a short upward “spike” at the location corresponding to Death Valley.
These are two unique mathematical waves — the first one (with gradual
rises and falls) means that the temperature field is composed of large
or long wavelength features. The latter situation (with sharp spikes and
dips) means that the temperature field is composed of short or small
wavelength features. As you can see, gradual changes mean that the
meteorological field has long wavelength characteristics, and sharp localized changes imply small wavelength features.
Digital Atmosphere uses a 30 x 30 mesh (grid) to sample these conditions. The mesh is like lines that are drawn across the map, 30 across
and 30 down, to sample the wave structure that is present in the type of
analysis you pick. Using equally-spaced grid points is the easiest way to
perform computerized analysis calculations. Digital Atmosphere must
find where reporting stations are within the grid, and try to map the values to that grid, taking into consideration how far the reporting station is
from a gridpoint and figuring out what to do with gridpoints that aren’t
assigned any data. This is what takes up the majority of processing time.
So why not just map values to the grids and interpolate between all the
points? Digital Atmosphere’s nearest neighbor technique does something
like this. It maps data to gridpoints and fills in unassigned gridpoints
using the nearest data value, a process known as expansion. However, if
the temperature in San Francisco is 52 and in Los Angeles is 85 (and assuming we have NO other data), the analyzed field anywhere in California will show either 52 or 85 degrees! This is clearly not correct, so after
expansion, Digital Atmosphere runs a smoothing algorithm. Smoothers
“smooth” out the mesh by changing the value at each gridpoint to an
average of itself and its neighbors. Unfortunately, this can dampen out
features in the field. Too much smoothing will remove all of the short
wavelength features.
A better way to do this is to use the Weighted, Barnes, or Cressman
techniques. These techniques look at each gridpoint, find where it corresponds to on the earth, and from that location it looks at the values
of the stations around it and figures out a carefully averaged value best
representing what the value at that gridpoint probably is. The Barnes
algorithm goes a step further by going back and seeing how incorrect
its mesh turned out to be, then adjusting that to produce a final analysis. The Cressman algorithm does the same thing, but it also begins its
analysis using values at stations over a wide area, then gradually tightens up its analysis, running corrections and using values at stations over
61
CHAPTER 7
Radar menu
This dropdown menu provides direct access to United States NEXRAD
(WSR-88D) Doppler radar imagery. It accesses Level III high-resolution data
directly from sites that carry the data feed. Because there are over 100 radar
sites and 31 products at each site that can be used operationally, Digital Atmosphere has implemented a completely separate, unique system for retrieving data. The Data > Retrieve interface used for “normal” weather data is not
used. Rather, all choices for obtaining data are built into the radar menu.
To use the radar menu, you simply (1) make sure the station you want is set
(with Set NEXRAD Station or Quick Pick); and (2) click on the product you
want. The image will be downloaded (taking anywhere from 1 to 30 seconds)
and will be displayed immediately on the current workchart.
Special note about choosing multiple stations
Digital Atmosphere can only access a handful of stations at a time. It cannot
access all stations in the U.S., because currently no server provides current
data combined in one file, and accessing each file individually would take
several minutes of time. Digital Atmosphere is also intended to be a tool to
view local storms and phenomena rather than to build national mosaics,
which are readily available on the Internet from countless sources. If you
select two or more stations, polygons created by radar products may overlap;
Digital Atmosphere does not yet have a function for prioritizing polygons
based on proximity to a radar.
Setting and overriding radar access URLs
Users are able to change URLs corresponding to the desired products. This
is done by editing the digatmos.rad file. Within this file you construct a
template for retrieving the NIDS Level III radar file. Only the URLs in the
“Default” section are used under normal circumstances. However you can
override them by creating new sections (which contain a title that starts with
an equal sign). To implement any radar access source, set the “Preferred
source” in Set NEXRAD Station to something besides Default. If the product
you request cannot be found in the override, the one in the default section
will be used.
Setting and overriding color schemes
Likewise, users are able to set and override color schemes. To do this, simply edit the digatmos.nex file. To implement any color scheme, go to Set
NEXRAD Station and choose something besides the default color scheme.
Color schemes for annotations, storm tracks, hail, mesocyclones, and so
62
Chapter Seven / RADAR MENU
forth, are handled in the map’s color table (you may either edit this in File >
Preferences > Colors or by directly editing any file in the /styles directory).
Translucency
Radar echoes are drawn using translucent polygons. For best results, make
sure your basemap is as bright or as dark as possible. Before plotting radar
echoes, Digital Atmosphere will examine your style file for the background
color (bas, in Preferences > Styles) and use the appropriate translucency
algorithm based on whether it is closer to white or black. If you get unusual
results, change your background color or regenerate the map, preferably
towards the white or dark end of the spectrum.
Mosaicing
When plotting radar imagery for multiple sites, an important problem arises
when Digital Atmosphere has to decide which radar’s data to use for a
particular location. The rule is that Digital Atmosphere plots the pixel for
the nearest radar site. The exception is when raster images (such as echo
tops, composite reflectivity, etc) are displayed; in this case the pixel with the
highest detected level is used (this raster rule took effect with Equinox v1.05,
1/16/07, and later versions).
Theory of operation
Data is selected with the digatmos.rad file. Data is imported into queue.nid,
then is plotted. The digatmos.nxc file is used to define how fields are plotted,
and digatmos.nex defines the colors. Since the station identifier is not contained within the data blocks, the NEXRAD station table (digatmos.nxa) is
consulted (this table is built from digatmos.stn whenever doing a Recompile
Tables command). For advanced users who are customizing access URLs, a
list of valid product codes for Internet retrieval can be found at: http://www.
nws.noaa.gov/tg/radfiles.html . To get historical NEXRAD data, visit http://
has.ncdc.noaa.gov/plclimprod/plsql/HAS.FileAppSelect?datasetname=7000 .
Level II data is at http://has.ncdc.noaa.gov/plclimprod/plsql/HAS.FileAppSe
lect?datasetname=6500 but is not compatible with Digital Atmosphere at this
time.
View radar data
This function will display any radar data that has been recently imported. You can use it to redisplay existing data without causing the system
to download new radar data.
Chapter Seven / RADAR MENU
63
Load radar data
Rather than accessing new radar data through the Internet, you may
load the data from an existing file. Any NEXRAD data in this file will be
imported and automatically displayed. You may save data to be loaded
and viewed again at any time in the future by using the “Save radar data
to file” command.
Save radar data
Saves any imported radar data to a file of your choice. You may then
view it again later by using the “Load radar data from file” option.
Advanced users: This basically copies the queue.nid holding pen to your
desired location.
Import radar data
This is a powerful interface that allows any graphical radar image to be
georeferenced and mapped into Digital Atmosphere. This gives tremendous flexibility with importing radar images from international weather
service agencies which withhold raw data. The list of available radar
resources is kept in the file digatmos.rdy and may be edited.
See the appendix section Importing Radar Data for information on how
this command works.
64
Chapter Seven / RADAR MENU
Imported radar data from Canada for Alberta and Saskatchewan.
Set NEXRAD station
Before Digital Atmosphere can access NEXRAD data from the Internet, it
must know which stations you want to look at. A map will be displayed
and you will be able to select the sites for which data should be accessed.
Special note: Please see “Special Note About Choosing Multiple Stations”
in the radar introduction.
Quick pick
Allows you to quickly set a new station by typing its identifier into an
entry box. This is designed for advanced users. Always enter the threeletter identifier, such as FWS, MHX, or CCX. If there are multiple stations, separate them with a space.
If you do not know what to enter or how to use this box, use the Set
NEXRAD Station interface instead.
Special note: Please see “Special Note About Choosing Multiple Stations”
in the radar introduction.
Chapter Seven / RADAR MENU
65
Set date-time
The Radar Time Select module allows fast, efficient display of historical WSR-88D (American) radar information, often going back to 2 or 3
weeks. It depends on the availability of stored radar information from
participating sites (as of May 2007 only Texas A&M University does this).
When this menu is chosen you will see the following panel:
If “Use current (real-time) radar data” is enabled, Digital Atmosphere
will function normally and no archive operations will be conducted.
If it is disabled, then Digital Atmosphere will use the date and time
selected to find archived radar information online whenever a product is
chosen in the Radar menu. The Preferences > General > Radar Source
dropdown must be set to a designated radar archive source (typically
Texas A&M University). We have configured digatmos.rad to work
properly with this data source.
Base reflectivity
Shows the most common radar product: 124 nm radar reflectivity at the
lowest (0.5 deg) scan. Radar echoes are shown as color-coded polygons
that may be one of 15 colors. If you need to see a scan over a wider area
or at different elevations, use the expanded Reflectivity menu instead to
select a more specialized reflectivity product.
66
Chapter Seven / RADAR MENU
Reflectivity
Shows radar echoes in any of several formats. Reflectivity is simply a
measure of power returned to the radar in decibels (dBZ).
0.5 deg
Shows reflectivity from scan elevation 1, tilted 0.5 deg from the ground.
This is exactly the same as “base reflectivity” shown in the radar main
menu, so you should not have to select this item.
1.5 deg
Shows reflectivity from scan elevation 2, tilted 1.5 deg from the ground.
2.4 deg
Shows reflectivity from scan elevation 3, tilted 2.4 deg from the ground.
3.4 deg
Shows reflectivity from scan elevation 4, tilted 3.4 deg from the ground.
Extended (248 nm) 0.5 deg
This is similar to the 0.5 deg reflectivity scan, but shows it over a wider
area (248 nm). This comes at the cost of degraded resolution (1.1 nm
instead of 0.54 nm).
Composite
Composite reflectivity blends all available elevations, showing the
highest reflectivity in all elevations above a given point on Earth. This
is useful for showing all echoes returned by the radar, regardless of
scan elevation. However this masks important features useful for severe weather forecasting, such as hook echoes and reflectivity gradients
which are seen only on base slices. Composite reflectivity can give false
impressions of precipitation at the surface from suspended precipitation,
as in storm anvils.
Extended (248 nm) composite
This is similar to the composite product but reaches over a wider area:
248 nm instead of 124 nm.
Chapter Seven / RADAR MENU
67
Velocity
Shows radial velocity (to and from the radar site) in any of several formats. It is expressed in knots. Positive velocity is always motion away
from the radar, while negative velocity is always motion toward the radar. As a mnemonic it is useful to link positive (“typical”) values to that
of energy being transmitted from the radar (“typical” radar energy), and
negative values as being associated with energy coming back the other
way.
0.5 deg
Shows velocity from scan elevation 1, tilted 0.5 deg from the ground.
1.5 deg
Shows velocity from scan elevation 2, tilted 1.5 deg from the ground.
2.4 deg
Shows velocity from scan elevation 3, tilted 2.4 deg from the ground.
3.4 deg
Shows velocity from scan elevation 4, tilted 3.4 deg from the ground.
Short 32 nm (0.5 deg)
Surprisingly, the radar generates a close-range velocity product with a
gate resolution of only 790 feet! You can view this product here for looking at storms up close.
SRM 0.5 deg
Shows storm-relative mean radial velocity from scan elevation 1, tilted
0.5 deg from the ground. The storm-relative mean radial velocity (SRM)
product is essentially the same as base velocity, but removes the component of the storm’s motion, allowing velocity signatures to be more
accurately analyzed. This product is preferable to the standard velocity
products for storm forecasting. The source for the storm motion component is usually the average motion of all storms detected by the radar’s
SCIT storm tracking algorithm.
SRM 1.5 deg
Shows storm-relative mean radial velocity from scan elevation 2, tilted
1.5 deg from the ground.
SRM 2.4 deg
Shows storm-relative mean radial velocity from scan elevation 3, tilted
2.4 deg from the ground.
68
Chapter Seven / RADAR MENU
SRM 3.4 deg
Shows storm-relative mean radial velocity from scan elevation 4, tilted
3.4 deg from the ground.
Spectrum width
Spectrum width is a measure of the variance in velocity within each bin.
It is actually generated from a pulse pair algorithm, rather than being
computed directly from velocity data. The product is generated using 7
levels, with a maximum possible width of 20 kt. Anything beyond 20 kt
is truncated by the radar unit.
The spectrum width product it is the basis for the WSR-88D turbulence
products. The application of the product to severe thunderstorm forecasting is not known, but it may be a secondary indicator of small tornadoes, landspouts, and gustnadoes.
32 nm
Uses the close-range radius of 32 nm at 0.13 nm resolution.
124 nm
Uses the standard radius of 124 nm at 0.54 nm resolution.
Derived products
A number of derived products are generated from the base products of
reflectivity, velocity, and spectrum width.
Echo tops (ET)
This displays the highest altitude at which a radar echo exceeds 18.5
dBZ. It is computed to the nearest 5,000 ft up to a maximum height of
70,000 ft. The standard coverage radius is 124 nm with a resolution of 2.2
nm.
Vertically integrated liquid (VIL)
Sums the reflectivities above a bin location to provide a measure of the
total water load above a given location in kilograms per square meter.
It has a direct correlation to severe weather, hail, and flood potential,
and is most useful in assessing in an extremely short time which storm
cells have the greatest significance. Generally values above 40 kg/m^2
are associated with severe weather. The maximum possible displayable
Chapter Seven / RADAR MENU
69
value is 80 kg/m^2. The product has a coverage radius of 124 nm with a
resolution of 2.2 nm.
Severe weather probability (SWP)
Displays the probability of severe weather, based solely on the VIL
algorithm. This product is of extremely limited use for severe weather
forecasting and must be used with caution. Values are expressed as a
percentage from 0 to 100. The product has a coverage radius of 124 nm
with a resolution of 2.2 nm.
Mesocyclone
Shear couplets are resolved vertically and with time to determine the existence of a storm mesocyclone. If one is present, it is displayed as a red
circle. The radius of the circle equals the reported radius of the mesocyclone. Mesocyclones are resolved only within 124 nm of the radar.
Hail index
The radar system contains a severe hail index (SHI) algorithm that relates
the 45 dBZ level to the -20C height. When the computed probability for
hail for each storm cell exceeds a predetermined criteria, it will be displayed as a green isosceles triangle. If the triangle is small, there is a 30%
probability of hail (50% if it is filled). If it is large, there is a 30% probability of severe hail (50% if it is filled). The maximum expected hail size
(MESH) is displayed in the middle of the symbol, rounded to the nearest
whole inch; if less than one inch an asterisk shows. The hail index has a
radius of coverage of 124 nm from the radar.
Tornado (TVS)
This product uses the Tornado Detection Algorithm (TDA) to resolve
velocity signatures that suggest a tornado. The tornado signature is
shown as a red filled inverted isosceles triangle. An ETVS may also be
displayed, but the NIDS code does not provide for differenting TVS
from ETVS signatures, therefore they will appear the same. The radius of
coverage is 124 nm, but is rarely detected outside of 60 nm since the algorithm is unable to sample the lower portions of the storm at long ranges.
1-hour precipitation (OHP)
Radar reflectivity is summed with time to estimate the rainfall accumulation in the coverage area. This product provides an estimate of how
much rain fell during the past hour. The highest reportable total is 8
inches. The radius of coverage is 124 nm with a resolution of 1.1 nm.
3-hour precipitation (THP)
Radar reflectivity is summed with time to estimate the rainfall accumulation in the coverage area. This product provides an estimate of how
70
much rain fell during the past three hours. The highest reportable total is
8 inches. The radius of coverage is 124 nm with a resolution of 1.1 nm.
Storm total precipitation (STP)
Radar reflectivity is summed with time to estimate the rainfall accumulation in the coverage area. This product provides an estimate of how
much rain fell during the past hour. The highest reportable total is 15
inches. The radius of coverage is 124 nm with a resolution of 1.1 nm.
Storm tracking information (STI)
This product shows information provided by the radar’s Storm Cell
Interpretation and Tracking (SCIT) algorithm. It shows past, current, and
future location of identified storm cells. Past locations are shown for each
volume scan (this is an interval of 5 minutes in VCP11 and 6 minutes
in VCP21). Future locations are identified at 15, 30, 45, and 60 minutes
in the future; though these intervals are customizable by the radar site
operator. Each storm has a unique ID of two characters ranging from A0
to Z9 and is recycled when past A0; when no storms have occurred in a
certain number of volume scans the ID is reset to A0. The storm data has
a radius of coverage of 248 nm.
Clutter control filter (CFC)
Shows the clutter filter notch and bypass maps as a radial image. The
levels are coded as follows: 0=disable filter; 1=no clutter filter; 2,5=low
clutter filter; 3,6=medium clutter filter; 4,7=high clutter filter. Codes 1 to 4
specify the map is bypassed by CTRL, while 5-7 force the filter to operate. The product has a radius of coverage of 124 nm with a resolution of 1
km and 1.4 deg azimuth.
71
CHAPTER 8
Climatology menu
Digital Atmosphere maintains a database of numerous monthly weather
parameters for over 2,000 weather stations across the world. Most of this
archive spans a 30-year time period. This data can be viewed on a graph or
plotted on your maps.
Keep in mind that, as with most other meteorological data, the results may
be affected by the observing station’s elevation or proximity to the ocean.
This is why you may see significant variations in temperature along a coastal
region, among other effects.
Extract data
If you want to plot or analyze climatological data, this is where to start.
Extract Data will allow you to select a category and timeframe of climatological data. Digital Atmosphere will then create a custom data field,
saving it into CUSTOM.DAT in your Digital Atmosphere directory. This
can then be immediately plotted (with Graphics, Plot, Custom Data) or
analyzed (with Analyze, Custom Data Field). You can even import the
data into a spreadsheet or database program.
Graph
This option will let you graph the climatology for any of 2,000 stations
around the world. Simply enter a partial word or country digraph to
search for a station, or choose from the drop-down list.
What you’ll see is a graph of average high and low temperatures for each
month, as well as extreme high and low temperatures for each month.
They will be indicated in either degrees Fahrenheit or Celsius, depending on your choice of units in File, Preferences. At the bottom, you’ll see
average monthly precipitation totals (United States) or precipitation days
(elsewhere). The total height of a precipitation day bar is the total precipitation days during a given month. The part in gray is how many of
those days are composed of snow days, and the part in red is how many
are composed of thunderstorm days.
72
Chapter Eight / CLIMATOLOGY MENU
Hurricane tracks
Digital Atmosphere offers a database of historical hurricane tracks, taken
every six hours, for storms that occurred in the East Pacific and Atlantic basins from 1850 to 2002. The tracks will be displayed on the active
workchart.
Year. Use the range boxes to display data for a certain time period. To
display data for only one year, enter the same year in both boxes.
Line width. Enter a number here to control the width of the lines that
will be plotted. The recommended value of 4 should be used.
Plot storm name at origin. Plots a label containing the storm’s name at
the beginning of the track.
Plot date labels along track. Plots dates and times along the length of
each storm track.
Color code for wind speed. Changes the line color of the previous segment based on the sustained wind speed at that time. The values are:
Gray 0-34 kt (tropical depression); Black 35-63 kt (tropical storm); Green
64-83 kt (hurricane, Saffir Simpson 1); Yellow 84-95 kt (Saffir Simpson 2);
Red 96-113 kt (Saffir Simpson 3); Purple 114-134 kt (Saffir Simpson 4);
Blue 135+ kt (Saffir Simpson 5).
The source of the data is the NHC HURDAT tables at http://www.nhc.
noaa.gov/pastall.shtml . The tables are provided in Digital Atmosphere
verbatim, so users are free to swap out the existing tables with fresh
ones. The files are located in the /hurr directory.
Tornado tracks
Digital Atmosphere is equipped with a database of United States tornadoes that occurred between 1950 and 2002. These may be plotted on any
weather chart for reference purposes. It is important to note that due to
limitations in available data, the database carries only the start and end
location of a tornado track, and not the intermediate points. This means
that tracks will tend to be more accurate for short, slow-moving tornadoes, and much less accurate for long-tracked, fast-moving tornadoes.
This is a limitation in the way that tornado climatology is compiled by
Chapter Eight / CLIMATOLOGY MENU
73
the National Weather Service, and neither Digital Atmosphere nor its
authors have any control over this.
Year. Choose a range of years to display only data during these periods.
To display data for only one year, set both blanks to the same value.
Choose “all” if you want all years in the database to be displayed.
Month. Choose a range of months to display only data during these
periods. To display data for only one month, set both blanks to the
same value. Choose “all” if you want all months in the database to be
displayed.
Day. Choose a range of days to display only data during these periods.
To display data for only one day, set both blanks to the same value.
Choose “all” if you want all days in the database to be displayed.
Plot date labels at each track. Digital Atmosphere will plot a MM/DD/
YY label to the lower right of the beginning of each tornado track to
show which date the track occurred.
Color code. If checked, Digital Atmosphere will code a track black if
there were no reported injuries or fatalities, green if there were fatalities but no recorded deaths, and red if deaths occurred.
The source of data is the Storm Prediction Center historical tornado
archive, located at http://www.spc.noaa.gov/archive/tornadoes/ . To save
disk space, the data has been converted into a series of binary records
stored in digatmos.tor that have this structure: Year (signed 32-bit integer); month (unsigned 8-bit integer); day (unsigned 8-bit integer); hour
(unsigned 8-bit integer); minute (unsigned 8-bit integer); fujita rating,
of which very little data is available (unsigned 8-bit integer); fatalities
(signed 32-bit integer); injuries (signed 32-bit integer); latitude of beginning (4-byte float); longitude of beginning (4-byte float); latitude of end
(4-byte float); and longitude of end (4-byte float). Weather Graphics does
not object to users providing their own updated tornado statistics to
replace this one.
74
75
CHAPTER 9
GPS menu
Digital Atmosphere supports the use of Global Positioning System devices.
Your GPS unit will need to output data in NMEA format. What you do with
these instruments and how they can work with Digital Atmosphere is limited
only by your imagination. With the digital raster graphics supplied with
Digital Atmosphere, you can have moving maps suitable for storm chasing or even activities that don’t even have a meteorological purpose. We’ve
added the functionality, and it’s up to you how you’d like to use it.
Status
The topmost menu selection is not a menu choice but is instead a readout
of the GPS status. It will show one of the following:
Idle - The GPS device is not in use and has not been selected.
No comm port - You have chosen a COM port that does not exist, or use
of this port is blocked because it is being used by another application.
No communication - The port is open but the GPS is off or is not hooked
up.
Communication - A GPS has been sensed, but no data is being read.
NMEA - Valid data blocks have been read from the GPS device.
Start
Instructs Digital Atmosphere to use the COM port and begin reading GPS data. You will need to determine which COM port the GPS is
hooked up to. Refer to your system setup documentation or use trial and
error to find a valid port.
Stop
Instructs Digital Atmosphere to cease using the COM port and discontinue the reception of GPS data.
76
Chapter Nine / GPS MENU
Recenter map automatically
If enabled, Digital Atmosphere will redraw the weather basemap whenever the current position is within 20% of the screen’s edge. Leave this
unchecked if you want to have manual control of Digital Atmosphere at
all times.
Settings
In this panel, you set the baud rate, data bits, parity, and stop bits. Obtain
these from the setup menu in your GPS. It is recommended you use
4800 baud, 8 data bits, N parity (none), and 1 stop bit. The setting will be
remembered the next time you start Digital Atmosphere.
Other important information
Please be aware that the mouse cursor will act erratically if the GPS is
connected and running while Microsoft Windows is loading. This is an
extremely common problem in Windows due to deficiencies in the Plug
and Play drivers, and has been exhaustively documented by GPS users.
Try one of the most common fixes used by GPS users:
Temporary - Leave the GPS unplugged whenever Microsoft Windows is
loading.
Permanent - Go to Control Panel > System > Hardware > Device Manager > Mouse & Pointing Devices, and click on Microsoft Serial Ball Point,
then choose Actions and Disable. If this does not work, you can try opening the device manager after an erroneous startup using the keyboard,
find which mouse driver is being used, and disable that.
Find other suggestions at http://groups.google.com/groups?q=sci.geo.
satellite-nav .
Most GPS units are built with antiquated serial ports, thus the support
in Digital Atmosphere for this protocol. If your computer does not have
a serial port, you may buy a USB Serial Adapter, which brings in serial
data through your USB port. Belkin is one of the largest makers of such
boxes. They cost about $30.
77
CHAPTER 10
Window menu
Cascade
Causes all open workcharts to stack on top of one another visually, with
the title of each one visible.
Tile
Causes all open workcharts to expand and fill a proportionally equal
area of the screen.
Arrange icons
---
Remove last product
Removes the last product plotted.
Replot last product
Replots the last product.
Allow Digital Atmosphere to run in background
78
This prevents Digital Atmosphere from coming to the foreground, which
may cause distraction when working in other programs.
Add/remove toolbox/speed buttons/status
You can add or remove toolbars as needed to make more space on your
workchart.
Remove last product
Removes the last data overlay from the screen.
79
CHAPTER 11
Help menu
Contents
This shows the Digital Atmosphere HTML Help file. We began focusing
on PDF and printed manuals in May 2007, so some of this information
may be somewhat outdated. It is kept for the sake of providing a convenient, quick reference.
Register
If this menu option is not seen, your program has been registered
already.
The Help > Register dialog allows a user to “unlock” an unregistered
version of Digital Atmosphere. It usually only needs to be done once.
The trial version will be converted to a fully registered version, even if it
has already expired.
A key number is only available from Weather Graphics Technologies,
and can be given only in accordance with our . Furthermore, the key
number can be computed only if the serial number is provided. The serial number is unique to each computer, and we can’t predict what it will
be. If you don’t supply it, there will be a delay because we will have to
ask you for it.
For most users, the unlocking procedure only needs to be done once.
However if your company or organization specifically needs a pre-unlocked version of Digital Atmosphere (without the serial/key procedure),
we offer Digital Atmosphere 2000 Professional Version. It is supplied on
CD-ROM. Click the registration guidelines link above for more info.
If you have any questions, please E-mail the address shown at our contact page at http://www.weathergraphics.com/contact.htm or call us at
toll-free (800) 840-6280. Thanks!
80
About
Displays basic information about Digital Atmosphere, including the
copyright notice and the version number.
81
CHAPTER 12
Preferences
Here’s where you set your preferences for how the program will operate.
With that in mind, take note of the following:
Any changes you make are used only for the duration of the program’s execution, unless you place a check mark at the bottom of the page, in the box
named “Save as default settings, which will change them permanently.
Technically inclined users will note that the registry that is affected is HKEY_
CURRENT_USER\Software\Digital Atmosphere . Thus if other users log
in, they will see different Preferences settings. The entire key HKEY_CURRENT_USER\Software\Digital Atmosphere can be deleted with Windows
Regedit if a “factory reset” of preferences is desired.
The preferences menus are divided up into several sections, each of which
may be accessed by clicking once on the tabs at the top of the dialog box. Just
click on the tab corresponding to the settings you want to change to switch
between preference pages.
Each tab will now be introduced individually.
General tab
General settings
n Send errors to status windows - Causes errors to be indicated in the
Status Window rather than as a popup dialog. This option is provided because popup dialogs requiring input may interfere with
unattended scripting. This does not yet support all errors in Digital
Atmosphere -- if you see dialogs that this error does not catch, write
down the text in the dialog and report it to us.
n Automatically check for updates - Causes Digital Atmosphere, when
first started up, to check the weathergraphics.com site and access a
file called digatmos.ver to detect whether a new version is available.
If a new version is detected, you will be asked whether you’d like to
close Digital Atmosphere and proceed to the website. If you choose
“no”, Digital Atmosphere will ask whether you want to be reminded
about this upgrade or not.
82
Chapter Twelve / PREFERENCES
Radar color settings
n Preferred radar source override - When radar products are selected
for download, Digital Atmosphere uses a predefined set of Internet
URLs. Use this to switch sources. This can come in handy if the
server is down. This setting is also used for retrieving archived radar
data to use special URL sets (see Radar chapter).
n Preferred radar color override - When radar products are viewed,
Digital Atmosphere uses a predefined color scheme for displaying
the data. Use this to switch color schemes.
Print settings
n Color assignment - Normally this is set to Palette and should be left
at that setting. Use the RGB setting if you have problems with print
contrasts or colors. For advanced users, the Palette setting uses
WinAPI calls to DIB_PAL_COLORS while RGB uses DIB_RGB_COLORS.
Meteorological tab
Checkboxes section
n Geopotential heights in full meters only - The geopotential height on
upper-level charts are commonly plotted in decameters (dam). When
this box is checked, contour labels and upper plot models will appear
in full meters. When it is unchecked, the labels and plot models will
switch to conventional shortening typically used by meteorologists
(see table below). The default setting is unchecked. Conventional
shortening is as follows: 100 to 500 mb, undreds, tens, and units of
decameters are displayed; 501 to 1000 mb, hundreds, tens, and units
of meters are displayed.
n Round synoptic reports to nearest 3 hours when importing - You
have two options when importing synoptic (SYNOP) data — you can
either round the reports to the nearest 3 hours (making maximum
use of off-hour data) or use no rounding (ensuring sampling of the
atmosphere at an exact moment). It is generally best to use no rounding when possible. This setting does not influence which SYNOP file
is retrieved via the Internet; it only controls how the resulting file is
processed.
n View NEXRAD RCM rather than RAREP radar data - This prevents
two different radar formats from being mixed when you use Data >
Radar > Echoes. Check this box whenever you use NEXRAD RCM
data (such as that transmitted over EMWIN). If you use the old SD
RAREP code, uncheck this box.
Chapter Twelve / PREFERENCES
83
n Round AIREP reports within __ mb of a standard level - Forecasters like to see AIREP reports on upper-air charts, but AIREPs are
rarely at an exact standard constant-pressure level. When this box is
checked, it allows AIREPs within a certain range of the active pressure level to be included on the map. Usually 25 mb is a good value.
When it is unchecked, no AIREPs will be used unless they are at the
exact pressure level that’s active.
n Display highs and lows when plotting ASUS1 frontal bulletin - This
should usually be left unchecked. When you produce a pressure
analysis, Digital Atmosphere will automatically plot highs and lows.
When you use , it will plot its own sets of highs and lows, which
clashes with Digital Atmosphere’s depiction. Since the ASUS1’s fields
are coarser and may differ from the isopleth fields, you should generally leave this unchecked unless you have no surface data and want
to see the ASUS1 output of highs and lows.
n Display pressure values when plotting frontal bulletins.
n Winter depiction: extend contours over nonprecipitating areas.
n Convert ALSTG to SLP for analysis (advanced users only).
FOUS data level
Whenever you plot model (ETA/NGM) data, the temperature and moisture variables are determined according to this setting. Normally the
first button (T1/R1) is selected to give you surface data, but by choosing
another button you can plot or analyze temperature or moisture aloft
(calculating derived values such as dewpoint should be done with caution, though, since T3 is not the same level as R2). Here are the meanings
of the different levels.
Level Equivalent
T1 Surface
T3 About 100 mb above the surface (1 km)
T5 About 215 mb above the surface (2 km)
R1 Surface to about 35 mb abv sfc (lowest 1000 ft)
R2 About 35 mb above the surface to 500 mb
R3 500 mb to the tropopause
CAPE mixed layer depth
Calculates the depth of the layer to use when performing mixed layer
stability.
Miscellaneous quantities
n Lowest possible METAR pressure - The METAR surface observation code format only allows the tens, units, and tenths place to be
encoded, which means that Digital Atmosphere has to determine
whether the final millibar value is 9xx.x or 10xx.x. The default floor
84
Chapter Twelve / PREFERENCES
value for lowest METAR pressure is 960 mb, which means that if
a value such as 584 is found, Digital Atmosphere will assume it is
1058.4 mb, not 958.4 mb. Normally there is no need to change this,
but if you’re looking at exceptionally low pressure areas and the
sea level pressure contours aren’t plotting correctly, you’ll want to
decrease this value. Likewise, if you’re looking at very high pressure
and the sea level pressure contours aren’t plotting correctly, you’ll
want to increase this value. The rule of thumb is “if it’s a high, make
it high, if it’s a low, make it low”; a good rule of thumb is to temporarily adjust it by 20 mb. Be sure to change this back when the weather
system is gone.
n Earth’s rotation constant - Specifies the earth’s rotation in radians per
second, which is normally set at 0.000007292. Naturally, there is no
need to change this unless you want to tinker and see the results. The
earth’s rotation constant is used in the Coriolis parameter equations,
which are used for geostrophic wind calculations and calculation of
absolute vorticity. Hitting reset replaces any entered value with the
Earth’s rotation constant.
n Gravity constant - Specifies the gravity acceleration, which is normally set at 9.806 m/s-2. There’s no need to change this unless you want
to tinker and see the results. Gravity is only used in the calculation of
geostrophic wind based solely on height contours. Hitting the reset
button replaces any entered value with the Earth’s gravity constant.
Maps tab
Note: Make coastlines double wide is a setting that has been moved to
Styles in Digital Atmosphere versions after 2002.
General preferences
n Topography: use avg elev rather than max - This controls what source
of data is used when you select Map > Make Topography. When it is
checked, average elevation data is used. When it is unchecked, the
maximum elevation data is used.
n Fill outer space - When the map is zoomed out to where you can see
the disc of the Earth, the area outside the disc (the outer space area)
will be filled with the general plot color if this option is selected.
n Label graticule - When this is checked, and the “Map Features To
Be Drawn > Graticule” is checked, latitude/longitude labels will be
placed around the borders of the map. The style used will be the
“lat” (Lat/long graticule) in Preferences > Styles; the font name and
size will be obtained from this line.
Chapter Twelve / PREFERENCES
85
n Draw graticule behind land masses - Forces graticule to appear
behind continental landmasses. This is useful if the graticule is only
wanted in the ocean areas.
n Plot legend on right hand side of map - Forces the legend to the righthand side of the map.
JPEG image compression
If you choose Map, Export and choose JPEG as an image type, the image
will be compressed according to the settings you specify here. JPEG is a
lossy compression scheme, which means that higher compression values
result in degradation of the image. As the user, you select the tradeoff
that you think is most acceptable. For a typical 640 x 480 image, a setting
of 0% (loose) will result in a high-quality image with a filesize of 225K. A
setting of 100% (tight) will result in a very coarse image with a filesize of
11K.
Graticule type
Digital Atmosphere can overlay a latitude/longitude grid, and here you
can control how it will be displayed. You will see the lat/long grids only
if the “lat/long grids” setting in the “map element table” is checked and
only when you re-generate a new map. Note that the grid interval is
controlled by the “grid interval” setting and the color is controlled by the
grid color listed in the “map element settings” color table.
n Line. Plots latitude/longitude as a series of lines.
n Mixed. Same as “line” above, but also adds dots for every integer
degree of latitude and longitude. The size and interval of the dots is
fixed and cannot be controlled.
n Cross. Plots a cross at each latitude/longitude intersection.
n Dash. Plots latitude/longitude as a series of dashed lines.
n Dotted. Plots latitude/longitude as a series of dotted lines.
Graticule interval
If a latitude/longitude map is plotted, this value controls what interval
will be used (in degrees) to plot the grid. A value of 1, 5, 10, or 15 should
normally be used. So that the grid wraps uniformly around the globe, the
value you select should divide evenly into 360.
Default map size
When you use quick mapmaking commands such as Generate Map on
the speed button toolbar, this determines what the map size will be in
pixels.
Map features to be drawn
86
Chapter Twelve / PREFERENCES
Use this table to set which geographical features you want displayed and
in what color. Remember that these will not take effect until the next time
you generate a map.
Station plots tab
Also see the special topics on Surface plot models, Upper air plot models, and Station filtering. Station filtering has been moved to the Control
Panel in Digital Atmosphere versions after 2002.
Basic selections
Plot radar status labels - Whenever Overlay, Radar is chosen, this determines whether symbols are plotted at each radar location together with
the radar echoes. By unchecking this box, only radar echoes will be plotted.
Station plot units
n English - Quantities will be displayed in Fahrenheit and inches. This
only takes effect when another data plot is done.
n Metric - Quantities will be displaced in Celsius and millimeters. This
only takes effect when another data plot is done.
Surface plot model
These settings only apply when the active level is the surface level and
Overlay, Data is selected.
n Plot wind barb. If checked, Digital Atmosphere will plot a wind barb
at each station plot when it is reporting valid wind data. If unchecked, no wind barb is plotted on any report.
n Filter ASOS reports. If checked, Digital Atmosphere will plot human observations first, with automated (ASOS, AMOS, automated
synoptic, etc) as last priority. If unchecked, no priority is assigned to
any observation.
n Smart visibility plot. If checked, Digital Atmosphere will omit plotting surface visibility when no significant weather is occurring. If
unchecked, surface visibility is always plotted.
n Plot missing as ‘M’. Missing values will be plotted as ‘M’.
n Color code IFR/MVFR plots. If checked, when stations are reporting
IFR conditions (visibility less than 3 miles and/or ceiling less than
1000 ft), the OKTAS (sky cover) plot symbol is colored red; when
MVFR conditions (visibility less than 5 miles and/or ceiling less than
3000 ft), the OKTAS (sky cover) plot symbol is colored blue. If unchecked, the standard draw color is used to paint the sky cover plot
symbol.
Chapter Twelve / PREFERENCES
87
n Use km when above 5000 m. For visibilities that exceed 5 km (5000
m), they will be plotted as km. This is only effective if a surface plot
block is VIS(M).
Upper plot model
These settings only apply when the active level is an upper level and
plots are produced using Data > Plot.
n Plot wind barb - If checked, Digital Atmosphere will plot a wind barb
at each station plot when it is reporting valid wind data. If unchecked, no wind barb is plotted on any report.Fill dewpoint depression circle. If checked, Digital Atmosphere will “shade in” the station
plot of each upper level station whenever the dewpoint depression
is determined to be 5 deg C or less. If unchecked, all station plots are
left unfilled.
n Fill dewpoint depression circle - If checked, the station plot circle will
be filled if the dewpoint depression is 5 deg C or less. This usually
signifies cloud cover.
Plot model configurations
For both surface and upper air plots, a “grid” of dropdown boxes are set
up in a way that represents the various data positions around a given
station plot. You can use these dropdown boxes to adjust the kinds of
data that are plotted in the different positions. Listed below are the different types of data that are valid.
Analysis tab
General preferences
n Small fonts - This option simply controls what size and type of fonts
are used to label contour lines on analysis charts. The same thing, except with “small fonts” unchecked and “negative fonts” unchecked.
n Negative fonts - Contour labels are plotted as white on black, rather
than black on white.
n Transparent fonts - Controls whether the map below bleeds through
contour labels.
Analysis type
Specifies which mathematical algorithm is to be used to analyze the data
field.
n Nearest neighbor — This is by far the quickest, and most users will
use this setting. Values are mapped to the closest gridpoint, then are
mathematically expanded to neighboring unfilled gridpoints in a
88
Chapter Twelve / PREFERENCES
cyclical manner. Afterwards, a selective smoothing operator smooths
gridpoints, performing more smoothing iterations performed on
gridpoints that are further from representative data areas and less or
no smoothing passes where data is close to a gridpoint. Strengths: It’s
fast and always works. Weaknesses: Data void border areas look linear, and
data void interior areas can look pie-shaped.
n Weighted — Digital Atmosphere looks at the neighboring stations
around a gridpoint, giving it an average of those values around it
with more emphasis on the values at closer stations.
n Barnes — The Barnes method, the cornerstone of the MCIDAS and
GEMPAK weather workstations, has a number of advantages:
versatility, simplicity, and speed. Each gridpoint is assigned a meteorological value which is the result of a Gaussian distance-dependent
weighting function. A difference field is calculated, which determines
how far off from reality the analysis field appears to be, then a difference correction is applied to the analysis field. This takes a relatively long time to compute, but is one of the more accurate analysis
algorithms.
n Cressman — Each gridpoint is assigned a meteorological value which
is the result of a distance-dependent weighting function. The Cressman analysis method is similar to the Barnes technique, however it
makes successive corrections using a smaller and smaller radius of
influence to eliminate all errors. It takes more time, but the results
are good. In data-sparse areas, it is common for there to be erroneous
contours, especially if Digital Atmosphere is tasked to determine the
best station spacing. Strengths: It’s sophisticated and flexible, and it may
retain more mesoscale structure. Weaknesses: It can’t resolve short-wavelength components, it can require a large amount of time, and it can fail
with extreme data distribution.
Analysis settings
These are used to control the performance of the selected analysis type.
Certain choices may be grayed out depending on the analysis type selected and whether “automatic smoothing” is in effect.
n Smoothing coefficient - Sets the mathematical value of “s” for the
smoothing equation. This affects what kind of wavelengths will be
filtered in the analysis grid.
n Smoothing passes - Determines how many times a smoothing operator will operate whenever it is called. With this, you can set how
“smoothed” the maps will look when the analysis is complete. This
should be set to “1” or to a low non-zero value.
n Surface radius - Determines a radius of influence used in the Weighted, Cressman, and Barnes analysis method for surface data. This
value should approximate the average spacing between surface stations.
Chapter Twelve / PREFERENCES
89
n Upper radius - Determines a radius of influence used in the Weighted,
Cressman, and Barnes analysis method for upper air data. This value
should approximate the average spacing between upper air stations.
n Gamma - Determines a gamma used in the Barnes analysis method for
upper air data.
n Reduction - Determines a reduction value used in the Cressman
analysis method for upper air data.
Styles tab
With Digital Atmosphere you are not stuck having to use one set of
map colors, line styles, and fonts for everything. Obviously when you
want to use a different color set, this means spending a lot of time making tedious changes. Digital Atmosphere allows you to manage sets of
colors, fonts, and line settings. These sets are known as styles. A style
is identified by a plaintext name and a filename (all styles are stored in
the \styles directory under Digital Atmosphere, without exception). To
change the color settings, use the Preferences > Styles panel. Advanced
users may edit the files directly; this will not hurt anything if a plaintext
editor such as Notepad or MS-DOS Edit is used.
Editing the parameters
Listed here are the various codes that appear in the edit window. Above
all, be sure you pick Save when you are done, or your changes will be
discarded!
n Code - This is a predefined code that marks the parameter type for
internal use. It cannot be modified.
n Parameter - This is a predefined code that is used to provide a plain
language explanation of the parameter for that row. It cannot be
modified.
n R, G, B - These are color codes, which must be a whole number between 0 and 255. The R column is for red, G is for green, and B is for
blue. To pick orange, for example, you would set R to 255, G to 128,
and B to 0. You do not need to use these columns. A vastly simpler
input is available simply by clicking on the color swatch to the right
of the R, G, and B columns. If you do wish to enter R, G, and B
values, the following resource may help: http://www.cloford.com/
resources/colours/namedcol.htm . Do not enter hex (hexadecimal)
values; they will not be recognized.
n Color swatch - Click on the color swatch to select a different color. In
the popup window, a crosshair will show the current color value.
Move it around or change the values to pick a new color. The value
of R, G, and B will be filled in automatically for you.
90
Chapter Twelve / PREFERENCES
n Contour type - Indicates the purpose of this contour. It cannot be
modified.
n Unit - Proper entries are as follows. Do not mixmatch units or the
program will ignore the setting and use a default unit. Units marked
with * cannot be changed.
Temperature . . . . .
Moisture . . . . . . .
Relative Humidity . .
Horizontal Velocity .
Vertical Velocity . .
Height . . . . . . . .
Pressure . . . . . . .
Precipitation Totals .
.
.
.
.
.
.
.
.
deg f, deg c, deg k
g/kg
percent
knots, mph, m/s
ub/s (microbars per second)
meters
mb, hpa, kpa, inches
inches, mm
n Base - Determines the base value that the intervals are based off of. For
example, if you use an interval of 5 degrees, a base of zero will give 0,
5, 10, 15, 20, 25.. degrees. If you use a base of 2 degrees, you’ll get 2, 7,
12, 27, etc. Always reduce the base to the lowest common denominator (as close to zero as possible).
n Interval - Represents the contour step interval (the numerical difference between each contour).
n AI - Automated interval. If y is entered, Digital Atmosphere will override the base and interval settings and choose the ones that will give
the clearest view of the data field.
n Style - Indicates the linestyle that will be used to draw the contour.
Acceptable values are solid, dash, or dot. Radar echoes must be either solid, clear, bdiag, fdiag, cross, crdiag, horiz, or vert.
Making a new style
At some point you may not be happy with just editing the default styles.
When you want to create a new style, click the New... button. You will
see a panel like this.
n Enter a plaintext name. Choose any phrase that will readily identify
the map to you. A brief phrase without any brackets should be used.
Chapter Twelve / PREFERENCES
91
n Filename for this map style. The file shown here is what the filename
will be on your hard drive. This will be filled in automatically when
you choose a plaintext name. However the edit box gives you the
opportunity to override the filename. Only alphanumeric characters
and dashes are allowed.
n Style template filename (optional). Normally the new color settings
will be extracted from the \styles\master.stx file. If you’d like to
clone a different file, choose it here.
n CREATING STYLE FILES MANULLY: You can create your own style
files manually in a text editor, as long as the filename ends with *.sty,
resides in the \styles directory, and conforms to the style formats
shipped with Digital Atmosphere in this directory. Incorrect configurations may produce an error in Digital Atmosphere and prevent
fields from being generated.
Miscellaneous 1 tab
Advanced internet settings
If you use a proxy host, enter the name and port here. If you do not
know the proxy settings, you will need to contact your ISP. Our tech support personnel cannot guess these settings or look them up for you. For
example, users of Alphalink in Melbourne, Australia will notice on their
Alphalink support pages that they would need to enter proxy.alphalink.
com.au in “Proxy host” and 8080 in “Proxy port”.
Color gradient fills
This section lets you define how gradient fills will look. It is designed
mostly for experienced users and will require some basic mathematical
knowledge. The colors are defined according to the plotted Value for
the particular point on the map, which will always be in the range 0..1,
where 0 is the lowest possible reading and 1 is the highest possible reading. This Value is fitted to a sine wave according to user defined parameters to determine the Red, Green, and Blue component of its color. See
the Appendix on Color Gradients for more information.
Planetary maps
For more information on planetary maps, see the Map Menu chapter.
n Smooth final image. Applies a simple Haltiner smooth to graphics
imported in the Maps > Import Planetary Map function.
n Re-overlay geography. By default Digital Atmosphere does not overlay map data on a Maps > Import Planetary Map operation. Check
this if you want the basemap to be drawn automatically.
92
Chapter Twelve / PREFERENCES
For USGS/DEM purposes only
This allows the import to stop or start if the text value shown in this box
exists in the raw data on the same line where “KWBC” is found. To have
any effect, a text entry of at least 4 characters must be made. If KWBC
and the string is found, then import begins. If KWBC is found and this
string is not found on the line, then import ceases. It was used to allow
the USGS to selectively process archived NOAAPORT data. A date-time
text entry can be placed here and various sets of data can be accepted or
rejected based on the value.
Special diagnostics
This is used to conduct a time zone test to troubleshoot problems on
certain international versions of Windows. When the Time button is
pressed, a code is presented in the box, which can then be submitted to
Weather Graphics via email.
Cities
n Cursor sensitivity threshold. Controls which cities will be shown
when Map > Cursor City Distance is active.
n Plotting threshold. This controls which cities and towns will be accepted for use in the Map > Cursor city distance function. Reduce
this number into the hundreds or thousands to allow comparisions
with small towns. Increase the number into the tens of thousands to
allow comparisions with only large cities. There is some variation in
the sensitivity between different states and you may need to increase
or decrease the factor for your region. To get an idea of what numbers you should use you may open the digatmos.cty file.
Miscellaneous 2 tab
Copy imported data to local file
This option allows the user to automatically save a local copy of all data
that is imported each time an import operation is done. If enabled, the
data will be saved to the pathname specified. If you do not need this
functionality, leave the “enabled” checkbox unselected.
Debug GRIB data
Causes the insertion of parameter number and value in the table that
presents a GRIB field to display during GRIB import. For diagnostic use
only.
93
Annotations tab
Text annotations
n Highs and lows - Choose the alphabetical character that will be used
to represent low pressure and high pressure areas. Typically L is
used for low pressure and H for high pressure, but this will vary
in non-English countries. The “Include value” option determines
whether the pressure value (in millibars) will be plotted with the
high or low.
n Title - Allows a title, determined by the most recent meteorological
field to be displayed, to be plotted on the workchart at the given
position.
n Credits - Allows a user-defined credit to be plotted on the workchart
at the given position.
Logo
This option allows you to insert a logo on your workcharts.
n Source filename - If entered, specifies the name of an image (GIF
or JPEG). Click on the “...” button to choose a file from a menu, or
simply type in the name in the box provided. Press Clear to disable
logo use.
n Position - Specify the location (top right, top left, bottom right, or bottom left) where you want the image on the workchart, and specify
the offset in pixels on the X and Y axis. Values of 0 place the logo
flush with the corner of the workchart, while values of 10 to 20 will
provide a buffer.
94
95
APPENDIX
96
97
APPENDIX
Printing
Digital Atmosphere’s Print command sends an exact copy of the screen
image to the printer. Here are some tips for troubleshooting your map
printouts.
Image brightness and contrast
f the printouts are too dark, you will need to change your map settings in
Preferences and regenerate new maps (preferably with white backgrounds),
then print those. Also keep in mind that many PostScript printer drivers will
allow you to set the printer to produce negative printouts.
If the maps are too dark, you should avoid using solid colors. Regenerate
your maps without topography or ocean fills. Topography is designed
mainly for screen viewing. If you absolutely must have dark maps on-screen
and can’t force your printer to produce acceptable output (either through
File, Print Setup or through the printer’s own setup menus), you will need to
export the map and then use a photo-editing type graphics program (such as
Photo Shop or Paint Shop Pro) to make a negative image or enhancements
that allow for better printouts.
Fitting an image to the printer
Printouts of Digital Atmosphere maps will be clearer if the graphic image
exactly matches the generated printer image. To do this, first establish which
dpi (dots per inch) the printer will produce. For many printers, this is 300,
though 600 or 1200 may be possible. Then determine the printable image
size. For instance, many HP printers use a quarter-inch border all around
when printing to 8.5 x 11 paper, which yields an image size of 8 x 10.5”.
Simply multiply this dimension by the dots per inch to get a suggested
image size in pixels. Thus 8 x 10.5” multiplied by 300 dpi yields 2400 pixels
in width and 3150 pixels in height. So do a Map > Generate with these image
dimensions, and the resulting image should come out rather sharp.
Memory errors
If the printer shows memory errors, this means that the graphic you are
sending to the printer is too large to fit into the printer’s memory. The easiest
way to remedy this is to go to File, Print Setup and choose a portrait printout
rather than a landscape printout. Another solution is to regenerate your
charts without using any color fills or topography (i.e. totally composed of
98
Appendix / PRINTING
line graphics). The third method of solving a memory problem is to use a
lower resolution (i.e. choose 600 dpi rather than 1200 dpi, or 300 dpi rather
than 600 dpi in your printer setup). The final and best solution is to increase
the amount of RAM in your printer by installing a SIMM memory module.
Your printer will require a total minimum amount of 2 MB of RAM, but will
work best with 4 MB or more.
In Windows 98, some users have reported problems printing to HP LaserJet
and a couple of other printers (such as getting blank pages). This is usually
a problem with the Windows PCL 5 print driver and is beyond the control
of Digital Atmosphere. Solutions for this that have been documented are
changing the resolution from 600 to 300 dpi or change the print mode from
“vector” to “raster”. If your printer is equipped with a PostScript option,
always use the PostScript mode for 600-dpi printing. Overall, this printing
problem is not specific to Digital Atmosphere and may occur with other
applications that make extensive use of the PCL driver.
99
APPENDIX
Importing radar graphics
Here is a quick tutorial on how to add a radar site, using South Africa as an
example.
We Googled “south africa radar” and found a radar image page at http://
metsys.weathersa.co.za . We go to the page for Durban and see that there is
an image. Right-clicking on the image we see that the radar image is stored
in http://metsys.weathersa.co.za/radar_image/DN.gif (which is good, as
loopers and non-fixed filenames can be considerably more complicated to
deal with). Now we need to get the latitude and longitude of this site. It’s
not anywhere on the page, however the website has a handy radar information page at http://metsys.weathersa.co.za/nwrn.htm. This shows Durban at
30.01S 30.93E. Make a note of that.
Now we need to import the radar image into a graphics program; we use
PaintShop Pro. In your browser, right-click on the image and choose Copy
Image. Then paste it in your software.
In another window, open Notepad and then open your digatmos.rdy file in
the Digital Atmosphere directory. Start a new line at the top of the data block
(anywhere in the list is fine, but entering new items at the top we can see the
column headers more conveniently).
In your graphics program, position the cursor on the very center of the radar
site and read the X/Y coordinates, wherever your graphics program displays
it. This shows a center position of304,367(X=304,Y=367). Enter this into digatmos.rdy under XXX YYY. So far it should look like this:
Now we need to find the top left and bottom right of the part of the image
containing valid radar information. This image has a border box enclosing
the radar product; the legends are outside of it and the radar image is inside
of it. We can use the border box. The top left is (0,54) and bottom right is
(612,665). Enter this under LEFX,TOPY and RGTX,BOTY.
Now we determine the maximum range of the radar scan. This can be seen
easily with the 200 km ring. So the range will be 200 km. Enter that under
RNG. Now we need to determine a scale in pixels per km. This is an easy
task since the range rings and site center are obvious. Since the leftmost
extent of the 200 km ring is at X=0 and the radar center is X=304, this means
that we have 304 pixels per 200 km of distance. Do the division and we get
304/200 = 1.52. Fit this figure under SCALE.
100
Appendix / IMPORTING RADAR GRAPHICS
Now put the latitude and longitude under LATITU LONGITU. Note that
if your figures came in degrees-minutes-seconds you need to convert them
to decimal values before entering them here. Fortunately the South Africa
radar information page gave us decimal degrees. Always use negative for
westerly longitudes and southerly latitudes. So we will be entering -30.01
30.93.
Now let’s get the URL of the image. Simply right-click on the radar image
in your browser and choose Copy Image Location. Paste this under URL in
digatmos.rdy. In this case the image is at http://metsys.weathersa.co.za/radar_image/DN.gif .
Under FMT we need to enter the image format type. Typically you just use
the extension on the URL, which in this case is gif. Other types seen may
be jpg and png. Some sources use the wrong image type on the filename, in
which case the image will not display in Digital Atmosphere and you will
have to see if the site is posting, say, a JPG using a PNG filename (this kind of
thing is happening with Canadian radar images).
Now we need to develop a color table to tell Digital Atmosphere which radar
colors contain information. Scroll to the bottom of the digatmos.rdy file and
start a new TABLE= line using a value that is not in use. If you’re using the
default Digital Atmosphere digatmos.rdy file, you’ll probably be starting a
TABLE=05 line. So enter TABLE=05 followed by two forward-slashes and a
note telling you what this table is for. We recommend:
TABLE=05 // South African radars
Now we need to enter the color information for each intensity level. The
South African radar source has a handy scale on the right side. View this
in your graphics program. Now you need to use whatever tool will let you
hover over pixels and show you the color value using RGB numbers (i.e.
three numbers, each ranging from 0, dark, to 255, bright, indicating the numerical level of red, green, and blue). In PaintShop Pro it is the eyedropper
icon (pick up color). If you hover over the “0 dBz” level, which is gray, you
should see it has R=90 G=89 B=90. We enter a line using this format:
LEVEL=dbz,red,green,blue,threshold
The red, green, and blue are self-explanatory. The dbz is the dBz level from
the scale; it’s only used for color mapping. If no scale is provided you can
use 0 for weak echoes ranging up to 60 for heavy levels. Finally threshold is
a value used to “accept” pixels that are close to the required R,G,B values...
we will use 10. However it may be important to set this for JPG files where
color drift may occur. Threshold should usually be 10, but you can increase
Appendix / IMPORTING RADAR GRAPHICS
101
it to 50 or 100 if lossy JPGs are used and “holes” are appearing in the generated radar images. Basically Digital Atmosphere looks at the numerical
difference in red, blue, and green and adds up these differences (using the
absolute value) to gauge the pixel against the threshold. So if you define
RGB=10,10,10 and the program sees a pixel with RGB=30,30,30, this adds up
to a difference of 60. The pixel will be treated as part of your level definition
as long as the threshold value doesn’t exceed 60.
When we are done defining all levels it will look like this:
TABLE=05 // South African radar
LEVEL=00,090,089,090,10
LEVEL=05,074,060,140,10
LEVEL=10,000,089,000,10
LEVEL=20,000,113,000,10
LEVEL=30,008,125,222,10
LEVEL=35,024,069,231,10
LEVEL=36,107,012,198,10
LEVEL=39,198,016,132,10
LEVEL=42,189,101,132,10
LEVEL=45,206,134,057,10
LEVEL=48,247,195,049,10
LEVEL=51,255,251,000,10
LEVEL=54,255,154,090,10
LEVEL=57,255,093,008,10
LEVEL=60,255,052,024,10
LEVEL=65,189,190,189,10
LEVEL=70,214,211,214,10
Note that extraneous zeroes have been prefixed to make numbers two or
three digits. This is optional, and has been done here to make the file look
neater. We will also skip South Africa’s 80 dBz since it matches the basemap
color (white) and may give undesirable results.
Finally we need to hook up this table number (05) with the Durban radar
entry above. Put this number under CO to point it at the table.
We’re done! Now generate a map in Digital Atmosphere for Durban (the
ICAO is FADN) and use a tight zoom level of about 300 or 400 nm. Now use
Radar > Import Images and Clear All and then check Durban.
102
Note that there are traces of radar range rings. This cannot be avoided since
it is an artifact on the original image. The outer red radar range ring is provided by Digital Atmosphere to mark the maximum extent of radar information and can be shut off by putting RANGERING=0 instead of RANGERING=1 before the TABLE= entries in digatmos.rdy. The palette can also be
changed in this section to something more desirable.
103
APPENDIX
Surface plot configuration
Table of valid data plot elements. Units marked “C or F” or “ft or m” or “sm
or m” are in metric or English according to File > Preferences > Station Plots >
Station Plot Units unless otherwise specified here.
Blank) Nothing will be plotted in this space
TEMP Air temperature in whole degrees (C or F)
TEMP(10) Air temperature in tenths (C or F)
DWPT Dewpoint in whole degrees (C or F)
DWPT(10) Dewpoint in tenths (C or F)
GUST Wind gust (kt)
RH Relative humidity (%)
MXR Mixing ratio (g/kg)
THETA Potential temperature (deg K)
THETAE Equivalent potential temperature (theta-e) (deg K)
WINDCHILL Wind chill
HEATINDEX Heat index
SLP Sea level pressure (mb)
ALSTG Altimeter setting (in Hg)
WX Pictogram of current weather type
VIS Prevailing visibility (sm or m)
ELEV Elevation (ft or m)
CIG Ceiling (hundreds of feet)
OKTAS Cloud cover in oktas (eighths)
ID(ICAO) Station identifier (4-letter ICAO)
ID(WMO) Station identifier (5-digit WMO)
PCP01 Precipitation during past 1 hour
PCP06 Precipitation during past 6 hours
PCP12 Precipitation during past 12 hours
PCP18 Precipitation during past 18 hours
PCP24 Precipitation during past 24 hours
PTEND Pictogram of pressure tendency during past 3 hours
CLD/L Pictogram of low cloud type
CLD/M Pictogram of middle cloud type
CLD/H Pictogram of high cloud type
CLDHGT Cloud height code (synoptic only) (SEE BELOW)
CLDAMT Cloud amount code (synoptic only) (SEE BELOW)
SHIPDIR Pictogram of direction of ship movement
SHIPSPD Speed of ship movement (kt)
SEATEMP Sea-surface temperature (C or F)
TEMPTYPE Type of temperature measurement device
WAVEPD Period of ocean waves (sec)
WAVEHGT Height of ocean waves (ft or m)
SEAINSTHGT Instrument-measured height of ocean waves (ft or m)
WINDPD Ocean wind wave period (sec)
104
Appendix / SURFACE PLOT CONFIGURATION
WINDHGT Ocean wind wave height (ft or m)
SWELL1DIR Direction of primary ocean swells (deg)
SWELL2DIR Direction of secondary ocean swells (deg)
SWELL1PD Primary ocean swell period (sec)
SWELL1HGT Primary ocean swell height (ft or m)
SWELL2PD Secondary ocean swell period (sec)
SWELL2HGT Secondary ocean swell height (ft or m)
MINTEMP Minimum temperature (C or F)
MAXTEMP Maximum temperature (C or F)
GRNDSTATE Ground state code (see below)
Interpreting ground state codes (GRNDSTATE)
The ground state codes are as follows:
0 Surface of ground dry (without cracks and no appreciable amount of
dust or loose sand)
1 Surface of ground moist
2 Surface of ground wet
3 Flooded
4 Surface of ground frozen
5 Glaze on ground
6 Loose dry dust or sand not covering ground completely
7 Thin cover of loose dry dust or sand covering ground completely
8 Moderate or thick cover of loose dry dust or sand covering ground
completely
9 Extremely dry with cracks
10 Ground predominantly covered by ice
11 Compact or wet snow (with or without ice) covering less than half of
ground
12 Compact or wet snow (with or without ice) covering half to less than
entire ground
13 Even layer of compact or wet snow covering ground completely
14 Uneven layer of compact or wet snow covering ground completely
15 Loose dry snow covering less than half of ground
16 Loose dry snow covering at least half of ground but ground not completely covered
17 Even layer of loose dry snow covering ground completely
18 Uneven layer of loose dry snow covering ground completely
19 Snow covering ground completely; deep drifts
Interpreting synoptic cloud amount codes (CLDAMT)
This category is defined as Nh; the amount of all the low cloud present, or,
if no low cloud is present, the amount of all the middle clouds present. The
figure is always in oktas (eighths). 9 is reserved for sky obscured by fog and/
or other meteorological phenomena, and / is reserved for cloud cover being
indiscernable for reasons other than fog or other meteorological phenomena,
or observation is not made
Appendix / SURFACE PLOT CONFIGURATION
105
Interpreting synoptic cloud height codes (CLDHGT)
This category is defined as “h, which is reserved for the height of the surface
of the base of the lowest cloud seen. They are as follows (below). If the total
sky cover is greater than 4/8ths, this figure is also transposed into the CIG
slot, where they are plotted as “L” (“low cloud”) followed by a loose translation of the table below in hundreds of feet. This “L” differentiates it from true
ceilings where “C”, “E”, or “M” is prefixed.
0 0 to 50 m
1 50 to 100 m
2 100 to 200 m
3 200 to 300 m
4 300 to 600 m
5 600 to 1000 m
6 1000 to 1500 m
7 1500 to 2000 m
8 2000 to 2500 m
9 2500 m or more, or no clouds
/ Height of base of cloud not known, or base of clouds at a level lower
and tops at a level higher than that of the station
106
107
APPENDIX
Color gradient fills
First the value (0 for minimum possible and 1 for maximum possible) is
fitted to the sine wave to determine what the amplitude will be. Amplitude
will always be in the range -1 to 1. Amplitude is determined by ph1 and
ph2, which are in degrees. A greater difference between ph1 and ph2 will
result in a more curved function, while a smaller difference will produce a
flatter function. For basic users, the sine responses are as follows: sin(0)=0,
sin(90)=90, sin(180)=0, sin(270)=-1 .
Amplitude = sin( [(ph2-ph1) * Value] + ph1 )
Finally the amplitude is modified according to the user-defined scale and
offset values to determine ColorValue, which must always be in the range
0..1 (0 is dark, 1 is bright). This means if an Amplitude value is negative, it
must be offset so that it falls into the range 0..1. An out of bounds ColorValue
is always rounded up or down so that it equals 0 or 1.
ColorValue = (Amplitude * Scale) + Offset
Example: For a basic scale where cold temperatures are black and hot
temperatures are bright red, set Red’s Ph1=0, Ph2=90, Scale=1, and Offset=0.
Set the Green and Blue Scale to 0 and Offset to 0, which will always provide a
value of 0 for these components.
Ph1
MIN
1
Ph2
MAX
Scale
Offset
0
-1
0°
90°
180°
270°
360°
Illustration of basic
concepts of Ph1, Ph2,
Scale, and Offset.
108
109
APPENDIX
Points
The following section shows how to construct files that produce points
and lines. The files should be created using a plaintext editor like Windows Notepad.
Coordinate pairs
Coordinate pairs are in the format LAT LONG. Points may be defined in
DDMMSSX DDMMSSX format (where X is N, S, E, or W as appropriate).
Points may also be defined in decimal format (DD.DDDD DD.DDDD).
The format is described below.
Points
Points are plotted by writing them as such:
350216N 964717W Joes Place|NOLABEL
325455N 963746W Edgar
344705N 953806W IBM
You may suffix a point with a | symbol (pipe) and write NOLABEL, NOBOX, or both to prevent those attributes from appearing on the map.
Lines
Lines start with %START. From there on all points will be connected
with a line. To turn line mode off and go back to points, use %END. To
start a new line, write %START again (an %END is not required). You
may write comments on the end; these will not be plotted if line mode is
on. This example plots a line from five points:
%START
322540N
322846N
324751N
322221N
332652N
960710W Leadout N
960705W
960601W
960748W
960055W
Using shortcuts
Shortcuts are performed by prefixing an asterisk in a point title (when
point mode is on). These may then be invoked by placing the title in
brackets. Bracketed items will be replaced with the coordinates of the
point where it was defined earlier.
This will plot a line from “Baker” to points in between and ending at
“Charlie”.
110
Appendix / POINTS
332217N 960758W *BAKER|NOLABEL
334910N 960327W *CHARLIE
%START
[BAKER]
332540N 960710W
332846N 960705W
333331N 960709W
333728N 960720W
334549N 960707W
334555N 960636W
334617N 960629W
334751N 960601W
334813N 960519W
334905N 960334W
[CHARLIE]
111
APPENDIX
Map attribute file structure
FOR ADVANCED USERS
This section contains advanced information for technically inclined
users only.
This file, ending with the file extension *.ATR, is associated with each map
which is saved to disk.
The attribute file is structured as follows:
Number Purpose
real Central latitude (degrees)
real Central longitude (degrees)
real Zoom setting (3963/z where z=map width in miles)
integer Not used
integer Not used
integer Not used
integer Not used
integer Map height (pixels)
integer Map width (pixels)
integer Offset x direction (pixels)
integer Offset y direction (pixels
NOTES:
* Real types have the range 2.9 x 10-39 .. 1.7 x 1038 with 11-12 significant
bits and a length of 6 bytes.
* Integer types have the range -2147483648..2147483647 and are signed
32-bit (4 byte) little endian.
112
113
APPENDIX
Field and product codes
OBSERVATIONAL PRODUCTS
Product codes
pla
plf
plc
tdy
rad
sf0
sf6
wgr
ACARS plots
Standard data plots
Custom data plot
Television-style data plots
Radar plots
Europe sferics (0 hr)
Europe sferics (6 hr)
Wind grid
Field codes
tmf
tmc
pot
wcx
hix
dwf
dwc
rhu
mxr
eqp
slp
alt
wsp
cig
hgt
thk
wrx
p01
p06
p12
p18
p24
rst
rhl
rms
rtv
reh
rem
wxp
Temperature (deg F)
Temperature (deg C)
Potential temperature (deg K)
Wind chill factor
Heat index
Dewpoint (deg F)
Dewpoint (deg C)
Relative humidity
Mixing ratio
Equivalent potential temperature (theta-e)
Sea level pressure
Altimeter setting (QNH)
Wind speed
Ceiling
Geopotential height
Thickness (1000-500 mb)
Warning overlays
1-hour precipitation
6-hour precipitation
12-hour precipitation
18-hour precipitation
24-hour precipitation
RCM radar storm centroids
RCM radar hail signatures
RCM centroid movement and speed
RCM tornado TVS signature
RCM echo height signatures
RCM echo movement
ASUS1 KWBC frontal depiction bulletin
114
Appendix / FIELD AND PRODUCT CODES
ste
pdw
htw
hti
pdd
htd
di1
di2
pd1
ht1
pd2
ht2
cig
dy1
dy2
06k
lcl
be+
becxx
hux
iht
zb+
prt
Sea surface temperature
Wave period
Wave height
Wave instrument-measured height
Wind wave period
Wind wave height
Primary swell direction
Secondary swell direction
Primary swell period
Primary swell height
Secondary swell period
Secondary swell height
MVFR/IFR weather
SPC Convective Outlook Day 1
SPC Convective Outlook Day 2
Surface-6000 ft shear [not completed]
Lifted condensation level [not completed]
CAPE [not completed]
CIN [not completed]
[not used]
[not used]
[not used]
[not used]
[not used]
RADAR PRODUCTS
Radar product codes
All ranges 128 nm unless otherwise noted
Base reflectivity
BREF1 Base reflectivity
BREF2 Base reflectivity
BREF3 Base reflectivity
BREF4 Base reflectivity
BR248 Base reflectivity
0.5
1.5
2.4
3.4
0.5
Base velocity
BV32 Base velocity
BVEL1 Base velocity
BVEL2 Base velocity
BVEL3 Base velocity
BVEL4 Base velocity
deg (32 nm)
deg
deg
deg
deg
0.5
0.5
1.5
2.4
3.4
Base spectrum width
SW Spectrum width
SW32 Spectrum width (32 nm)
deg
deg
deg
deg
deg (248 nm)
Appendix / FIELD AND PRODUCT CODES
Derived products
CR Composite reflectivity
CR248 Composite reflectivity (248 nm)
ET Echo tops
SWP Severe weather probability
VIL Vertically integrated liquid
STI Storm tracking
H Hail detection
TVS Tornado vortex signature
M Mesocyclone
OHP One-hour precipitation
THP Three-hour precipitation
STP Storm total precipitation
SRMV1 Storm relative velocity 0.5 deg
SRMV2 Storm relative velocity 1.5 deg
SRMV3 Storm relative velocity 2.4 deg
SRMV4 Storm relative velocity 3.4 deg
CFC Clutter filter
115
116
117
APPENDIX
GRIB data
Because of the complexity of GRIB data and the fact that it is not fully supported by Digital Atmosphere yet, Weather Graphics Technologies will not
provide assistance in locating, retrieving, or using GRIB data. It is provided
as-is. Comments are welcomed but we may not be able to respond to questions. If you need help, please access our public discussion group on our
website at www.weathergraphics.com
Grid definition file
Advanced users can edit the digatmos.grd file to change the grid, model,
and parameter definitions.
The MODEL section defines a model name based on its model number
(Column 1-3) and IDENTIFIER of the facility (Column 5-8; see IDENTIFIER section).
The CENTRE section defines a production facility.
The FIELD section defines a product based on its parameter number
(Column 1-3) and the IDENTIFIER of the facility (Column 5-8; see IDENTIFIER section). Based on what appears here, Digital Atmosphere selects
the Preferences Style type (Column 25-27) to display this field.
Fixing GRIB problems
There are two symptoms which indicate a problem with GRIB data:
n When question marks appear in the field panel, e.g. “72HR 500 MB ?
ECMWF ? CREATED 29DEC06 1200Z”.
n When corrupt output or no output can be generated on the screen.
To resolve this, you need to identify the centre, model, and field causing
the problem. Go to File > Preferences > Misc 2 and enable “Debug GRIB
Data”. When this is enabled it causes full information to be displayed in
118
Appendix / GRIB DATA
the field selection panel, rather than the simplified user-friendly format.
For example, we recently had display problems with ECMWF data, and
the field panel showed “72HR 500 MB ? ECMWF ? CREATED 29DEC06
1200Z”. When the debug mode was enabled, we saw this:
TIME:1=72HR LEVEL:100=500 MB FIELD:129= ? CENTRE:98= ECMWF
MODEL:128=? CREATED 29DEC06 1200Z
Thus it can be seen that Digital Atmosphere was unable to decode FIELD
and MODEL, and only the coded values are known (129 for field and 128
for model).
To determine the missing information, we have to do some Googling.
For the model number, we made the query “ecmwf global grib 98 128” in
Google. The page http://www.ecmwf.int/products/data/operational_system/evolution/evolution_2006.html tells us “The new GRIB model identifier for the atmospheric model will be 128. The model identifiers for the
wave models will remain the same (116 for the global wave model and
216 for the limited area wave model).”
Excellent. Thus we enter the following additions to digatmos.grd in
the MODEL section. Note that we refer to centre 98 (ECMWF) indicating that these model identifiers 116, 128, and 216 are applicable only to
centre 98 (ECMWF):
116 98 ECMWF/GLOBAL-WAVE
128 98 ECMWF/GLOBAL-ATMOS
216 98 ECMWF/LIMITED-WAVE
Now we need to find what field 129 is. Googling for “ecmwf grib 129
height” (since we suspect 129 is a height field) we get a good link at
http://www.cgd.ucar.edu/cms/eaton/cf-metadata/ECMWF.html . This
shows that 129 is indeed a geopotential [height] field. Since everything
in this ECMWF Grib Code list is useful, we should ideally enter everything, but since ECMWF restricts most of its data, it’s smarter to make
only a small number of changes as listed below, in the FIELD block.
Note that we specify that these fields only apply to products from centre
98 (ECMWF).
1 98 Pa - slp Pressure
2 98 Pa - slp Pressure MSL
7 98 cm - hgt Geopotential height
11 98 K - tms Temperature
41 98 s - vrt Vorticity (absolute)
43 98 s - vrt Vorticity (relative)
129 98 cm - hgt Geopotential height
138 98 s - vrt Vorticity (relative)
Appendix / GRIB DATA
119
We entered “cm” under geopotential height so that isopleths will plot
legibly. It is also acceptable to use dm and m.
That’s it! Our model data will plot correctly now.
Sources
The majority of GRIB output data is available from supercomputer models, such as the ETA model output provided by the National Center for
Environmental Prediction near Washington DC. Sources of data include:
ftp://140.90.88.142
http://weather.noaa.gov/pub/SL.us008001/ST.opnl/
Choose the .grl directories. Within these, try to choose the smallest datasets, as even the smallest ones will contain a vast amount of data. The
larger ones may crash Digital Atmosphere. A good dataset usually ends
in awp211. These are GRIB sets but will not have a *.grb extension. To
get them to show up you will need to change the filetype to “AWIPS” or
“all” when choosing a GRIB file to import.
http://nomad3.ncep.noaa.gov/
New as of 2006
http://www.globalmarinenet.net/grib.htm
http://www.ecmwf.int/products/realtime/d/gts/essential/
New NWS GRIB filename convention
Since 2002, the NWS has used a hierarchichal naming convention that
forms a URL. An example is:
http://weather.noaa.gov/pub/SL.us008001/ST.opnl/MT.eta_CY.00/
RD.20031009/PT.grid_DF.gr1/fh.0000_tl.press_gr.awp211
This shows that at the central server location (SL.us008001), one can find
operational status data (ST.opnl) consisting of the Eta 00Z cycle model
(MT.eta_CY.00) produced on 09 Oct 2003 (RD.20031009). Within this one
can find GRIB data (PT.grid_DF.gr1) consisting of data for the 00h forecast hour mapped onto the AWIPS 211 grid (fh.0000_tl.press_gr.awp211).
120
Appendix / GRIB DATA
For more information on this naming convention see
http://www.nws.noaa.gov/datamgmt/filstnd.html (Directory and File
Naming Standards)
and
http://www.nws.noaa.gov/datamgmt/tgftp_file_reference.html (TGFTP
File Reference).
Information on grids is at
http://wwwt.emc.ncep.noaa.gov/mmb/etagrids/
Old NWS GRIB filename convention
The legacy filename format for NWS GRIB data is as follows. Some datasets can still be found in the top-level directory at http://weather.noaa.
gov/pub/ which use this filename convention.
Sample: us008_gf000_02020300_HxXAx
Portions: us008_gfMMM_YYMMDDHH_ADGT
Here is what each field means:
MMM - Model code. Underlined codes are in current use as of February 2002; others are obsolete and are listed only for historical
purposes. 000=Experimental, 010=GlobalWindWave, 039=NGM,
044=SeaSfcTemp, 076=MRFbiascorrected, 077=AVNfcst, 078=MRF,
080=MRF, 081=AVNinit, 082=MRFinit, 083=ETA80km, 084=ETA22km,
085=ETA29km, 086=RUC60km, 089=ETA48km, 094=MRF-T170/L42,
096=AVNfcst-T170/L42, 121=WesternNorthAtlanticwavemodel,
122=AlaskaWatersRegWaveModel, 130=MergeOfRucEtaSpectral.
YYMMDDHH - Year, month, date, and hour - of model start time.
A - GRIB designator - H=WAFS (Family Of Services), Y=AWIPS,
Z=AWIPS.
D - Data type. X=mixture.
G - Grid. A=201 (Nhem/PS), H=213 (US/PS), I=202 (US/PS), J=203
(Alaska/PS), K=204 (Hawaii/MER), L=205 (PuertoRico/PS), M=206
(CentralUS/LAM), N=207 (Alaska/PS), O=208 (Hawaii/MER), P=210
(PuertoRico/MER), Q=211 (US/LAM), R=212 (US/LAM), T=214
(Alaska/PS), U=215 (US/LAM), V=216 (Alaska/PS), X=experimental.
Code following the geographical area means PS=Polar Stereographic,
LAM=Lambert Conformal, MER=Mercator.
Appendix / GRIB DATA
121
T - Timestamp. A=00, B=06 C=12, D=18, E=24, F=30, G=36, H=42, I=48,
J=60, K=72, L=84, M=96, N=108, O=120, P=132, Q=144, R=156, S=168,
T=180, U=192, V=204, W=216, X=228, Y=240. However if “A” (GRIB
designator) is Z (AWIPS), this will instead be A=02, B=03, C=04, D=08,
etc.
Note that Digital Atmosphere will only process grids mapped in lat/long,
polar stereographic, and lambert conformal projections
Documentation
Documentation for the GRIB format includes:
http://www.nws.noaa.gov/dataprod.html
http://205.156.54.206/oso/ftpgenl.shtml
http://zephyr.unl.edu/grids/
http://www.ncep.noaa.gov/NCO/PMB/docs/on388/tablea.html
MMM model codes
http://www.ncep.noaa.gov/NCO/PMB/docs/on388/tableb.html
Grids with pole point listings
http://www.comet.ucar.edu/strc/data/model_data_summaries/
Lists grids w/ images and model codes in current use
http://www.comet.ucar.edu/strc/data/model_data_summaries/
osoname.html
GRIB naming conventions
http://dss.ucar.edu/docs/formats/grib/gribdoc.pdf
Complete documentation
http://weather.unisys.com/wxp/Appendices/Formats/GRIB.html
More documentation
http://weather.unisys.com/wxp/File/Model_Name.html
http://www.cgd.ucar.edu/cms/eaton/cf-metadata/ECMWF.html
122
123
APPENDIX
Scheduler scripting
Scripting is a powerful function that allows Digital Atmosphere to do various
tasks while unattended. You can have it download data every half hour and
always have the latest map displayed, or send charts to the printer automatically. The possibilities are up to you.
Scripting basics
To run a single script command
Simply type in the script command in the “command” line on the scripts
toolbar. Hit return or click “Enter” and it will be processed. Note that
this does not run a script; it just runs a script command. A list of commands is below.
To write a script
Use any text editor or click on Create Script on the scripts toolbar and
you can begin typing your script. Note that scripts should use the file
extension .dsf in order to be properly recognized in Digital Atmosphere.
To “comment out” a line of code simply place a # (octothorpe), : (colon),
or ; (semicolon) at the beginning of the line. Commands are generally not
case-sensitive.
To run a script in run-time
Go to the scripts toolbar and select the Run Script button.
To run a script at startup
Advanced users can run scripts on Digital Atmosphere startup by using
standard command-line parameters. A space and the full name of the
script file is simply appended after the filename at the command prompt
or in the shortcut property for Digital Atmosphere.
To use the scheduler
Go to the scripts toolbar and select the Scheduler button (it will say
“Scheduler on...” or “Scheduler off...”). This will bring up a configuration
window (see below) where the scheduler will coordinate which script
files run at which time.
You must set “Enable scheduler” for the scheduler to take effect.
124
Appendix / SCHEDULER SCRIPTING
When the scheduler is no longer wanted, bring up this window again
and unset “Enable scheduler”.
To specify the execution time for each script, write the execution time
in 4-digit UTC time in hhmm format (i.e. 7:45 am is 0745 and 2:15 pm
is 1415), followed by a space, and the name of the file (including its .dsf
extension).
Be sure to specify the full pathname of the file, otherwise Digital Atmosphere will assume it is located in your Digital Atmosphere directory.
There can be an unlimited number of scripts and execution times in this
list.
Advanced users: You can edit or swap out this schedule list if you wish;
it’s located in the Digital Atmosphere directory under digatmos.sft .
Valid script commands
DATA DISPLAY COMMANDS
PRODUCT,type,level,title
Overlays a meteorological product on the map. The appropriate data
must have already been imported. Valid type parameters are documented at the end of this section. Levels are specified as follows: for surface
data, the level is 0 (zero); for millibar levels the level equals the millibar
level (500, etc); and for FT height levels the level equals the ten-thousands and thousands digits multiplied by -1 (so 34,000 ft equals -34). The
title parameter is optional and contains a text title that will be placed in
the legend. Derived fields are not supported at this time.
ANALYZE,scriptstring
Performs an analysis using an analysis script command. For information
on building an analysis script command please see the Analysis section.
FONTTRUETYPE
Forces workchart fonts to TrueType mode. Takes effect when new products or contours are displayed.
FONTNCEP
Forces workchart fonts to NCEP raster font mode. Takes effect when
new products or contours are displayed.
SFCPLOTMODEL,filename
Loads a particular surface plot model. Filename must be the fully qualified filename with path and extension (*.sps).
Appendix / SCHEDULER SCRIPTING
125
DATA MANAGEMENT COMMANDS
DOWNLOAD,url,filename
Downloads a product from an Internet source. The url is the fully qualified, RFC 1738 standard URL (including filename), and filename is the
full local name where the file will be stored.
Example: download,ftp://userid:[email protected]/anonftp/
pub/out.jpg,c:\da20\bin\map\in.jpg
UPLOAD,url,filename
Uploads a product to an Internet source. The url is the fully qualified,
RFC 1738 standard URL (including filename), and filename is the full local name of the file to be uploaded.
Example: upload,ftp://userid:[email protected]/anonftp/
pub/out.jpg,c:\da20\bin\map\out.jpg
Note that you can set a password privately by using the DIGATMOS.
PWD file (if there isn’t one, you may create it). This will make your
scripts secure and prevent passwords from showing up in the status
windows. This file must be located in the Digital Atmosphere directory.
Make entries as follows:
token=value
So if you have a login for your blog site, you might have something like
this in your DIGATMOS.PWD file:
myusername=joeblow
mypassword=12341234
When Digital Atmosphere encounters %%something%% in your URL, it
will replace it with the values you defined in DIGATMOS.PWD. Thus, in
the example above %%myusername%% would get replaced with joeblow, and %%mypassword%% would get replaced with 12341234.
INGEST,filename
Imports the specified data file (filename is a fully qualified file name).
RADAR COMMANDS
RADAR,product,station
Retrieves the desired radar product from the given station. Station is
a 3-letter station identifier (e.g. FWS, EWX, etc). Multiple stations are
separated by one space character. Product is the Radar Product Code
from the table below.
RADARPLOT
126
Appendix / SCHEDULER SCRIPTING
Plots the latest retrieved radar data.
RADARSAVE,filename
Saves the latest retrieved radar data to a given filename.
IMPORTRADAR
Imports an imagemap radar, using parameters selected in Radar > Import Radar Images.
DERIVED PRODUCT COMMANDS
HURRICANE
Imports hurricane bulletins.
HURRMODEL,type
Plots hurricane models. The type is as follows: 0, splines only; 1, splines
and datapoints; 2, splines, datapoints, and labels.
FLEET
Plots all fleetcode information.
FLEETHL
Plots fleetcode bulletins with only highs and lows.
FLEETF
Plots fleetcode bulletins with only fronts.
FLEETI
Plots fleetcode bulletins with only isobars.
GRAPHICS COMMANDS
LOAD,filename
Loads a map. IMPORTANT: You must specify the .dmf file in your filename, e.g. c:\da20\bin\mymap.dmf . The associated map will also be
loaded.
SAVE,filename
Saves a map. The filename parameter is the fully qualified filename without the extension (i.e. without .bmp).
EXPORT,filename
Exports a map (i.e. saves it to a variety of formats and without the
accompanying .atr file). The filename parameter is the fully qualified
Appendix / SCHEDULER SCRIPTING
127
filename with a valid extension (may be bmp, gif, jpg, png, pcx, or tif).
Compressed TIFF saving is not available.
IMPORT,filename
Imports a map.
SOUNDING,station
Plots a sounding for the given station.
ERASE
Erases all of the overlays on the map.
BLANK
Erases the overlays as well as the basemap.
STAMP
Imprints a timestamp at the top of the map that says “GENERATED
(date) (time)”.
CLIP
Copies the map to the clipboard.
GRADIENTCOLOR,red|blue|green,ph1|ph2|scale|offset,value
Sets one of the File > Preferences > Misc > settings to a particular value.
This allows the script to change a contour gradient scheme on the fly.
PROGRAMMING COMMANDS
SET,keywordnumber,keyword
Sets a specified keyword (1 through 9) to a certain value. You can then
use this keyword later on in the same script simply by placing the token
$$x anywhere in the code, where x is the keywordnumber. This is useful
for managing large scripts.
Example:
SET 1 500 Sets keyword 1 to “500”
PRODUCT $$1 HGT $$1 indicates “500”, so here 500 mb heights are plotted
PRODUCT $$1 TMP $$1 indicates “500”, so here 500 mb temperatures
are plotted
TIMERON
Enables the script timer. It will adhere to the current timer script schedule.
128
Appendix / SCHEDULER SCRIPTING
TIMEROFF
Turns off the script timer.
PRINT
Prints the map to the default printer using default settings.
SLEEP,seconds
Causes Digital Atmosphere to pause for the specified number of seconds.
An hourglass cursor will be displayed during this time.
SPAWN,filename
Executes an executable file or MS-DOS batch file specified by filename
(must be a fully qualified filename with correct path; e.g. “c:\utilities\
myprogram.exe”).
MINIMIZE
The Digital Atmosphere application window is minimized.
MAXIMIZE
The Digital Atmosphere application window is maximized.
NORMAL
The Digital Atmosphere application window is neither minimized nor
maximized.
QUIT
Quits the program
MAPMAKING COMMANDS
MAKE,lat,long,zoom,width,height
Makes a map using the given coordinates. Lat is negative in the southern hemisphere. Long is negative in the western hemisphere. Zoom is a
value equal to 3964/x, where x is the width of the map in statute miles.
Width and height are the map sizes in pixels.
TOPO
Makes a topographic underlay on the map (takes some time).
POINT
Plots points.
BASEMAP
Plots the basemap.
Appendix / SCHEDULER SCRIPTING
129
CITY
Plots cities.
COOUT
Plots county outlines.
CONAME
Plots county names
HIGHWAY
Plots Interstate highways (U.S. only).
ROAD
Plots major roads (U.S. only).
CUSTOM
Plots custom overlays.
REMOVE
Removes the last product from the display.
DEPRECATED COMMANDS
These commands are not supported in the Equinox version and beyond.
CENTER,station,zoom,width,height
Makes a map with the chosen station in the center of the screen. Zoom is
a value equal to 3964/x, where x is the width of the map in statute miles.
Width and height are the map sizes in pixels.
ARCHIVE,cddriveletter,yymm,yymmddhh
Accesses data from the Weather Graphics Technologies Surface Archives
or Upper Archives CD-ROM. The cddriveletter parameter is the drive
letter, while yymm is the year and month (full four digits) and yymmddhh is the year, month, date, and hour (full eight digits). Caution: This
command has not been fully tested and may not work.
GRADIENT,on|off
Turns on or turns off the File > Preferences > Contours > option.
ISOPLETH,on|off
Turns on or turns off the File > Preferences > Contours > option.
130
Appendix / SCHEDULER SCRIPTING
Valid product types
For a list of valid codes, see the appendix showing Valid Product Types.
Sample scripts
This script downloads synoptic data from Albany, imports it, displays
plots and sea level pressure, and outputs it to a file. Note that this will
probably not work on your computer without changes, and is only intended to demonstrate the appearance of script commands.
download,http://www.atmos.albany.edu/weather/data1/
surface/syn/@Y@M@D@S_syn.wmo,c:\digatm\data\test.dat
import,c:\digatm\data\*.*
product,plf,0,Test plot
product,slp,0,Test plot
export,d:\da20\bin\map\out.jpg
This script plots a series of upper air charts for 1200 UTC August 27, 1990
from our Upper Archives CD-ROM and saves the completed charts for
250 mb, 500 mb, 700 mb, and 850 mb to individual files (1990082712250.
gif, etc). Again this may not work on your computer without some
changes.
set,1,9008
set,2,90082712
archive,f,$$1,$$2
product,plf,250,PLOT
export,d:\da20\bin\shannon\19$$2250.gif
erase
product,plf,500,PLOT
export,d:\da20\bin\shannon\19$$2500.gif
erase
product,plf,700,PLOT
export,d:\da20\bin\shannon\19$$2700.gif
erase
product,plf,850,PLOT
export,d:\da20\bin\shannon\19$$2850.gif
131
APPENDIX
Analysis scripting
Analysis scripting is slightly different from scheduler scripting. While scheduler scripts are designed to accomplish tasks in Digital Atmosphere such as
accessing data, displaying fronts, and so forth, the analysis script language
is based solidly on logic and mathematics, and is meant to build display
products in a very flexible manner. (Note that you can run any analysis script
command in a schedule script by using the ANALYZE command.)
Scripting locations
A script is made up of a group of commands on one line. There are two
ways of executing a script:
(1) On the command line (in the Toolbox under the Scripting tab).
(2) In the DIGATMOS.MNU file, which is used to build the Analysis
dropdown menu. This may be edited by hand. The pipe, |, symbol is
used to separate the title from the script form and may be placed anywhere between the two providing it is padded with spaces only. The
Standard version is limited to 50 defined script commands; the Professional version is unlimited.
Command sentences
A sentence of analysis script code follows the strict order:
[output] [transform] [base] [setup]
(1) Digital Atmosphere processes the script from RIGHT TO LEFT , so
that any optional setup is done (such as setting the level), then defining
the base field to be worked on (such as temperature), then transforming
(such as converting m/s to kts), then producing output (such as setting a
contour interval and then displaying contours. Deviation from this form
may cause unpredictable results.
132
Appendix / ANALYSIS SCRIPTING
(2) Users must be vigilant as to whether a scalar or vector field is being processed. For example, CONT WIND will result in a nonsensical
output, because wind is a vector field and cannot be contoured (you
can streamline it, but that command hasn’t been provided yet). To view
wind speed, you will need to extract a magnitude by using CONT WSPD
(contour windspeed) or using a vector-to-magnitude function (which has
not been provided yet).
(3) The active level is always taken from the Active Level setting on the
toolbar. It can be overridden using a Setup command. The same is true
for data Time settings.
(4) Multiple fields are handled by using the output form to write a field
to a slot, such as STOR=5 to store the result in slot 5. Various transformations which depend on a field number, such as SDIF (scalar difference),
are supplied with two field slots with which to read.
(5) Commands can be strung together to produce multiple fields. Currently there is a limit of 255 characters to a script command.
(6) Suggestions for transformation commands, output commands,
operators, and so forth are greatly welcomed at this time. Much more is
planned; this is only a start! For an idea of what is possible see the PCGRIDDS documentation at http://www.lib.noaa.gov/pcgridds/appendix.
html#C
(7) Scripts are not case-sensitive.
Examples
CONT CINT=4 SLPR
Explanation: Take the sea level pressure field. Set the contour interval
to 4. Now contour it. Note that the color is not set, so the result color is
unpredictable. Also the level is not set, so if the current height setting is
500 mb, an invalid fieldwill result.
DATA VKNT WSPD
Explanation: Take the wind speed field (which will be in m/s). Convert it
to knots. Now view it as a numerical grid.
CONT CINT=60 DASH COLOR=200,0,0 SDIF=1,2 STOR=2 HGHT H000
STOR=1 HGHT H500
Explanation: Take the 500 mb height field. Store it in slot 1. Take the 1000
mb height field. Store it in slot 2. Compute a difference between field 1
Appendix / ANALYSIS SCRIPTING
133
and2.Nowsetthepencolorto200,0,0(lightred,i.e.red=200,green=0,blue=0.
Set lines to dashed, and set a contour interval of60. Nowcontour theresult. This produces the1000-500 mb thickness.
For other examples please open the DIGATMOS.MNU file and study the
examples provided. They drive the Analysis dropdown menu.
Summary of commands
SETUP
HSFC
H000
H925
H850
H700
H500
H400
H300
H250
H200
H150
H100
Set
Set
Set
Set
Set
Set
Set
Set
Set
Set
Set
Set
level
level
level
level
level
level
level
level
level
level
level
level
to
to
to
to
to
to
to
to
to
to
to
to
surface
1000 mb
925 mb
850 mb
700 mb
500 mb
400 mb
300 mb
250 mb
200 mb
150 mb
100 mb
Analysis method: if not specified, setting in
Preferences > Analysis will be used
ANLN Sets analysis method to Nearest Neighbor
ANLW Sets analysis method to Weighted
ANLC Sets analysis method to Cressman
ANLB Sets analysis method to Barnes
BASE FIELDS
TEMP
THTA
DWPT
RELH
BULB
MIXR
HIDX
HGHT
GHGT
THTE
K)
PTEN
WCHL
HIDX
Temperature (deg C)
Theta, or potential temperature (deg K)
Dewpoint (deg C)
Relative humidity (%)
Wet bulb temperature (deg C)
Mixing ratio (g/kg)
Heat index (deg F)
Geopotential height (m)
Geostrophically balanced height field (m)
Theta-e, or equivalent potential temperature (deg
Reported pressure tendency
Wind chill (deg F)
Heat index (deg F)
134
Appendix / ANALYSIS SCRIPTING
HUMX Humidex (deg C)
WSPD Wind, speed (m/s)
WIND Wind, vector (m/s) (referenced to true north)
WDRC Wind, direction (deg)
UGRD Wind, west-to-east component (m/s) (referenced to
true north)
VGRD Wind, south-to-north component (m/s) (referenced to
true north)
HGHT Geopotential height (m)
SLPR Sea level pressure (QFF) (mb)
ALST Altimeter setting (QNH) (in Hg)
PRES Pressure (mb) (used for upper-level heights)
LATT Latitude (deg)
LONG Longitude (deg)
ELEV Elevation (m)
TSEA Temperature, sea-surface (deg C)
PC01 Precipitation (1 hr)
PC02 Precipitation (2 hr)
PC03 Precipitation (3 hr)
PC06 Precipitation (6 hr)
PC09 Precipitation (9 hr)
PC12 Precipitation (12 hr)
PC15 Precipitation (15 hr)
PC18 Precipitation (18 hr)
PC24 Precipitation (24 hr)
PCXX Precipitation (unknown time period; used in
Australian AXF data)
WSWP Wave period (sec)
WSWH Wave height (m)
WWWP Wind wave period (sec)
WWWH Wind wave height (m)
WLP1 Sea swell period 1 (sec)
WLP2 Sea swell period 2 (sec)
WLH1 Sea swell height 1 (m)
WLH2 Sea swell height 2 (m)
WLD1 Sea swell direction 1 (screen relative)
WLD2 Sea swell direction 2 (screen relative)
TRANSFORMATIONS
VKNT m/s to kt
VMPH m/s to mph
VKMH m/s to km/h
DEGF deg C to deg F
MAGN Magnitude of a vector field (produces speed for a
wind field)
DVRG Divergence of a vector field
RVRT Relative vorticity of a vector field (pure; used
mainly at surface)
AVRT Absolute vorticity of a vector field (adds Earth’s
rotation; used for upper air)
SMTH Apply Haltiner smoother
Appendix / ANALYSIS SCRIPTING
135
SMTP=[number] Allow this number of smoothing passes
(default 1)
SMTC=[number] Set smoothing coefficient (0 to 1 only)
(default 0.5)
SSUM=[f1,f2] Calculates sum of fields f1 and f2
SDIF=[f1,f2] Calculates difference of fields f1 and f2
SAVG=[f1,f2] Calculates average of fields f1 and f2
SMLT=[f1,f2] Calculates product of fields f1 and f2
SDVD=[f1,f2] Calculates quotient of fields f1 and f2
SADC=[f1,#] Calculates sum of field f1 and any number #
SSBC=[f1,#] Calculates difference of field f1 and any
number #
SMLC=[f1,#] Calculates product of field f1 and any
number #
SDVC=[f1,#] Calculates quotient of field f1 and any
number #
OUTPUT
* UNIVERSAL OUTPUT COMMANDS
COLOR=r,g,bSetdrawcolortocolorr=red,g=green,b=blue (each
is 0-255)
STOR= nStorefieldin slot n (1-9)
* SCALAR OUTPUT COMMANDS
DATA Data grid values
CONT Contour (defaults to contour interval of 1)
VAON Allow plotting of numeric values below minimum/
maximum (default)
VAOF Prohibit plotting of numeric values below minimum/
maximum
NMCY Plot highs and lows in special NMC font (default is
according to Preferences > Analysis)
NMCN Plot highs and lows in standard font (default is
according to Preferences > Analysis)
HILO Plots H or L above data at gridpoint maximum/
minimum
HIID Plots H above data at gridpoint maximum
LOWD Plots L above data at gridpoint minimum
MXMN Plots H or L above data at gridpoint maximum/
minimum
MAXD Plots H above data at gridpoint maximum
MIND Plots L above data at gridpoint minimum
DVCV Plots H or L above data at gridpoint maximum/
minimum
DVVD Plots H above data at gridpoint maximum
CVVD Plots L above data at gridpoint minimum
PLMN Plots H or L above data at gridpoint maximum/
minimum
PLLD Plots H above data at gridpoint maximum
136
Appendix / ANALYSIS SCRIPTING
MNND Plots L above data at gridpoint minimum
OVER Overlay basemap translucently (good for fills)
CINT=[number] Contour interval (must be an nonzero
positive number)
GRTN=[number] Contours or fills greater than this number
LSTN=[number] Contours or fills less than this number
EQUA=[number] Plot a contour equal to this number
LINE=[number] Set line width (must be nonzero positive
integer)
FILL Fill using fill color
SOLD Plot contours as solid line
DASH Plot contours as dashes
DOTS Plot contours as dots
DADO Plot contours as dash-dot
DADD Plot contours as dash-dot-dot
FILL Perform a floodfill
FILS=[number] Set fillstyle to one of the following
(must appear to right of FILL command): 0, Solid
(default); 1, Cross; 2, Diagonal cross; 3, Diagonal
1; 4, Diagonal 2; 5, Horizontal stripes; 6, Vertical
stripes
* VECTOR OUTPUT COMMANDS
BARB
BKNT
BMPH
BKMH
VECT
STRM
Wind barbs (m/s)
Wind barbs (m/s shown as kt)
Wind barbs (m/s shown as mph)
Wind barbs (m/s shown as km/h)
Vector grid
Streamline
Appendix / ANALYSIS SCRIPTING
137
Shown below is the default content that ships with Digital Atmosphere.
Note that some lines may wrap onto the next line in this Help Viewer; this
should not be done in the actual file.
Default contents of digatmos.mnu (Default analysis menu)
# DIGITAL ATMOSPHERE MENU COMMANDS
#
# The Standard Version is limited to a maximum of 100 menu commands.
# The Professional Version does not have any limits.
#
# Do not create more than 20 main categories
#
# SPECIAL TITLE SUFFIXES
# %1 = Marks the sea-level pressure analysis for toolbar shortcut SLP
# %2 = Marks the temperature (C) analysis for toolbar shortcut DEG C
# %3 = Marks the temperature (F) analysis for toolbar shortcut DEG F
#
Temperature
Temperature (deg C) %2 |CONT CINT=2 COLOR=200:0:0 DASH TEMP
Temperature (deg F) %3 |CONT CINT=5 COLOR=200:0:0 DASH DEGF TEMP
Potential temperature (deg K) |CONT CINT=1 COLOR=200:100:0 DOTS THTA
Wind chill (deg F) |CONT CINT=5 COLOR=0:0:200 DOTS WCHL
Wind chill (deg C) |CONT CINT=5 COLOR=0:0:200 DOTS DEGC WCHL
Max temperature 6 h (deg F) %3 |CONT CINT=2 COLOR=200:0:0 DASH DEGF TX06
Min temperature 6 h (deg F) %3 |CONT CINT=2 COLOR=200:0:0 DASH DEGF TN06
Max temperature 24 h (deg F) %3 |CONT CINT=2 COLOR=200:0:0 DASH DEGF TX24
Min temperature 24 h (deg F) %3 |CONT CINT=2 COLOR=200:0:0 DASH DEGF TN24
Moisture
Dewpoint (deg F) |CONT CINT=5 COLOR=0:150:0 DEGF DWPT
Relative Humidity (%) |CONT CINT=5 COLOR=50:150:0 RELH
Mixing Ratio (g/kg) |CONT CINT=1 COLOR=0:100:0 MIXR
Theta-e (deg K) |CONT CINT=2 COLOR=0:50:150 THTE
Heat Index (deg F) |CONT CINT=5 COLOR=0:0:50 HIDX
Humidex (deg C) |CONT CINT=5 COLOR=0:0:50 HUMX
Wet bulb temperature (deg C) |CONT CINT=5 COLOR=0:50:50 BULB
Colored dewpoint (deg F) |CONT EQUA=60 COLOR=0:0:0 LINE=3 CONT
GRTN=60 CINT=2 COLOR=0:0:200 LINE=1 CONT LSTN=60 CINT=2 COLOR=200:0:0 LINE=1 DEGF
DWPT
Pressure
Sea level pressure (mb) %1 |HILO CONT CINT=5 LINE=5 SLPR
Pressure (isentropic) |CONT DATA CINT=10 PRES
Pressure tendency |CONT CINT=2 PTEN
Altimeter setting (in Hg) |HILO CONT CINT=0.05 ALST
500 mb height (m) |cont cint=60 color=80:80:140 hght h500
Height (m) |CONT HGHT
Balanced height field (m) |CONT LINE=3 CINT=60 COLOR=0:0:0 GHGT
1000-500 mb thickness (m) |CONT CINT=60 DASH COLOR=200:0:0 SDIF=1:2
STOR=2 HGHT H000 STOR=1 HGHT H500
Wind
Wind speed (barbs) (kt) |BKNT COLOR=0:0:200 WIND
Wind speed (vectors) |VECT COLOR=0:0:200 WIND
Streamlines |STRM WIND
Wind speed (kt) |CONT COLOR=0:200:0 VKNT WSPD
Wind shading (upper level) (kt) |OVER FILL COLOR=200:100:200 FILS=0
GRTN=110 VKNT WSPD FILL COLOR=200:100:100 FILS=0 GRTN=90 VKNT WSPD FILL COLOR=200:200:100 FILS=0 GRTN=70 VKNT WSPD FILL COLOR=100:200:100 FILS=0 GRTN=50
VKNT WSPD
Geostrophic wind (barbs) |BARB GEOS SMTH GHGT
Absolute vorticity |MXMN CONT LINE=2 CINT=2 COLOR=250:50:50
138
Appendix / ANALYSIS SCRIPTING
SMLC=1:100000 STOR=1 AVRT WIND
Relative vorticity |MXMN
SMLC=1:100000 STOR=1 RVRT WIND
Abs vorticity of geos wind |CONT
SMLC=1:100000 STOR=1 AVRT GEOS SMTH GHGT
Divergence (10^-6 s) |CONT
STOR=1 DVRG SMTH WIND
Temperature advection |CONT
Precipitation (inches)
1 hr |CONT
2 hr |CONT
3 hr |CONT
6 hr |CONT
9 hr |CONT
12 hr |CONT
15 hr |CONT
18 hr |CONT
24 hr |CONT
CONT CINT=2 COLOR=250:50:50
CINT=2 DOTS COLOR=200:0:0
MXMN CINT=5 SMTH SMLC=1:1000000
CINT=0.1 ADVT TEMP/WIND
CINT=0.05 MMIN
CINT=0.05 MMIN
CINT=0.05 MMIN
CINT=0.05 MMIN
CINT=0.05 MMIN
CINT=0.05 MMIN
CINT=0.05 MMIN
CINT=0.05 MMIN
CINT=1 PC24
PC01
PC02
PC03
PC06
PC09
PC12
PC15
PC18
139
APPENDIX
Analysis theory
This technical section is designed to document the numerical analysis methods used by the Weather Graphics Technologies software product Digital
Atmosphere. It is intended to provide a basis for academic and operational
understanding of the algorithms used for Digital Atmosphere contouring
and objective analysis.
General description
Domain
Currently, the analysis domain is a floating (fixed to the screen window)
gridpoint model fixed at a size of 30 x 30 in the x and y direction (900
points). This scheme was chosen because the vast majority of objective
analysis operations are performed with on-screen results in mind. Since
the pixel size of a window rarely exceeds 1200 x 1200 pixels, this allows
for 40 x 40 pixels within each grid box. This is close to the minimum
level of meaningful on-screen data for most users. Therefore it has not
been anticipated that it is necessary to boost the analysis domain beyond 30 x 30 gridpoints, and we have received few such requests. Each
objective analysis is an operation that starts completely from scratch each
time, therefore there are no complicating factors involved in moving the
screen window to a different part of the world. The floating domain
simply moves to whatever geographic area is displayed and is not used
until an analysis is requested.
Entry
When a field is chosen for analysis or contouring, Digital Atmosphere
enters the contouring module through the GenerateContour function.
Here it is first determined whether a scalar or vector field must be calculated.
— If it is a scalar field, program flow goes directly to ObjectiveAnalysis.
— If it is a vector field, ObjectiveAnalysis is called for each component of
the analysis (i.e. for wind calculations, a calculation is done on the U and
then the V wind component).
Following this objective analysis, a contouring or grid plotting routine
is called to display the data. The workings of this routine will not be
discussed in this paper.
140
Appendix / ANALYSIS THEORY
Processing functions
ObjectiveAnalysis
Upon entry of this function, BuildWeatherDataFile and Build2DGrid
are called in succession (and if height calculations are involved and the
user prefers Geostrophic Heights in Preferences > Analysis, the CalculateHeights function is called). The module aborts if there are 5 or less
observations in the domain (i.e. not enough data).
Otherwise, the Preferences > Analysis panel is checked to see which objective analysis scheme is desired:
— For Nearest Neighbor method: Expand is called, followed by one
HaltinerSmooth iteration, resulting in a crude but efficient objective
analysis.
— For Weighted method: Weighted is called.
— For Barnes method: Barnes is called.
— For Cressman method: Cressman is called.
Following the objective analysis, regardless of type, Expand is called to
make sure there are no null gridpoints. This is necessary because some
gridpoint locations may reside at a distance from the nearest observation
that far exceeds a, which itself is often used to establish the maximum
radius of weighting.
At this point, regardless of the analysis scheme, the Smoothing Passes
value is obtained from the Preferences > Analysis panel, and the corresponding number of HaltinerSmooth iterations are performed. The
primary purposes this serves is to smooth out remote gridpoints filled by
the final Expand function pass.
BuildWeatherDataFile
This function constructs a Domain Data File (filename OUTPUT.UX0).
This is different from the Processed Data File (OUTPUT.*) in that every
observation is applicable to the on-screen analysis window, matching the
domain and the chosen date/time. Data outside the on-screen analysis
window is discarded.
Build2DGrid
This function uses the Domain Data File constructed in BuildWeatherDataFile to map the data to a two-dimensional grid. For each observation point, the latitude and longitude is evaluated in respect to the screen
window (the domain available to the user in a screen window). The
Appendix / ANALYSIS THEORY
141
observation is assigned a real-number x coordinate (x=0..30) and y coordinate (y=0..30) as follows:
xk = x / xm * 30
yk = y / ym * 30
where
x,y is the coordinate of the observation on the screen map in pixels
xm,ym is the size of the map in pixels
xk,yk is the coordinate of the observation in grid units (0..30)
Then, the appropriate observation parameter is determined, using the
value only if valid data for the parameter is present in the observation.
The station pressure p was determined in the BuildWeatherDataFile unit.
— Temperature, dewpoint, sea-level pressure, altimeter setting, wind
speed, height. The value is used verbatim. A conversion to metric units
may be accomplished.
— Wind components. Background maps are never displayed in Cartesian coordinates, therefore it is necessary that the declination for a
given station be obtained. If a wind component is to be calculated (for
any wind operation), the wind declination relative to the map is rectified through the WindDeclinationCorrect function. This angle, q, is the
declination produced by plotting a point 300 miles north of the station
through a forward coordinate transformation (allowing flexibility if
another coordinate transformation is in use, and preventing the need to
devise reverse coordinate transformations) . From there, it is a simple
matter to calculate wind component (u,v), as follows:
u = -1 * sin(q) * V
v = -1 * cos(q) * V
where V is the wind velocity.
— Relative humidity. Calculated according to fk = MixingRatio(Td,p) /
MixingRatio(T,p).
— Wet bulb temperature. Calculated according to WetBulb(T,Td,p).
— Heat index. Calculated according to HeatIndex(T,Td,p).
— Humidex. Calculated according to Humidex(T,Td).
— Equivalent potential temperature. Calculated according to
EqPotTemp(p,T,Td).
— Potential temperature. Calculated according to PotTempK(p,T).
— Precipitation type. Freezing rain is triggered by ww values of 56, 57,
66, or 67. Ice pelleters are triggered by ww values of 79, 87, 88, or 89.
Snow is triggered by ww values of 70-75 and 83-86. Rain is triggered by
ww values of 50-55, 60-65, 58, 59, 68, 69, or 80-84.
— IFR/MVFR. MVFR conditions are triggered by ceiling less than 3000 ft
or visibility less than 8046 meters. IFR conditions are triggered by ceiling
less than 1000 ft or visibility less than 4828 meters. LIFR conditions are
triggered by ceiling less than 500 ft or visibility less than 1600 meters.
142
Appendix / ANALYSIS THEORY
Objective analysis functions
Nearly all of these algorithms use a smoothing coefficient, s, of the range
(0..1) which is obtained directly from the Preferences > Analysis panel.
This smoothing coefficient is used by the smoothing operators to remove
unnecessary noise which would be otherwise evident in the data field.
The Barnes and Cressman algorithms also depend on the average station spacing, a. This may be computed automatically by setting the
Preferences > Analysis > Automatic Smoothing checkmark to checked.
A manual value may be specified by setting the above checkmark to
unchecked, and the algorithms will use the values specified in Surface
Radius or Upper Radius.
Nearest Neighbor analysis
The Nearest Neighbor method is a crude algorithm designed for brute
speed. Each observation is simply mapped to the nearest gridpoint,
overwriting any previous values that exist for that gridpoint. Empty
gridpoints are filled using an Expansion operator that nudges data from
filled to void areas (see Expand). Then one pass of the HaltinerSmooth
operator (q.v.) is performed to remove noise from the field, using whatever smoothing coefficient has been chosen by the user in the Preferences
> Analysis panel.
Weighted analysis
This is a single-pass objective analysis that simply uses distance-dependent values of observations. Then values at each observation point fk
are used to produce a weighted average for fx,y. NOTE: If the user has
selected automated station spacing, then a = a * 1.333. The source of this
analysis scheme is not known at this time.
The algorithm operates by iterating through all 900 gridpoints (x,y). At
each gridpoint, each observation fk is examined. Only those observations
whose distance is less than a from (x,y) are considered. A distance-dependent weighting coefficient is calculated for each observation fk. The
value dk is the distance between gridpoint fx,y and observation fk in units
of a; therefore dk/a = (0..1). It can be seen that the negative w term forces
the expected inverse relationship of distance to weight.
fx,y = S(k=1..n) (fk * -wk ) / S(k=1..n) wk
where wk = (a2 - dk2) / (a2 + dk2)
Barnes analysis
The Barnes analysis scheme (Barnes, 1964) is considered to be a refinement of the Cressman method. It uses a one-pass scheme, rather than
successive iterations, to achieve convergence of the analysis field. NOTE:
Appendix / ANALYSIS THEORY
143
If automatic smoothing is enabled, the average station spacing value is
set to a = a * 1.333.
Only observations which fall within a rather large area of influence, a3,
are considered. The value dk is the distance between gridpoint fx,y and
observation fk in units of a; therefore dk/a = (0..1). The distance-dependent
weighting coefficient and the summation to produce a first guess of gridpoint data value fx,y are as follows:
fx,y = S(k=1..n) (fk * exp(-wk)) / S(k=1..n) wk
where wk = dk2 / a2
At the completion of the above first-guess calculations, a difference pass
is executed to compare the “error” of each actual data value fk against its
interpolated predicted value pk within the objectively analyzed field. The
value ik and jk will refer to the fractional coordinate (0..1) of the observation within its surrounding objective analysis grid box of (x..x+1) and (y..
y+1). The calculations are done as follows:
pk = [ (((fx+1,y-fx,y)*ik)+fx,y) + (((fx+1,y+1-fx,y+1)*ik)+fx,y+1) + (((fx,y+1-fx,y)*jk)+fx,y) +
(((fx+1,y+1-fx+1,y)*jk)+fx+1,y) ] /4
The “error” of each data value fk against its predicted value pk is determined through simple subtraction.
ek = fk - pk
Using this “error” information, a final pass is made which uses the above
difference to correct the objective analysis field. Again, dk is the distance
between gridpoint fx,y and observation point dk in units of a. Gamma, g,
((0..1), usually 0.3) is obtained from the Analysis settings panel. Using
the weighting coefficient w, an “error” value for each gridpoint, zx,y, can
be calculated as follows.
zx,y = S(k=1..n) (ek * exp(-wk)) / S(k=1..n) wk
where wk = dk2 / a2 / g
Finally, the “error” field is added to the first-guess field to generate a corrected field, yielding a completed objective analysis.
fx,y = fx,y + zx,y
Cressman analysis
The Cressman objective analysis scheme (Cressman, 1959) is known as
the successive correction method. It achieves its result by forcing convergence of the data to observed, interpolated values using multiple
iterations. NOTE: If automatic smoothing is enabled, the average station
spacing value is set to a = a * 1.333.
First, the number of convergence iterations, p, is established. The value
q originates from the Reduction value specified in the Preferences >
144
Appendix / ANALYSIS THEORY
Analysis panel. The value a is the average station spacing as determined
above.
p=a/q
The predicted value fx,y is calculated for a gridpoint using all observations k=1..n. A distance-dependent weighting factor is determined for
each observation before summing it into the equation. The value dk is the
distance between gridpoint fx,y and observation fk in units of a; therefore
dk/a = (0..1).
fx,y = S(k=1..n) (fk * exp(-wk)) / S(k=1..n) wk
where wk = dk2 / a2
At the completion of the above calculations, a difference pass is run to
compare the “error” of the actual data value fk against its interpolated,
predicted value pk within the objectively analyzed field. The value ik and
jk refer to the fractional coordinate of the observation (0..1) within its surrounding objective analysis grid box of (x..x+1) and (y..y+1). The calculations are done as follows:
pk = [ (((fx+1,y-fx,y)*ik)+fx,y) + (((fx+1,y+1-fx,y+1)*ik)+fx,y+1) + (((fx,y+1-fx,y)*jk)+fx,y) +
(((fx+1,y+1-fx+1,y)*jk)+fx+1,y) ] / 4
The difference between the observation value fk and its predicted value
pk establishes an difference field (an error field) ek in much the same
way as the Barnes method.
ek = fk - pk
Then a final pass is made using multiple observations for each gridpoint.
A distance-dependent weighting coefficient, w, is determined for each
observation point throughout the iterations.
zx,y = S(k=1..n) (ek * -wk) / S(k=1..n) wk
where wk = (a2-dk2) / (a2+dk2)
The difference field or “error” field is then added to the first-guess field
to produce a refined analysis field.
fx,y = fx,y + zx,y
Then the convergence counter value a is decremented by p as shown
below. These values are not processed into the equations; they are only
used to loop the Cressman iterations as necessary.
a=a-p
If a <= 0, the objective analysis is complete and the resulting field fx,y is
valid. Otherwise further convergence is necessary, so that the difference
values of dk are reduced to lower and lower values, resulting in more
Appendix / ANALYSIS THEORY
145
accurate values of fx,y. Program flow cycles back to the difference field
calculations to achieve this.
Numerical operators
HaltinerSmooth
This is a one-dimensional smoothing operator, which is a modified
version of the Haltiner smoothing operator defined in Haltiner (1971).
The smoothing coefficient, s, is obtained from the user-defined value of
(0..1) found in the Preferences > Analysis > Smoothing Coefficient menu.
The value of each gridpoint fx,y is smoothed using iterations in all four
x/y directions as described below in Steps 1-4. This is done to prevent
“smearing” of the fields in a particular direction (something that has
been observed in previous implementations). When this is completed,
the result is a smoothed data field.
1. Positive Y-direction iteration. Iterating from fx,1 to fx,29, stepping
through each value of x (0..30), fx,y is altered as follows:
fx,y = (1-s) * fx,y + ((s * 0.5) * (fx,y-1+fx,y+1)
2. Positive X-direction iteration. Iterating from f1,y to f29,y, stepping
through each value of y (0..30), fx,y is altered as follows:
fx,y = (1-s) * fx,y + ((s * 0.5) * (fx-1,y+fx+1,y)
3. Negative Y-direction iteration. Iterating from fx,29 to fx,1, stepping
through each value of x (0..30), fx,y is altered as follows:
fx,y = (1-s) * fx,y + ((s * 0.5) * (fx,y-1+fx,y+1)
4. Negative X-direction iteration. Iterating from f29,y to f1,y, stepping
through each value of y (0..30), fx,y is altered as follows:
fx,y = (1-s) * fx,y + ((s * 0.5) * (fx-1,y+fx+1,y)
QuickFilter
This fast, two-dimensional smoothing operator is called by certain objective analysis routines. It is essentially a two-dimensional averaging operator that uses 50% self-weight and 50% adjacent weight from neighboring observation values. The filter is iterated through each value of fx,y in
the +y direction for each increment of x as follows:
fx,y = (fx,y * 8 + fx-1,y-1 + fx,y-1 + fx+1,y-1 + fx-1,y +fx+1,y + fx-1,y+1 + fx,y+1 + fx+1,y+1) / 16
If null data or a border area contains an unusable value of f, the value is
not included in the summation total, and the divisor is reduced by one.
Expansion
146
Appendix / ANALYSIS THEORY
The Expansion operator is used by certain objective analysis functions to
systematically fill null gridpoint values by causing any null gridpoint to
assume the value of a neighboring gridpoint which has valid data. This
assignment is done only if fx,y is null and the source gridpoint is not null.
The calculation, which is done in four directions to avoid “smearing” of
the field in a particular direction, is done as follows:
For x = 0..30 do [ for y=0..29 do [ fx,y = fx,y+1 ] ]
For y = 0..30 do [ for x=0..29 do [ fx,y = fx+1,y ] ]
For x = 0..30 do [ for y=30..1 do [ fx,y = fx,y-1 ] ]
For y = 0..30 do [ for x=30..1 do [ fx,y = fx-1,y ] ]
Repeat until there are no instances of fx,y = null
AverageStationSpacing
This is used to determine appropriate filtering values. In this function,
Digital Atmosphere measures the great circle distance between all points
in the domain and all other points in the domain. The result is the average of these values. Therefore if there are n number of observations,
there will be (n-1)2 number of distance measurements which will be averaged (n-1 since the distance from an originating station to itself cannot be
included).
References
Barnes, S. L., 1964: A Technique for Maximizing Details in Numerical
Weather Map Analysis. Journal of Applied Meteorology, 3:396-409.
Cressman, G. P., 1959: An Operational Objective Analysis System.
Monthly Weather Review, 87:367-374.
Haltiner, G. J., 1971. Numerical Weather Prediction, John Wiley & Sons.
_____, and Williams, R. T., 1979: Numerical Prediction and Dynamic
Meteorology. John Wiley & Sons.
Koch, S. E.; DesJardins, M.; and Kocin, P. J., 1983: An Interactive Barnes
Objective Map Analysis Scheme for Use with Satellite and Conventional Data. Journal of Climate and Applied Meteorology, 22:14871503.
Little, C. D.; and Phillips, G. L., 1982: A Method of Analyzing Height and
Vorticity Fields using AFOS. NOAA Southern Region Computer
Programs and Problems NWS SRCP No. 6. 15 pp.
147
APPENDIX
Tabular weather data
Digital Atmosphere is capable of importing observations from a comma-delimited database listing. This is excellent for weather observations exported
out of a database or a spreadsheet. It is also suitable for Australian AXF
weather data.
If recognized as shown below, the data will be imported and available for
viewing as long as it is imported as usual from the data directory or from a
specified file.
The rules for this data are:
* Comma-delimited data only!
* Each line must correspond to one observation
* No extraneous commas are permitted (even within quote marks)
* The observation must contain the station’s latitude and longitude.
* To take advantage of this capability, you need to open the DIGATMOS.
FMT file with a text editor and define the start sequence and the
parameters that apply to that type of data.
Start sequence
You define the start sequence by placing a “start sequence” between
brackets in the DIGATMOS.FMT file; for example if your database starts
out with “Joe’s Data” you should start out with this:
[Joe’s Data]
No database entries are read in until the start sequence is found.
Parameter list
To actually read the data, you will need to create a parameter list, such as
this:
TMP=4
148
Appendix / TABULAR WEATHER DATA
DWP=6
Each entry must be on its own line, and the list ends when the end of the
file is reached or another start sequence is found. The example above indicates that the temperature can be found in column 4 and the dewpoint
can be found in column 6.
Sample listing
Here is a sample of an entry in DIGATMOS.FMT which is used for Australian Bureau of Meteorology AXF data.
[synopData]
ICA=3
WMO=1
LAT=6
LON=7
ELE=9
TIM=5
DAT=4
TMP=22
DWP=23
WND=11
WNM=12
SKY=10
CIG=26
WXX=14
VIS=13
Valid parameters
ICA=xxx ICAO of the station (for display purposes only)
WMO=xxx WMO number of the station (for display purposes only)
LAT=xxx Latitude, in hundreds of degrees (negative is southern hemisphere)
LON=xxx Longitude, in hundreds of degrees (negative is western hemisphere)
LAX=xxx Latitude, in regular format (negative is southern hemisphere)
LOX=xxx Longitude, in regular format (negative is western hemisphere)
ELE=xxx Elevation in meters (used only for potential temperature calculations)
Appendix / TABULAR WEATHER DATA
149
TIM=xxx Time in UTC (expressed as 450 for 4h50m and 1629 for
16h29m)
DAT=xxx Day of month (expressed as “16” for September 16)
TMP=xxx Temperature in degrees Celsius
DWP=xxx Dewpoint in degrees Celsius
WND=xxx Wind direction in degrees true
WNS=xxx Wind speed in knots
WNM=xxx Wind speed in meters/second
SKY=xxx Total sky cover in oktas (9=obscured, 10=not available)
SLP= xxx Sea-level pressure in millibars< FONT face= Courier>
CIG=xxx Ceiling in hundreds of feet
WXX=xxx Weather code; first and second digit equals ww weather code
(e.g. 61 is light rain)
VIS=xxx Visibility in meters
P01=xxx Precipitation total in millimeters (past 1 hr)
P06=xxx Precipitation total in millimeters (past 6 hr)
P12=xxx Precipitation total in millimeters (past 12 hr)
P24=xxx Precipitation total in millimeters (past 24 hr)
PXX=xxx Precipitation total in millimeters (source-defined period; unknown to Digital Atmosphere)
PCP=xxx Precipitation total in millimeters
PCT=xxx Precipitation time period in hours
PTR=x Pressure trend (equals a in app group)
PTN=xxx Pressure tendency (in tens of millibars)
SNO=xxx Snow depth in centimeters
CLL=x Low cloud code
CLM=x Middle cloud code
CLH=x High cloud code
MAX=xxx Maximum temperature, in degrees Celsius
MIN=xxx Minimum temperature, in degrees Celsius
More on Australian AXF data
Information on Australian AXF data can be found here:
http://www.bom.gov.au/nmoc/Obs/IDY03000.doc
http://www.bom.gov.au/nmoc/Obs/IDY03090.doc
http://www.bom.gov.au/nmoc/Obs/IDY03100.doc
Note that there may be restrictions on the use of Australian data, so look
into this before creating commercial products.
150
151
APPENDIX
Exported analysis grids
Whenever an Analysis is performed on any data (scalar, isoplethed fields
only), Digital Atmosphere always exports its output to GRID.TXT. The
output can then be imported into spreadsheets or analyzed further by other
methods.
The output consists of 900 points (30 by 30) representing the value at each
point of X and Y in the geographic area shown in the workchart window. The
X-axis is left-right in the window, pointing right, while the Y-axis is up-down
in the window, pointing down. This means that the highest values of X and Y
are found east and south, respectively. The latitude/longitude of each X and
Y point in decimal format is shown, followed by the analyzed value at that
point.
Here is a sample of output from GRID.TXT.
X Y LATITUDE LONGITUDE VALUE
0 0 42.435 -107.721 1012.79998779
0 1 42.471 -107.141 1012.84558105
0 2 42.505 -106.560 1012.92547607
0 3 42.537 -105.979 1013.08880615
152
153
APPENDIX
Language support
Support for output of the chart legends in another language can be obtained
by editing the language.txt file in the Digital Atmosphere directory. Simply
create a new section header at the end of the file like:
[DANSK]
Then set the language by editing the Language= line at the top:
Language=DANSK
This tells Digital Atmosphere to only read sections following a [DANSK]
block and ignore the rest of the file. You can have as many different sections
and section headers as you like in the file.
To add the foreign language entries, copy all of the information in the English section and paste it below the new language header, then in the “Display
as” column write the items as you wish them to be displayed. It is not necessary to edit items under “Name (not used in Dig Atm)” but you may edit the
entries to make the file more readable for you.
If you do not intend to use Digital Atmosphere in English you may simply
overwrite the English section with your own entries.
Note that there is no support for Unicode at this time (thus Cyrillic and other
fonts cannot be plotted).
To change the language of the analysis options under “Analysis” you may
edit the digatmos.mnu file directly. There is currently no support for displaying the main menu in other languages.
154
155
APPENDIX
About weather data
Weather data is something we take for granted, but few meteorologists know
exactly where it comes from. This section helps clarify how it works.
Every day, nearly ten thousand weather stations across the world disseminate weather observations. These observations are taken according to
standards and formats laid out by the World Meteorological Organization
(WMO), a United Nations organization based in Geneva that facilitates
international cooperation in meteorology and hydrology. In 1961 the WMO
developed the concept of the World Weather Watch (WWW), whose goal
is to keep the entire atmosphere under continuous surveillance. The nuts
and bolts of the WWW are laid out in its Global Observation System (GOS),
and data is used, reprocessed, and shared according to the WWW Global
Data Processing System (GDPS). However the technical breakthrough that
makes this all possible is the Global Telecommunications System (GTS). This
is a permanent communications network that facilitates the flow of global
weather information.
The GTS’s main link is the Main Telecommunications Network (MTN),
which links Melbourne, Moscow, and Washington. Connected to the MTN
is a series of regional networks, known as Regional Meteorological Telecommunications Networks (RMTNs), located at Algiers, Beijing, Bracknell,
Brasilia, Buenos Aires, Cairo, Dakar, Jeddah, Maracay (Venezuela), Nairobi,
New Delhi, Norrkoping (Sweden), Offenbach, Prague, Rome, Sofia, Tokyo,
Toulouse (France), and Wellington. Within each country is its own National
Meteorological Telecommunications Network (NMTN). There are also specialized networks connected to the GTS, such as the U.S. Air Force’s Global
Weather Intercept Program, which uses powerful receivers to collect and
share weather data from politically and economically isolated regions.
The weather data is shared among WMO member states, who in turn set
policy and procedures for sharing data with the private sector. In the United
States, the data is distributed to the public through the National Weather
Service’s NOAAPORT and FOS data feeds. Much of this data reaches the
Internet and is available free of charge. This puts affordable forecasting in
the hands of millions of American citizens and business owners, boosting
economic productivity and earnings on a national scale. Unfortunately in
Europe, Asia, South America, and even Canada, long-standing ultra-conservative government policies make the data available only to pilots, mariners,
and big spenders (i.e. large corporations). The Internet is the ultimate GTS,
though, and its presence has done much to break down these economic bar-
156
Appendix / ABOUT WEATHER DATA
riers.
Surface weather data is transmitted in one of two main formats: METAR and
SYNOP. The METAR format is used primarily at airports, and has an hourly
observation cycle. It gives us the best picture of weather conditions in North
America, Europe, and the Pacific Rim. The METAR format is fairly readable
and uses station identifiers prescribed by the International Civil Aeronautical
Organization (ICAO). The SYNOP format is more detailed and uses extensive numerical coding, using numerical station identifiers prescribed by the
WMO, and typically has a 6-hour cycle. It gives us the best picture of weather
in South America, Africa, Asia, Australia, and Antarctica, where “meteorological observatories” tend to be bona fide weather offices rather than control
towers or flight service stations.
Upper air data from balloon launches is taken worldwide twice a day. It is
transmitted in TEMP format, also known as “TTAA”, “TTBB”, “PPBB format”, and “radiosonde format”. This format uses extensive numerical coding. Availability of upper air data is fairly good across much of the northern
hemisphere, but is seriously lacking in the southern hemisphere where satellite-based sensors are widely used to initialize computer model forecasts.
Since much of this data is freely available from a variety of sources, Digital
Atmosphere gives users a flexible tool for graphically importing and displaying all of the different weather data formats provided by the GTS.
157
APPENDIX
Raw data samples
Listed here are some examples of what kinds of data will be imported by
Digital Atmosphere, depending on your checkmarks on the status panel. You
can refer to these examples if you have any trouble getting Digital Atmosphere to read something or are unsure of what a particular product or bulletin should look like.
Airways (SAO) data
This is the backbone of weather observation code in the United States
and Canada. It is issued hourly from thousands of weather stations. A
sample report will look like this:
JFK SA 1150 250 SCT 7 113/44/21/2513/989=
SD RAREP radar reports
Also called hourly radar reports, RAREPS, and SD reports. Early versions of Digital Atmosphere do not import this type of data. Radar
reports come from about 100 stations around the country. A few years
ago, they were typed up by humans, but most of them are now centrally
generated by computer based on images from NEXRAD radar sites
around the country. This is what a radar report looks like:
MCI 0225 CELLS TRW/NEW 250/195 D10 C2330 MT 300
^OI22
FD winds aloft data
This is not an analysis of real conditions; rather it is numerical output
from the National Centers for Environmental Prediction (formerly NMC)
in Washington, DC. It is used primarily for aviation forecasting purposes, consisting of a coded wind and temperature forecast at 12 and 24
158
Appendix / RAW DATA SAMPLES
hours into the future. Nevertheless, it makes excellent forecasting charts
in Digital Atmosphere.
For Hours
ID Use Z From Now 3000 6000 9000 12000 18000 24000
2XG 09-18 00-09 3613 2911+06 2520+02 2430-03 2342-15
2462-26
Rawinsonde data
Also called TTAA data. This is the backbone of upper-air observation
reports, sent twice daily from hundreds of stations worldwide (several
dozen in the United States alone). It is a highly numerical, coded set of
data that is used extensively in meteorological operations and is used as
input into the numerical forecast models. Here’s an example of what it
looks like:
72558 TTAA 69121 72558 99973 00821 30002 00130 /////
///// 92762 01611 03014 85444 01850 00521 70993 04159
30025 50559 etc..
Weather watches
Also called SELS watches, watch boxes, or even WWUS9 KMKC. This is
an English bulletin produced by forecasters at the Storm Prediction Center (formerly NSSFC, the National Severe Storms Forecast Center).
WWUS9 KMKC 141239
SEL7
MKC WW 141239
KSZ000-142000BULLETIN - IMMEDIATE BROADCAST REQUESTED
SEVERE THUNDERSTORM WATCH NUMBER 77
NATIONAL WEATHER SERVICE KANSAS CITY MO
639 AM CST THU MAR 14 1996
.A..THE STORM PREDICTION CENTER HAS ISSUED A SEVERE
THUNDERSTORM WATCH FOR
PARTS OF EAST-CENTRAL AND SOUTHEASTERN KANSAS
EFFECTIVE THIS THURSDAY MORNING AND AFTERNOON UNTIL 200
PM CST.
LARGE HAIL...DANGEROUS LIGHTNING AND DAMAGING
THUNDERSTORM WINDS
ARE POSSIBLE IN THESE AREAS.
Appendix / RAW DATA SAMPLES
159
THE SEVERE THUNDERSTORM WATCH AREA IS ALONG AND 45
STATUTE MILES NORTH AND SOUTH OF A LINE FROM 45 MILES
WEST OF EMPORIA KANSAS TO 45 MILES EAST OF CHANUTE
KANSAS.
Convective outlook
The convective outlook is a bulletin produced by forecasters at the Storm
Prediction Center (formerly NSSFC, the National Severe Storms Forecast Center), and intended for use by other National Weather Service
meteorologists. Two are produced; one for the “today” time frame (Day
1), and another for the “tomorrow” time frame (Day 2). It is one of the
best sources of forecast information on the potential for severe thunderstorms.
ACUS1 KMKC 141441
SWODY1
MKC AC 141441
CONVECTIVE OUTLOOK...REF AFOS NMCGPH94O.
VALID 141500Z - 151200Z
REF WW NUMBER 0077...VALID TIL 2000Z
THERE IS A SLGT RISK OF SVR TSTMS TO THE RIGHT OF A LINE
FROM PGO OKC 30 NNE P28 35 ESE SLN OJC JEF MVN EVV
BWG BNA MEM PBF PGO.
GEN TSTMS ARE FCST TO THE RIGHT OF A LINE FROM OXR FAT
TPH ELY 15 NW PUC CAG LIC HLC FNB PIA FWA YNG DUJ DCA
25 W RIC RDU AND CBM TXK FSI 60 NNE AMA RTN 10 SE ABQ
30 SSW DMN.
Model output data
These are numerical output bulletins from the National Center for Environmental Prediction (NCEP, formerly known as NMC), which describe
forecast parameters at different locations around the country. These bulletins are available on most weather databases. For those who want the
“real thing” from the supercomputers, full-fledged model output is in a
binary format known as GRIB; these files are huge, hard to obtain, and
are not importable into Digital Atmosphere at this time.
652
FOUS72 KWBC 201200
160
Appendix / RAW DATA SAMPLES
OUTPUT FROM ETA 12Z JAN 20 96
TTPTTR1R2R3 VVVLI PSDDFF HHT1T3T5
PSDDFF HHT1T3T5
SEA//928157 03005 131714 30989795
152312 25969490
06021947750 05304 021921 34009996
101416 29979693
12010957438 -1802 992315 30019995
021809 32999795
18006957340 01501 992612 30019995
012208 30999895
24005977941 02601 012517 28019995
022516 29999794
30010967941 01201 042819 27019894
042513 27009894
36005856037 -0202 102814 26019894
072607 27009794
42000794430 -0906 152811 25019793
123009 26009693
48000783339 -0510 182710 27009792
173109 24999491
TTPTTR1R2R3 VVVLI
GEG//894554 03407
06000877354 02207
12014928044 03104
18000957342 02502
24011957646 02502
30000957544 01001
36004938141 01501
42003837138 00703
48000614637 00007
161
APPENDIX
Version change summaries
VERSION Equinox 1.10a (May 24, 2007)
Micropatch to fix corrupted handling of downloaded radar data (data
was downloaded into obs.001, obs.002 etc and program needed to
find these in nids.001, nids.002, etc.
Added description element into version change message, so users can
decide whether a download is needed when a notification is received.
VERSION Equinox 1.10 (May 18, 2007)
Numerous fixes and repairs, including fixes for handling of climatological daily data from SYNOP reports.
VERSION Equinox 1.05 (January 17, 2007)
A few new Mexican radars in the northwest provinces have been added
to DIGATMOS.RDY. Not all radars are active, as Mexico’s radar
network is not reliable.
Internet > Retrieve shows how many items are selected.
Map > Overlay > Points now uses a more capable file format. See the
help under Map > Add Point. It allows the use of lines, attributes
that can be changed, and shortcuts.
Map > Overlay > Points now prompts for a filename. Editing is no longer done in the program as editing flow was unclear.
Contour labels are now plotted at the top of closed contours.
Removed digatmos.ptt from project; it is superfluous.
Adjusted digatmos.nex to put clear air mode on the same palette as precipitation mode to allow for a standardized mosaic.
Entering “------” for a color in digatmos.nex keeps that color level from
plotting. This can be used to allow for a unified mosaic color scheme.
Added code to prevent Digital Atmosphere from generating zero-value
serial numbers.
Added handling for METAR unknown precipitation (UP). This will plot
as two solidii (//) and will carry weather code 100. I saw lots of UP
reports from Texas during the January 15 2007 sleet event; UP is most
likely sleet.
162
Appendix / VERSION CHANGE SUMMARIES
Changes made to WSR-88D plotting module to allow various raster data
(most notably Composite Reflectivity) to plot correctly. The module
now determines polygon positioning based on the number of rows in
the raster table as well as the resolution for the product as defined in
digatmos.nxc. Also added progress bar updating on raster data.
In Radar > (product) logic is added to detect and discard old radar scans
so as not to mess up mosaics. An RPG product that is more than 15
minutes older than the preceding RPG products being plotted will be
discarded and a message will appear in the status window showing
it was discarded. The weakness is if the plotted site is the very first
to be plotted, it will be used since no other comparisions are available.
A tutorial has been added for the Radar > Import Image menu option on
how to add radars , using the example of Durban, South Africa. This
will be of considerable interest to international users.
Started preliminary work on importing GRIB2 data . This module does
not work and will not plot, however the file will be handled with
probably no errors.
Muted menu colors slightly to reduce blue and red saturation.
VERSION Equinox 1.04 (January 7, 2007)
Preferences > Annotations > “H” and “L” characters now plot correctly.
The software was defaulting to “H” and “L” rather than using the
characters shown here.
Removed possible error in installer related to “tutorial” directory. This
was returning a harmless error.
Incorrectly plotted coordinates when using older Digital Atmosphere
charts (from early Fusion and before) has been fixed by adding sanity
checks to the load function for *.dmf map data. If the rotation value
is out of bounds (<-360 or >360 deg), which may be the case in earlier
versions where the rotation value was not specified, it will set it to
zero and correct the source file, permanently fixing the problem for
that map.
Diagnosed slight positioning errors in contour labels and highs/lows and
fixed them.
VERSION Equinox 1.03 (January 6, 2007)
METAR visibility values are now correctly ingested.
Fixed script LOAD command which was only loading in the image and
not loading the background map and resizing the window.
Eliminated redundant labels in the chart title stack to prevent multiple
display of the exact same chart title.
Appendix / VERSION CHANGE SUMMARIES
163
Fixed problem with GRN or TEMPO in METAR being interpreted as GR
and PO weather types.
Improper time token entries in Internet Retrieve (using one instead of
two digits) will be automatically detected and corrected.
View Last Radar Product fixed, so as to plot the last -radar- product. A
Window > Replot Last Product command has been added to replot
any last product.
Added “Window > Allow Digital Atmosphere to run in background”
command which prevents Digital Atmosphere from popping up
(such as during scripting operations) and regaining focus. Right now
this only suppresses the “plotting radar” message... if you see Digital
Atmosphere pop up at other times, please send detailed information.
Tutorial directory and sample.txt file added to build.
VERSION Equinox 1.02 (January 2, 2007)
Emergency patch as Internet > Retrieve was nonfunctional due to problem in URL preprocessor.
VERSION Equinox 1.01 (January 2, 2007)
When all workcharts are closed and then new ones are created, there is
now proper handling of the workchart and its background map. The
user no longer gets an empty frame.
Added ability to auto-retrieve historical (past 1-2 weeks) radar images
based on date-time selection from Radar > Set Date-Time and presence of an archival source in the digatmos.rad resource file. If these
are selected then choosing a radar product will cause historical data
to be accessed via the Internet. This is slightly slow because the data
directory will have to be analyzed to find the closest matching file
time.
Password security has been introduced on scripting and internet resource URLs. This allows you to devise your scripts so that they
can be traded without compromising login information, and so that
they execute onscreen without being insecure. They can be used for
not only passwords, but account names, server names, and so forth.
Your list of sensitive data must be maintained in DIGATMOS.PWD.
On each line, write token=value where token is a name created by
you and value is the actual value to be substituted. When %%token
%% (your token word surrounded by double-percent signs) is found
in a URL, it is replaced with the equivalent value that you defined.
Digital Atmosphere will display the %%token %% marker, so don’t
name tokens with sensitive information.
164
Appendix / VERSION CHANGE SUMMARIES
VERSION Equinox 1.00 (January 1, 2007)
Help files converted from WinHelp to CHM to ensure compatibility with
Vista. This removes dependencies on Winhlp32.exe. (12/22/06)
Fixed analysis labels to provide correct centering of individual labels
and correct coloring. (12/27/06)
Fixed problem with Canadian radar data import. Canada made some
changes sometime in November 2006. This required some structural
changes and a small change to the digatmos.rdy file. Part of this was
to allow users to explicitly define the image type, since Canada’s radar imagery was a GIF file but was actually a PNG object. (12/28/06)
Support is added for NCEP high-res front bulletins. These are provided at http://www.hpc.ncep.noaa.gov/discussions/codsus_hr and
described at http://www.hpc.ncep.noaa.gov/html/read_coded_bull_
hr.shtml . With these new bulletins, frontal positions are located to
the nearest tenth of a degree (6 nm resolution) rather than nearest
whole degree (60 nm). There is no need to use the older format.
(12/29/06)
Fixed Error 103 problem with GRIB import caused when certain data
is not found in a file. This was caused by incorrect file handling.
(12/29/06)
Added support for public ECMWF data by making appropriate entries
in digatmos.grd. Also introduced support for scaling of units based
on digatmos.grd entries.
Enabled support for Preferences > Maps > Label Graticule. (12/29/06)
Fixed incorrect symbol type used for thunderstorms in METAR reports.
Digital Atmosphere was mapping TSRA, TSSN, TSGR, etc to the ww
code 91-94 sections rather than 95-99. This has been fixed. (12/29/06)
Added thread processing command to code just before FTP uploads to
allow system to catch up. This was resulting in null FTP uploads.
(12/29/06)
Enabled “check for updates” module to compare program version number with production version number on website and ask user once
whether they want to update. (12/29/06)
Added import of MADIS data direct from FSL (NOAA). This is included
in a new Internet Retrieval resource list.
Improved Internet Retrieval system to stream downloads into individual
files, so binary files (like MADIS and future GRIB/BUFR) can be
properly handled. Files are captured under different names in /data
and are processed out to the Digital Atmosphere home directory
under obs.asc, obs.bin, and nids.bin. The obs.*, nids.*, and madis.000
files are deleted before each new download. This also allows better
management of content inside /data directory. (12/30/06-12/31/06)
Added pointer URL search function in Internet > Retrieve. This was
necessitated by the way SPC carries convective outlooks, and the fact
Appendix / VERSION CHANGE SUMMARIES
165
that no static pages for this product exists. In Internet > Retrieve,
URLs with a space in the middle are handled as pointer URLs. See
the Internet > Retrieve help for more information. (12/30/06)
Fixed convective outlook plotting. Changes in entire bulletin format
prevented the plotting routine from working. (12/30/06)