1
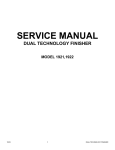
Page 1 of 38
MILLER 400D
DIGITAL RESISTANCE METER
USER’S MANUAL
Revised September 7, 2010
M. C. Miller Co., Inc.
11640 U.S. Highway 1, Sebastian, FL 32958 U.S.A.
Telephone: 772 794 9448; Website: www.mcmiller.com
Page 2 of 38
CONTENTS
Page
Section 1: Description ………………………………………………
3
Section 2: How to Take Resistance Readings Manually ……………
4
Section 3: Logging Resistance Readings on a Bluetooth-Enabled
Computer (PDA, Laptop etc.) …………………………..
5
Section 4: Applications ……………………………………………...
6
4-Electrode Applications ..…………………………………….
Earth Resistivity Measurement ………………………...
Soil Sample Resistivity Measurement ………………….
6
6
8
3-Electrode Application ………………………………………. 10
2-Electrode Application ………………………………………. 13
Section 5: Status Indicators and Error Codes ………………………. 15
Section 6: Maintenance & Calibration ……………………………... 17
Appendix 1: How to Change Settings (from their default values)
Using the Miller 400D Configuration Program ………. 18
Appendix 2: How to use the ProCP Soil Resistivity Survey
Program in conjunction with the Miller 400D ………. 23
Appendix 3: Influence of test lead proximity on the accuracy
of AC resistance meter readings ……………………… 38
FCC Statement:
The Miller 400D Resistance Meter meets current FCC radio frequency
exposure guidelines and complies with Part 15 of the FCC Rules.
FCC Equipment Authorization ID: POOWML-C40
Page 3 of 38
SECTION 1: DESCRIPTION
When combined with appropriate electrodes (pins) and test leads, the
MILLER-400D can be used to measure earth resistance with the push of a
button.
There is no need to adjust dials or select ranges; the MILLER-400D
automatically provides a direct resistance reading.
In addition to taking (and recording) readings manually (see Section 2), a
Bluetooth-enabled computer (PDA, laptop etc.) can be programmed to
acquire resistance readings directly from the Miller 400D, since the
resistance meter has a built-in Bluetooth interface (see Section 3). In the
latter case, the PDA or PC, which is in control of the Bluetooth link,
commands the Miller 400D to take a reading and the resistance value is sent
automatically to the PDA or PC.
Depending on the application, 4-Electrode, 3-Electrode or 2-Electrode, the
MILLER-400D can be used to determine the following:
• The average earth resistivity to a specific depth (with the application
of an appropriate multiplier to convert resistance to resistivity, based
on the electrode separation distance) – 4-Electrode Application
• The resistivity of a soil sample, or of a liquid, via an electrolyte
(soil/liquid) box (with the application of an appropriate multiplier to
convert resistance to resistivity, depending on the box geometry) –
4-Electrode Application
• The resistance-to-earth of a buried electrode, such as a ground rod, or
an anode, for example – 3-Electrode Application
• The resistance between two buried electrodes, such as two ground
rods, or two anodes – 2-Electrode Application
The MILLER-400D has a resistance measurement range (with automatic
ranging) from 0.01Ω to 10MΩ. Over the range, 0.01Ω to 1MΩ, the specified
meter accuracy is ±1.6% ±1 LS display digit ±0.01Ω and over the range,
1MΩ to 10MΩ, the specified accuracy is ±5% ±1 LS display digit. Note:
For load resistances >1MΩ, in addition to internal meter errors, errors
associated with test lead proximity can also be significant (please see
Appendix 3 for details). It should be noted, however, that these accuracy
Page 4 of 38
specifications assume a low electrode (pin)/earth contact resistance during
the measurement. In this regard, it is recommended that the electrodes
(pins) be firmly driven into the earth (pins cannot be loose) and, in dry soils,
it is recommended that the soil around the pins be moistened in order that
reliable (low resistance) contact be made to the surrounding soil.
The voltage source inside the MILLER-400D that supplies the current used
in the resistance measurement is a 12V(rms) crystal-controlled 82.2Hz
square wave oscillator and the internal ammeter and voltmeter use very
narrow band-pass filters centered at 82.2Hz. What this means is that
resistance measurements are unaffected by any stray interference signals
(having frequencies other than 82.2Hz) that may be present in the earth
during the measurement.
The MILLER-400D runs on a set of replaceable D-size alkaline batteries, so
there is no requirement to periodically re-charge the unit or to plug the unit
into a power source. Furthermore, due to its extremely low power
consumption design, the MILLER-400D can perform 10,000 single
resistance readings, for example, on a fresh set of batteries.
SECTION 2: HOW TO TAKE RESISTANCE READINGS MANUALLY
The Read Button is used to initiate a resistance measurement once electrodes
and test leads are appropriately connected to the MILLER-400D, as
indicated in the Applications Section (Section 4).
A single resistance reading is initiated by depressing the read button once
momentarily (for a period of less than 2 seconds).
The Ω symbol on the LCD will flash
On and Off when a reading is being
performed
When the reading has been
accomplished, the value will be
displayed and the appropriate units
highlighted (MΩ, KΩ or Ω)
Page 5 of 38
The LCD will be as indicated in cases
where the measured resistance is
higher than 10MΩ
The resistance reading will be displayed for a period of time (1 minute by
default) after which the LCD will go blank until the read button is
momentarily depressed again to take another reading. Another reading can
also be initiated while the previous reading value is being displayed.
By depressing the read button twice, rather than once, continuous resistance
readings will be initiated. In the continuous mode, a resistance reading will
be taken and displayed every 3 seconds. The process is terminated by
depressing the read button a third time. Also, the process will self-terminate
after 10 readings by default. Although this mode consumes more battery
power, it may be desirable to observe the resistance reading as a function of
time for some period of time in order to check for consistency.
The read button can also be used to initiate a self-calibration process (please
see the Maintenance & Calibration Section (Section 6)).
SECTION 3: LOGGING RESISTANCE READINGS ON A
BLUETOOTH- ENABLED COMPUTER (PDA, LAPTOP ETC.)
A Bluetooth-enabled computer can be programmed to acquire resistance
readings directly from the MILLER 400D and, with electrodes and test leads
appropriately connected to the meter, as indicated in the Application Section
(Section 4), resistance readings can be logged via a software application.
For instance, the MILLER 400D is supplied with an “over-the-pipe” soil
resistivity survey program, known as “ProCP Soil Resistivity”, which is
based on the 4-pin Wenner Methodology. Please see Appendix 2 for
information on this software application.
Page 6 of 38
SECTION 4: APPLICATIONS
4-ELECTRODE APPLICATIONS
1.
Earth Resistivity Measurement
This application uses 4 electrodes (pins). The electrodes are driven down
into the earth the same distance and are evenly spaced in a straight line. A
schematic of this arrangement is illustrated in Figure 1 below.
Figure 1
The MILLER-400D can be used in conjunction with M. C. Miller’s 4-lead
(color-coded) test reel (catalog # 44700) and four heavy-duty (stainless
steel) electrodes (soil pins) – catalog # 44720. The test leads are connected
to the MILLER-400D as shown in Figure 1. With this arrangement, the
MILLER-400D displays the earth’s average resistance to a depth equal to
the electrode spacing (S), based on the magnitude of the current flowing
Page 7 of 38
between terminals C1 and C2 and the voltage dropped between terminals P1
and P2. Note: For load resistances >1MΩ, in addition to internal meter
errors, errors associated with test lead proximity can also be significant
(please see Appendix 3 for details).
Dr. Frank Wenner of the U.S. Bureau of Standards developed the theory
behind this test in 1915 [1]. He showed that, if the electrode (pin) depth (d)
is kept small relative to the separation between the electrodes (S), the earth’s
average resistivity to a depth equal to the electrode spacing (S) can be
obtained by applying the following formula:
ρ =2πSR
where R is the resistance value in ohms as displayed on the MILLER-400D,
ρ is the resistivity in ohm.cm, π is the constant 3.1416, and S is the electrode
separation in cm.
Typically, the electrode (pin) spacing is not measured in centimeters but,
rather, in feet (in the U.S.) or in meters (in most other countries).
U.S. Example (electrode spacing measured in feet):
Since there are 30.38 centimeters in 1 foot, the above formula can be written
as:
ρ (Ω.cm) = 2π x 30.38 x (electrode spacing in feet) x R (ohms)
or, ρ (Ω.cm) = 191.5 x (electrode spacing in feet) x R (ohms)
So, for example, if the MILLER-400D displays a resistance value of 15
ohms for an electrode (pin) spacing of 20 feet, the earth’s average resistivity
value to a depth of 20 feet would be:
ρ = 191.5 x 20 x 15 = 57,450 ohm.cm
If the resistivity value is required to be expressed in ohm.m, rather than
ohm.cm, the ohm.cm value is divided by 100. In the above example, the
resistivity would be 574.5 ohm.m
Page 8 of 38
Metric Example (electrode spacing measured in meters):
Since there are 100 centimeters in 1 meter, the above formula can be written
as:
ρ (Ω.cm) = 2π x 100 x (electrode spacing in meters) x R (ohms)
or, ρ (Ω.cm) = 628.32 x (electrode spacing in meters) x R (ohms)
So, for example, if the MILLER-400D displays a resistance value of 15
ohms for an electrode (pin) spacing of 7 meters, the earth’s average
resistivity value to a depth of 7 meters would be:
ρ = 628.32 x 7 x 15 = 65,973.6 ohm.cm
If the resistivity value is required to be expressed in ohm.m, rather than
ohm.cm, the ohm.cm value is divided by 100. In the above example, the
resistivity would be 659.73 ohm.m
Note: The above formula is accurate only if the electrode depth (d) is small
relative to the electrode spacing (S). An “S” value equal to, or greater than,
20 times the “d” value is recommended. This means that if d is 1 foot, for
example, then S has to be at least 20 feet (or, if d is 0.3 meter, then S has to
be at least 6 meters)
The Wenner Method is the basis of an ASTM Standard Test Method
(ASTM G57-06).
2.
Soil Sample (or Liquid) Resistivity Measurement
This application also uses 4 electrodes, however, in this case, the electrodes
are an integral part of an electrolyte box, which is more commonly referred
to as a soil box. For this application, the MILLER-400D can be used in
conjunction with one of M. C. Miller’s soil boxes (catalog # 37008 or
catalog # 37006) and 4 test leads (catalog # 37009).
A schematic of the test arrangement is illustrated in Figure 2 below.
Page 9 of 38
Figure 2
For this application, the test leads are connected to the MILLER-400D as
shown in Figure 2.
With this arrangement, the MILLER-400D displays the resistance of the soil
sample, or of the liquid that fills the electrolyte box, based on the magnitude
of the current flowing between terminals C1 and C2 and the voltage dropped
between terminals P1 and P2.
In general, for a particular volume of soil sample (or liquid), as defined by
the geometric constraints of the electrolyte box, the sample’s resistivity can
be calculated from the resistance value displayed by the MILLER-400D
using the following formula:
ρ = R A/L
Page 10 of 38
where ρ is the resistivity in ohm.cm, R is the resistance in ohms, A is the
cross-sectional area of the current electrodes in cm squared, and L is the
separation between the potential electrodes in cm.
Consequently, the ratio A/L represents a multiplication factor that needs to
be applied to the resistance reading in order to obtain the sample’s resistivity
value.
Conveniently, for both M. C. Miller soil boxes, the A/L ratio is exactly 1cm.
Consequently, when M. C. Miller soil boxes are used, the reading in ohms
(or kΩ) displayed on the MILLER-400D becomes the resistivity value in
ohm.cm (or kΩ.cm).
If the resistivity value is required to be expressed in ohm.m, rather than
ohm.cm, the ohm.cm value is divided by 100. For example a resistivity value
of 2500 ohm.cm would be equivalent to 25 ohm.m
3-ELECTRODE APPLICATION
The 3-Electrode Application can be used to measure the resistance-to-earth
of a buried electrode, such as a buried ground rod or a buried anode.
In this case, two of the electrodes are pins driven into the earth and the third
electrode is the test electrode itself, for example, a ground rod or an anode.
A resistance-to-earth measurement will actually comprise 3 components; the
resistance of the electrode itself (the resistance of the ground rod or anode
material, for example) including test leads, the electrode-earth contact
resistance and the resistance of the surrounding earth. Typically, the
resistance of the surrounding earth is the largest component of the
resistance-to-earth measurement.
The three electrodes are positioned in a straight line (ideally) as indicated in
Figure 3 below.
Page 11 of 38
Figure 3
As indicated in Figure 3, a jumper wire is connected between the C1 and P1
terminals on the MILLER-400D and test leads connect the “Potential
Electrode” and the “Current Electrode” to terminals P2 and C2, respectively.
Finally, a test lead connects the electrode under test (a ground rod or an
anode, for example) to the C1 terminal.
With this configuration, the MILLER-400D passes a current between the test
electrode and the “Current Electrode” and generates a resistance reading
based on the voltage dropped between the electrode under test and the
“Potential Electrode”.
The magnitude of the resistance reading will be a function of the separation
(distance) between the electrode under test and the “Potential Electrode”,
with respect to a fixed position for the “Current Electrode”.
Page 12 of 38
A characteristic “resistance versus distance” plot is illustrated in Figure 4
below.
Figure 4
This type of plot assumes that the “Current Electrode” (see Figure 3) is
positioned far enough away from the electrode under test so that a “plateau”
region is obtained in the plot. A 100 foot separation is typically
recommended. However, it is suggested that a resistance versus distance
curve be generated for any given situation in order to verify the existence of
a plateau-type region which will allow an accurate determination of the
electrode-to-earth resistance.
Assuming that a plateau-type region is obtained, the resistance-to-earth
value for the electrode under test will be the resistance value on the plot
corresponding to the plateau region as illustrated in Figure 4.
A general rule-of-thumb, which assumes that the “Current Electrode” is
positioned sufficiently far away from the electrode under test, is that if the
Page 13 of 38
“Potential Electrode” is positioned at a distance from the test electrode of
0.62 x D, where D is the distance between the electrode under test and the
“Current Electrode”, the resistance reading observed will correspond to the
resistance-to-earth value for the electrode under test.
This particular configuration is illustrated in Figure 3. For example, if the
distance between the electrode under test and the “Current Electrode” is 100
feet, the “Potential Electrode” should be positioned 62 feet from the
electrode under test. However, again, it is suggested that resistance versus
distance plots be generated in each instance.
2-ELECTRODE APPLICATION
The 2-Electrode Application can be used to measure the resistance between
two buried electrodes, such as two ground rods, or two anodes, for example.
In this case, the two electrodes are the two buried components. Figure 5
below illustrates the measurement configuration.
Page 14 of 38
Figure 5
As indicated in Figure 5, in this configuration, jumper wires are connected
between terminals C1 and P1 and between terminals C2 and P2. In addition,
test leads connect one of the electrodes to terminal C1 and the other
electrode to terminal C2.
Another configuration option, which is recommended for use when
measuring small resistances, is to connect the potential terminals (P1 and
P2) directly to the electrodes with separate test leads, thus eliminating the
jumper wires. Such a configuration eliminates any voltage drop in the test
leads due to current flow in the leads which would appear in series with the
voltage drop occurring between the electrodes in the case of the
configuration shown in Figure 5.
The reading displayed on the MILLER-400D will be a direct measurement
of resistance comprising 2 components; the resistance-to-earth contribution
of each electrode (which itself comprises 3 components (see the “3-
Page 15 of 38
Electrode Application” section above) and the earth’s resistance between the
two electrodes.
SECTION 5: STATUS INDICATORS & ERROR CODES
Status Indicators:
There are 3 status indicators on the MILLER-400D. A light bar in the LCD
positioned opposite each of 3 icons will indicate particular scenarios. The 3
icons are shown below and are located to the left-hand-side of the LCD.
From top to bottom, the icons represent the battery, the noise status and the
Bluetooth radio.
Battery Indicator:
The battery indicator provides a warning that it’s time to replace the
batteries in the MILLER-400D (see the Maintenance & Calibration Section
(Section 6) for details).
The indicator bar (opposite the battery icon) will be ON when there is only
20% of the charge remaining and the indicator will flash ON and OFF when
there is 10% or less charge remaining. When the battery charge is at a
critically-low level, the unit will not perform a resistance measurement.
Consequently, it is recommended that batteries be replaced when the battery
indicator first lights up.
Noise Indicator:
Generally-speaking, readings taken by the MILLER-400D are not affected
by external noise sources, since the unit employs narrow band-pass filters
centered at 82.2Hz, which makes interference from 50Hz, 60Hz, 100Hz or
120Hz signals, for example, highly unlikely.
However, to guarantee accurate resistance measurements, the MILLER400D examines all signals appearing at its input terminals and the noise
indicator alerts the user to specific issues as follows:
Page 16 of 38
Flashing On and Off presentation: Indicates that the unit has detected a
large voltage (>35V) at its input terminals in front of the filter. Should such
large external sources appear across the input terminals, the unit will
disconnect itself. Any displayed resistance values on the LCD should be
ignored when the noise indicator is flashing On and Off. Note: Once the
over-voltage is removed, the unit should be re-started by (momentarily)
depressing the Read button.
Steady ON presentation: Indicates that the unit has detected external
interference signals after the filter when its internal voltage source has been
switched off. This situation would imply that the resistance measurement is
compromised and the reading should be ignored.
Also, the Steady ON presentation of the noise indicator will be observed
during the Continuous Reading Mode (in which readings are presented at 3
second intervals continuously) should either of the following two scenarios
occur: A new resistance value is larger than twice the previous value or a
new resistance value is smaller than half of the previous value. Such
scenarios could occur if the test leads are disturbed during the continuous
reading process, for example. In this case, readings should also be ignored.
Bluetooth Indicator:
If a Bluetooth-enabled PDA or PC is being used to log resistance data
generated by the MILLER-400D, the Bluetooth Indicator will be ON when a
link has been established between the MILLER-400D and the PDA or PC.
Error Codes:
The following are the error codes that may be displayed on the LCD:
Er1 Detected an internal power supply failure
Er2 Detected an internal communications failure when sending
Er3 Detected an internal communications failure when receiving
Er4 Detected a calibration error
Should any of above codes be displayed, please contact the M. C. Miller
Company.
Page 17 of 38
SECTION 6: MAINTENANCE & CALIBRATION
Other than changing the batteries, the MILLER-400D requires no
maintenance.
The procedure to change the 5 D-size alkaline batteries in the unit is as
follows:
Unscrew both battery holder covers (rotate covers clockwise to unscrew)
and remove the old batteries. Install five 1.5Volt D-size alkaline batteries,
positive terminals facing out, (3 batteries in one holder and 2 batteries in the
other) and replace the battery holder covers (rotate covers counterclockwise).
With respect to calibration, the MILLER-400D is self-calibrating and the
user can select to have the unit calibrate itself before every measurement or
can select to have the unit self-calibrate at his/her request (default setting).
If the latter selection is made, the self-calibration process is initiated by
depressing the “Read” button for a period of 10 seconds.
When performing an auto (self) calibration, the LCD will be as shown
below:
The “Ω” symbol (located at the bottom right-hand corner of the LCD) will
flash ON and OFF during the calibration process and will stop flashing when
the re-calibration sequence is complete (approximately a 10 second process).
The unit self-calibrates after the batteries have been replaced.
Reference:
[1] F. Wenner, “A Method of Measuring Earth Resistivity”, Bulletin of
Bureau of Standards, Report # 258, Vol. 12, No. 3, Oct. 11, 1915
Page 18 of 38
Appendix 1:
How to Change Settings Using the Miller 400D
Configuration Program
The Miller 400D Resistance Meter is supplied with factory settings (default
settings) for a group of five parameters. The five parameters are defined in
the table below and their default values (or settings) are indicated.
Parameter
Explanation of Parameter
Number of Continuous
Readings
In the Continuous Reading Mode (see Section 2), a
new reading is displayed every 3 seconds. When
the selected number of readings have been taken,
the process will self-terminate
10 readings
In the Single Reading Mode (see section 2), the
LCD shuts down (reading value is no longer
displayed) after a set period of time in order to
conserve power
1 minute
Range of values, 3-255
readings
Auto Shut Down
Time
Range of Values, 1-10
minutes
Bluetooth Radio Setting
Options: Radio Always ON or
Radio ON Upon Demand
Self-Calibration Setting
Options: Calibrate on
Demand or Calibrate before
each Reading Sequence
Resolution Setting for R<1Ω
Options: LCD shows 0.001Ω
resolution or LCD shows
0.01Ω resolution
In the default setting (Bluetooth radio ON upon
demand), which is the power-saving mode, the
Bluetooth radio is turned ON and OFF by the
software applications, either the Configuration
Program or the ProCP Soil Resistivity Program
In the power saving default setting (Calibrate on
Demand), the self-calibration process is initiated by
use of the Read button (see Section 6). With the
other option, a calibration process (a 10 second
event) is initiated each time a reading is requested
(Single Reading Mode) or at the start of each
Continuous Reading Mode cycle
In the default setting, the LCD will display the
resistance value in the format 0.XXΩ. With the
other setting, the display will be in the format
0.XXXΩ. Note: Data received by a PC will always
have highest resolution regardless of display format
Default Value
/Setting
Bluetooth
Radio ON
Upon
Demand
Self-Calibrate
on Demand
LCD shows
0.01Ω
Resolution
Assuming that a Bluetooth-enabled PDA or PC is available, the above five
parameters can be modified from their default values (or settings) using the
Miller 400D Configuration Program. In the absence of a Bluetooth-enabled
PDA or PC, the Miller 400D will operate in the factory-configured mode
with the default values (or settings) being applicable.
Page 19 of 38
After installing the Configuration Program (from the CD that was supplied
with the Miller 400D) onto your PC or PDA and opening the application, the
window shown below will be displayed:
A Bluetooth connection is initiated by the Configuration Program via the
following procedure:
With the PDA or PC within range (within 30 feet) of the Miller 400D,
left-mouse click or tap on the “Miller 400D” menu and click or tap on the
“Connect” option, as indicated below.
Page 20 of 38
The following message will be displayed: “Make sure that the Miller 400D
is turned ON”. At this point, depress the “Read” button on the Miller 400D,
which turns the unit ON and immediately click or tap on the “Yes” button in
response to the message.
Note: A few seconds are required to establish a connection. Also, the above
process may have to be repeated more than once for a Bluetooth connection
to be established.
When a connection is established, the window shown below will be
displayed:
Page 21 of 38
Changes to the (power-saving) default settings can be made, if necessary, via
the above window.
Also, a reading can be initiated and the meter reading can be displayed on
the above window either by clicking or tapping on the “Display Resistance
Reading” button, or, by depressing the “Read” button on the Miller 400D.
The reading acquisition time is 3-5 seconds. See the window below for an
example.
Page 22 of 38
Finally, click or tap on the “Save Configuration” button, if any changes were
made, and then select the “Disconnect” option from the “Miller 400D”
menu, while in range of the Miller 400D.
Note: Disconnecting the Bluetooth connection will allow the Bluetooth
radio in the Miller 400D to switch OFF (power-saving mode) after the LCD
shuts down.
WARNING: If the software disconnection process is not carried out
(within range of the Miller 400D), the Bluetooth radio will remain ON,
even when the LCD automatically shuts down.
Page 23 of 38
Appendix 2:
How to Use the ProCP Soil Resistivity Survey Program in
Conjunction with the Miller 400D Resistance Meter
The MILLER 400D is supplied with an “over-the-pipe” soil resistivity
software program, known as “ProCP Soil Resistivity”, which is based on the
4-pin Wenner Methodology (see Section 4 – Earth Resistivity
Measurement). The program needs to be run on a Bluetooth-enabled PDA
or PC. Also, if a GPS receiver is integrated with the PDA or PC, GPS
location data are logged automatically at soil resistivity measurement sites.
After installing the program from the CD supplied with the Miller 400D,
either the PC version or the PDA version, and opening the program, the
window shown below will be displayed:
As indicated on the header of the above window, the Miller 400D is
currently not connected, via Bluetooth, to the PDA or PC.
The Bluetooth connection is initiated (and subsequently maintained) by the
software program (ProCP Soil Resistivity) using the following procedure:
Page 24 of 38
With the PDA or PC within range (within 30 feet) of the Miller 400D,
left-mouse click or tap on the “Miller 400D” menu and click or tap on the
“Connect” option, as indicated below.
The following message will be displayed: “Make sure that the Miller 400D
is turned ON”. At this point, depress the “Read” button on the Miller 400D,
which turns the unit ON and immediately click or tap on the “Yes” button in
response to the message.
Note: The above process may have to be repeated more than once for a
Bluetooth connection to be established.
Approximately 16 seconds are required to establish a connection and to have
the software be “in control” of the Bluetooth radio in the Miller 400D unit.
The window shown below will be displayed when a Bluetooth connection
has been successfully established. Please note the header indication (Miller
400D is connected) on the window.
Page 25 of 38
Creating a new survey file or re-opening a pre-existing survey file
Creating a new survey file:
A new soil resistivity survey file is established by clicking or tapping on the
“New Survey File” button on the above window and identifying a
previously-created folder (perhaps located in your “My Documents” folder)
as the target folder for the survey file.
A target folder for the survey file is selected by clicking on the “Browse for
Folder” button indicated by the arrow on the window shown below. In the
example window (see below), a previously-created folder named “SR
Surveys” is highlighted to be the parent folder for soil resistivity survey
files.
Page 26 of 38
Following target folder identification, enter a name for the survey file, as
indicated in the window shown below, and click or tap on the “Accept”
button. In the example shown, the survey file name is “MCM survey”.
Page 27 of 38
After selecting “Accept”, the window shown below (the Options Screen)
will be displayed.
Re-opening a pre-existing survey file:
A pre-existing (saved) survey file can be re-opened, perhaps to continue
adding data to the file. To do so, click or tap on the “Open Survey File”
button and highlight the name of the survey file to be opened and click or tap
on the “Open” button on the “Open ProCP Soil Resisitivity Survey”
window.
At this point, the window shown below (the Survey Screen) will be
displayed.
Page 28 of 38
Options Field:
Pipeline Name: Enter a name for the pipeline over which the survey is
being conducted (if known).
Location Type: By clicking or tapping on the drop-down menu button in
the Location Type field, a selection can be made regarding how locations are
displayed (Station #, Milepost or Miles plus Feet, or, their metric
equivalents)
Use Metric: Make this selection for metric distance units rather than U.S.
distance units. With this box checked, all distances will be in metric units.
Select one of the following options regarding stationing (measurement
location information along the pipeline):
Calc Pipe Loc From GPS: With this option, the distance between the
previous measurement location and the current measurement location is
calculated by the software and a station number is presented for the current
Page 29 of 38
position, based on the station number of the previous measurement location.
The starting station number (if known) is entered on the survey screen prior
to logging the first reading (see below).
Note: A straight line will be assumed between any two GPS locations for
the purposes of the calculations. Also, if the “include altitude” option is not
selected, it will be assumed that there is no altitude change between the two
locations involved in a distance calculation. And, if the “include altitude”
option is selected, the accuracy of the altitude data will significantly impact
the accuracy of a calculated distance between two locations.
Reading Interval (feet or meters): With this option, the entered “Reading
Interval” distance is added to the stationing each time a reading is logged,
for the case of Downstream surveys, and, the entered “Reading Interval”
distance is subtracted from the stationing each time a reading is logged, for
the case of Upstream surveys. This is an ideal selection if survey flags, for
example, have been laid out ahead of the soil resistivity survey, based on
measured distances, and soil resistance readings are to be taken at each
flagged location, say, every 200 feet, for example.
The starting station number (if known) is entered on the survey screen prior
to logging the first reading (see below).
Manually-Entered Locations: With this option, the user enters a station
number at each measurement location prior to logging each reading. The
starting station number is entered on the survey screen prior to logging the
first reading (see below).
Pin Spacing Field:
Any number of “Pin Spacing” values can be entered which means that any
number of soil resistance readings can be taken at each measurement
location for soil resistivity versus depth profiling purposes.
Enter a value for the first pin spacing, in feet or meters, in the field
opposite the “Add” button and click or tap on the “Add” button. This will
place the pin spacing value into the Pin Spacing field. Repeat this process
for each of your pin spacing values.
Page 30 of 38
The window shown below indicates how the pin spacing values appear for
the example case of 3 entered values, 20 feet, 10 feet and 5 feet. Note: Pin
spacing values should be entered in the order in which the resistance
readings are planned to be taken, since the reading prompts will appear
automatically in the same listed order (see the Survey Screen section below).
Note: Highlighted pin spacings can be removed from the Pin Spacing field
using the “Remove” button.
Survey Screen
After making “Options” and “Pin Spacing” selections, click or tap on the
“Survey” button (lower right-hand corner), which will pull up the survey
screen. An example survey screen is shown below for the case of 3 pin
spacing values having been entered (20 feet, 10 feet and 5 feet).
Page 31 of 38
As indicated in the above window, the software is ready to acquire the meter
value (resistance value) associated with the first-of-three pin spacings (20
foot pin spacing in this example case).
A selection should be made for the “Survey Direction”, either Downstream
or Upstream. This selection is important with regard to the first two
“Location Method” options, namely, the “Calc Pipe Loc from GPS” and
“Reading Interval” options. Downstream implies that the stationing will be
increasing with each logged reading and Upstream implies that the
stationing will be decreasing with each logged reading. Note: For the
Upstream selection, it is important to enter a start station number that is
sufficiently large so that the last data collection location on the survey still
corresponds to a positive station number.
For the case of the “Manually-Entered Locations” option, it is not necessary
to select the Survey Direction as only actual station numbers will be entered
for each measurement location. For this case, the box labeled, “Known
Station” will be automatically checked, as indicated on the above window,
since all locations will have known station numbers.
Page 32 of 38
The start station number should be entered (if known) and a reading
acquired by clicking on the “Grab Resistance Value from Device” button
on the survey screen. Alternatively, the “Read” button on the Miller 400D
meter can be depressed after first placing the curser in the “Meter Value”
field.
Note: The reading acquisition time is approximately 5 seconds in either
case.
The acquired resistance reading will appear in the “Meter Value (R)” field
and the calculated resistivity value, based on the pin spacing, will appear in
the “Calculated Value (ρ)” field. All calculated resistivity values are in
ohm.cm units
Enter any textual remarks in the “Remarks” field
A resistivity value is saved by clicking or tapping on the “Log Reading”
button.
Multiple Pin Spacing Readings:
In the case of multiple-pin spacing readings, each calculated resistivity
value, based on each successively-acquired resistance value, is manuallylogged in turn.
The window below shows the acquired resistance value (5.0Ω) and the
calculated resistivity value (19,248.1Ω.cm) for the 20 foot pin spacing
example (the first of 3 pin spacing readings).
Page 33 of 38
The calculated resistivity value (19,248.1Ω.cm in this example case), is
saved by clicking or tapping on the “Log Reading” button. At that point, the
second prompt screen automatically-appears, as shown below, and the
resistance value acquired by clicking or tapping on the “Grab Resistance
Value from Device” button [or depressing the “Read” button on the Miller
400D] will be displayed in the “Meter Value” field.
Page 34 of 38
As indicated above, the acquired resistance value in this example, for the 10
foot pin spacing, is 10.1Ω and the calculated resistivity value is
19,347.4Ω.cm.
The calculated resistivity value (19,347.4Ω.cm in this example case), is
saved by clicking or tapping on the “Log Reading” button. At that point, the
third prompt screen automatically-appears, as shown below, and the
resistance value acquired by clicking or tapping on the “Grab Resistance
Value from Device” button [or depressing the “Read” button on the Miller
400D] will be displayed in the “Meter Value” field.
Page 35 of 38
The window above shows the acquired resistance value (15.1Ω) and the
calculated resistivity value (14,487.6Ω.cm) for the 5 foot pin spacing
example (the third of 3 pin spacing readings).
Clicking or tapping on the “Log Reading” button will save the final
calculated resistivity value for this location (site) and a fresh prompt screen
will be presented for the next location (next site).
The “Delete Last Site Location” button can be used to remove the
resistivity value(s) saved at the last site, if readings need to be re-taken, for
example. Note: If readings are to be re-taken at the “deleted” site, check the
currently-displayed station number and manually-enter the station number of
the current site (do-over) site location, if the currently-displayed station
number is not appropriate.
Saved resistivity values can be viewed via the “Edit Data” button, and
values can be edited also, if necessary.
Page 36 of 38
Exporting Survey Data to Excel:
The soil resistivity data logged on a survey can be exported to Excel for
future processing using the following procedure. Note: The export process
can be performed while connected to, or disconnected from, the Miller 400D
unit.
As indicated in the window below, an “Export to Excel” option is available
via the File menu.
IMPORTANT FINAL STEP
It is important, at the completion of a survey, to disconnect the software
application from the Miller 400D unit while the PDA or PC is in range of the
unit.
Note: Disconnecting the Bluetooth connection will allow the Bluetooth
radio in the Miller 400D to switch OFF (power-saving mode) after the LCD
shuts down.
Page 37 of 38
WARNING: If the software disconnection process is not carried out
(within range of the Miller 400D), the Bluetooth radio will remain ON,
even when the LCD automatically shuts down.
Select the “Disconnect” option from the “Miller 400D” menu, while in
range of the Miller 400D.
Page 38 of 38
Appendix 3: Influence of Test Lead Proximity (leads separate or bound
together) on the Accuracy of Resistance Readings as
measured by an AC Resistance Meter
Resistance Meter:
Miller 400D (4-Terminal Digital Resistance Meter)
Experimental Test Leads: Four 12 feet long cables (# 16 AWG insulated wire)
Test Lead Configurations: Case 1 – test leads physically separate
Case 2 – test leads bound together via ties
Resistance reading with
test leads separated
from each other
7.3MΩ
4.7MΩ
1.0MΩ
502KΩ
50.1KΩ
5.06KΩ
5.11Ω
Resistance reading with
test leads bound together
6.4MΩ
4.4MΩ
996KΩ
501KΩ
50.1KΩ
5.06KΩ
5.11Ω
Test lead
proximity-related
measurement error
12.3%
6.4%
0.4%
0.2%
zero
zero
zero
For load resistances greater than 1MΩ, in addition to internal meter errors, errors
associated with test lead proximity can also be significant, as indicated above. When test
leads are in close (physical) contact with each other, mutual capacitance and mutual
inductance effects can impact the current and voltage, respectively (and hence
the resultant resistance value). In such cases, the load (appearing across the input
terminals of the meter) is not purely resistive, but, has reactive components as well. In
particular, an effective shunt capacitor (due to the test leads being in close proximity) will
bleed-off some of the current (current that would have otherwise flowed through the
resistive soil), leading to inaccurate resistance values. High resistance readings are
particularly-affected by the shunt capacitance since the output currents are so small in
such cases and the current leakage effect is therefore magnified.
The solution to this issue is to make sure that the test leads are physically separated from
each other in cases where the soil resistance is greater than 1MΩ. So, for example, in the
case of the M. C. Miller 4-test lead reel, the test leads should be physically-separated
from each other (ties removed) if very high (>1MΩ) resistances are to be measured.
Note: This should only be an issue for soil with essentially zero moisture content since a
1MΩ soil resistance translates to a 1,000 x 106 Ω.cm soil resistivity for a 5 feet pin
spacing, for example.