1
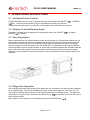
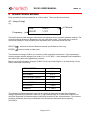
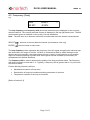
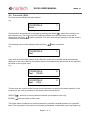
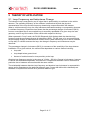
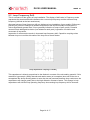
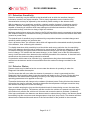
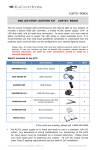
DU100
User Manual
REF No.: UG-DU100
ISSUE: 03
August 2009
DU100 USER MANUAL
ISSUE 03
Contents
1
Introduction.................................................................................................................................3
1.1
Compatible Detectors..........................................................................................................3
1.2
Related Documents.............................................................................................................3
1.3
Models Covered ..................................................................................................................3
2
DU100 Technical Specifications.................................................................................................4
3
Operational Instructions .............................................................................................................5
4
5
3.1
Intelligent Power Control .....................................................................................................5
3.2
Display Contrast/Viewing Angle ..........................................................................................5
3.3
Data Acquisition ..................................................................................................................5
3.4
Diagnostic Operation...........................................................................................................5
OPERATIONAL MODES............................................................................................................6
4.1
Loop (Loop).........................................................................................................................6
4.2
Frequency (Freq) ................................................................................................................7
4.3
Sensitivity (Sens) ................................................................................................................8
4.4
Status (Stat) ........................................................................................................................9
4.5
Time (Time) .......................................................................................................................10
4.6
Crosstalk (Xtlk)..................................................................................................................11
4.7
Built In Self-Test (Test) .....................................................................................................12
THEORY OF APPLICATION....................................................................................................13
5.1
Loop Frequency and Inductance Change .........................................................................13
5.2
Loop Frequency Drift.........................................................................................................14
5.3
Detection Sensitivity..........................................................................................................15
5.4
Detector Status .................................................................................................................15
5.5
Historical Fault Data..........................................................................................................16
5.6
Crosstalk Prevention .........................................................................................................16
Appendix A - Typical Values............................................................................................................17
Page 2 of 17
DU100 USER MANUAL
ISSUE 03
1 INTRODUCTION
The Nortech DU100 Diagnostic Unit is a hand held test instrument capable of providing
installation/service personnel with positive verification of the correct operation of a vehicle detector
installation. It may only be utilised in conjunction with diagnostic compatible vehicle detector
products from Nortech Industries.
Current operational and historical data are transferred from the vehicle detector to the DU100 by
means of an optical link. Data transmission form the vehicle detector limit occurs continuously so
no service disruption is necessary. Received data is verified for integrity by means of a cyclic
redundancy check (CRC) processes, and then displayed on a LCD screen.
1.1 Compatible Detectors
The DUI 00 can be used with the following inductive loop detectors:
PD130. PD139 (excluding FC models). PD140, PD230, PD239 (excluding PC models),
PD240. TD136. TD136 Enhanced. TD250. TD250L, TD250LS. TD252.
1.2 Related Documents
"Inductive Loop Vehicle Detection" Document No. MKT01.
1.3 Models Covered
This manual covers the following units:
895FT0001 - DU100 Diagnostic unit - English
895FT0002 - DU100 Diagnostic unit - German
895FT0003 – DU100 Diagnostic unit - French
895FT0004 - DU100 Diagnostic unit - Italian
895FT0005 - DU100 Diagnostic unit - Spanish
Page 3 of 17
DU100 USER MANUAL
ISSUE 03
2 DU100 TECHNICAL SPECIFICATIONS
Frequency Resolution
1Hz
Sensitivity Resolution
0.001 %ΔL/L
Display Element
2 line x 16 Character LCD
Display Contrast
Adjustable via multi-function keys
Keys
1 x Mode Selection, 1 x Power-on/execute
Auto Power off
2 Minutes after last operation
Optical Receiver
Detachable wand with photo-diode
Power Supply
4 x l.5V AA dry cell
Battery Life
> 10 hours continuous
Operating Temperature Range
0°C to +50°C
Dimensions
200mm (h) x 100mm (w) x 40mm (d)
Weight
380gms including batteries
Page 4 of 17
DU100 USER MANUAL
ISSUE 03
3 OPERATIONAL INSTRUCTIONS
3.1 Intelligent Power Control
The DU100 Diagnostic Unit may be powered-up by pressing either the SELECT [
[
] key. The unit may be turned off by the simultaneous pressing of both keys.
] or ENTER
Automatic power-down will occur after the unit has been left unused after two minutes.
3.2 Display Contrast/Viewing Angle
The display contrast may be adjusted by holding down either key: SELECT [
ENTER [
] for darker.
] for lighter,
3.3 Data Acquisition
Data is extracted form the vehicle detector under test by means of a unidirectional optical link. An
optical wand (normally located in the zippered side pocket of the DU100 bag) should be plugged
into the jack socket at the top of the unit and the unit should be powered-up. When the optical
wand is brought into close proximity of the red "RUN LED" of the detector under test, the DU100
will emit audible beeps as it acquires data. A single beep received indicates that sufficient data has
been received and the optical link may be broken at this stage to enable operator interrogation.
Alternatively, the optical link may be maintained in order to facilitate continuous data transfer and
updating.
3.4 Diagnostic Operation
After pressing any button and powering the diagnostic unit, information can be acquired (indicated
by an audible beep). The DU100 will display the type of the vehicle detector under test (e.g. PD
130) and its software release version on the top line of the two-line display screen. The lower line
will consist of a cyclical menu. Each time the SELECT key [ ] is pressed; the cursor will jump to
the next menu option.
Menu options, once selected, are activated by means of the ENTER key [
Page 5 of 17
].
DU100 USER MANUAL
ISSUE 03
4 OPERATIONAL MODES
Each operational mode corresponds to a menu option. These are discussed below.
4.1 Loop (Loop)
e.g.
Frequency
KHz
20.231
%dL/L
1.371
1
Channel
The loop frequency and change in inductance are displayed for the currently selected channel. The
currently selected channel is displayed in the top right hand corner. This mode can be used to
monitor the change in loop frequency and inductance as a vehicle traverses the loop.
SELECT [
ENTER [
] advance to the next detector channel (multi-channel units only).
] returns control to main menu.
The inductance change (%ΔL/L) is a measure of the magnitude of detection. Typical passenger
vehicles register a peak change of the order of 1% to 3% ΔL/L. Poorly designed loop installations
can lead to this value being significantly reduced.
Below are typical inductance changes (%ΔL/L) for a loop measuring 2m x 1m and having 3 turns
with no wire mesh reinforcing.
VEHICLE TYPE
ΔL/L
BICYCLE
0.04%
MOTORBIKE
0.12 %
ARTICULATED TRUCK
0.38%
FOUR WHEEL DRIVE
0.40%
5 TON TIP TRUCK
0.45 %
MOTORCAR
> 1.00 %
FORKLIFT
> 1.00 %
The inductance change parameter can also be utilised to determine whether the inductance
change registered by a particular vehicle (e.g. high undercarriage of a commercial vehicle) is of
sufficient magnitude to break through the sensitivity threshold of the vehicle detector. The relevant
sensitivity threshold value may be obtained from the detector data sheet and is typically
0.02%ΔL/L.
Page 6 of 17
DU100 USER MANUAL
ISSUE 03
4.2 Frequency (Freq)
e.g.
KHz
20.231
DRIFT
0.20%
1
The loop frequency and frequency drift (since last reset/retune) are displayed for the currently
selected channel. The currently selected channel is displayed in the top right hand corner. The drift
measurement gives an indication of the quality of a loop installation.
Note: The drift value is an historical value and is cleared each time the detector resets/retunes.
SELECT [
ENTER [
] advance to the next detector channel (multi-channel units only).
] returns control to main menu.
The loop frequency value represents the frequency of the AC signal energising the inductive loop
and should be in the range of 20 KHz· 150 KHz. It is determined both by switch settings on the
detector and loop geometry (size and number of turns). Loops in close proximity to one another
require a frequency spacing of greater than 2KHz typical to avoid crosstalk (not necessary for
multiplexed multi-channel detectors).
The frequency drift is used to determine the quality of the loop and feeder cable. The frequency
drift should normally be less than 3 %. Typically, a frequency drift of greater than 0.1% per minute
will cause a detect.
Factors affecting frequency drift are:
•
Mechanical movement of loop wires.
•
Deterioration of loop wire insulation allowing penetration of moisture.
•
Temperature variation of the loop environment.
[Refer to Section 5.2]
Page 7 of 17
DU100 USER MANUAL
ISSUE 03
4.3 Sensitivity (Sens)
e.g.
MIN
0.110%
MAX
3.401%
1
The minimum and maximum change in loop inductance during vehicle detection are displayed for
the currently selected channel. The currently selected channel is displayed in the top right hand
corner. These values represent absolute minima and maxima and are valid since the last detector
reset/retune.
Note: MIN and MAX are historical values, which are cleared each time the detector
resets/retunes. Their value will remain at zero until the first detect.
SELECT [
ENTER [
] advance to the next detector channel (multi-channel units only).
] returns control to main menu.
The maximum value (MAX) corresponds to the greatest magnitude of detection for all vehicles
since the last reset of the vehicle detector. If the vehicle detector is manually reset before a vehicle
traverses the loop, the MAX display will indicate the highest detection level over the profile vehicle.
Typical levels for a passenger vehicle are 1% - 3% ΔL/L. As the sensitivity of the installation can
be severely degraded by poor layout or proximity of ferrous metal, this value is useful for site-tosite comparisons (i.e. using the same vehicle).
The minimum value (MIN) indicates the smallest magnitude of inductance change (resulting in a
detect) for all vehicles, since the last reset of the vehicle detector.
Over a relatively short span of time, this value will tend towards the sensitivity setting of the vehicle
detector.
A detection change of greater than 15 % (typical) will cause the detector to re-tune. (A change
greater than 15 % is considered a fault condition).
Page 8 of 17
DU100 USER MANUAL
ISSUE 03
4.4 Status (Stat)
e.g.
STATUS
<Undetect>
Chan :
1
The loop status of the currently selected channel is displayed. The currently selected channel is
displayed in the top right hand corner.
Possible loop status conditions include:
I. Undetect
II. Detect
III. Open circuit
IV. Short circuit
V. Indeterminate
SELECT [
ENTER [
] advance to the next detector channel (multi-channel units only).
] returns control to main menu.
Open circuit status will also be caused by a loop inductance of greater than
1500µH to 2000µH (typical).
Short circuit status will also be caused by a loop inductance of less than 20µH (typical).
Page 9 of 17
DU100 USER MANUAL
ISSUE 03
4.5 Time (Time)
e.g.
10D
<RESET>
5H
1
Elapsed time (in days and hours) since the last reset/retune and the reason for the reset/retune are
displayed.
This information is particularly useful for detecting intermittent faults, which are self-healing.
Possible reasons for reset/retune include:
I. Reset: manual reset (push button) or power failure
II. Short circuit
III. Open circuit
IV. Indeterminate
V. Inductance change of greater than 15% ΔL/L (typical).
SELECT [
ENTER [
] advance to the next detector channel (multi-channel units only).
] returns control to main menu.
Page 10 of 17
DU100 USER MANUAL
ISSUE 03
4.6 Crosstalk (Xtlk)
First level screen awaiting first data capture.
e.g.
CROSSTALK
Store...
1
The channel to be stored can be changed by pressing the Select [ ] button if the detector is a
multi-channel unit. The frequency of the channel indicated in the top right hand corner will be
stored when the Enter [
] button is pressed. This value becomes the reference until the mode is
cleared and re-entered.
The following menu will be displayed after the Enter [
] button is pressed:
e.g.
CROSSTALK
Test:
1
Upon each successful data capture by the DU100 a result of the crosstalk will be automatically
displayed. If the same channel of the same detector is recaptured the test will fail as the result will
be based on the original value.
e.g.
CROSSTALK
Test: PASS
2
CROSSTALK
Test: FAIL
2
The test uses the original stored frequency and compares it to the new successful samples. If the
frequency is too close in proximity to the stored value, the test will fail.
SELECT [
ENTER [
] advance to the next detector channel (multi-channel units only).
] returns control to main menu.
This mode allows comparison of loop frequencies for potential crosstalk situations on a pass/fail
basis. The comparison can however be manually investigated, as described under loop frequency.
Page 11 of 17
DU100 USER MANUAL
ISSUE 03
Loops in close proximity to one another require a frequency spacing of greater than 2 kHz (typical)
to avoid crosstalk (not necessary for channels connected to the same multiplexed multi-channel
detectors.
4.7 Built In Self-Test (Test)
The function of the self-test is to check the diagnostic unit's functionality. The first test will test the
display and buzzer; the screen will blink with all characters flashing and the buzzer being audible
for this duration.
The next test is to verify that the EPROM (the device which contains all the diagnostic information)
is not damaged, the result being "PASS" or "FAIL". Below will be the checksum number of the
EPROM, which is used to verify the EPROM.
The next test is the RAM (the device which contains all the working parameters and received
information from the detector) and this test will ensure that the RAM has no errors. The result of
the test being "PASS" or "FAIL".
The last line of information returned from the test is the version number of the Diagnostic Unit.
The screen will then return to the normal operating mode.
Note: The keys will be disabled during the tests and restored upon the test completion.
Page 12 of 17
DU100 USER MANUAL
ISSUE 03
5 THEORY OF APPLICATION
5.1 Loop Frequency and Inductance Change
The inductive loop is energised by an AC signal that is produced by an oscillator in the vehicle
detector. The operating frequency of the oscillator is determined by both the physical
characteristics of the loop and the frequency determining components within the detector.
When a vehicle enters the loop, the loop inductance decreases causing a corresponding increase
in oscillator frequency. Experience has shown that the percentage change of inductance (ΔL/L)
from an unoccupied loop to an occupied loop is extremely repeatable for a given loop size and
geometry, and for a given location of the vehicle with respect to the loop.
When operated in "Loop" mode, the DU100 Diagnostic Unit displays both the absolute loop
frequency and the percentage change in inductance (ΔL/L). For the case of an unoccupied loop,
the percentage change in inductance will remain at zero (small values may occur due to oscillator
or loop drift). A vehicle traverses the loop, the change in frequency and inductance may be
observed.
The percentage change in inductance (ΔL/L) is a measure of the sensitivity of the loop detector
installation. For a given vehicle, the value will be dependent on various factors including:
•
Loop size
•
Loop depth below ground level
•
Amount of residual metal in close proximity to the loop
Absolute loop frequency may be in the range of 12 kHz - 150 kHz. Change in inductance, however,
is vehicle and installation dependent. Its merit lies in comparisons between various vehicles at a
particular site or between various sites with the same vehicle.
The relationship between absolute loop frequency and absolute loop inductance is exponential in
nature and is dependent on the particular detector type. Curves that define this relationship are
available on request from Nortech for a particular detector type.
Page 13 of 17
DU100 USER MANUAL
ISSUE 03
5.2 Loop Frequency Drift
This is a measure of the quality of loop installation. The display of drift value in Frequency mode
represents the absolute difference between the current loop frequency and the reference loop
frequency (defined at the last reset/retune).
Abnormal values of loop frequency drift can indicate a loop installation of poor quality. Drift occurs
primarily as a result of changes in ambient temperature and should normally be less than 3%.
Values significantly greater than 3% are generally indicative of loops of poor quality. Potential
causes include damaged insulation (low resistance earth path), ingression of moisture and
movement of loop wires.
Ingression of moisture also results in increased loop frequency drift. Capacitive coupling exists
between loop turns and the side walls of the loop slot as shown below:
Loop capacitance coupling in roadway slot
This capacitance is directly proportional to the dielectric constant of the slot sealing material. If this
material is hygroscopic (readily absorbs and retains water) or incomplete (does not fill the slot or
encapsulate the wires) allowing water to enter the slot and penetrate between loop conductors, the
capacitance will change greatly due to the high dielectric constant of water. This change in loop
capacitance will shift the loop operating frequency thus causing loop frequency drift to increase.
Page 14 of 17
DU100 USER MANUAL
ISSUE 03
5.3 Detection Sensitivity
Detection sensitivity may be defined as the threshold level at which the smallest change in
inductance results in an output actuation. This is clearly dependent on the inductive loop
characteristics and may be adjusted by the sensitivity switch setting on the detector itself.
With the detector set to maximum sensitivity, relatively smaller changes in inductance result in
detection. Detector sensitivity settings are designed such that maximum sensitivity should be
capable of detecting all vehicles while lower settings would eliminate detection of bicycles,
supermarket trolleys, and the over hang of high bed vehicles.
Maximum and minimum values (as shown in the DU100 sensitivity menu) correspond to the largest
and smallest changes in inductance resulting in detection since the last time the detector was reset
(manual or power reset).
The desired level of sensitivity may be achieved by comparison between recorded changes and
sensitivity switch settings at a particular site.
Over a process of time, the minimum value which will approach the demanded sensitivity threshold
of the detector, thus confirming this selection.
To reliably determine which sensitivity level should be used at any particular site, the sensitivity
level of the detector should be set to maximum (to ensure that all vehicles are detected). A variety
of vehicles matching the types used on the site should be driven over the loop to determine the
level of change. The vehicle with the lowest change ( on the "MAX" level of the DU100 sensitivity
menu) should be used to then determine the sensitivity threshold of the detector. A threshold more
sensitive than the observed change should be selected.
If a particular vehicle was to be excluded (e.g. supermarket trolley) then the threshold level
selected on the detector would be less sensitive than the maximum change recorded for the
vehicle.
5.4 Detector Status
Detector status may be defined as the current state the detector is operating in when the
Diagnostic Unit takes the samples.
The first event that will occur after the detector is powered or a loop is connected (and the
Diagnostic Unit is receiving data) is that the detector will begin to tune (Tuning). During this time
the detector will determine the operating frequency of the loop connected and most suitable
operating parameters to be applied to the loop.
Thereafter the detector will change to the undetect (Undetect) state. During this time the detector
will monitor the loop for vehicles, as well as determine the temperature changes around the loop
and detector and adjust the levels accordingly.
Upon a vehicle entering the loop and the threshold levels for detect being correct, the state then
changes to detect (Detect). The detector will then monitor the vehicle as it passes over the loop. It
will continuously monitor the vehicle until it leaves and reverts the state to undetect. (Undetect).
If the loop connected to the detector was disconnected or shorted due to failure, the detector would
immediately log this occurrence and change states to loop fault (Loop Fault). The detector will then
determine the characteristics and nature of the fault and wait for the problem to be corrected.
Page 15 of 17
DU100 USER MANUAL
ISSUE 03
5.5 Historical Fault Data
Historical Fault will display the last recorded fault by the detector as well as the time elapsed since
the last fault. If no fault has occurred during the detector's operation, the fault status will be
"RESET" and the time displayed will be from the time the detector was last powered lip or the reset
push button was pressed.
If a loop fault occurs then the fault will be recorded and the elapsed time since the fault occurred to
the current time will be displayed to the nearest hour. Even if the loop fault no longer exists the
event will remain until the next fault occurs. The loop fault will be displayed as either "Short Circuit"
or "Open Circuit". An open circuit indicates that the loop has been disconnected (wire continuity
broken). A short circuit indicates that the loop has been shorted at some point.
5.6 Crosstalk Prevention
When two or more loop configurations are in close proximity, the fields of one loop can interfere
and disturb the field of another. This phenomenon, known as crosstalk, can cause false detects
and cause the detector to lock-up and no longer function. The problem also exists when reinforcing
used to strengthen a structure is in close proximity to the loop. It provides an efficient means of
coupling two loops together.
Crosstalk can be eliminated by following a few simple steps:
•
Always ensure separation between loops when planning a new site. Where possible ensure
a minimum distance of 2 metres between loops.
•
When using non-multiplex detectors, change the number of turns between adjacent loops
by one or two turns, if a number of loops are being installed.
•
When reinforcing is present, the number of turns should be increased by two or more to
compensate for the loading effect of the loop caused by the reinforcing.
•
There will be a loss in sensitivity. The loop should also be mounted as far from the
reinforcing as possible, typically 150mm. Care should be taken to ensure that no loop cable
is exposed after sealing compound is applied.
•
The loop feeder should ideally be a twisted pair with a low series resistance so that the
feeder does not reduce sensitivity. The twisting of the feeders is especially important, as
this will counteract the effects of noise and crosstalk form adjacent feeders and power
cables. Typical twists are greater than 1 turn per 3 centimetres. (33 twist per metre).
•
Once detectors have been connected and powered up the loop frequencies must be
measured to check frequency separation between loops. When only one multiplex detector
is used, this does not need to be done. If more than one detector is used this is crucial.
Record the frequencies and check that there is at least 2000Hz separation between all
loops in close proximity to one another. Note that this situation can be severely aggravated
by the presence of steel reinforcing below the road surface.
Page 16 of 17
DU100 USER MANUAL
ISSUE 03
Appendix A - Typical Values
Detector
Model
Frequency of
Operation
Inductance Change
% ΔL/L
Drift
MIN
MAX
MIN
MAX
before
retune
MAX
less
than
Typical
20KHz
150Khz
0.02%ΔL/L
6%ΔL/L
Parking
12KHz
85Khz
0.02%ΔL/L
12KHz
140KHz
0.02%ΔL/L
MIN
MAX
3%
0.02 to
0.5%ΔL/L
0.03 to
0.6%ΔL/L
6%ΔL/L
3%
0.02 to
0.5%ΔL/L
0.03 to
0.6%ΔL/L
6%ΔL/L
3%
0.02 to
0.5%ΔL/L
0.03 to
0.6%ΔL/L
Detectors
Traffic
Sensitivity
% ΔL/L
Detectors
Page 17 of 17