1
RECOG Client User's Manual
Client User’s Manual
Ver.1.0.7
Octover 15, 2009
1
RECOG Client User's Manual
Table of Contents
1.
Outline of RECOG.........................................................................................................................................................9
1.1. What is RECOG?....................................................................................................................................................9
2.
Operating Environment of RECOG ..................................................................................................................... 10
2.1. Operating system................................................................................................................................................ 10
2.2. Compatible Java version ................................................................................................................................. 10
3.
Installation/Uninstallation ....................................................................................................................................... 11
3.1. Installation of RECOG for Windows ............................................................................................................ 11
3.2. Installation of RECOG for Mac ..................................................................................................................... 11
3.3. Installation of RECOG for Linux................................................................................................................... 11
3.4. Uninstallation of RECOG for Windows....................................................................................................... 12
3.5. Uninstallation of RECOG for Mac................................................................................................................ 12
3.6. Uninstallation of RECOG for Linux ............................................................................................................. 12
4.
Starting and Terminating RECOG ....................................................................................................................... 13
4.1. Starting RECOG.................................................................................................................................................. 13
4.2. Terminating RECOG .......................................................................................................................................... 13
5.
Display and Operation of the RECOG Main Window ................................................................................... 14
5.1. Screen structure................................................................................................................................................. 14
5.2. Window header ..................................................................................................................................................... 15
5.3. Menu bar................................................................................................................................................................. 15
5.4. Toolbox.................................................................................................................................................................... 18
5.5. Zooming scale bars ............................................................................................................................................ 19
5.6. Taxonomy Tree.................................................................................................................................................... 19
5.7. Phylogenetic Pattern Map(PPM)................................................................................................ 20
5.8. Info tab.................................................................................................................................................................... 21
5.9. Histogram tab................................................................................................................................................... 23
5.10. Status bar......................................................................................................................................................... 24
6.
Project Creation and Editing ................................................................................................................................. 25
6.1. Creation of a new Project ............................................................................................................................ 25
6.2. Open a project ..................................................................................................................................................... 26
6.3. Reference to a list of registered projects................................................................................................ 26
6.4. Project registration............................................................................................................................................ 27
2
RECOG Client User's Manual
6.5. Project information editing ............................................................................................................................. 27
6.6. Project removal ................................................................................................................................................... 28
7.
Switching the RECOG Server............................................................................................................................... 29
7.1. Checking the RECOG server used.............................................................................................................. 29
7.2. Switching the RECOG server........................................................................................................................ 29
7.3. Reference to the registered RECOG servers ........................................................................................ 29
7.4. Registering the RECOG server..................................................................................................................... 30
7.5. Editing the RECOG server.............................................................................................................................. 30
7.6. Removal of the RECOG server..................................................................................................................... 31
8.
Display and Manipulation of the Taxonomy Browser .................................................................................. 32
8.1. Expansion/Collapse of the Taxonomy Tree ............................................................................................ 32
8.2. Specification of a set of classification ranks to be displayed on the Taxonomy Tree ......... 32
8.3. Specification of the ingroup/outgroup....................................................................................................... 33
8.4. Automatic ingroup/outgroup specification .............................................................................................. 34
9.
Ortholog Clustering (DomClust)........................................................................................................................... 36
9.1. New analysis ......................................................................................................................................................... 36
9.2. Execution of DomClust.................................................................................................................................. 36
9.3. Display of the DomClust analysis results................................................................................................. 39
9.4. Display of the DomClust analysis result properties............................................................................. 40
9.5. Storage of the DomClust analysis results ............................................................................................... 41
10. Control Panel and Set Management Panel...................................................................................................... 42
10.1. Display on the control panel........................................................................................................................ 42
10.2. Control panel operation ................................................................................................................................. 43
10.3. Display of the set management panel ..................................................................................................... 44
10.4. Operation of the set management panel................................................................................................ 45
11. Display and Operation of the Phylogenetic Pattern Map.......................................................................... 46
11.1. Display of the locus tags of genes belonging to a cell ..................................................................... 46
11.2. Display of the cluster property on the cluster header..................................................................... 46
11.3. Display/Nondisplay of the homology cluster header......................................................................... 47
11.4. Species color setting...................................................................................................................................... 47
11.5. Changing the PPM cell/boundary color.................................................................................................. 47
11.6. Color change according to the gene count within a cell ................................................................. 48
11.7. Color display corresponding to each functional category............................................................... 49
11.8. Aggregated display of the PPM.................................................................................................................. 50
3
RECOG Client User's Manual
11.9. Limited display of a selected region on the PPM............................................................................... 51
11.10. Highlighting a species by selecting it on the Taxonomy Tree .................................................... 52
11.11. Selection of a species (phylogenetic pattern) in a cluster .......................................................... 52
12. Color Display by Properties................................................................................................................................... 53
12.1. Color display setting by properties........................................................................................................... 53
12.2. Enable/Disable property color setting .................................................................................................... 55
13. PPM Sort ....................................................................................................................................................................... 56
13.1. PPM sort in disaggregate mode ................................................................................................................. 56
13.2. PPM sort in the aggregate mode............................................................................................................... 57
13.3. Sort based on properties .............................................................................................................................. 58
13.4. Display of the sort conditions..................................................................................................................... 59
14. Phylogenetic Pattern Clustering (PhyloPatClust) ........................................................................................ 60
14.1. Execution of PhyloPatClust......................................................................................................................... 60
14.2. Operation of the clustering tree ................................................................................................................ 61
15. Taxonomy Filtering .................................................................................................................................................... 62
15.1. Displaying the taxonomy filtering conditions ........................................................................................ 62
15.2. Setting the All conditions ........................................................................................................................ 63
15.3. Setting the Any conditions...................................................................................................................... 63
15.4. Changing the names of the Any conditions ..................................................................................... 65
15.5. Changing the threshold value of the Any conditions ................................................................... 66
15.6. Setting the None conditions ................................................................................................................... 66
15.7. Enable/Disable conditions ............................................................................................................................ 67
15.8. Removal of conditions.................................................................................................................................... 67
16. Filtering by Gene Count/Species Count in the Phylogenetic Patterns.............................................. 69
16.1. Setting the conditions .................................................................................................................................... 69
16.2. Enable/Disable conditions ............................................................................................................................ 69
17. Keyword Search.......................................................................................................................................................... 70
17.1. Search of clusters ........................................................................................................................................... 70
17.2. Search of genes................................................................................................................................................ 72
17.3. Redisplaying the search results ................................................................................................................. 74
17.4. Enable/Disable filter settings by the search results......................................................................... 74
17.5. Enable/Disable color settings by the search results........................................................................ 74
18. Changing the Display Order of Species or Display/Nondisplay Status of Species ....................... 75
4
RECOG Client User's Manual
18.1. Changing the order of display of species............................................................................................... 75
18.2. Setting the display/nondisplay of species............................................................................................. 75
18.3. Adding species to be displayed .................................................................................................................. 75
18.4. Removing displayed species ........................................................................................................................ 75
19. List of Genes................................................................................................................................................................ 76
19.1. Displaying the list of genes .......................................................................................................................... 76
19.2. Sorting the list of genes................................................................................................................................ 76
19.3. Saving the list of genes ................................................................................................................................. 76
20. Display and Operation of the Circular Genome Map (CGM).................................................................... 77
20.1. Displaying the CGM......................................................................................................................................... 77
20.2. Changing the selected region...................................................................................................................... 78
20.3. Linkage between the PPM and CGM ....................................................................................................... 78
20.4. Changing the color of genes........................................................................................................................ 78
20.5. Displaying gene information in a browser............................................................................................... 79
21. Display and Operation of the Regional Genome Map(RGM)................................................................... 80
21.1. Displaying the RGM ......................................................................................................................................... 80
21.2. Zooming in/out on the RGM........................................................................................................................ 81
21.3. Display/Nondisplay of the Locus Tag...................................................................................................... 81
21.4. Setting the gene color.................................................................................................................................... 81
21.5. Displaying gene information in a web browser..................................................................................... 82
22. Multiple Alignment and Phylogenetic Tree ...................................................................................................... 83
22.1. Execution of multiple alignment ................................................................................................................. 83
22.2. Changing the colors of the amino-acid letter strings....................................................................... 85
22.3. Displaying the phylogenetic tree................................................................................................................ 85
23. Function Category Frequency Graph/ Numerical Data Graph ............................................................... 88
23.1. Function category frequency graphs ....................................................................................................... 88
23.2. Displaying a numerical data graph, a description or the function category ................... 88
23.3. Switching between the display/nondisplay of the.............................................................................. 90
23.3. Histogram tab................................................................................................................................................. 91
24. Clustering Neighborhood Genes........................................................................................................................... 92
24.1. Execution of the clustering of neighborhood genes .......................................................................... 92
Display/Nondisplay of the clustering results .................................................................................................. 93
24.2. Changing the color of a group of neighborhood genes..................................................................... 94
5
RECOG Client User's Manual
25. Species Groups........................................................................................................................................................... 95
25.1. Displaying species groups............................................................................................................................. 95
25.2. Registration of species groups ................................................................................................................... 95
25.3. Editing species group names ....................................................................................................................... 96
25.4. Removing species groups and removing species from a species group ................................... 96
26. Genome Core Structure Alignment (CoreAligner)........................................................................................ 97
26.1. Running the CoreAligner program ............................................................................................................. 97
26.2. Displaying the CoreAligner analysis results .......................................................................................... 99
26.3. Components of the core structure display ........................................................................................... 99
26.4. Changing the display position....................................................................................................................100
26.5. Selecting an ortholog group.......................................................................................................................100
26.6. Locating an ortholog group at center....................................................................................................100
26.7. Setting a reference genome ......................................................................................................................100
26.8. Display/Nondisplay of species..................................................................................................................101
26.9. Changing the display order of species ..................................................................................................101
26.10. Resetting the window size .......................................................................................................................102
26.11. Changing the display style of species names ..................................................................................102
26.12. Changing the ortholog group labels......................................................................................................102
26.13. Zoom .................................................................................................................................................................103
26.14. Searching by gene name/Locus Tag...................................................................................................103
26.15. Printing the core structure image......................................................................................................104
26.16. Saving the CoreAligner results ..............................................................................................................104
27. Genome Comparison Viewer ...............................................................................................................................105
27.1. Displaying the Genome Comparison Viewer .......................................................................................106
27.2. Changing the display area...........................................................................................................................106
27.3. Zooming ..............................................................................................................................................................106
27.4. Moving a specified ortholog group to the center of the screen.................................................107
27.5. Displaying gene information in a browser.............................................................................................107
27.6. Saving the origin .............................................................................................................................................107
27.7. Recovering the origin....................................................................................................................................107
27.8. Display/Nondisplay of species..................................................................................................................108
27.9. Changing the display order of species ..................................................................................................109
27.10. Display/Nondisplay of genes or ortholog lines................................................................................109
27.11. Changing the display style of species names ..................................................................................110
27.12. Display/Nondisplay of the Locus Tag .................................................................................................111
6
RECOG Client User's Manual
27.13. Color setting ..................................................................................................................................................111
27.14. Automatic correction of the gene orientation.................................................................................112
27.15. Changing the display style of the scale marks................................................................................113
27.16. Printing .............................................................................................................................................................114
28. Updating the Gene Information ..........................................................................................................................115
28.1. Updating the Taxonomy Tree based on the update notice ..........................................................115
28.2. Updating gene information through Update Data .............................................................................116
29. Registration and Management of Gene/Cluster Properties...................................................................117
29.1. Registration of gene properties................................................................................................................117
29.2. Referencing a list of gene/cluster properties....................................................................................118
29.3. Editing properties ...........................................................................................................................................120
29.4. Removing a property.....................................................................................................................................120
30. Registration and Management of Gene/Cluster Sets ..............................................................................121
30.1. Registration of a gene/cluster set..........................................................................................................121
30.2. Outputting a gene/cluster set to a file.................................................................................................124
30.3. Editing a gene/cluster set (removing genes)......................................................................................124
30.4. Registering additional genes/clusters to a gene/cluster set......................................................125
30.5. Removing a gene/cluster set....................................................................................................................125
30.6. Referencing the list of gene/cluster sets............................................................................................125
31. Combined Set ............................................................................................................................................................127
31.1. Registering a combined set........................................................................................................................127
31.2. Editing a combined set.................................................................................................................................130
31.3. Removing a combined set...........................................................................................................................130
31.4. Specifying a combined set as a filter condition ................................................................................130
31.5. Specifying a combined set as a color condition................................................................................130
31.6. Enabling/Disabling a filter setting............................................................................................................131
31.7. Enabling/Disabling a color setting...........................................................................................................131
32. Species Set ................................................................................................................................................................132
32.1. Registering a species set............................................................................................................................132
32.2. Editing a species set name ........................................................................................................................133
32.3. Removing a species set...............................................................................................................................133
32.4. Setting colors using a species set..........................................................................................................133
32.5. Taxonomy filtering using a species set.................................................................................................133
7
RECOG Client User's Manual
33. Similar Phylogenetic Pattern Search...............................................................................................................134
33.1. Profile registration from a cluster...........................................................................................................134
33.2. Editing a profile ...............................................................................................................................................135
33.3. Removing a profile .........................................................................................................................................135
33.4. Similar phylogenetic pattern search.......................................................................................................136
33.5. Uses of the results of the phylogenetic pattern similarity search............................................138
33.6. Removing the phylogenetic pattern similarity search.....................................................................139
34. Downloading the sequence information ..........................................................................................................140
34.1. Downloading the sequence information ................................................................................................140
35. Management of External Resource URL s....................................................................................................142
35.1. Registering an external resource URL ..................................................................................................142
35.2. Editing an external resource URL ...........................................................................................................143
35.3. Removing an external resource URL .....................................................................................................143
36. Appendix.......................................................................................................................................................................144
36.1. DomClust parameters...................................................................................................................................144
37. Glossary .......................................................................................................................................................................147
8
RECOG Client User's Manual
1. Outline of RECOG
1.1. What is RECOG?
RECOG (Research Environment for Comparative Genomics) is a workbench software
program which is used to conduct comparative genome analyses on a massive scale. The
main feature of RECOG is the function of ortholog analysis between genomes of numerous
species based on the display of an ortholog table (rows: ortholog groups; columns: species).
RECOG can also conduct various comparative analyses for detailed examination, based on
this table.
RECOG was developed based on the MBGD (Microbial Genome Database for Comparative
Analysis). RECOG is a dedicated client software program that is available immediately after
connecting to the MBGD server. Meanwhile, the analysis of newly determined microbial
genomes, eukaryotic genomes, etc. that are not included in the MBGD can also be
conducted in a local environment, by installing the RECOG server locally.
The latest version of RECOG is available from http://mbgd.genome.ad.jp/RECOG/.
This manual explains how to use the RECOG Client software program.
9
RECOG Client User's Manual
2. Operating Environment of RECOG
2.1. Operating system
Mac OS 10.3 and upward
Windows XP, Vista
Linux
2.2. Compatible Java version
Java 1.4 and upward
Note: Make sure that Java JRE 1.4 and upward is installed before installing the RECOG
Client software program. If it is not installed, install Java JRE 1.4 and upward before
installing the RECOG Client software program.
10
RECOG Client User's Manual
3. Installation/Uninstallation
3.1. Installation of RECOG for Windows
1.
Set ‘JAVA_HOME,’ an environmental variable, as follows:
Variable: JAVA_HOME
Value: the directory in which the JAVA JRE is installed.
2.
Double-click recog-client-<version>.exe to start the installation.
Install RECOG by following the instructions on the screen. Upon completion of the
installation process, the RECOG menu is added to the start menu.
3.2. Installation of RECOG for Mac
1.
Double-click recog-client.pkg.tgz to create recog-client.pkg.
2.
Double-click recog-client.pkg to start the installation.
Install RECOG by following the instructions on the screen.
During the installation, the administrator’s username and password are requested.
3.3. Installation of RECOG for Linux
1.
Set ‘JAVA_HOME,’ an environmental variable, with the following command:
bash:
csh:
2.
export JAVA_HOME=<JAVA JRE home directory>
setenv JAVA_HOME <JAVA JRE home directory>
Decompress recog-client-<version>.tgz to create a recog directory.
Create the recog directory in an appropriate place.
11
RECOG Client User's Manual
3.4. Uninstallation of RECOG for Windows
1.
Click Uninstall RECOG in the start menu to remove the installation directory.
2.
If the installation directory is not removed, remove it manually.
3.
The data directory C:¥Documents and Settings¥<user account>¥RECOG is not
removed by the above uninstallation procedure. If you do not need it, remove it manually.
3.5. Uninstallation of RECOG for Mac
1.
Remove the following directory manually:
/Application/recog.app
/Library/Receipts/recog-client.pkg
2.
The data directory /Users/<user account>/RECOG is not removed by the above
uninstallation procedure. If you do not need it, remove it manually.
3.6. Uninstallation of RECOG for Linux
1.
Remove the recog directory manually.
2.
The data directory /home/<user account>/RECOG is not removed by the above
uninstallation procedure. If you do not need it, remove it manually.
12
RECOG Client User's Manual
4. Starting and Terminating RECOG
4.1. Starting RECOG
Windows
Click Start – All programs – RECOG – RECOG menu.
Mac
Open /Applications in the finder window and double-click the RECOG icon.
Linux
From the terminal, move to the recog directory, and execute the following command:
./recog.sh
4.2. Terminating RECOG
On the menu screen, click File – Exit.
13
RECOG Client User's Manual
5. Display and Operation of the RECOG Main
Window
5.1. Screen structure
The main window consists of the following components:
5.2
Window header
5.3
Menu bar
5.4
Toolbox
5.5
Zooming scale bars
5.6
Taxonomy Tree
5.7
Phylogenetic Pattern Map(PPM)
5.8
Info tab
5.9
Histogram tab
5.10
Status bar
14
RECOG Client User's Manual
5.2. Window header
The RECOG Client version, name of the current project and name of the DomClust result file
are displayed.
5.3. Menu bar
5.3.1.
File menu
New
New Analysis
The currently displayed analysis is cleared.
New Project
A new project is created.
Change Server…
RECOG server
The RECOG server to be used for analysis is specified.
Server List…
The list of registered RECOG servers is displayed.
Open file
Analysis result files, including DomClust result files, are opened.
Open Project
Project
An existing project is opened.
15
RECOG Client User's Manual
Project List…
The list of existing projects is displayed.
Save Cluster file…
The currently displayed analysis results are saved.
Import
DomClust file…
DomClust result files are imported.
Gene property file…
Gene property files are imported.
Export
DomClust results are output in tab-delimited format, and PPM images are output in
PDF format.
Genome Mapping
Regarding imperfect genomes, the contig alignment sequence, direction, etc. on the
chromosome are set.
Page setup…
The size of the PPM image to be saved is specified.
Update Data
The local genetic data are updated.
Exit
The RECOG Client is terminated.
5.3.2.
View menu
Aggregate Mode / Disaggregate Mode
The PPM display mode is switched between the aggregate mode
and the disaggregate mode.
Cluster Mode/Sub-cluster Mode
Regarding the analysis of sort, etc., whether to conduct an
analysis based on clusters or sub-clusters is specified.
Expand Taxonomy Tree
The tree in the taxonomy browser is expanded one level.
Collapse Taxonomy Tree
The tree in the taxonomy browser is collapsed one level.
Select all clusters on PPM
All the clusters on the phylogenetic pattern map (PPM) are
selected.
16
RECOG Client User's Manual
PPM Label
Whether to display the gene name or the cluster ID in the label
display fields on both sides of the PPM is specified.
Color genes by properties
Each gene on the PPM is classified by color in proportion to the
gene property value.
Histogram
The Histogram tab is used to create graphical representations
based on the gene property numerical data.
Taxonomy Tree Pane
Whether or not to display the taxonomy tree pane is specified.
Function Category Pane
Whether or not to display the function category pane is
specified.
5.3.3.
Tool menu
Keyword Search…
A keyword search is conducted regarding the gene/cluster properties.
Organism/Gene Count Filter
The filtering conditions are specified based on the gene count/species in
a cluster.
5.3.4.
Run menu
Ortholog Clustering (DomClust)...
DomClust analysis is conducted.
Phylogenetic pattern clustering (PhyloPatClust)...
Phylogenetic pattern clustering is carried out.
Core Genome Alignment (CoreAligner)...
CoreAligner analysis is conducted.
Neighboring Clusters...
Neighboring gene clustering is carried out.
17
RECOG Client User's Manual
5.3.5.
Option menu
Option...
The option screen is displayed.
URL...
The URL for displaying genetic information from an external resource is set.
Gene Property /
The list of registered gene properties/cluster properties is displayed.
Cluster Property List…
Gene Set / Cluster Set List…
The list of registered gene sets/cluster sets is displayed.
Properties...
The properties of the displayed analysis results are displayed.
5.4. Toolbox
The Toolbox can be moved by dragging and dropping the left side of the Toolbox with the
mouse.
To return the Toolbox to its original position, click the Close button on the upper right of the
Toolbox.
Open file
Save Cluster File
Import DomClust file
Export
Aggregate Mode / Disaggregate Mode
Cluster Mode / Sub Cluster Mode
Expand/Collapse Taxonomy Tree
Color genes by properties
Histogram
Keyword Search
Ortholog Clustering (DomClust)
Phylogenetic pattern clustering (PhyloPatClust)
Core Genome Alignment (CoreAligner)
18
RECOG Client User's Manual
Neighboring Clusters
Option
5.5. Zooming scale bars
Each zooming scale bar expands or contracts the horizontal/vertical size of the PPM.
Vertical Zoom scale bar
The longitudinal size of the PPM cell is expanded or contracted by sliding the scale bar
laterally.
Horizontal Zoom scale bar
The transverse size of the PPM cell is expanded or contracted by sliding the scale bar
laterally.
5.6. Taxonomy Tree
The Taxonomy Tree displays the taxonomic tree of the given species.
1.
All tab for selecting the species to be analyzed
The taxonomic tree of all the species registered in the RECOG server is displayed.
On the tree screen, it is possible to choose the species (ingroup, outgroup) for DomClust
analysis and to color the species.
2.
Selected tab for PPM manipulation
This tab consists of upper and lower views.
The upper view displays the taxonomic tree for the organisms (shown on the PPM) that
are currently targeted for analysis.
On the tree screen, phylogenetic pattern filtering conditions, species groups, etc. can be
set.
The lower view changes by selecting one of the following upper buttons:
Control
A view for controlling the display of ortholog table, including the color settings, filter
settings, sort settings, and the switching of the order of display or the
display/nondisplay of the PPM species, is displayed.
19
RECOG Client User's Manual
Sp Group
Species groups are displayed.
Set
Currently registered gene sets, cluster sets, compound conditions and species sets are
displayed.
3.
Clustering tab
The hierarchical clustering tree obtained from phylogenetic pattern clustering is displayed.
5.7. Phylogenetic Pattern Map(PPM)
The Phylogenetic Pattern Map (PPM) is the main feature of the RECOG system. In the
PPM, genes that belong to each ortholog group are listed in a table in which ortholog groups
and species are arranged in the rows and columns, respectively. When the display area is
reduced, a pattern representing the presence or absence of genes (phylogenetic pattern) is
displayed as a heat map. Basically, species are shown in the order of appearance on the
taxonomy tree, but if outgroup species are specified, ingroup species are displayed on the left
side and outgroup species are displayed on the right side. However, the order of display can
be changed via the operation panel. In each cell, the /locus_tag of the gene, which belongs to
the cell, or the number of genes is displayed. When a cell is clicked, the relevant cluster and
gene data are displayed on the Info tab at the right end.
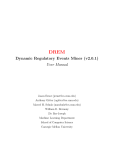
If DomClust analysis is carried out upon specifying outgroup species, the cluster table is
displayed as a nested table. That is, genes in the outgroup species form an outgroup cluster
which corresponds to multiple sub-clusters that consists of genes in the ingroup species. All
of these are included in the (upper-hierarchical) cluster (see the figure below). Furthermore,
as its upper-hierarchical cluster, a homologous cluster is defined as an accumulation of
homologous ortholog groups. In normal disaggregate mode, the function categories and gene
names (or cluster ID’s) of the sub-clusters are displayed in the columns on the left side, the
function categories and gene names of the clusters are displayed in the columns on the right
side, and homologous clusters are displayed on the right side thereof. These columns are
called cluster headers. On the other hand, in the aggregate mode, clusters of the same
phylogenetic pattern are displayed in the same row in an aggregated manner, and no cluster
headers are displayed.
20
RECOG Client User's Manual
Nested table structure
RECOG screen display
5.8. Info tab
The Info tab displays the cluster selected on the PPM and the gene information in that cluster.
In the aggregate mode, multiple clusters with the same phylogenetic pattern are displayed.
1.
Cluster description field (at the top)
The cluster selected on the PPM is described.
21
RECOG Client User's Manual
2.
Cluster information table (upper table)
The cluster information selected on the PPM is displayed. When the table is
double-clicked, a browser is activated and the details of the cluster information are shown.
Also, by right-clicking the selected cluster on the table, various functions, including
Multiple Alignment and the display of a Regional Genome Map, for the selected gene
group can be executed.
Cluster ID
The cluster ID is displayed.
Gene Name
The representative gene name of the cluster (sub-cluster) is
displayed.
Description
The representative description of the cluster (sub-cluster) is
displayed. As the background color, the color corresponding to the
typical function category of the cluster (sub-cluster) is used.
3.
Gene information table (center table)
The information on the genes belonging to the cluster selected on the PPM or the cluster
information table is displayed. Upon double-clicking, a web browser is activated and the
details of the gene information are displayed. If multiple genes on the table are selected
and right-clicked, various functions, including Multiple Alignment and the display of a
Regional Genome Map, for the selected gene group can be executed.
Organism
The species code is displayed.
Locus Tag
The locus tag of a gene (domain) is displayed. For the domain, the
domain number is shown at the word’s end.
4.
Detailed gene information table (lower table)
Detailed information on the gene selected on the PPM or the cluster information table is
displayed. The registered gene properties are also displayed.
Organism
The species code is displayed.
Locus Tag
Locus Tag
Gene Name
Gene name
Accession (P)
Accession number
Position
Gene region
Direction
Direction of gene
Feature Key
Feature key
GI number
GI number
Gene ID
Gene ID
Description
Description
22
RECOG Client User's Manual
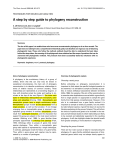
5.9. Histogram tab
On the Histogram tab, cluster properties are displayed in graphs of various types. In normal
disaggregate mode, annotation information is displayed.
Aggregate mode
Bar graph for phylogenetic pattern frequency
Disaggregate
Description / Function Category
mode
The description is displayed. For the background color, the color of
the sub-cluster’s typical function category is displayed.
Value
1. The species’ numerical data are displayed in a bar graph/line
graph.
Difference
2. The differences in the species’ numerical data are displayed in a
bar graph/line graph.
Histogram display in the aggregate mode
Annotation display
Gra
Graph display of the property value
23
RECOG Client User's Manual
5.10. Status bar
The Status bar displays the amount of used memory, PPM information and application update
information.
1.
Display of the amount of used memory (left side)
The amount of memory used by the current application is displayed.
Left side: the amount of memory used by the application
Right side: the amount of memory allocated to the application
2.
Display of PPM size information (center)
Left side: the number of species shown on the PPM
Right side: the number of clusters (or total number of phylogenetic patterns in the
aggregation mode) shown on the PPM
3.
Update information (right side)
The update notice icon is displayed on the right side of the status bar when any application
or public data is updated. The update information is accessed by clicking this icon.
24
RECOG Client User's Manual
6. Project Creation and Editing
A Project is a saved collection of related analysis results. In default mode, the default project
is selected, and all analysis results are stored therein. It is advisable to create a dedicated
project before proceeding with any analysis.
6.1. Creation of a new Project
3.
Click File – New – New Project….
The New Project screen appears.
4.
On the New Project screen, enter a project name and the URL of the RECOG server that
will conduct the analysis. The RECOG server can be selected from the menu from among
all the registered servers. If an official server is used, the default settings do not have to be
changed. To register the URL for a new server, click the New Server… button to register
it on the New Server screen.
5.
When the Apply button on the New Project screen is clicked, the project is
registered and opened.
(Note)To register a project, ensure that you can connect to the RECOG server.
25
RECOG Client User's Manual
6.2. Open a project
1.
Click File – Open Project, and click the relevant project. The clicked project opens.
6.3. Reference to a list of registered projects
1.
Click File – Open Project – Project List… to display the Project List screen.
The registered project names and the RECOG server URL are displayed on the Project List
screen. Also, the Select field of the project in use is displayed and checked.
26
RECOG Client User's Manual
6.4. Project registration
1.
Click File – Open Project – Project List… to display the Project List screen.
2.
On the Project List screen, click the Add… button to display the New Project screen.
3.
On the New Project screen, enter the project name and set the URL of the RECOG server
that will conduct the analysis.
To register the URL for a new server, click the New Server… button and register it on the
New Server screen.
4.
On the New Project screen, click the Apply button.
5.
Click the Apply button on the Project List screen.
6.5. Project information editing
1.
Click File – Open Project – Project List… to display the Project List screen.
2.
On the Project List screen, select the project and click the Edit button to display the Edit
Project screen.
3.
On the Edit Project screen, change the project name and server URL.
4.
After editing, click the Apply button on the Edit Project screen to display the details of the
edited information on the Project List screen.
5.
Click the Apply button on the Project List screen.
27
RECOG Client User's Manual
6.6. Project removal
1.
Click File – Open Project – Project List… to display the Project List screen.
2.
On the Project List screen, select the project to be removed and click the Delete button. A
warning message appears. Click the OK button.
3.
On the Project List screen, click the Apply button.
(Note) Upon the removal of the project, all the analysis results, including the DomClust results,
of the project are removed.
(Note) The files created in a project are saved in the following folder in the user’s home
directory: RECOG/project/project_name. So, unnecessary files can be removed by
directly accessing this folder.
28
RECOG Client User's Manual
7. Switching the RECOG Server
The RECOG servers that conduct DomClust analysis and CoreAligner analysis can be
switched. When a project is opened, the default RECOG server that is set for the project
conducts the analysis.
7.1. Checking the RECOG server used
1.
Click File – Change Server to access the list of URL’s of registered RECOG servers. The
server currently used for analysis is checked.
7.2. Switching the RECOG server
1.
Click File – Change Server, and click the RECOG server to be used. The RECOG server
in use is switched, and the Taxonomy Tree on the All tab is updated using the data from
the newly specified RECOG server.
(Note) When the DomClust analysis results are displayed, the RECOG server cannot be
switched. Click File – New – New Analysis to clear the display and start a new analysis.
7.3. Reference to the registered RECOG servers
1.
Click File – Change Server – Server List… to display the Server List screen. A list of
registered RECOG servers is displayed. The RECOG server used for analysis is checked
in the Select field.
29
RECOG Client User's Manual
7.4. Registering the RECOG server
1.
Click File – Change Server – Server List… to display the Server List screen.
2.
On the Server List screen, click the Add... button to display the New Server screen.
3.
On the New Server screen, enter the URL of the RECOG server and click the Apply
button.
4.
On the Server List screen, click the Apply button.
7.5. Editing the RECOG server
1.
Click File – Change Server – Server List… to display the Server List screen.
2.
On the Server List screen, select the RECOG server to be edited and click the Edit...
button. The Edit Server screen is displayed.
3.
On the Edit Server screen, enter the URL of the RECOG server and click the Apply
button.
4.
On the Server List screen, click the Apply button.
30
RECOG Client User's Manual
7.6. Removal of the RECOG server
1.
Click File – Change Server – Server List… to display the Server List screen.
2.
On the Server List screen, select the RECOG server to be removed and click the Delete
button. A warning message appears. Click the OK button.
3.
On the Server List screen, click the Apply button.
31
RECOG Client User's Manual
8. Display and Manipulation of the Taxonomy
Browser
The Taxonomy Browser displays the taxonomy tree of organisms. On the tree, manipulations
can be performed, including the selection of the ingroup/outgroup to be subjected to DomClust
analysis.
The Taxonomy Browser comprises the All tab for specifying the species group to be subjected
to analysis from among all the available species, and the Selected tab for specifying various
manipulations of the species group to be subjected to analysis.
8.1. Expansion/Collapse of the Taxonomy Tree
The classification hierarchy of the Taxonomy Tree can be expanded or collapsed in a stepwise
manner by clicking the Toolbox buttons.
For expansion, click
(Expand Taxonomy Tree) in the Toolbox. One expansion
increment is made for each click.
For collapsing, click
(Collapse Taxonomy Tree) in the Toolbox. One collapsing
increment is made for each click.
8.2. Specification of a set of classification ranks to be
displayed on the Taxonomy Tree
Users can choose a set of taxonomic ranks (species, genus, family, order, etc.) to be displayed
on the Taxonomy Tree.
1.
Click
(Option) in the Toolbox to display the Option screen.
2.
On the Option screen, click the Taxonomy Tree tab.
3.
On the Taxonomy Tree tab’s Display Rank form, specify the classification rank to be
displayed.
32
RECOG Client User's Manual
All: All the taxonomic ranks are displayed.
Select: Only the checked taxonomic ranks are displayed.
* Click the Default button to return to the default settings.
8.3. Specification of the ingroup/outgroup
On the All tab, users can choose a set of species to be compared by the DomClust program.
Specify a set of species belonging to the interested phylogenetic group as ingroup, and specify,
as the need arises, a set of distantly related species for comparison as outgroup (the
specification of the ingroup is mandatory, while the specification of outgroup is optional). If the
outgroup is specified, groups are severed in creating an ortholog group so that the ingroup
species form a single phylogenetic group against the outgroup species.
1.
On the Taxonomy Tree, select and click the relevant species or taxonomy nodes.
2.
Click the right mouse button, and click Group – Ingroup or Outgroup. The selected
species are chosen as the ingroup or the outgroup species, respectively.
IN is displayed for the ingroup species, and OUT is displayed for the outgroup species.
33
RECOG Client User's Manual
2.
To cancel the selection of the ingroup/outgroup species, select and click the relevant
species or taxonomic group on the Taxonomy Tree and click Group – Cancel. To cancel
all species or groups, click Cancel on the uppermost root node.
8.4. Automatic ingroup/outgroup specification
The best way to evenly select the species to be analyzed is to select a representative species for
each taxonomic rank. RECOG can automatically select a representative species from each
taxonomic group for choosing the target species. Here the weight of species is determined by
the date of publication of the genome sequence; that is, the earlier the determination of the
genome sequence, the higher its significance.
1.
From the Rank drop-down menu located above the Taxonomy Tree, specify the normative
taxonomic rank.
2.
On the Taxonomy Tree, select and click the taxonomic group (with a rank higher than the
normative rank specified above) to be subjected to analysis.
3.
Click the right mouse button, and click Group – Auto Ingroup or Auto Outgroup. From
among the selected classification groups, the species with the highest weight is chosen as
ingroup/outgroup species for each normative-rank taxonomic group.
(Supplement) Rank item modifications
To modify the Rank items in the drop-down menu:
1.
Click
(Option) in the Toolbox to display the Option screen.
2.
On the Option screen, click the Taxonomy Tree tab.
3.
In the Rank Item form on the Taxonomy Tree tab, check the taxonomic rank to be
34
RECOG Client User's Manual
displayed.
4.
Click the Apply button on the Option screen.
35
RECOG Client User's Manual
9. Ortholog Clustering (DomClust)
Ortholog clustering is performed upon specifying a species. The result is displayed on the
PPM. This is the first analysis conducted in RECOG, and is the basis for all comparative
analyses.
9.1. New analysis
If any DomClust analysis result is displayed, clear the result.
1.
Click New – New Analysis to clear the currently displayed DomClust analysis result.
9.2. Execution of DomClust
(Note) DomClust analysis is possible only in an environment where Internet connection is
available.
2.
Specify the ingroup/outgroup by means of the method shown in 8.3
Specification
of the ingroup/outgroup.
3.
Click
(Ortholog Clustering (DomClust)) in the Toolbox to display the
Execute domclust screen.
4.
On the Execute domclust screen, enter the analysis name in the Name field. The result is
automatically saved under the analysis name entered here.
If the default parameter set is used, select ‘Default parameters’; if the parameter set
executed immediately theretofore is used, select ‘<<Last Parameters>>’; if DomClust is
conducted using a parameter set saved previously, select the parameter set saved in the
Parameter set field.
36
RECOG Client User's Manual
5.
To specify a new parameter set, click the Parameters… button and set it on the displayed
parameter-setting screen. For details on the parameters, refer to 37.1 DomClust
Parameters.
6.
To save the parameters that were set on the parameter-setting screen, click the Save
parameters button. To remove the saved setting, specify the parameters to be removed in
the Parameter set field and click the Delete this parameter set button.
7.
After specifying the DomClust analysis result name and parameters, click the Run button
to display the progress screen and execute the DomClust analysis.
Click the Run in background button on the progress screen to execute the DomClust
analysis in the background. In this setting, other operations can be performed concurrently.
To see the progress screen of the DomClust analysis that is underway in the background,
37
RECOG Client User's Manual
double-click the progress bar displayed at the bottom right of the screen.
8.
Upon the completion of the DomClust analysis, the DomClust analysis result is displayed
on the PPM. When the completion message is displayed, click the OK button.
If the analysis is executed in the background, the ”Load DomClust file?” message is
displayed. Click the OK button.
38
RECOG Client User's Manual
9.3. Display of the DomClust analysis results
The previous DomClust analysis results are displayed.
1.
Click
(Open files) in the Toolbox to display the Open file screen.
2.
On the Open files screen, select the file filter DomClust File (.dclst, .cluster), and then
select a project and a DomClust analysis result file.
Upon selecting the DomClust analysis result file, the relevant information (species set and
parameters) on the analysis result is displayed on the right side of the screen.
3.
Click the Apply button on the Open files screen to display the selected DomClust analysis
result.
39
RECOG Client User's Manual
9.4. Display of the DomClust analysis result properties
For the DomClust analysis result, the parameters for the DomClust execution, the applied PPM
sorting conditions, etc. are displayed.
Also, the RECOG server can be edited for default access by the currently displayed DomClust
analysis result.
9.
Click Option – Properties… to display the Properties screen.
10. To edit the RECOG server, select the server from among those listed by double-clicking
value in the Server drop-down menu, and click the Apply button.
40
RECOG Client User's Manual
9.5. Storage of the DomClust analysis results
The DomClust analysis result is automatically saved to the project directory or one of its
lower-level directories when the analysis is conducted. To refer to the analysis result using
another tool, save the analysis result in DomClust format (.dclst) or tab-delimited format.
Although the tab-delimited format file is useful for loading it into and displaying it on Excel,
etc., the information on the domain boundary and other types of information are lost. To reload
the analysis result into RECOG, save it in DomClust format.
9.5.1.
Storing a file in DomClust format
1.
Click
(Save Cluster file) in the Toolbox to display the Save Cluster file screen.
2.
On the Save Cluster file screen, specify the file name and the destination folder, and click
the OK button.
9.5.2.
Storing a file in tab-delimited format
1.
Click
(Export) in the Toolbox to display the Export screen.
2.
On the Export screen, specify the file name and the destination folder, and click the OK
button.
41
RECOG Client User's Manual
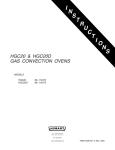
10. Control Panel and Set Management Panel
On the control panel, the filtering settings, alignment sequence settings and display/nondisplay
settings for species, sort settings, color settings and phylogenic patterns can be specified.
Also, on the set management panel, the gene sets/cluster sets, combined sets and species sets
can be managed.
Set management panel
Control panel
10.1. Display on the control panel
Click the Selected tab on the right side of the screen and click the downward Control button
to display the control panel.
42
RECOG Client User's Manual
10.2. Control panel operation
10.2.1.
Filter settings (Filter)
Filter refers to the conditions for selecting the row (cluster) that is displayed on the PPM. In
the Filter folder on the control panel, the filter conditions that are currently applied to the
PPM are displayed. Only those clusters that meet all the filter conditions are displayed on the
PPM. Click Enable/Disable to enable or disable the filter settings.
The following filter conditions can be specified.
Taxonomy Filter
Phylogenetic pattern filtering.
See “15. Taxonomy Filtering.”
Gene/Organism Count Filter
Filtering by gene count/species count.
See “16. Filtering by Gene Count/Species Count in
the Phylogenetic Patterns.”
Keyword Search
Filtering by keyword search.
See “17. Keyword search.”
Gene Set Filter
Filtering by combined gene-set condition.
See “31.4 A combined set is set as the filtering
condition.”
Cluster Set Filter
Filtering by combined cluster-set condition.
See “31.4 A combined set is set as the filtering
condition.”
10.2.2.
Sort setting (Sort)
The sort condition that is applied to the PPM is displayed in the Sort folder of the control
panel. For the operational procedure, see “13. PPM sort.”
10.2.3.
Color setting (Color)
In the Color folder on the control panel, the gene/cluster color that is displayed on the PPM
and the comparative genome map view is set. The coloring is applied in descending order of
the alignment sequence on the control panel, and is overwritten (the upper one has priority
over the lower one). The order can be changed by dragging and dropping an object. Also, the
color settings can be enabled/disabled by clicking Enable/Disable.
The following color settings can be specified:
43
RECOG Client User's Manual
Gene property
Color setting based on gene/cluster property.
See “12. Coloring by property.”
Neighboring cluster
Color setting based on the result of neighboring gene clustering. See
“24. Neighboring gene clustering.”
Keyword search
Color setting based on the keyword search result.
See “17. Keyword search.”
Gene Set
Color setting based on a combined gene-set condition.
See “31. Combined set.”
Cluster Set
Color setting based on a combined cluster-set condition.
See “31. Combined set.”
Gene count
Color setting based on the gene count in a cell.
See “11.6 Color change according to the gene count in a cell.”
Base color
Standard color setting.
See “11.5 Changing the color of the PPM cell/boundary.”
10.2.4.
Phylogenetic pattern registration (Phylogenetic Pattern)
The profile used in the similar phylogenetic pattern search function is displayed.
For the operation procedure, see “33. Similar phylogenic pattern search.”
10.2.5.
Organism column setting (Organism Column)
The species to be displayed on the PPM is displayed.
For the operational procedure, see “18. Changing the display order and display/nondisplay of
species.”
10.3. Display of the set management panel
Click the Selected tab on the right of the screen and click the Set button below to display the
set management panel.
44
RECOG Client User's Manual
10.4. Operation of the set management panel
On the set management panel, the following sets are displayed and can be operated:
Gene Set
Gene sets are displayed.
See “30. Registration and management of gene
sets/cluster sets.”
Gene Set Combination
Combined gene sets are displayed.
See “31. Combined sets.”
Cluster Set
Cluster sets are displayed.
See “30. Registration and management of gene
sets/cluster sets.”
Cluster Set Combination
Combined cluster sets are displayed.
See “31. Combined sets.”
Organism Set
Species sets are displayed.
See “32. Species sets.”
45
RECOG Client User's Manual
11. Display and Operation of the Phylogenetic
Pattern Map
On the Phylogenetic Pattern Map (PPM), the appearance patterns of species belonging to a
cluster are displayed.
11.1. Display of the locus tags of genes belonging to a
cell
The locus tags of genes belonging to a cell are displayed on the cell. If the cell region is
narrow, the gene count is displayed. The display can be switched on/off as follows:
1.
Click
(Option) in the Toolbox to display the Option screen.
Click the PPM tab on the Option screen.
2.
Check 'Display gene names or the number of genes’ on the PPM tab.
3.
Click the Apply button.
11.2. Display of the cluster property on the cluster
header
The value of the property corresponding to the cluster is displayed in the display area (cluster
header) on both sides of the PPM. To change the displayed property, do the following:
1.
On the cluster header, click the right mouse button, and on the menu PPM Label click the
property to be displayed; this displays the property value on the cluster header.
Cluster ID
The homology cluster ID, cluster ID and
sub-cluster ID are displayed.
Gene name
The typical gene name of the cluster and the
typical gene name of the sub-cluster are
displayed (default value).
Cluster score
The cluster score and sub-cluster score are
displayed.
46
RECOG Client User's Manual
Cluster dist
The cluster distance and sub-cluster distance
are displayed.
Phylogenetic Pattern Coefficient
In a similar phylogenetic pattern search, the
coefficient of correlation with a specified
pattern is displayed.
11.3. Display/Nondisplay of the homology cluster header
1.
Click the right mouse button on the cluster header, click the menu, and click Show/Hide
homology cluster label.
11.4. Species color setting
The species color is set. The color set here is reflected in the background color of the PPM
species header and the locus tag label of the phylogenetic tree in the multiple alignment
analysis.
1.
Select the species on the Taxonomy Tree at the upper part of the Selected tab, click the
right mouse button, and click Color organism – Choose… in the pop-up menu.
The Color palette screen is displayed.
2.
Set the color on the Color palette screen and click the OK button to set the species color.
11.5. Changing the PPM cell/boundary color
1.
Select Color – Base Color on the control panel, click the right mouse button and click
Edit to display the PPM tab on the Option screen.
47
RECOG Client User's Manual
2.
On the PPM tab, the background color of the cells, the display/nondisplay and the color of
the boundary are set.
Color for border line
The color of the boundary between cells is set.
Untick, and the boundary is not drawn.
Background color for ingroup cells
The background color of the ingroup cells is set.
Background color for outgroup cells
The background color of the outgroup cells is set.
Background color for outgroup cells If the horizontal transfer option is specified, the
considered to be ingroup
background color of the outgroup cells that are
considered to derive from the ingroup is specified.
Background color for selected line cell (1)
The background color of the cells of the selected
cluster is specified.
Background color for selected line cell (2) The background color of the cells of the selected
species is specified.
Background color for search result cells
The background color of the cells of the searched
cluster is specified.
3.
Click the Apply button.
4.
To enable/disable the color settings of the PPM cells, double-click Color – Base Color on
the control panel.
11.6. Color change according to the gene count within a
cell
The background color of a cell can be changed according to the gene count within the cell by
setting a threshold value.
1.
Select Color – Gene count on the control panel, click the right mouse button and click
Edit to display the PPM tab on the Option screen.
2.
On ‘Background color cells containing inparalogs (>= # genes)’ on the PPM tab, specify
48
RECOG Client User's Manual
the threshold gene count and the background color of the cell.
3.
Click the Apply button to display the color-setting condition on Color – Gene count on
the control panel.
4.
To enable/disable the color setting, double-click Color – Gene count on the control panel.
11.7. Color display corresponding to each functional
category
The color corresponding to the typical functional category of a cluster is displayed in the gene
name display field.
1.
Click
(Option) in the Toolbox to display the Option screen. Click the Function
Category Color tab on the Option screen.
2.
On the Function Category Color tab, specify the functional category for drawing.
3.
To change the functional-category color on the lower list, click the Color column, specify
the color on the displayed Color palette screen, and click the OK button.
49
RECOG Client User's Manual
4.
Click the Apply button.
11.8. Aggregated display of the PPM
In aggregate PPM mode, clusters of the same phylogenetic pattern are aggregated into a single
line.
1.
Click
(Aggregate Mode) in the Toolbox to display the PPM in aggregate mode.
2.
The PPM can also be displayed in aggregate mode by clicking View – Aggregate Mode,
or by clicking Aggregate Mode after right-clicking the PPM.
To exit from the aggregate mode, do the following:
1.
Click
(Disaggregate Mode) in the Toolbox to exit from the aggregate mode.
3.
One can also exit from the aggregate mode by clicking View – Disaggregate Mode, or by
clicking Disaggregate Mode after right-clicking the PPM.
50
RECOG Client User's Manual
11.9. Limited display of a selected region on the PPM
The limited display of a selected region is possible by dragging the mouse on the PPM to
specify the region.
To exit from the limited display mode, click the right mouse button and click Limitation
Release on the menu.
51
RECOG Client User's Manual
11.10. Highlighting a species by selecting it on the
Taxonomy Tree
Select and click a species on the Taxonomy Tree above the Selected tab to highlight the
relevant species on the PPM.
Also, to exit from the species selection mode on the Taxonomy Tree, do the following:
Windows/Linux: Ctrl + left click on the selected species
Mac: Apple-key + left click on the selected species
11.11. Selection of a species (phylogenetic pattern) in a
cluster
The species in a cluster specified on the PPM is selected and displayed on the Taxonomy Tree
on the All tab/Selected tab. This function is useful when searching a phylogenetic pattern
similar to that of a specified ortholog group, etc.
1.
Click to select a cluster on the PPM.
2.
Click the right mouse button on the PPM and click Select Organism on the pop-up menu
to select the relevant species on the Taxonomy Tree on the All tab/Selected tab.
52
RECOG Client User's Manual
12. Color Display by Properties
Each cell on the PPM can be colored and displayed using the gene properties registered as
described in “29.1 Registration of gene properties,” the correlation coefficient determined
based on the similar phylogenetic pattern search function, etc.
12.1. Color display setting by properties
1.
Click
(Color genes by properties) in the Toolbox to display the Color genes by
properties screen.
2.
Specify the coloring conditions on the Color genes by properties screen.
Organism: Specify a species.
Property: Specify properties.
Value-type or enumeration-type properties can be colored and displayed.
Color: Set the color on the PPM.
If the properties are of the value type:
Threshold setting
The color as per a specified property value is set (labels 1 and 2 in the above figure).
Click the Add color button to set up to four values and colors. The color(s)
between them is determined by the linear interpolation method. Click the Remove
color button to remove the intermediate values.
“Color by”
Specify whether to set the color based on value (Value) or ranking (Rank).
“The method for assigning rank”
If the color is set as per ranking, specify whether to rank all the species specified
(All species) or each species (Every species).
“Automatic update value”
If this is checked, the threshold value is automatically divided equally in
consideration of the possible range of the properties immediately after the change
thereof.
53
RECOG Client User's Manual
”Color of genes don’t have the gene property”
This is used to set the color of the gene with no specified property value.
If the properties are of the enumeration type:
Set the color for each possible value.
”Color of genes don’t have the gene property”
This is used to set the color of the gene with no specified property value.
54
RECOG Client User's Manual
3.
Click the Apply button on the Color genes by properties screen.
Each cell is displayed in color as per the conditions specified on the PPM.
The display/nondisplay of the color presentation can be switched on/off by ticking/unticking
Show color genes by properties on the pop-up menu on the PPM.
12.2. Enable/Disable property color setting
1.
To enable or disable the property color setting, double-click Color – Gene property on
the control panel.
55
RECOG Client User's Manual
13. PPM Sort
The PPM can be sorted and displayed according to various conditions based on the
phylogenetic pattern.
13.1. PPM sort in disaggregate mode
In the disaggregate mode, the rows are sorted for each cluster or sub-cluster.
1.
If the DomClust result contains an outgroup, click the Cluster Mode/Sub-Cluster Mode
button in the Toolbox to specify whether to sort for each cluster
for each sub-cluster
(Cluster Mode) or
(Sub-Cluster Mode). If no outgroup is specified, the
designation is not effective.
Cluster Mode
Sorting is carried out for each cluster.
If a sub-cluster belonging to a cluster contains at least one species,
sorting is carried out, given that the cluster contains at least one
species.
Sub-Cluster Mode
2.
Sorting is carried out for each sub-cluster.
Click the right mouse button on the PPM, select Sort on the pop-up menu and click the
sort method on the sub-menu. Sort and display the phylogenetic pattern on the PPM as per
the specified sort method. However, for Gene order and Phylogenetic pattern similarity,
the species or cluster to be sorted depends on the location on the table of the clicked point.
56
RECOG Client User's Manual
Sort method
Details
Category/gene name
The data are sorted by function category/gene
name.
Gene order on <genome name>
The data are sorted in ascending order of the
position of the specified species on the
genome.
Phylogenetic pattern (lexical order)
The data are sorted in lexical order of the
phylogenetic patterns.
Phylogenetic pattern similarity based on the The data are sorted in order of similarity to the
cluster #
phylogenetic pattern of a specified cluster. As
the similarity indicator, specify one of the
following:
1. Normalized hamming distance
2. Correlation coefficient
3. Correlation coefficient, absolute
4. Mutual information
Phylogenetic pattern cluster (PhyloPatClust)
Phylogenetic pattern clustering is carried out,
and the data are sorted according to the
hierarchical tree.
Homology Cluster ID
The data are sorted by the homology cluster
ID/cluster ID/sub-cluster ID.
Gene properties…
The data are sorted based on the specified gene
properties (see 12.3).
13.2. PPM sort in the aggregate mode
In the aggregate mode, the data are sorted based on the phylogenetic pattern of the aggregated
clusters.
1.
Click the right mouse button on the PPM, click Sort on the menu, and click the sort
method on the sub-menu to sort and display the phylogenetic patterns on the PPM.
57
RECOG Client User's Manual
Sort method
Details
Phylogenetic pattern (lexical order)
The data are sorted in lexical order of the
phylogenetic patterns.
Phylogenetic pattern frequency
The data are sorted in descending order of the
occurrence frequency of the sub-clusters with
phylogenetic patterns.
Phylogenetic pattern similarity based on the The data are sorted in order of similarity to the
cluster
phylogenetic pattern of a specified cluster. As
the similarity indicator, specify one of the
following:
1. Normalized hamming distance
2. Correlation coefficient
3. Correlation coefficient, absolute
4. Mutual information
Phylogenetic pattern cluster (PhyloPatClust)
Phylogenetic pattern clustering is carried out,
and the data are sorted according to the
hierarchical tree.
13.3. Sort based on properties
The phylogenetic patterns are sorted based on the gene properties provided by the RECOG
server or the gene properties registered as described in “29.1 Registration of gene properties.”
1.
Click the right mouse button on the PPM and click Sort – Gene properties… to display
the Sort by gene properties screen.
2.
On the Sort by gene properties screen, specify the gene properties for the sorting and the
ascending order (Asc)/descending order (Desc).
To add the sorting conditions, click the Add Condition button.
58
RECOG Client User's Manual
Click the Option button, and the following setting column is displayed.
“Representative value of multiple values set for a gene property”
If multiple values are set for a gene property of a gene, specify the method of
determining the representative value for the sorting.
Min: The minimum value among multiple values is used.
Max: The maximum value among multiple values is used.
Median: The median among multiple values is used.
Average: The mean value among multiple values is used.*
“Representative value of multiple genes in a cell”
If a cell contains multiple genes, specify the method of determining the
representative value for the sorting.
Min: The minimum value among the multiple genes is used.
Max: The maximum value among the multiple genes is used.
Median: The median among the multiple genes is used.
Average: The mean value among the multiple genes is used.*
* Only numerical-type gene properties apply.
3.
After specifying the sort conditions, click the Apply button to sort and display the
phylogenetic patterns on the PPM according to the sort conditions.
13.4. Display of the sort conditions
The currently valid sort conditions are displayed in the Sort folder on the control panel.
59
RECOG Client User's Manual
14. Phylogenetic Pattern Clustering
(PhyloPatClust)
Upon the analysis of the phylogenetic pattern clustering (PhyloPatClust), each ortholog group
is clustered based on the similarity of the phylogenetic patterns and sorted based on the results.
Also, the clustering tree is displayed on the Clustering tab.
14.1. Execution of PhyloPatClust
1.
Click
(Phylogenetic pattern clustering (PhyloPatClust)) in the Toolbox to display
the Confirm screen.
2.
Specify the conditions on the Confirm screen.
Execute: If the clustering is carried out locally, specify Local. If the clustering is
carried out on the RECOG server, specify Server.
(Note) Server is available only in an environment with an Internet connection.
Target: If the clustering is carried out based on the phylogenetic pattern of a cluster,
specify Cluster. If the clustering is carried out based on the phylogenetic pattern of a
sub-cluster, specify Sub Cluster.
Use displayed clusters only: If this is checked, phylogenetic pattern clustering is
carried out only for the clusters currently displayed on the PPM. This reduces the
processing time when there are many clusters.
3.
Click the Parameters button to set the parameters on the parameter-setting screen.
60
RECOG Client User's Manual
4.
Click the Apply button on the Confirm screen to execute PhloPatClust. Upon completion
of the process, a dendrogram (clustering tree) is displayed on the Clustering tab based on
the clustering result, and the PPM is sorted based on its arrangement.
14.2. Operation of the clustering tree
On the clustering tree, the display of distance can be switched on/off, and by clicking a branch
point, clusters belonging to points not higher than the branch point can be selected.
To switch on the display of distance, do the following:
1.
Click the right mouse button on the Clustering tab and click and check Show Distance to
display the distance on the clustering tree.
To select a cluster not higher than a given branch point:
1.
On the Clustering tab, click a point near the desired branch point of the clustering tree to
select the clusters not higher than the clicked branch point.
61
RECOG Client User's Manual
15. Taxonomy Filtering
Specify the filtering conditions on the Taxonomy Tree on the Selected tab to display on the
PPM only the clusters with phylogenetic patterns that meet the conditions. In setting the
filtering conditions, specify a set of species and conditions therefor at the same time. One of
three sets of species listed in the table below can be specified. Of the three sets, ‘All’ and
‘None’ are special sets with fixed conditions, whereas for ‘Any,’ the conditions can be set
freely. If simply specifying a condition of existence/nonexistence in a genome, use
‘All’/’None,’ respectively. Using ‘Any,’ more complicate conditions can be specified, such as
‘Existence in more than half of each of bacteria and archaea.’
Species
Display on the PPM
Species
set
All
color
The clusters that are present in all the species in the set are Light red
displayed.
Any
The clusters that are present in more/less than a certain Light blue
number/percentage of species in the set are displayed.
None
The clusters that are absent in all species in the set are displayed.
Grey
15.1. Displaying the taxonomy filtering conditions
The taxonomy filtering conditions are displayed in Filter – Taxonomy Filter on the control
panel.
62
RECOG Client User's Manual
15.2. Setting the ‘All’ conditions
1.
Select the species on the Taxonomy Tree in the upper part of the Selected tab.
2.
Click the right mouse button and click Taxonomy – All to display the registered species in
Filter – Taxonomy Filter – All on the control panel and to display the relevant species
names on the tree in light red.
15.3. Setting the ‘Any’ conditions
1.
Select two or more species names on the Taxonomy Tree in the upper part of the Selected
tab.
2.
Click the right mouse button and click Taxonomy – Any New – Setting… to display the
Any Threshold screen.
63
RECOG Client User's Manual
3.
Specify the ‘Any’ conditions on the Any Threshold screen.
Count: Specify the conditions for the number of species in a cluster.
# or less: The number of species is lower than or equal to #.
# or more: The number of species is higher than or equal to #.
Example 1: The conditions [# or more: 3, # or less: 5] are met if the number of species
in a cluster is 3 or higher and 5 or lower.
Example 2: The conditions [# or more: 5, # or less: 3] are met if the number of species
in a cluster is 5 or higher or 3 or lower.
(Note the use of and and or in the two examples.)
Percent: Specify the conditions for the percentage of species in a cluster.
# or less: The maximum number of species accounts for #% of all.
# or more: The minimum number of species accounts for #% of all.
Example 1: The conditions [# or more: 30, # or less: 50] are met if a species in a cluster
accounts for between 30-50%.
Example 2: The conditions [# or more: 50, # or less: 30] are met if a species in a cluster
accounts for 50% or more or 30% or less.
4.
After specifying the ‘Any’ conditions, click the Apply button on the Any Threshold screen
to display the ‘Any’ conditions in Filter – Taxonomy Filter – Any on the control panel.
Also, the species names meeting the ‘Any’ conditions are displayed on the tree in light
blue.
A name can be attached to each of the ‘Any’ conditions in order to distinguish between the
conditions.
5.
To specify the ‘Any’ conditions more easily, select more than one species name, click the
right mouse button and click Taxonomy – Any New - For all any conditions: ‘Any’
64
RECOG Client User's Manual
condition shown below to display in the lower view the species names registered for the
‘Any’ conditions.
6.
To add species to the ‘Any’ conditions, select the species name or names, click the right
mouse button and click Taxonomy – Add – Any Add – (Additional ‘Any’ condition).
The relevant species are added to the ‘Any’ conditions in the lower view and the relevant
species names are displayed on the tree in light blue.
15.4. Changing the names of the ‘Any’ conditions
1.
On the control panel, select Filter – Taxonomy Filter – (name of ‘Any’ condition), click
the right mouse button and click Rename to display the Rename screen.
2.
On the Rename screen, edit the name, and click the Apply button.
65
RECOG Client User's Manual
15.5. Changing the threshold value of the ‘Any’
conditions
1.
On the control panel, select Filter – Taxonomy Filter – (Name of ‘Any’ condition) to
display the conditions for phylogenetic pattern filtering.
2.
From among the conditions for phylogenetic pattern filtering, select the ‘Any’ condition,
click the right mouse button and click Any Threshold – Edit to display the Any
Threshold screen.
3.
On the Any Threshold screen, specify the ‘Any’ conditions.
For details, refer to Item 3 of “15.2 Setting the ‘Any’ conditions.”
4.
To specify the ‘Any’ conditions more easily, select and click ‘Any’, click the right mouse
button and click Taxonomy – Any New – For all any conditions: ‘Any’ condition
shown below. The ‘Any’ conditions are changed to the clicked ‘Any’ conditions.
15.6. Setting the ‘None’ conditions
1.
Select the species on the Taxonomy Tree in the upper part of the Selected tab.
2.
Click the right mouse button and click Taxonomy – None to display the registered species
names in Filter – Taxonomy Filter – None on the control panel. The relevant species
66
RECOG Client User's Manual
names are displayed on the tree in grey.
15.7. Enable/Disable conditions
1.
In Filter – Taxonomy Filter on the control panel, select the conditions, click the right
mouse button and click Enable/Disable to enable/disable the selected conditions.
15.8. Removal of conditions
1.
Select the conditions in Filter – Taxonomy Filter on the control panel, click the right
mouse button and click Delete to remove the selected conditions.
67
RECOG Client User's Manual
68
RECOG Client User's Manual
16. Filtering by Gene Count/Species Count in the
Phylogenetic Patterns
Set a threshold value for the gene count/species count in the phylogenetic patterns and filter the
data based thereon. The results are displayed on the PPM.
16.1. Setting the conditions
1.
Select Filter – Gene/Organism Count Filter on the control panel, click the right mouse
button and click Gene/Organism Count Filter to display the Gene/Organism Count Filter
screen.
2.
Specify the conditions on the Gene/Organism Count Filter screen, and click the Apply
button to display the conditions in Filter – Gene/Organism Count Filter on the control
panel.
16.2. Enable/Disable conditions
1.
Select Filter – Gene/Organism Count Filter on the control panel, click the right mouse
button and click Enable/Disable.
69
RECOG Client User's Manual
17. Keyword Search
Regarding the cluster results, both clusters and genes can be searched. The gene search is
conducted in concert with the RECOG server.
Search of clusters
Search of genes
Search
・Representative gene name
・ Gene properties provided by the
target
・ Representative description of each RECOG server (description, gene name,
cluster
etc.)
・ Gene/cluster properties registered
through the use of the import function,
etc.
17.1. Search of clusters
1.
Click
(Keyword Search) in the Toolbox to display the Keyword Search screen.
2.
On the Keyword Search screen, click the Cluster tab.
3.
Enter the keyword(s) in the Keyword(s) column and click the Search button to begin the
search.
4.
Upon the completion of the search process, the Keyword Search Result screen is displayed.
The conditions corresponding to the search results are displayed in Filter - Color on the
70
RECOG Client User's Manual
control panel. On the PPM, only the searched clusters are highlighted.
5.
Check ‘Display only matched clusters’ on the Keyword Search Result screen to display on
the PPM only the searched clusters. Upon unchecking, all the clusters are displayed.
Check ‘Highlight matched clusters’ to highlight the searched clusters. Upon unchecking,
and the highlight is cancelled. Also, by clicking the color-setting column, the color of the
highlight can be set.
71
RECOG Client User's Manual
17.2. Search of genes
1.
Click
(Keyword Search) in the Toolbox to display the Keyword Search screen. On
the Keyword Search screen, click the Gene tab.
2.
Specify an item and a keyword, and click the Search button.
To specify multiple conditions, click the Add Condition button to add conditions.
To clear a condition, click the Clear Condition button.
Upon specifying the condition(s), click the Search button.
For the search, the following marks can be entered in the keyword entry column:
Type of search
Example
Match search
Word
Genes that include a phrase matching ‘word’ are
searched**.
Partial match search
* word *
Genes that include the phrase ‘ ∼ word ∼ ’ are
searched.
Prefix search
word *
Genes that include the phrase ‘word∼’ are searched.
Suffix search
* word
Genes that include the phrase ‘∼word’ are searched.
Or more
>=10
Ten or more genes are searched. #
Or less
<=10
Ten or less genes are searched. #
More than
>10
More than ten genes are searched. #
Less than
<10
Less than ten genes are searched. #
With keyword inside
+ABC
Genes with ‘word’ inside are searched.
Without keyword inside
-word
Genes without ‘word’ inside are searched.
Multiple word search
word1 word2
Genes that include word1 or word2 are searched.
Phrase search
“word1 word2”
Genes that include word1 and word2 as a phrase are
searched.
** In the ‘Description’ field, a partial match search is conducted.
72
RECOG Client User's Manual
#
3.
The inequality sign is valid only for numerical-type gene properties.
Click the Option button to specify the following conditions:
‘Search on the server’
If this is checked, the gene properties retrievable on the RECOG server are searched on
that server. If unchecked, all the gene properties are searched locally.
‘Representative value of multiple values set for a gene property’
If Value and Difference are specified, and if multiple values are set for a gene property
of a gene, the method of applying the search conditions is specified.
At Least One: If at least one of the multiple values meets the condition, it is
considered that the search condition is met.
All: If all the multiple values meet the condition, it is considered that the search
condition is met.
Average: If the mean value of the multiple values meets the condition, it is
considered that the search condition is met.*
* This applies only to numerical-type gene properties.
4.
Upon the completion of the search process, the Keyword Search Result screen is displayed.
In Filter - Color on the control panel, the conditions corresponding to the search result are
displayed. On the PPM, only the clusters containing the searched genes are highlighted.
73
RECOG Client User's Manual
3.
Check ‘Display only matched clusters’ on the Keyword Search Result screen to display
and only the searched clusters on the PPM. Upon unchecking, all the clusters are
displayed.
Check ‘Highlight matched clusters’ to highlight the searched clusters. Upon unchecking,
the highlighting is cancelled. Click the color-setting column to set the highlight color.
17.3. Redisplaying the search results
1.
Click
(Keyword Search) in the Toolbox to display the Keyword Search screen.
2.
On the Keyword Search screen, click the Show search results button to display the last
search results.
17.4. Enable/Disable filter settings by the search results
1.
Select Filter – Keyword Search on the control panel, click the right mouse button, and
click Enable/Disable.
The same operation can be carried out by checking/unchecking ‘Display only matched
clusters’ on the Keyword Search Result screen.
17.5. Enable/Disable color settings by the search results
1.
Select Color – Keyword Search on the control panel, click the right mouse button, and
click Enable/Disable.
The same operation can be carried out by checking/unchecking ‘Highlight matched
clusters’ on the Keyword Search Result screen.
74
RECOG Client User's Manual
18.Changing the Display Order of Species or
Display/Nondisplay Status of Species
In the Organism Column on the control panel, the order of species displayed on the PPM can
be changed or the display/nondisplay of species can be set.
18.1. Changing the order of display of species
1.
To change the order of display of species, drag the species in the Organism Column on
the control panel to the destination.
On the PPM, only the species displayed on the Organism Column are displayed.
18.2. Setting the display/nondisplay of species
1.
Double-click the species in the Organism Column on the control panel.
You can also click the right mouse button on the species and choose Show/Hide to set the
display/nondisplay modes.
18.3. Adding species to be displayed
1.
To display the selected species on the PPM, select the species on the Taxonomy Tree on
the Selected tab, click the right mouse button and click Show organism columns.
18.4. Removing displayed species
1.
Select species in the Organism Column on the control panel, click the right mouse button
and click Delete organism columns. When the warning message is dislayed, click the OK
button.
75
RECOG Client User's Manual
19. List of Genes
A list of genes of the selected species is displayed.
19.1. Displaying the list of genes
1.
To display the Gene List screen, select the species on the Taxonomy Tree on the Selected
tab, click the right mouse button and click Gene List… on the pop-up menu. You can also
click the right mouse button on an abbreviated species name in the header row of the PPM
table to open the Gene List screen.
19.2. Sorting the list of genes
1.
To sort the gene properties in the ascending/desceding order and display the gene property
values, click the gene property name on the Gene List screen.
19.3. Saving the list of genes
1.
To output the list of gene property values in tab-delimiting format, click the Export…
button on the Gene List screen to display the Save gene list screen, enter the output file
name and click the OK button.
76
RECOG Client User's Manual
20. Display and Operation of the Circular
Genome Map (CGM)
The Circular Genome Map (CGM) draws a circular/linear genome map of the selected species.
20.1.
Displaying the CGM
1.
To display the CGM, select the species on the Taxonomy Tree on the Selected tab, click
the right mouse button and click Genome Map - Chromosome name.
77
RECOG Client User's Manual
20.2. Changing the selected region
1.
Enter the region to be selected in From and To in the upper part of the CGM screen, and
click the Show button. The entetred region is highlighted and the displayed region of the
genome map in the lower part of the CGM screen changes.
The selected region can also be changed by dragging the mouse on the circular genome.
2.
To move the selected region in the clockwise/counterclockwise direction, click the
(Previous)/
(Next) button in the lower part of the CGM screen, respectively. It is
also possible to change the moving distance on the pop-up menu upon right-clicking the
button.
3.
To zoom in/zoom out on the selected region, click the
(Zoom in)
(Zoom
out) button in the lower part of the CGM screen, respectively. By right-clicking on the
button, the zoom ratio can be changed on the pop-up menu.
20.3. Linkage between the PPM and CGM
1.
Click a gene on the genome map in the lower part of the CGM screen to select on the PPM
the cluster to which the clicked gene belongs.
2.
Click a cell on the PPM to highlight the location of the clicked gene on the circular
genome on the CGM. Also, the displayed region of the lower genome map changes and
the clicked gene is displayed.
3.
Click the header in the upper part of the PPM to change the genome displayed on the
CGM. You can compre the locations on the chromosome of the genes in a given cluster
between genomes by selecting a cluster and switching the displayed genome one after
another.
20.4. Changing the color of genes
1.
Click
(Option) in the Toolbox on the CGM screen to display the Genome Map
Options screen.
78
RECOG Client User's Manual
2.
Specify the gene color.
‘Function Category’
The gene is displayed in the color corresponding to the representative function category
of the cluster to which the gene belongs.
‘Positive/Negative’
The gene is displayed in the color corresponding to the direction of the gene.
‘Use the color of the control tree’
The gene is displayed in the color specified by the user in Color on the control panel.
20.5. Displaying gene information in a browser
1.
Double-click a gene on the genome map in the lower part of the CGM screen to display
the information on the default external resource specified in ’35. External Resource URL
Management’ in the browser.
Click the external resource URL displayed upon right-clicking, and the information on the
external resource is displayed in the browser.
79
RECOG Client User's Manual
21. Display and Operation of the Regional
Genome Map(RGM)
To allow users to compare the chromosome map around the genes belonging to a specified
ortholog cluster, the Regional Genome Map (RGM) displays the genome map, where these
genes are arranged at the center.
21.1. Displaying the RGM
1.
To display the Regional Genome Map (RGM) screen, select a cluster on the Info tab, click
the right mouse button and click Regional Genome Map on the pop-up menu.
80
RECOG Client User's Manual
21.2. Zooming in/out on the RGM
1.
To zoom in/out on the RGM, click
(Zoom in)/
(Zoom out) in the Toolbox,
respectively, on the Regional Genome Map screen.
21.3. Display/Nondisplay of the Locus Tag
1.
Click
(Label ON/OFF) in the Toolbox on the Regional Genome Map screen. When
the button is displayed in color, the Locus Tag is displayed, and when the button is
displayed in grey, the Locus Tag is hidden.
21.4. Setting the gene color
1.
To display the Color Setting screen, click
(Color Setting) in the Toolbox on the
Regional Genome Map screen.
2.
Set the gene color on the Color Setting screen.
Sort
Display on the PPM
Function Category
The color allocated to the current Function Category is used.
Cluster ID
A unique color is allocated to each cluster. The color is
allocated according to the gradation based on the cluster ID.
Although it is difficult to distinguish between the colors, the
allocation remains the same even if the dsplayed region
changes.
Pattern
A unique color and pattern are allocated to each cluster. The
color and pattern are allocated to each currently displayed
cluster in the order of cluster size. Although the color and
pattern are easily distinguishable, the allocation changes with
the displayed region.
Use
the
color The color currently in use on the PPM (the color set in Color on
currently assigned on the control panel) is used.
the PPM
3.
Click the Apply button.
81
RECOG Client User's Manual
21.5. Displaying gene information in a web browser
1.
By double-clicking a gene, you can display in a web browser the informationof the default
external resource that is set according to “35. External Resource URL Management.” You
can also click the right mouse button on a gene and choose an external resource URL to
display.
82
RECOG Client User's Manual
22. Multiple Alignment and Phylogenetic Tree
Multiple alignment among genes belonging to a cluster can be created using the ClustalW
program. Also, a phylogenetic tree can be created and displayed based on the results of the
multiple alignment.
22.1. Execution of multiple alignment
(Note) Multiple alignment can be executed only in an environment where Internet connection is
available.
1.
Specify the execution parameters of ClustalW.
Clicking
(Option) in the Toolbox to display the Option screen, and specify the
ClustalW conditions on the Multiple Alignment tab on the Option screen.
Path
Specify the path of ClustalW. The default setting is the ClustalW attached to the
installer.
83
RECOG Client User's Manual
TYPE
・Use the default:
Multiple alignment is executed with the default parameter of ClustalW.
・Protein:
Multiple alignment is executed as per the setting specified on the screen.
2.
In the Disaggregate Mode, select the cluster in the cluster information display table on the
Info tab, click the right mouse button, and click Multiple Alignment on the pop-up menu
to display the progress screen and execute the multiple alignment. When the Confirm
screen is displayed, click the OK button.
3.
After the completion of the multiple alignment process, the Multiple Alignment screen is
displayed.
84
RECOG Client User's Manual
22.2. Changing the colors of the amino-acid letter strings
1.
Click the
(Color Setting) button on
the Multiple Alignment screen to display
the Color Setting screen.
2.
On the Color Setting screen, you can
specify the colors of the amino-acid letter
strings.
22.3. Displaying the phylogenetic tree
1.
To display the Phylogenetic Tree screen, click
(Clustal Tree) on the Multiple
Alignment screen.
2.
To change the parameters used in the creation of the phylogenetic tree, click
(Option) in the Toolbox. Specify the parameters on the Tree tab on the Option screen.
85
RECOG Client User's Manual
3.
On the Phylogenetic Tree screen, the following operations are possible:
Reading the dnd files:
Click
(Open DND file), select the dnd file and click the OK button.
Outputting the phylogenetic tree to a PDF file:
Click
(PDF), specify destination and file name, and click the OK button.
Switching between the rooted phylogenetic tree and the unrooted phylogenetic tree:
To display the rooted phylogenetic tree, click
display the unrooted phylogenetic tree, click
Displaying the distance:
Click
(Show Length ON/OFF).
86
(Rooted Horizontal), and to
(Unrooted).
RECOG Client User's Manual
Various settings:
(Option Settings).
Click
Directory tab
Set the default directory for loading DND files and the defaut directory for outputting
PDF files.
Style
Specify the node style.
Color
Specify the Locus Tag colors.
・Species
Each species is displayed by the species color (the color of the species header in
the PPM table) specified in the Color Organisms menu on the Texonomy
Tree in the upper part of the Selected tab.
・OUT / IN Group
Each species is displayed by the ingroup/outgroup color specified in Font Color
on the Taxonomy Tree tab on the Option screen, according to the current
ingroup/outgroup specification.
87
RECOG Client User's Manual
23. Function Category Frequency Graph/
Numerical Data Graph
On the Histogram tab, the frequency of the function category in the same phylogenetic pattern
can be displayed by graphs, or the numerical data of the specified gene properties can be
displayed by bar graphs.
23.1. Function category frequency graphs
In the Disaggregate Mode, the frequency of each function category in the same phylogenetic
pattern is displayed in a graph on the Histogram tab.
23.2. Displaying a numerical data graph, a description or
the function category
In the Disaggregate Mode, a graph of numerical gene property values or the description and
the function category of each cluster is displayed on the Histogram tab.
1.
To display the Histogram screen, click
(Histogram) in the Toolbox.
88
RECOG Client User's Manual
2.
Specify the graph to be displayed on the Histogram tab.
Description/Function Category
The description of the cluster is displayed with the color of the function category of the
cluster in the background.
Value
The specified numerical property data are displayed by a bar graph. Cluster property
data or gene property data of a specified species can be displayed.
Difference
The difference in the numerical gene property data between two species is displayed by
a bar graph. Two species and their gene properties for comparison should be specified.
If Value and Difference are specified, the numerical data are displayed on the graph
upon checking ‘Show value.’
89
RECOG Client User's Manual
3.
If Value and Difference are specified, specify also the display range and graph style in the
‘View’ column.
Range
Specify the display range. To automatically specify the display range as between the
minimum and the maximum values of the target property, click the Auto range
button.
Graph Style
Select one of the two graph styles, ‘Bar’ (bar graph) or ‘Line’ (line graph).
4.
To set the following conditions, click the Option button.
Representative value of multiple property values for a gene
If Value and Difference are specified, and if multiple values are set for a gene property
of a gene, specify the method of determining the representative value for graph display.
Min: The minimum value among multiple values is used.
Max: The maximum value among multiple values is used.
Median: The median among multiple values is used.
Average: The mean value among multiple values is used.
Representative value of multiple genes in a cell
If Value and Difference are specified, and if a cell contains multiple genes, specify the
method of determining the representative value for graph display.
5.
Min: The minimum value among multiple genes is used.
Max: The maximum value among multiple genes is used.
Median: The median among multiple genes is used.
Average: The mean value of the properties of multiple genes is used.*
To display the graph on the Histogram tab, click the Apply button on the Histogram
screen.
* The numerical values displayed on the Value and Difference graph can be switched
between display/nondisplay on the popup menu Show value, displayed upon
right-clicking on the graph.
23.3. Switching between the display/nondisplay of the
90
RECOG Client User's Manual
Histogram tab
1.
To display the Histogram tab on the right of the screen, choose and check from the menu
View - Information Pane.
2.
To hide the Histogram tab, uncheck View - Information Pane.
91
RECOG Client User's Manual
24. Clustering Neighborhood Genes
This function groups genes that are located in the vicinity of each other on the phylogenetic
pattern map (PPM) table and in terms of the genome sequence, and assigns a color for each
group.
24.1. Execution of the clustering of neighborhood genes
1.
To display the Neighboring Clusters screen, click
(Neighboring Clusters) in the
Toolbox.
2.
Specify the conditions for neighborhood gene clustering on the Neighboring Clusters
screen.
Search range of clusters
Specify the range of clusters considered to be neighborhood on the PPM table. If the
range specified is N, N clusters above and below each cluster are considered to be
neighborhoods of that cluster.
Range within which genes are considered to be in each other’s neighborhood
Specify the distance between two genes on the chromosome considered to be in each
other’s neighborhood.
Recalculate when the table is re-sorted
If the order of clusters is changed due to the sort, etc. of clusters on the PPM, and if
this column is checked, neighborhood gene clustering is automatically executed under
the conditions specified immediately before. If unchecked, the results of the
neighborhood gene clustering are cleared after the order of clusters is changed.
92
RECOG Client User's Manual
3.
To execute neighborhood gene clustering, click the Run button on the Neighboring
Clusters screen.
Upon the completion of the process of neighborhood gene clustering, the group of genes
considered to be in each other’s neighborhood on the PPM is clustered and displayed in
the same color. Also, Neighboring cluster is displayed in Color on the control panel.
In this figure, only the cells having the same color in the same neighborhood in the table on
the same genome belong to a neighborhood gene cluster. Note that the same color may be
used for different clusters; cells in different genomes or cells far away from each other are
not related even if they have the same color in the table.
Display/Nondisplay of the clustering results
1.
To switch between display/nondisplay, double-click Color - Neighboring cluster on the
control panel.
93
RECOG Client User's Manual
24.2. Changing the color of a group of neighborhood
genes
1.
To display the Option screen, click
(Option) in the Toolbox. On the Option screen,
click Neighboring Cluster.
2.
Set the color pattern.
Color pattern for clustered cells
Set the color pattern for coloring genes clustered by neighborhood gene clustering.
The color is assignmed to the neighborhood clusters in accordance with the order
specified on the list. The assignment is repeated from the top of the list after reaching
the end of the list.
・ Add button
Add a color pattern.
・ Delete button
Delete the color pattern selected from the list.
・ Up button/Down button
Shift the selected color pattern upward/downward.
94
RECOG Client User's Manual
25. Species Groups
Multiple species closely related to each other can be registered as a species group. The species
groups registered here can be used in the analysis such as the CoreAligner program.
25.1. Displaying species groups
1.
To display the species groups set in the lower view of the Taxonomy Tree, click the Sp
Group button in the upper view of the Taxonomy Tree on the Selected tab.
25.2. Registration of species groups
1.
To create a new species group with a specified set of species, select the species on the
Taxonomy Tree in the upper view of the Selected tab, click the right mouse button, and
choose Sp Group - New Group. The species group is displayed in the lower view,
95
RECOG Client User's Manual
25.3. Editing species group names
1.
Select Sp Group on the Selected tab.
2.
Select the species group to be renamed in the lower view, click the right mouse button, and
click Rename. Rename screen is displayed.
3.
To rename the species group, edit the name on the Rename screen and click the Apply
button.
25.4. Removing species groups and removing species
from a species group
1.
Select Sp Group on the Selected tab.
2.
Select the species groups or species to be removed in the lower view, click the right mouse
button, and click Delete.
96
RECOG Client User's Manual
26. Genome Core Structure Alignment
(CoreAligner)
Genome core structure analysis consists of the extraction of genomic structures that are well
conserved among related genomes. That is, a pair of orthologous groups are extracted whose
genomic neighborhood relationship is conserved above a certain level, and the orthologous
groups are realigned based on this neighborhood relationsships. The CoreAligner program for
such analysis is run on the RECOG server, and the extracted core structures are displayed.
26.1. Running the CoreAligner program
1.
The ortholog analysis is performed and the results are displayed as described in “9.2
Execution of DomClust” and “9.3 Display of the DomClust analysis results.”
2.
Click
(Core genome alignment (CoreAligner)) in the Toolbox. The Core Genome
Alignment screen is displayed.
3.
Specify the conditions for the analysis carried out by the CoreAligner program on the Core
Genome Alignment screen. There are two ways of specifying the analysis conditions:
Simple Mode and Expert Mode.
Simple Mode
Expert Mode
Assignable
- Reference genome
- Reference genome
item
- Cutoff ratio of conserved orthologs - Cutoff ratio of conserved orthologs
and neighborhood relations
-
Cutoff
ratio
- Window size
neighborhood relations
- Use/unuse species group
- Window size
of
conserved
- Use/unuse species group
- Display/Nondisplay of species
- Display order of species
Simple Mode
97
RECOG Client User's Manual
Expert Mode
4.
After specifying the conditions, click the Run button. The progress screen is displayed and
the analysis by the CoreAligner program starts.
5.
Upon the completion of the analysis, the Core Genome Alignment screen and the
Genome Comparison Viewer screen are displayed.
Overview
Magnified view
98
RECOG Client User's Manual
26.2. Displaying the CoreAligner analysis results
The previously executed CoreAligner analysis results are displayed.
1.
Click
(Open files) in the Toolbox. The Open file screen is displayed.
2.
On the Open file screen, select the file filter ‘Core Genome File (.coaln, .coregenome)’ and
then select the project and CoreAligner analysis result file.
Upon selecting the CoreAligner analysis result file, the information on the analysis results
is displayed on the right of the screen.
3.
Click the Apply button on the Open files screen to display the selected CoreAligner
analysis results and DomClust results.
26.3. Components of the core structure display
Ortholog group
A longitudinal gene group corresponds to an ortholog group.
Node
Each node is represented by a circle or square.
Shape
Details
●
Contains only one gene.
■
Contains two or more genes (inparalogs).
Line
Each line is color-coded in accordance with the conditions.
Color
Details
Black
There is no insertion between genes.
Green
There is an insertion between genes.
Red
The relative direction of the genes is reversed (inversion).
Gene Direction
The triangular arrow in the upper part of ortholog group indicates the direction.
The background is displayed in the color corresponding to the typical function category
of the ortholog group.
99
RECOG Client User's Manual
26.4. Changing the display position
1.
To scroll the screen in the direction of the clicked button, click
(Move Left)/
(Move Right) in the Toolbox on the Core Genome Alignment screen.
2.
The display position can be changed by dragging the mouse on the Overview window.
26.5. Selecting an ortholog group
1.
To highlight an ortholog group, click the ortholog group in the magnified view on the Core
Genome Alignment screen. Also, in the Genome Comparison Viewer, the corresponding
ortholog group is highlighted.
26.6. Locating an ortholog group at center
1.
Double-click the relevant ortholog group on the Core Genome Alignment screen to display
it at center. Also, on the Genome Comparison Viewer screen, the corresponding ortholog
group is mainly displayed.
26.7. Setting a reference genome
1.
To display the Core Genome Alignment display modification screen, click View – View
Change…. on the Core Genome Alignment screen.
2.
In the ‘Target’ column, check the column on the right of the species to be set as the
reference genome.
3.
Click the Apply button.
100
RECOG Client User's Manual
26.8. Display/Nondisplay of species
1.
To display the screen for changing the Core Genome Alignment view, click View - View
Change... on the Core Genome Alignment screen.
2.
To display species, select the species in the Candidate column and click the >> button.
3.
To hide species, select the species in the Target column and click the << button.
4.
Click the Apply button.
26.9. Changing the display order of species
1.
To display the screen for changing the Core Genome Alignment view, click View - View
Change... on the Core Genome Alignment screen.
2.
To change the display order of species, select the species in the Target column on the
screen for changing the Core Genome Alignment view, and click the Up or Down button.
3.
Click the Apply button.
101
RECOG Client User's Manual
26.10. Resetting the window size
1.
To display the screen for changing the Core Genome Alignment view, click View - View
Change... on the Core Genome Alignment screen.
2.
To reset the window size of the neighborhood relation, set the value in the Window Size
section.
3.
Click the Apply button.
26.11. Changing the display style of species names
1.
To display the screen for changing the Core Genome Alignment view, click View - View
Change... on the Core Genome Alignment screen.
2.
Select the display style in the Organism column on the screen for changing the Core
Genome Alignment view.
Normal: Species are displayed according to their official names.
Abbreviation: Species are displayed according to their abbreviated names.
Show Strain: If this is checked, the strains are displayed.
26.12. Changing the ortholog group labels
1.
Click View - View Change... on the Core Genome Alignment screen. The Core Genome
Alignment view is displayed
2.
Specify the items to be displayed as labels for the ortholog group in the Label section on
the screen for changing the Core Genome Alignment view.
Cluster ID*
The cluster ID corresponding to the ortholog group is displayed.
Representative gene name of the cluster*
The representative gene name of the cluster corresponding to the ortholog group is
displayed.
Gene name of the reference genome
The gene name of the reference genome is displayed. If gene name is undefined in that
102
RECOG Client User's Manual
genome, the Locus Tag is displayed.
* If these items are specified, the gene name display column on the PPM is switched
synchronously.
26.13. Zoom
1.
To zoom in/zoom out on the core structure image, click
(Zoom in)/
(Zoom out)
in the Toolbox on the Core Genome Alignment screen.
26.14. Searching by gene name/Locus Tag
1.
In the column for item selection in the Toolbox on the Core Genome Alignment screen,
select Gene Name, Locus Tag or Both. If Both is selected, a search according to both the
gene name and the locus tag is conducted.
2.
Enter a keyword in the keyword entry column.
3.
Click the Search button, and the ortholog group to which the searched gene belongs is
highlighted on the Overview, and the viewing area of the magnified view is scrolled so
that one of the ortholog groups hit by the search is displayed in the center of the screen.
4.
If the Search button is clicked under the same conditions, the viewing area of the
magnified view is scrolled so that the next ortholog group containing the searched gene is
displayed in the center of the screen.
103
RECOG Client User's Manual
26.15. Printing the core structure image
1.
Click File – Preview on the Core Genome Alignment screen. The Core Genome
Alignment Preview screen is displayed.
2.
Click the Option button on the Core Genome Alignment Preview screen to display the
Core Genome Alignment Print Option screen, and specify the option.
Option
Details
Row count per page
Specify the number of rows displayed on a page.
One page
Print so that the Core Genome Alignment image fits into a page.
Show legend
If this is checked, the legend is displayed.
Show organism name on
If this is checked, the species names are displayed in all the rows.
every row
If unchecked, the species names are displayed only in the first
row of each page.
3.
Show page number
If this is checked, the page number is displayed.
Page setting
Specify the paper size and orientation.
Click the Print button on the Core Genome Alignment Preview screen, and the printer
selection screen is displayed. Specify the printing conditions and click the OK button.
26.16. Saving the CoreAligner results
The CoreAligner analysis results are saved automatically in the Project directory or its
sub-directory when an analysis is conducted. Save the analysis results in the CoreAligner
format (.coaln).
1.
Click
(Save Core Genome File) in the Toolbox, specify the destination for saving
and the file name, and click the OK button.
104
RECOG Client User's Manual
27. Genome Comparison Viewer
The Genome Comparison Viewer assigns colors to each gene based on the core structure
extracted by the CoreAligner analysis, and displays a genome map that connects the
corresponding ortholog groups by straight lines. Upon zooming in, the Viewer automatically
switches to the detailed gene view (see the figure below).
105
RECOG Client User's Manual
27.1. Displaying the Genome Comparison Viewer
The Genome Comparison Viewer is displayed after the CoreAligner procedure is finished.
Therefore, the Viewer can be displayed in the same manner as that described in “26.1 Running
the CoreAligner program” and “26.2 Displaying the CoreAligner analysis results.”
Also, the viewer can be displayed by clicking View - Genome Comparison Viewer on the
Core Genome Alignment screen.
27.2. Changing the display area
1.
To scroll the view area in the direction of the clicked button, click
(Move Left)/
(Move Right) in the Toolbox on the Genome Comparison Viewer screen.
For changing the display area, there are two modes, as shown below. The two modes can
be switched by clicking the relevant button in the Toolbox.
(Simple Mode)
In this mode, the display area is moved within a certain interval without adjusting the
gene display position.
(Adjust Mode)
In this mode, after changing the view area, the display is made upon relocating so that
the genes belonging to the ortholog group that contains the gene near the center of the
view area on the reference genome align or stand in a straight line. Also, regarding the
orientation of the genes, the display is made upon making the gene orientation uniform
according to the settings described in “27.14 Automatic correction of gene orientation.”
27.3. Zooming
1.
To zoom in/zoom out on the display area, click
(Zoom in)/
(Zoom out) in the
Toolbox on the Genome Comparison Viewer screen, respectively.
2.
If the zooming in exceeds a certain scale, the screen automatically switches to the detailed
106
RECOG Client User's Manual
gene view.
27.4. Moving a specified ortholog group to the center of
the screen
1.
In normal mode (the mode without the operation set out in 26.5 below), upon
double-clicking on the genes belonging to the ortholog group on the Genome Comparison
Viewer screen, the double-clicked ortholog group moves to the center of the screen. Also,
on the Core Genome Alignment screen as well, the clicked ortholog group is relocated to
the center of the screen.
27.5. Displaying gene information in a browser
1.
Click
(Show the gene information at clicking gene) in the Toolbox on the Genome
Comparison Viewer screen. Upon double-clicking in this state, the information on the
default external resource set in “35. External Resource URL Management” is displayed in
a browser.
2.
To display the information on the external resource in a browser, click the right mouse
button, and click the displayed external resource URL.
27.6. Saving the origin
1.
To save the current origin (center point), click View -
Save Origin on the Genome
Comparison Viewer screen.
27.7. Recovering the origin
1.
To relocate the genome map with the origin saved immediately before as the center point,
click
(Recover Origin) in the Toolbox on the Genome Comparison Viewer screen.
107
RECOG Client User's Manual
27.8. Display/Nondisplay of species
Specify the species set to be displayed on the Genome Comparison Viewer screen.
1.
Click View - View Change... on the Genome Comparison Viewer screen. The screen for
changing the display of the Genome Comparison Viewer screen is displayed.
Click the View tab on the screen for changing the display of the Genome Comparison
Viewer screen.
2.
To display species, select the species in the Candidate column and click the >> button.
3.
To hide species, select the species in the Target column and click the << button.
4.
Click the Apply button.
108
RECOG Client User's Manual
27.9. Changing the display order of species
1.
Click View - View Change... on the Genome Comparison Viewer screen. The screen for
changing the display of the Genome Comparison Viewer screen is displayed.
Click the View tab on the screen for changing the display of the Genome Comparison
Viewer screen.
2.
To permute the species, select the species in the Target column on the View tab and click
the Up or Down button.
3.
Click the Apply button.
27.10. Display/Nondisplay of genes or ortholog lines
1.
Click View - View Change... on the Genome Comparison Viewer screen.
Click the View tab on the screen for changing the display of the Genome Comparison
Viewer screen.
2.
In the Display elements column on the View tab, specify the display/nondisplay of genes
and the display/nondisplay of the lines that represent ortholog relationships.
Genes and RNA display switching options
Option
Core genes
Details
The genes extracted by the CoreAligner analysis are called Core
genes.
If this column is checked, the Core genes are displayed.
Non-Core genes
Genes that were not extracted by the CoreAligner analysis are
called Non-Core genes.
If this column is checked, the Non-Core genes are displayed.
RNA
If this column is checked, the RNA genes are displayed.
109
RECOG Client User's Manual
Switching options for ortholog line display
Options
Details
Universal Only
Ortholog groups that contain the genes of all species are called
universal ortholog groups.
If this column is selected, only the universal ortholog groups are
displayed.
1 vs. 1 Only
Ortholog groups that contain only a gene for each species are
called 1 vs. 1 groups.
If this column is checked, only the 1 vs 1 ortholog groups are
displayed.
3.
Unique Only
If this column is checked, only unique genes that form no
* Non-Core genes only
ortholog groups are displayed.
Click the Apply button.
27.11. Changing the display style of species names
1.
Click View - View Change... on the Genome Comparison Viewer screen.
Click the View tab on the screen for changing the display style of the Genome Comparison
Viewer screen.
2.
Select the display stype of species names in the Organism column on the View tab.
Normal: The official species names are displayed.
Abbreviation: The abbreviated species names are displayed.
Show Strain: If this is checked, the strains are displayed.
110
RECOG Client User's Manual
27.12. Display/Nondisplay of the Locus Tag
1.
Click View - View Change... on the Genome Comparison Viewer screen.
Click the View tab on the screen for changing the display style of the Genome Comparison
Viewer screen.
2.
To display the Locus Tag on the genome map, check Show in the Locus Tag column on
the screen for changing the display style of the Genome Comparison Viewer screen. In the
Row count, specify the number of rows for displaying the Locus Tag. If multiple rows are
specified, their space is used so that names do not overlap each other.
To hide the Locus Tag on the genome map, uncheck Show in the Locus Tag column.
If 0 is specified in the Row count, the distance between genomes takes its minimum value
and the Locus Tag is not displayed regardless of whether Show is checked or unchecked.
3.
Click the Apply button.
27.13. Color setting
The color can be set based on the gene position on the reference genome or it can be set on the
Color tab on the control panel.
1.
Click View - View Change... on the Genome Comparison Viewer screen.
Click the Color tab on the screen for changing the display of the Genome Comparison
Viewer screen.
2.
On the Color tab, set the colors for genes and ortholog lines.
Reference genome
Core genes are colored with color gradations from green to red based on the gene
positions on the reference genome. Non-Core genes and RNA are colored in grey and
deep blue, respectively.
Use the color of the control tree
For coloring, the color settings on the Color tab on the control panel (i.e. the same
color settings in the PPM table) are used.
111
RECOG Client User's Manual
27.14. Automatic correction of the gene orientation
In accordance with the setting for the automatic correction of the gene orientation, the gene
orientation is made uniform in the ortholog group displayed in the center.
The setting for the automatic correction of the gene orientation is valid only in Adjust Mode.
1.
Click View - View Change... on the Genome Comparison Viewer screen.
112
RECOG Client User's Manual
Click the Arrange tab on the screen for changing the display of the Genome Comparison
Viewer screen.
2.
Specify the method of automatic correction of the gene orientation on the Arrange tab.
Arrange in the positive direction
Place all genes in the positive direction.
Arrange in the consensus direction of the core genome
Place all genes in the consensus direction of the ortholog group obtained by the
CoreAligner analysis.
Arrange in the direction of the reference genome
Place all genes in the direction of the reference genome genes.
27.15. Changing the display style of the scale marks
1.
Click View - View Change.… on the Genome Comparison Viewer screen.
2.
On the Scale tab, set the display style of the scale marks.
Relative position from center
The relative position from the center is displayed on the scale marks.
113
RECOG Client User's Manual
Position of reference genome
The position based on the coordinates of the reference genome is displayed on the
scale marks.
27.16. Printing
1.
Click File – Preview… on the Genome Comparison Viewer screen. The Genome
Comparison Viewer Preview screen is displayed.
2.
On the Genome Comparison Viewer Preview screen, the following settings are possible:
Zoom
Specify the image magnification.
If Auto is specified, the image magnification is adjusted so that the image fits onto a
single sheet of paper.
Page settings
Specify the paper size, etc.
3.
Click the Apply button.
The print setting screen is displayed. Printing is carried out in accordance with the screen
display.
To directly print without displaying the Genome Comparison Preview screen, click File –
Print… on the Genome Comparison Viewer screen.
114
RECOG Client User's Manual
28. Updating the Gene Information
Using the gene information update function of the RECOG Client, the gene information,
chromosome information, Taxonomy Tree information and Function Category information can
be updated.
28.1. Updating the Taxonomy Tree based on the update
notice
If any gene information provided by the RECOG server is updated, the
icon is displayed
on the lower right of the screen. To display the update notice, click the icon. To update the
Taxonomy Tree data on the All tab, click the Update taxonomy only button in the notice
message.
* If “In the future, this message should not be displayed” is checked and the Close button is
clicked, no update notices will be displayed thereafter.
To display update notices again, click
(Option) in the Toolbox, check ”Update
information is regularly checked” on the General tab on the Option screen, and click the
Apply button.
115
RECOG Client User's Manual
28.2. Updating gene information through Update Data
The RECOG Client can download data from the RECOG server. This function is used to update
the RECOG Client data when the RECOG server data have been updated.
1.
To display the Update data screen, click File - Update Data….
2.
Select one of the following on the Update data screen, and click the Apply button.
Taxonomy data only
Only the Taxonomy Tree data are updated. Other data are retrieved as the need arises.
Usually, this mode is the most efficient.
Updated data only
Regarding the Taxonomy Tree data and the gene information currently held by the
RECOG Client, only the data updated by the server are updated. This function is used
to update necessary information collectively.
Updated data only(Force)
The Taxonomy Tree data and all the gene information held by the RECOG Client are
updated. This function is used to force an update in cases where the RECOG Client’s
information is defective.
All data
All the gene data are downloaded.
(Note) If All data is specified, it may take about several tens of minutes to download the data,
depending also on the network transfer rate.
116
RECOG Client User's Manual
29. Registration and Management of
Gene/Cluster Properties
It is possible to incorporate any type of gene information by importing gene property files.
Cluster properties are properties defined for each ortholog cluster, which typically calculated
using gene properties. Gene properties and cluster properties can be utilized for various
analyses such as sorting and PPM coloring.
29.1. Registration of gene properties
1.
Create a gene property file.
The format of a gene property file is as shown below:
The first row describes the header.
In the first column, "sp" (a three-letter code for a species) is given, and in the
second column, "locustag" is given.
In the third column, the arbitrary gene property name and type are given.
(Example) If the gene property name is Expression and the type is numerical, the
description should be Expression (Num).
The following four types of gene properties can be specified:
Type
Code
Example
String type
Char
BC2639
Numerical type
Num
-10.3
Enumeration
Enum(element1, element2,…)
Yes, No
type
* element#: possible value, that is, only
* Enum(Yes,No), that is, Yes
the element specified here is assignable
and
as a value.
elements.
Hierarchy
1.2.1
Hierarchical
No
are
the
specified
type
In the second row, gene property values are described.
In the first column, a three-letter code for a species is given, and in the second
column, Locus Tag is given.
In the third column, arbitrary gene property values are given.
If a gene has two values, the type should be specified as "Multi," and the two
values should be delimited by ";" (semicolon).
117
RECOG Client User's Manual
(Example)
sp
locustag
ban
BA0001
2.
GO(Char)
Cellular component
Expression(Num)
Pathway(Char,Multi)
2000
Glycolysis / Gluconeogenesis;Citrate cycle
Click File – Import - Gene properties file, and select the destination for registering the
gene property.
Select the destination from among the following:
Current Project, project name
Register the gene property so that it becomes available only in the current project or in
the specified projects.
Global
Register the gene property so that it becomes available in all projects.
3.
The Import gene property file screen opens. To register the gene property, specify the gene
property file created, and click the Open button.
29.2. Referencing a list of gene/cluster properties
On the Gene property / Cluster property screen, the registered properties can be checked.
1.
To display the Gene property/Cluster property screen, click Option - Gene
Property/Cluster Property List….
2.
To display a gene property, click the Gene tab, and to display a cluster property, click the
Cluster tab. The details of each screen that can be displayed are as follows.
Name: property name
118
RECOG Client User's Manual
Type: type
Multi: multiple attribute value flag. If this is checked, the gene has multiple attribute
values.
Location: location for storage. * Gene properties only
Global (uneditable)
System defined gene properties provided by the RECOG server.
They cannot be edited or removed.
Global
Gene properties that can be referred to in all projects.
Project name
Gene properties that can be referred to only within a project.
Category: category. * Cluster properties only.
DomClust: Property corresponding to the DomClust results.
Homology Cluster: Property corresponding to a homology cluster.
Cluster: Property corresponding to a cluster
Sub Cluster: Property corresponding to a sub-cluster
119
RECOG Client User's Manual
29.3. Editing properties
The property name and type can be modified.
1.
To display the Gene Property/Cluster Property screen, click Option - Gene
Property/Cluster Property List….
2.
To display the Edit gene property screen, select the property to be edited on the Gene
Property / Cluster Property screen, and click the Edit button.
3.
On the Edit gene property screen, specify the gene property name (Name), type (Type)
and the presence or absence of multiple attribute values (Multi value).
If the enumeration type is specified, specify also the possible values (Enum elements) in
comma-delimited form.
4.
On the Edit gene property screen, click the Apply button.
5.
On the Gene Property / Cluster Property screen, click the Apply button.
29.4. Removing a property
1.
To display the Gene Property / Cluster Property screen, click Option - Gene Property /
Cluster Property List….
2.
On the Gene Property / Cluster Property screen, select the property to be removed, and
click the Delete button. When the Confirm screen is displayed, click the OK button.
3.
To remove the property, click the Apply button on the Gene Property / Cluster Property
screen.
120
RECOG Client User's Manual
30. Registration and Management of
Gene/Cluster Sets
Multiple genes/clusters can be registered as a set. The registered gene/cluster sets can be
utilized for sorting, color setting and filter setting.
30.1. Registration of a gene/cluster set
A gene/cluster set can be registered by the following three methods:
Registration from a file
Registration from a cluster selected on the PPM
Registration from the keyword search results
30.1.1.
1.
Registration from a file
Create a gene/cluster set file.
The format for the gene/cluster set file should be one of the following three:
a.
dclust format
The dclust format should comprise the following:
<Species code>:<LocusTag>[ |,|¥t]<Species code>:<LocusTag>...
<Species code>:<LocusTag>...
(Example)
ban:BA0001, ban:BA0002
bca:BCE_0009,bce:BC0013,oihOB0010
b.
clusttab format
The file format should be one of the following:
The clusttab format output by clicking File - Export
The file format output by clicking Export gene/cluster set
c.
Gene property format
This is the file format described in “29.1 Registration of gene properties.”
121
RECOG Client User's Manual
2.
Click File – Import - Gene set file, and select the destination for registering the gene set.
Select from among the following:
Current Project, project name
Register the gene set so that it becomes available only in the current project or in the
specified projects.
Global
Register the gene set so that it becomes available in all projects.
3.
The Register gene set screen opens. To register the gene/cluster set, specify the set name,
gene/cluster set file and the destination for saving, and click the Apply button.
If ‘Overwrite the gene/cluster set of the same name’ is checked, the registration is made
upon overwriting the gene/cluster set of the same name if such a set exists.
The registered gene/cluster set is displayed in Gene Set/Cluster Set on the set control
panel.
30.1.2.
Registration from the cluster selected on the PPM
1.
Select the cluster on the PPM.
2.
To open the Register gene/cluster set screen, click the right mouse button and click Create
gene/cluster set.
3.
To register the gene/cluster set, specify the set name and the destination for registration on
the Register gene/cluster set screen, and click the Apply button.
If ‘Overwrite the gene/cluster set of the same name’ is checked, the registration is made
upon overwriting the gene/cluster set of the same name if such a set exists.
Registered gene/cluster sets are displayed in Gene Set/Cluster Set on the set control
122
RECOG Client User's Manual
panel.
30.1.3.
Registration from the keyword search results
1.
Display the Keyword Search Result screen.
2.
To display the Register gene/cluster set screen, check the column to the right of the
gene/cluster to be registered, and click the Register gene set/Register cluster set button.
3.
To register the gene/cluster set, specify the set name and the destination for registration on
the Register gene/cluster set screen, and click the Apply button.
If ‘Overwrite the gene/cluster set of the same name’ is checked, registration is made upon
overwriting the gene/cluster set of the same name if such a set exists.
Registered gene/cluster sets are displayed in Gene Set/Cluster Set on the set control
panel.
123
RECOG Client User's Manual
30.2. Outputting a gene/cluster set to a file
1.
To display the Export gene/cluster set screen, select gene/cluster set in Gene Set/Cluster
Set on the set control panel, click the right mouse button, and click Export gene/cluster
set.
2.
On the Export gene/cluster set screen, select the file name to be saved, and click the OK
button.
30.3. Editing a gene/cluster set (removing genes)
1.
To display the Edit gene/cluster set screen, select a gene/cluster set in Gene Set/Cluster
Set on the set control panel, click the right mouse button, and click Edit gene/cluster set.
2.
On the Edit gene/cluster set screen, change the name/destination for registration (only for
gene sets), or remove a gene/cluster.
To output the list of genes/clusters registered as a gene/cluster set to a file, click the
Export button.
3.
On the Edit gene/cluster set screen, click the Apply button.
124
RECOG Client User's Manual
30.4. Registering
additional
genes/clusters
to
a
gene/cluster set
The cluster and the genes contained in a cluster selected on the PPM can be added to a
registered gene/cluster set.
1.
Select a cluster on the PPM.
2.
To add the genes/cluster to a registered gene/cluster set, select a gene/cluster set in Gene
Set/Cluster Set on the set control panel, click the right mouse button, and click Add
selected genes/clusters to.
30.5. Removing a gene/cluster set
1.
In Gene Set/Cluster Set on the set control panel, select a gene/cluster set, click the right
mouse button, and click Delete gene/cluster set.
2.
To remove the gene/cluster set, click the OK button when the warning message is
displayed.
30.6. Referencing the list of gene/cluster sets
On the Gene set/Cluster set screen, the list of registered gene/cluster sets can be checked.
1.
To display the Gene set/Cluster set screen, click Option - Gene Set/ Cluster Set List….
2.
To display the gene property, click the Gene tab, and to display the cluster property, click
the Cluster tab. On each screen, the following items are displayed:
125
RECOG Client User's Manual
Name: property name.
Location: location for saving. *Gene properties only.
Global
A gene property that can be referred to in all projects.
Project name
A gene property that can be referred to only in the named project.
Gene Count: the gene count of a gene set. *Gene sets only.
Project: registration destination project. *Cluster sets only.
DomClust File: registration destination DomClust result file name. *Cluster sets only.
Cluster Count: registration destination DomClust result file name. *Cluster sets only.
3.
To register, edit or remove a gene/cluster set, click the Add…, Edit… or Delete… button,
respectively.
126
RECOG Client User's Manual
31. Combined Set
A combined set consisting of multiple gene/cluster sets can be created. The combined set can
be utilized for coloring, filtering, etc. based on the results of set operations using multiple sets.
31.1. Registering a combined set
1.
Registering a combined set of gene sets: Select gene sets in Gene Set on the set control
panel to display the Gene set combination screen, click the right mouse button, and click
New gene set combination….
Registering a combined set of cluster sets: select cluster sets in Cluster Set on the set
control panel to display the Cluster set combination screen, click the right mouse button,
and click New cluster set combination….
2.
On the Gene/Cluster set combination screen, specify the gene/cluster set names and the
logical conditions between the sets.
To add gene/cluster sets to the combined conditions, select the sets in the Set column
and click the >> button.
To add multiple gene/cluster sets to the combined conditions as a common set, select
the sets in the Set column and click the &>> button.
To add gene/cluster sets to the combined conditions as a negative condition, select the
127
RECOG Client User's Manual
sets in the Set column and click the Not>> button.
To add multiple gene/cluster sets to the combined conditions as a common set of
negative conditions, select the sets in the Set column and click the Not&>> button.
To remove a condition from the combined conditions, select the condition in the
Condition column and click the Delete button.
To modify the order of priority of the combined conditions, select a condition in the
Condition column and click the Up/Down button.
To change a condition in the combined conditions into a negative condition, select the
condition in the Condition column and click the Flip Not button.
To modify the negative condition in each set contained in the combined conditions,
double-click the condition name in the Condition column and modify it on the Edit
condition screen displayed.
To modify the color applied to the combined conditions, double-click the Color
column in the Condition column and modify it on the Color selection screen displayed.
3.
In the Filter/Color setting column, specify whether or not to apply a combined set to the
color/filter setting.
Filter and Color
Register a combined set to add it as the condition for the color/filter setting.
Color
Register a combined set to add it as the condition for the color setting.
128
RECOG Client User's Manual
Filter
Register a combined set to add it as the condition for the filter setting.
None
Register only combined sets.
4.
To display the combined conditions in Gene Set Combination/Cluster Set Combination
on the set control panel, specify the conditions on the Gene/Cluster set combination screen
and click the Apply button.
If Filter and Color or Filter is specified in the Filter/Color setting column, the filter
conditions are displayed in Filter - Gene Set Filter/Cluster Set Filter on the control
panel.
If Filter and Color or Color is specified in the Filter/Color setting column, the filter
conditions are displayed in Color - Gene Set/Cluster Set Filter on the control panel.
The specified filter settings and color settings are reflected on the PPM, in the comparative
genome map view, etc.
129
RECOG Client User's Manual
31.2. Editing a combined set
1.
To display the Gene/Cluster set combination screen, select a combined set in Gene Set
Combination/Cluster Set Combination on the set control panel, click the right mouse
button, and click Edit gene/cluster set combination.
2.
Modify the conditions on the Gene/Cluster set combination screen. For the method of
setting the conditions, refer to “31.1 Registering a combined set.”
3.
After modifying the conditions, click the Apply button.
31.3. Removing a combined set
To remove a combined set, select the combined set in Gene Set Combination/Cluster Set
Combination on the set control panel, click the right mouse button, and click Delete set
combination. When the warning message is displayed, click the OK button.
31.4. Specifying a combined set as a filter condition
1.
To set a combined set as a filter condition in Filter - Gene Set Filter/Cluster Set Filter
on the control panel, select the combined set in Gene Set Combination/Cluster Set
Combination on the set control panel, click the right mouse button, and click Register
filter.
31.5. Specifying a combined set as a color condition
1.
To set a combined set as a color condition in Filter - Gene Set/Cluster Set on the control
panel, select the combined set in Gene Set Combination/Cluster Set Combination on
the set control panel, click the right mouse button, and click Register color.
130
RECOG Client User's Manual
31.6. Enabling/Disabling a filter setting
1.
Select Filter - Gene Set Filter/Cluster Set Filter on the control panel, click the right
mouse button, and click Enable/Disable.
2.
To enable/disable each individual condition of a combined set, double-click the condition
in Filter - Gene Set Filter/Cluster Set Filter - Combined Set Name on the control panel.
31.7. Enabling/Disabling a color setting
1.
Select Color - Gene Set/Cluster Set on the control panel, click the right mouse button,
and click Enable/Disable.
2.
To enable/disable each individual condition of a combined set, double-click the condition
in Color - Gene Set/Cluster Set – Combined Set Name on the control panel.
131
RECOG Client User's Manual
32. Species Set
Multiple species can be specified as a set. The species set can be utilized for the phylogenetic
pattern filtering setting, the species color setting, and profile editing and operation.
32.1. Registering a species set
1.
To display the Organism Set screen, select a species on the Taxonomy Tree in the upper
part of the Selected tab, click the right mouse button, and click Organism set - New
organism set….
2.
Enter the name on the Organism Set screen. In the Target column, specify one of the
following: New (new registration), Overwrite (overwriting of an existing species set),
Add (additional registration).
3.
To display the species set in Organism Set on the set control panel, specify the conditions
and click the Apply button.
132
RECOG Client User's Manual
32.2. Editing a species set name
To display the Organism Set screen, select a species set in Organism Set on the set control
panel, click the right mouse button, and click Edit.
1.
Modify the species set name and click the Apply button.
32.3. Removing a species set
Select a species set in Organism Set on the set control panel, click the right mouse button, and
click Delete organism set. When the warning message is displayed, click the OK button.
32.4. Setting colors using a species set
1.
In Organism Set on the set control panel, select a species set, click the right mouse button,
and click the sub-menu of Color organism.
For the color setting method for species, refer to “11.4 Species color setting.”
32.5. Taxonomy filtering using a species set
1.
In Organism Set on the set control panel, select a species set, click the right mouse button,
click Taxonomy, and click the condition menu for the phylogenetic pattern filtering.
For the operation procedure of phylogenetic pattern filtering, refer to “15. Taxonomy
Filtering.”
133
RECOG Client User's Manual
33. Similar Phylogenetic Pattern Search
Register a reference phylogenetic profile to evaluate the similarity between the profile and the
phylogenetic pattern of each cluster. The results can be utilized for color setting, filtering,
sorting, etc.
33.1. Profile registration from a cluster
1.
Select a cluster on the PPM, click the right mouse button, and click Create phylogenetic
pattern. The Register phylogenetic Pattern screen is displayed, and phylogenetic patterns
according to the presence or absence of genes in the selected cluster are displayed thereon.
2.
On the Register Phylogenetic Pattern screen, specify the profile name and weight for each
species.
To change the weight, select the species in the list of species on the lower right and
specify the weight in the Setting Value column.
Value: Specify the weight value.
Ignore: Specify the species to be ignored in determining the coefficient of
correlation.
134
RECOG Client User's Manual
After selection, click the Set Value button.
You can change the weight using a species set. To do so, select the species set in the
Species Set column above the list of species. Upon selection, the species contained in
the species set are selected in the list of species. Then, set the weight of specified
species in the Setting Value column.
3.
After specifying the conditions, click the Apply button. The profile is displayed in
Phylogenetic Pattern on the control panel.
33.2. Editing a profile
1.
To display the Register phylogenetic Pattern screen, select a profile in Phylogenetic
Pattern on the control panel, click the right mouse button, and click Edit pattern.
2.
Edit the profile. For the editing method, refer to “33.1 Profile registration from a cluster.”
3.
After editing the profile, click the Apply button.
33.3. Removing a profile
1.
Select a profile in Phylogenetic Pattern on the control panel, click the right mouse button,
and click Delete pattern. When the warning message is displayed, click the OK button.
135
RECOG Client User's Manual
33.4. Similar phylogenetic pattern search
1.
To display the Calculate distance by pattern screen, select a profile in Phylogenetic
Pattern on the control panel, click the right mouse button, and click Calculate distance
by pattern.
2.
On the Calculate distance by pattern screen, specify the conditions for determining the
pattern similarity.
Name column, Save column
To save the calculation results to a file, check the Save column and enter the name. If
the calculation results are saved to a file, they can be used even if the DomClust result
file is reloaded.
Profile column
Specify the profile type.
Phylogenetic pattern
Use as a profile the binary vector representing the occurrence pattern of species
(expressing the presence or absence of species as 0 or 1, respectively).
136
RECOG Client User's Manual
Gene property
Use as a profile the numerical vector representing a property value of each gene
based on the specified gene property.
Type of distance
Specify the index for calculation to be used as the value of dissimilarity, in which 0 is
the nearest and 1 is the farthest.
Normalized hamming distance
Correlation coefficient
Correlation coefficient, absolute
Mutual information
* If ’Gene property’ is specified in the Profile column, only the ‘Correlation coefficient’
can be specified.
Sort by the calculated result
If this is checked, the PPM table is sorted using the calculated distance values.
3.
To set the following conditions, click the >>Option button.
Treatment of missing values
In cases where there is no gene corresponding to a species in a cluster, specify the
calculation method to cope with any missing values. This setting becomes effective
when Gene property is specified in Profile.
Ignore
Calculate in disregard of the species.
Average
Calculate by applying the mean of the values of the other genes in the same cluster.
Specified value
Calculate by applying a specified value.
137
RECOG Client User's Manual
Representative value of multiple gene property values
Specify the method of determining the representative value when multiple values are
defined for a gene.
Min: The minimum value among multiple values is used.
Max: The maximum value among multiple values is used.
Median: The median among multiple values is used.
Average: The mean value of multiple values is used.*
Representative value of multiple genes in one cell
Specify the method of determining the representative value when there are multiple
genes in a cell.
4.
Min: The minimum value among multiple genes is used.
Max: The maximum value among multiple genes is used.
Median: The median among multiple genes is used.
Average: The mean value of the gene properties of multiple genes is used.*
To calculate the dissimilarity of the specified pattern with each cluster, click the Apply
button after specifying the conditions.
After the phylogenetic pattern similarity search is completed, the calculated dissimilarity
value is displayed on the label on the side of the PPM. Also, if Sort by the calculated
result is checked, the PPM is sorted based on the value of dissimilarity.
The dissimilarity value is registered as a cluster property under the following name for use
in analysis:
If the Save column is checked: the entered name.
If the Save column is unchecked: “Phylogenetic Pattern Coefficient.”
33.5. Uses of the results of the phylogenetic pattern
similarity search
The results of the phylogenetic pattern search can be used in the following functions:
Display on the cluster header
PPM sorting (see “13 PPM Sort”)
138
RECOG Client User's Manual
Filtering by keyword search (see “17 Keyword Search”)
Color setting by properties (see “12 Color Display by Properties”)
33.6. Removing the phylogenetic pattern similarity
search
1.
The coefficient of correlation saved to a file upon checking the Save column can be
removed on the Cluster property tab on the Gene property/Cluster property screen. For
the method of removal, refer to “29.2
gene/cluster properties”.
139
Referencing a list of
RECOG Client User's Manual
34. Downloading the sequence information
Download the protein/DNA sequences of the genes contained in the cluster selected on the
PPM.
34.1. Downloading the sequence information
1.
Select a cluster on the PPM.
2.
Click the right mouse button and choose Download sequence…. The Download sequence
screen is displayed
3.
On the Download sequence screen, select amino-acid sequence or DNA sequence.
Protein
Download the amino-acid sequence.
DNA
Download the DNA sequence. For the DNA sequence, the extra sequence count obtained
upstream and downstream and the delimiting letter between the extra sequence obtained
and the gene DNA sequence can be specified.
4.
In Target genes, specify the target gene.
All genes on the cluster table
The genes contained in all the clusters displayed on the PPM are the targets.
Genes included in the selected cluster
The genes contained in the cluster currently selected on the PPM are the targets.
140
RECOG Client User's Manual
5.
After specifying the conditions, click the Apply button. When the screen for file saving is
displayed, enter the file name and click the OK button.
141
RECOG Client User's Manual
35. Management of External Resource URL’s
To display the information on external resources in a web browser from the Info tab and the
Regional Genome Map, register the external resource URL’s.
35.1. Registering an external resource URL
1.
Click Option - URL… to display the URL screen.
2.
To display the Edit URL screen, click the Add button on the URL screen.
3.
On the Edit URL screen, specify the name of an external resource (Name), the URL, and
the gene property (Key) to be used as the key for the URL.
To embed a gene property value in the URL, enter “#<number>” in the URL, click the
Add button, and specify the gene property in the Key column.
(Example) MBGD gene data URL
http://mbgd.genome.ad.jp/htbin/RECOG/RECOG_gene_info_frame.pl
?spec=#1&name=#2
142
RECOG Client User's Manual
#1: Gene property Organism
#2: Gene property Locus Tag
4.
To display the registered external resource URL on the URL screen, click the Apply
button on the Edit URL screen.
5.
Click the Apply button on the URL screen.
35.2. Editing an external resource URL
1.
Click Option - URL… to display the URL screen.
2.
To display the Edit URL screen, specify the external resource to be edited on the URL
screen and click the Edit button.
3.
On the Edit URL screen, edit the external resource information.
4.
On the Edit URL screen, click the Apply button.
5.
On the URL screen, click the Apply button.
35.3. Removing an external resource URL
1.
To display the URL screen, click Option - URL….
2.
On the URL screen, specify the external resource to be removed, and click the Delete
button. When the Confirm screen is displayed, click the OK button.
3.
On the URL screen, click the Apply button.
143
RECOG Client User's Manual
36. Appendix
36.1. DomClust parameters
Parameter
Details
Cutoff BLAST E-value
This value specifies a cutoff E-value for the BLAST results. The
maximum value is 1e-2. Note that, in MBGD, the E-value is
adjusted so that the size of the search space (the database size
times the query length) is 1e9.
Cutoff score of the optimal local alignment with the JTT-PAM250
scoring matrix (Jones et al., 1992). The same cutoff is used for
both the selection and the clustering steps when score is used
as a similarity measure.
PAM is a unit of evolutionary distance defined as the number of
accepted point mutations per 100 residues (Dayhoff et al.,
1978). The PAM distance is estimated based on the PAM
substitution matrix which gives the best alignment score. The
same cutoff is used for both the selection and the clustering
steps when PAM is used as a dissimilarity measure.
Percent identity is defined as {the number of identical residue
pairs} / {alignment length} * 100. The alignment length
includes the internal gaps.
Alignment coverage is defined as {alignment length} / {length
of the shorter sequence} * 100. Raising this parameter
removes matches only in short regions before the clustering
procedure. MBGD does not conduct this check by default.
In MBGD, a domain-splitting procedure is incorporated in the
hierarchical clustering algorithm. When merging two most
similar sequences (or clusters), the algorithm searches for
another sequence (S3) that matches one of the merged
sequences (S1) in the region outside the alignment between the
merged sequences. The algorithm splits the sequence S1 if
such a sequence S3 is found and the alignment between S1
and S3 satisfies the coverage condition specified by this
parameter and score condition specified by the next parameter.
Raise this parameter to avoid excessively short domains
generated due to partial matches.
Cutoff score for the match between S1 and S3 described above
to split the sequence. The effect of this parameter is similar but
possibly complementary to that of the previous parameter.
This option specifies which similarity or dissimilarity measure
(score or PAM) for use in orthology identification or clustering.
Note that the scores depend on the alignment lengths while
PAMs do not.
The bi-directional best hit criterion (i.e. gene pairs (a,b) of
genomes A and B, such that a is the most similar gene to b in A
and vice versa), is a conventional approach for ortholog
identification between two genomes. The uni-directional version
Cutoff DP score
Cutoff PAM distance
Cutoff percent identity
Alignment coverage
Alignment
coverage
for
domain
splitting
Score cutoff for domain splitting
Similarity measure for orthology
Best hit criterion
144
RECOG Client User's Manual
Cutoff ratio of the score against the
best
is also routinely used for predicting gene functions. MBGD does
not use such a criterion in the selection step by default, since
the UPGMA algorithm itself must involve it, but in some
situations, it might be useful for the purpose of filtering out some
apparent paralogs before clustering. See the next section for
details.
This parameter is not effective when the best-hit criterion above
is not used.
Orthology need not be a one-to-one relationship. As the
bi-directional best-hit criterion, two genes (a,b) are considered
to be orthologs when score(a,b) satisfies
score(a,b) / max( max_y( score(a,y) ), max_x( score(x,b) ) ) *
100 >= cutoff_ratio,
where x and y are any genes of genomes A and B, respectively.
Using cutoff_ratio =100 corresponds to the exact bi-directional
best-hit criterion.
Similarly, as the unidirectional best-hit criterion, two genes (a,b)
are considered to be orthologs when
score(a,b) / min( max_y( score(a,y) ), max_x( score(x,b) ) ) *
100 >= cutoff_ratio.
Score for missing relationships
Although the usual hierarchical clustering algorithm requires a
complete similarity/dissimilarity matrix, here only significant
similarities found by the search are used. This option specifies a
value to be assigned for the relationships missed by the search.
The value must be smaller (larger) than the similarity
(dissimilarity) cutoff. Specifying an extremely small (large) value
will result in a classification similar to that by complete linkage
clustering, whereas specifying a value close to the cutoff gives
results similar to that by single linkage clustering. The default
value (=blank) is {score_cutoff * 0.95} or {pam_cutoff / 0.95}.
Clustering Mode
This option specifies whether orthologous or homologous
groups shall be created. It is simply equivalent to omitting the
tree-splitting procedure described below by specifying phylocut
> 1.
Cutoff ratio of paralogs for tree
splitting
In MBGD, orthologous groups are created by splitting the trees
of homologous clusters created by the hierarchical clustering
algorithm. A node with two children, A and B, is split when
| Intersect(Ph(A),Ph(B)) | / min( |Ph(A)|, |Ph(B)| ) > phylocut,
Phylogenetically related organisms
Overlap
ratio
(radj1)
for
merging
where Ph(A) denotes the set of species contained in node A
(phylogenetic pattern), |Ph| denotes the cardinality of Ph, and
Intersect(A,B) is the intersection of sets A and B. This parameter
is not effective when ClusteringMode = 'homology' is specified.
When counting the number of species in the above calculation,
one can incorporate taxonomic information by counting related
species only once. A taxonomic rank can be specified to
determine which set of organisms are considered to be related.
After the tree-splitting procedure described above, two clusters
145
RECOG Client User's Manual
adjacent clusters
of domains are joined when they are almost always adjacent to
each other. More precisely, two clusters A and B are joined
when
|adjacent(A,B)| / max(|A|,|B|) >= radj1
or
|adjacent(A,B)| / min(|A|,|B|) >= radj2 ,
Coverage ratio (radj2) for absorbing
adjacent small clusters
where adjacent(A,B) is a set of domains belonging to A and B
that are adjacent to each other, and radj1 and radj2 are
parameters satisfying 0 <= radj1 <= radj2 <= 1.
See above. Note that this parameter is not effective
if radj2 <= radj1 .
Relative weight for horizontal transfer
Relative weight for horizontal transfer (0 <= x <= 1)
Use domclust dump
If this is checked, the DomClust analysis is conducted using the
cache for previous DomClust analysis results. This shortens the
processing time of the analysis.
146
RECOG Client User's Manual
37. Glossary
A
Aggregation
Integration of clusters of the same phylogenetic pattern into a single row in the
phylogenetic pattern map.
C
Cell
A square corresponding to a species belonging to an ortholog group on the PPM
CoreAligner (http://mbgd.genome.ad.jp/CoreAligner/)
A software program for creating a core structure based on the preservation of gene
alignment sequences between affinity genomes
Circular Genome Map (CGM)
A gene map on which genes, etc. are drawn in a circle
ClustalW
A software program for performing the Multiple Alignment
Cluster
A group of genes grouped together based on DomClust analysis results
Cluster ID
A unique ID given to each cluster
COG(http://www.ncbi.nlm.nih.gov/COG/)
Clusters of Orthologous Groups of proteins (COGs)
D
DomClust(http://mbgd.genome.ad.jp/domclust/)
Hierarchical clustering program for orthologous protein domain classification, which is the
standard method to construct ortholog groups in RECOG.
E
Extra Taxonomy Tree
The Taxonomy Tree shown on the Selected tab
F
147
RECOG Client User's Manual
Function category
Functional classification attendant on and characterizing genes and clusters
G
Gene Property
Property values associated with each gene, which can be given by the user.
Genome Comparison Viewer
A genome map in which the gene core structure is colored based on the results of
DomClust analysis and CoreAligner analysis
I
Ingroup
The set of target species in phylogenetic analysis. In the DomClust analysis, ingroup
species is specified as the set of related species on which the attention of the user is focused
M
MBGD (http://mbgd.genome.ad.jp)
Microbial Genome Database for Comparative Analysis, which is the standard genome
database in RECOG.
N
Neighborhood gene clustering
A method for identifying genes that are located near both in the phylogenetic pattern map
and in the genomic sequence.
O
Ortholog group (cluster)
A group of homologous genes made by clustering based on the orthologous relationships
between genes. In RECOG, ortholog groups are constructed by the DomClust program and an
ortholog table created based on the ortholog groups is used as a basis for any comparative
anaylsis. In the genomic core structure analysis, a core structure alignment is generated by
reordering ortholog groups based on the conserved gene order along each chromosome.
Ortholog table
A table showing orthologous relationships among species, where each row represents
ortholog group and each column represents species. In RECOG, an ortholog table is represented
148
RECOG Client User's Manual
as a phylogenetic pattern map (PPM).
Outgroup
The set of control species in phylogenetic analysis, which are located outside of the ingroup
on the phylogenetic tree. In the DomClust analysis, outgroup species is specified as the group
of species which do not belong to the ingroup.
P
Phylogenetic pattern
In a strict sense, a binary vector that indicates the presence (1) or absence (0) of a gene for
each species defined for each orthologous group. In a more broad sense, a numeric vector
that indicates some gene property value of each species.
Phylogenetic Pattern Map (PPM)
A matrix that shows the presence or absence of species based on the DomClust analysis
results
R
RECOG(http://mbgd.genome.ad.jp/RECOG/)
Research Environment for Comparative Genomics
A client server-type software program that is a comparative genome workbench for
conducting various comparative analyses based on DomClust analysis results
RECOG server
The server that conducts the DomClust analysis and CoreAligner analysis and provides
gene information in concert with the RECOG Client
Regional Genome Map (RGM)
A genome map for ortholog comparison
T
Taxonomy Tree
A phylogenetic species classification in tree form
149