1
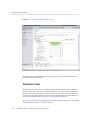
Performance Analyzer Views
parallel region. Inclusive metrics reflect nested parallelism. They are attributed to the current
parallel region, and the parent parallel region from which it was created. The attributions go
further on recursively up to the topmost Implicit OpenMP Parallel Region, representing the
serial execution of the program (outside any parallel region). If there are no nested parallel
regions in a program, the exclusive and inclusive metrics have the same values.
If a function containing a parallel region is called many times, all instances of the parallel
region will be aggregated together and presented as one line item in the corresponding view.
The view is useful for navigation. You can select an item of interest, such as the parallel region
with the highest OpenMP Wait time, and analyze its source or select a context filter to include
only the data related to the selected item. You can then analyze how the data is represented by
other program objects using other views: Functions, Timeline, Threads, and so on.
OpenMP Task View
The OpenMP Task view shows the list of OpenMP tasks with their metrics. The options in this
view are applicable only to experiments that were recorded with the OpenMP 3.0 collector,
for programs that use OpenMP tasks compiled with Oracle Solaris Studio compilers. See
“Limitations on OpenMP Profiling” on page 55 for more information.
The view lists tasks encountered during the program's execution, along with metric values
computed from the profiling data. Exclusive metrics apply to the current task only. Inclusive
metrics include metrics for OpenMP tasks plus those of their child tasks, with their parentchild relationship established at the task creation time. The OpenMP Task from Implicit Parallel
Region represents the serial execution of the program.
If a function containing a task is called many times, all instances of the parallel region will be
aggregated together and presented as one line item in the corresponding view.
The view is useful for navigation. You can select an item of interest, such as the task with the
highest OpenMP Wait time, analyze its source by clicking the Source view. You can also rightclick to select a context filter to include only the data related to the selected item, You can then
analyze how it's represented by other program objects using other views: Functions, Timeline,
Threads, and so on.
Lines View
The Lines view shows a list consisting of source lines and their metrics.
Source lines are labeled with the function from which they came and the line number and
source file name. If no line-number information is available for a function, or if the source file
Chapter 4 • Performance Analyzer Tool
113