1
Annotated Disassembly Code
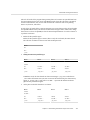
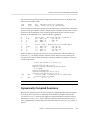
In the following output example, the instruction alignment maps the two instructions cmp and
bl,a to the same cache line. A significant amount of time is used waiting to execute only one of
these instructions.
Excl.
Incl.
User CPU User CPU
sec.
sec.
0.
0.
0.
0.
## 1.440
0.
0.
0.
0.
0.
0.
0.
0.
1.440
0.
0.
0.
0.
1. static int
2. ifunc()
3. {
4.
int i;
5.
6.
for (i=0; i<10000; i++)
<function: ifunc>
[ 6]
10684: clr
%o0
[ 6]
10688: sethi
%hi(0x2400), %o5
[ 6]
1068c: inc
784, %o5
7.
i++;
[ 7]
10690: inc
2, %o0
[ 7]
10694: cmp
%o0, %o5
[ 7]
10698: bl,a
0x10694
[ 7]
1069c: inc
2, %o0
[ 7]
106a0: retl
[ 7]
106a4: nop
8.
return i;
9. }
Instruction Issue Delay
Sometimes, specific leaf PCs appear more frequently because the instruction that they represent
is delayed before issue. This appearance can occur for a number of reasons, some of which are
listed below:
■
■
■
■
The previous instruction takes a long time to execute and is not interruptible, for example
when an instruction traps into the kernel.
An arithmetic instruction needs a register that is not available because the register contents
were set by an earlier instruction that has not yet completed. An example of this sort of
delay is a load instruction that has a data cache miss.
A floating-point arithmetic instruction is waiting for another floating-point instruction to
complete. This situation occurs for instructions that cannot be pipelined, such as square root
and floating-point divide.
The instruction cache does not include the memory word that contains the instruction (Icache miss).
Attribution of Hardware Counter Overflows
Apart from TLB misses on some platforms and precise counters, the call stack for a hardware
counter overflow event is recorded at some point further on in the sequence of instructions than
222
Oracle Solaris Studio 12.4: Performance Analyzer • January 2015