1
User Manual
Laser Vibrometer
OFV
Controller
Sensor Head
_____________________
Man-OFV-2200-9602-e01
OFV-2200
OFV-303
2
Warranty and Service
The warranty for this equipment complies with the regulations in our general terms
and conditions in their respective valid version.
This is conditional on the equipment being used as it is intended and as described in
this manual.
The warranty does not apply to damage caused by incorrect usage, external
mechanical influences or by not keeping to the operating conditions. The warranty
also is invalidated in the case of the equipment being tampered with or modified
without authorization.
To return the equipment always use the original packaging. Otherwise we reserve the
right to check the equipment for transport damage. Please mark the package as
FRAGILE and include an explanation of the reason for returning it as well as an exact
description of the fault. You can find advice on fault diagnosis in chapter 4.
Trademarks
Brand and product names mentioned in this manual could be trademarks or
registered trademarks of their respective companies or organizations.
Identification Labels
Controller
_____________________
Man-OFV-2200-9602-e01
Sensor Head
CONTENTS
1.
2.
General Information ..........................................................................................
1-1
1.1
Operating Principle ...............................................................................
1-1
1.2
Laser Safety ..........................................................................................
1-5
1.2.1 Optical Head Safety Information ..............................................
1-5
1.2.2 Beam Attenuator and Laser Interlock .......................................
1-6
1.2.3 Warning Labels on the OFV-303 Optical Head ........................
1-7
1.2.4 Summary Safety Precautions ....................................................
1-8
Operating the Vibrometer ...................................................................................
2-1
2.1
Preparation for Use .................................................................................
2-1
2.2
Optical Sensor Head ...............................................................................
2-3
2.2.1 Operational Elements ..................................................................
2-3
2.2.2 Manual Operation .......................................................................
2-5
2.2.3 Remote Focus Operation ............................................................
2-5
2.2.4 Exchanging the Lens ..................................................................
2-6
Controller Unit ........................................................................................
2-7
2.3.1 Front Panel Description ..............................................................
2-7
2.3.2 Rear Panel Description ...............................................................
2-9
Making a Measurement ..........................................................................
2 - 11
2.4.1 Aligning the Optical Head ..........................................................
2 - 11
2.4.2 Choosing the Measurement Range .............................................
2 - 12
2.4.3 Choosing Optimum Filter Settings ............................................
2 - 13
2.3
2.4
_____________________
Man-OFV-2200-9602-e01
4
3.
More Detailed Description of the System ........................................................... 3 - 1
3.1
3.2
4.
5.
The Optical Sensor Head ........................................................................
3-1
3.1.1 Interferometry Basics ..................................................................
3-1
3.1.2 Optics Scheme ............................................................................
3-3
3.1.3 The Doppler Effect .....................................................................
3-5
3.1.4 Multimode Laser Effects .............................................................
3-6
Signal Processing Unit ............................................................................
3-7
3.2.1 Signal Flow .................................................................................
3-7
3.2.2 Front Panel Control .....................................................................
3 - 10
3.2.3 The Velocity Decoder .................................................................
3 - 11
3.2.4 The Displacement Decoder .........................................................
3 - 12
Fault Diagnosis ..................................................................................................
4-1
4.1
Introduction ...........................................................................................
4-1
4.2
Checking the Optics ...............................................................................
4-1
4.3
Checking the Signal Processor ................................................................ 4 - 3
Specifications .....................................................................................................
5-1
5.1
General Data / Operating Conditions ......................................................
5-1
5.2
Optical Sensor Head ...............................................................................
5-2
5.3
Velocity Decoder Specifications ............................................................. 5 - 3
5.4
Displacement Decoder Specifications ....................................................
Appendix A: Size of Measurement Spot
_____________________
Man-OFV-2200-9602-e01
5-5
1-1
1 1.General Information
This chapter provides basic information on the functioning of the instrument and on the safety
concerns for laser vibrometers.
1.1
Operating Principle
As mentioned previously, the Polytec Vibrometer System is an instrument which measures
surface motion from a remote position using interferometric techniques.
Polytec optical vibrometers are all composed of two basic functional blocks, the
interferometer or optical head and the electronic signal processor. The signal processor is
linked to the optical head via a cable at the rear of the OFV-2200.
Using the optical head, light from a He-Ne-Laser source is projected at the surface under
investigation using a variable focus lens system.
The projecting lens also functions as a collecting lens, and returns the collected light into the
interferometer.
The phase of the signal beam is dependent on the path length travelled and therefore also on
the instantaneous position of the surface. The interferometer effectively makes an optical
phase comparison of the recovered light with an internal reference beam.
In order to distinguish direction, an offset frequency is optically introduced which causes the
interferometer output signal to provide an electronic carrier signal (of 40 MHz frequency) on
which the phase information rides.
This signal is fed to the electronic signal processor which demodulates the signal, thus
providing a voltage proportional to the momentary surface velocity as well as a voltage
proportional to the momentary displacement of the target both accessible on the front panel.
The sensitivity is determined by the decoder range settings.
_____________________
Man-OFV-2200-9602-e01
1-2
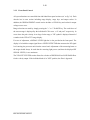
Measurements of the motion of surface generally fall into one of three categories in terms of
frequency and amplitude. These can be termed
a)
Metrological applications
Frequency: Less than 10 Hz
Amplitude: Greater than 1 µm
b)
Acoustic measurements
Frequency: 10 Hz - 20 kHz
Amplitude: Greater than 0.1 µm
c)
Ultrasonic measurements
Frequency: greater than 20 kHz
Amplitude: Less than 1 µm
with the approximate signal ranges as given. It is important to note that as the frequency range
of interest increases, the amplitude range encounters decreases. The Polytec Vibrometer is
especially suitable for measurements of type b and c. It is generally found that, in terms of
signal processing requirements, the most suitable parameter to measure is velocity rather than
amplitude. This can be seen from the equations of simple harmonic motion:
Amplitude
=
A sin ωt
Velocity
=
A ω cos ωt
Acceleration =
-A ω2 sin ωt
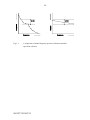
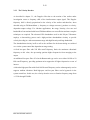
In these equations, A is the peak amplitude of motion at the angular frequency ω = 2πf. The
magnitude of the velocity signal is then given by the product of angular frequency and
mechanical amplitude. Most vibrational signals have high amplitude at low frequency and
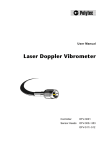
low amplitude at high frequency. As shown in figure 1.1, the spectrum of velocities then
flatters automatically, and thus allows more accurate measurements across a wide frequency
span to be made in one process. For example, if we assume that the signal processor has a
dynamic range of 1000 (or 60dB), a single measurement of amplitude at low frequency would
not be able to resolve the high frequency signals, as shown overleaf.
_____________________
Man-OFV-2200-9602-e01
1-3
Fig. 1.1:
A comparison of natural frequency spectra of vibrations and their
equivalent velocities
_____________________
Man-OFV-2200-9602-e01
1-4
If an equivalent velocity demodulator were used, the signal information recovered would
cover the entire range. The velocity decoder used in the Polytec Vibrometer controller has a
highly linear transfer function, high sensitivity (in the order 1 µm/sec when observed in a 10
Hz spectral width) and a high demodulation bandwidth (250 kHz). The lower edge of the
band of detectable vibration frequencies is less than 1 Hz.
These specifications make the Polytec Vibrometer System optimum for use within and above
the acoustic range of frequencies.
In all measurements made with an optical vibrometer, the signal quality at the output is
related to the amount of light recovered by the light collection system of the optical
measurement head. The signal level indicator located at the front panel, as well as at the
optical head, provides a measure of the light returned by the optical head from the target.
In general, the best collection efficiency, and therefore the best signal quality, is achieved
when the head is closest to the surface and the beam direction perpendicular to the surface.
The beam direction determines which component of the velocity vector is to be measured in a
particular surface point.
_____________________
Man-OFV-2200-9602-e01
1-5
1.2
Laser Safety
It is important to understand that laser light has properties different from ordinary light
sources. Laser radiation is highly unidirectional. A laser beam cannot be seen unless dust or
other particles cross the beam and scatter light in other directions. Laser radiation is generally
extremely intense, due to the beam´s low divergence, and care should be taken when handling
laser instruments that the direct beam does not enter the eye.
The following is user information pursuant to the Bureau of Radiological Health´s Laser
Products Performance Standards, section 1040.10, BS 4803 and DIN IEC 76/VDE 0837.
1.2.1 Optical Head Safety Information
The Polytec OFV-303 optical head is a class II laser product conforming with the US FDA´s
code of Federal Regulations 21 1040.10. Although the laser used inside the head is a CW
2mW HeNe laser, the system philosophy implies that the maximum optical output power
never exceeds 1mW.
The principal advantage of working with this low power is safety.
The laser beam emitted from the head is expanded but can be focused down to a small spot at
a variable distance from the lens. Even when optimally focused, the laser radiation is not
intense enough to harm the skin. However, looking inward along the beam or via mirrors or
optical instruments should be avoided at all times.
_____________________
Man-OFV-2200-9602-e01
1-6
1.2.2 Beam Attenuator and Laser Interlock
The OFV-303 optical head is equipped with a beam attenuator permitting the user to block the
emitted laser beam without having to switch off the laser. This is particularly important
because the laser emission aperture of the optical head is often located significantly far from
the main power switch.
A green laser warning light is also integrated into the optical head. It is located on the rear
panel of the housing. When lit, the shutter is open and measurements can be performed.
To position the head safely, it is recommended that the user switches the shutter to the "OFF"
position so that no laser light comes through the lens (light will go off). Once the head is in
place and pointed at the desired target, switch the shutter to the "ON" position. Following this
simple procedure will ensure that no-one's eyes are exposed to direct laser light.
It is not necessary to open the housing of the OFV-303 optical head. Should the
interferometer require alignment, please contact your local representative. The optical head, if
opened, reveals a class IIIa (IIIb in Europe) laser system which for safety reasons is switched
off via an interlock switch as soon as the cover housing is lifted.
_____________________
Man-OFV-2200-9602-e01
1-7
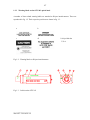
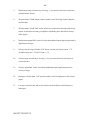
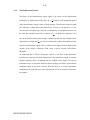
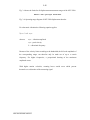
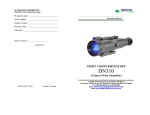
1.2.3 Warning labels on the OFV-303 optical head
A number of laser-related warning labels are attached to Polytec interferometers. These are
reproduced in fig. 1.2. Their respective positions are shown in fig. 1.3.
a
b
c
d*
* Only within the
U.S.A.
Fig. 1.2: Warning labels on Polytec interferometers
Fig. 1.3: Labels on the OFV-303
_____________________
Man-OFV-2200-9602-e01
1-8
1.2.4 Summary Safety Precautions
-
The OFV-303 optical head contains a beam attenuator. USE IT when
interchanging the optical heads or output lenses, moving the heads around or
when the instrument is on but not in use.
-
When positioning the optical head, keep the attenuator closed until it is time to do
fine adjustment of the laser beam on the surface to make a measurement.
-
Caution should be exercised especially when pointing the head at mirrored
surfaces which could reflect a significant percentage of the incident light towards
an unwary observer.
-
When the measurement has been carried out, close the attenuator to prevent stray
beams from travelling through the room.
_____________________
Man-OFV-2200-9602-e01
2-1
2 OPERATING THE VIBROMETER
2.1
Preparation for Use
Before installing the hard-clad, flexible cable between the OFV-303 head and the OFV-2200
controller, make sure that:
*
The OFV-2200 power key switch is at the "OFF" position (located on front panel)
*
The mains voltage selector is set correctly (located on rear panel)
*
Shutter switch on OFV-303 head is OFF
Having taken the above precautions, plug the cable into the "CONTROLLER" socket on the
OFV-303 head and into the "INTERFEROMETER" socket on the rear panel of the OFV2200.
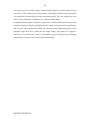
Switch on the OFV-2200 power switch. On the front panel, the "POWER" LED will light up
and the 7-segment LCD displays will be activated. Laser light will be emitted from the optical
head only after you have rotated the shutter knob to its "ON" position. This will also cause the
green LED to light up, indicating that laser emission is taking place. Place a piece of diffusely
reflecting material, e.g. matt aluminium into the laser beam, at a distance of approx. 0.6 m
from the optical head. Adjust the front lens to get the minimum spot diameter. The level
indicators on the OFV-2200 front panel and on the head should be lit up at a certain length.
This shows that the optics and the input section are working correctly.
Under certain conditions, the level check might not immediately prove satisfactory. If this is
the case, repeat the test after 20 minutes to give the laser time to reach its steady state
operating condition.
Response of the output signals may be checked using an oscilloscope connected to the BNC
sockets at the front panel. Increasing the reflected light level (use different surface materials)
should cause a decrease in noise level at the velocity output. The noise minimum indicates
exactly the optimum alignment under given surface conditions.
_____________________
Man-OFV-2200-9602-e01
2-2
If the target moves, the velocity output voltage should respond to velocity and direction of
movement. A "HI" readout at the velocity decoder LCD display indicates a peak velocity that
is too high and is overdriving the selected measurement range. The same symbol may occur
just for a few seconds after switching over to a different range setting.
At the displacement output, an arbitrary voltage level is measured after the system has been
switched on. After pressing the CLEAR button, the voltage level must return to zero and then
follow up the target displacement. When the relatively small displacement limits of the
particular ranges have been overdriven, the output voltage sign jumps to its opposite.
Therefore, on an oscilloscope screen, a sawtooth-like signal is displayed when the target
displacement is too large for the selected measurement range.
_____________________
Man-OFV-2200-9602-e01
2-3
2.2
Optical Sensor Head
2.2.1 Operational Elements
The OFV-303 optical head contains the interferometer described in detail in chapter 3.
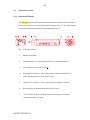
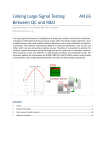
Front, side and rear views of the optical head are shown in fig. 2.1. The main elements
are described below with reference to the numbering in fig. 2.1.
Fig. 2.1: The optical head
1.
Shutter on/off knob.
2.
D-Sub connector for connecting the head to the controller processor.
3.
Laser indicator. Is lit when laser is on.
4.
Bar graph level indicator. Allows observation of the returned light level,
while adjusting the focus of the objective lens.
5.
Objective lens "Polytec". Can be removed and exchanged, see below.
6.
Revolving ring for manual focus of the objective lens.
7.
"AUTO-MAN" knob for switching between remote focus and normal
(manual) operation, see below.
_____________________
Man-OFV-2200-9602-e01
2-4
The hand-held remote control unit OFV-310, shown in fig. 2.2, is a useful optional
extra for the OFV-303. This unit must be connected with the specific connector on
the OFV-2200 rear panel.
Fig. 2.2: Remote focus control unit OFV-310
Operation is quite straightforward: Pressing either of the two keys on the OFV-310
causes the focus motor to start running in the desired direction. A bar graph
"SIGNAL" indicator (the level of which is a reproduction of the one on the OFV-303
head, see above, and the one on the OFV-2200 front panel, see 2.6) allows for easy
optimization of the light return level.
After 1 second of travel, the electronics switches the motor to high-speed mode. The
motor automatically stops when either end of the objective's range is reached.
_____________________
Man-OFV-2200-9602-e01
2-5
2.2.2
Manual Operation
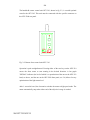
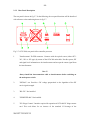
To manually focus the laser beam to "∞", turn the revolving ring (6) in clockwise
direction. For focusing at short distances, turn the revolving ring (6) in the anticlockwise direction. Knob (7) must be noticeably locked in outer position (pulled).
Fig. 2.3: Manual Focusing
2.2.3
Remote Focus Operation
For "remote focus" operation press the knob (7) right in towards the front panel and
operate the motor via the remote control unit OFV 310 if available.
a) Manual operation
Fig. 2.4
2.2.4
Exchanging the Lens
_____________________
Man-OFV-2200-9602-e01
b) Remote focus operation
2-6
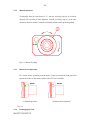
One of the important features of the OFV-303 head is the possibility of using
different front objectives (3) to address different applications. To obtain high lightcollecting efficiency at large working distances, for example, it would be desirable to
use a "fast" (meaning large aperture) telephoto objective.
To exchange the objectives, please proceed as follows:
-
Turn the threaded cap (5) in anti-clockwise direction until it can
be removed.
-
Remove the λ/4 mount (4) from the objective and put it aside.
-
Pull the objective (3) out of the objective mount (1).
-
Take the new objective and slide it carefully into the objective
mount (1). Turn it in the objective mount until the nose (2) matches
up with the slit in the objective and push the objective fully
into position.
-
Then put the λ/4 mount (4) in the objective in such a way that the
nose (2) locks in the slit of the λ/4 mount (4).
-
Then mount the threaded cap to secure the lens assembly.
Important !!!
Please take extreme care when changing the objective that no dirt enters the
instrument and that no optical parts are damaged.
Fig. 2.5: Changing the objective
_____________________
Man-OFV-2200-9602-e01
2-7
2.3
Controller Unit
2.3.1 Front Panel Description
Fig. 2.6 shows the OFV-2200 front panel. Numbering of elements refers to the explanations
given in the following.
Fig. 2.6: OFV-2200 controller front panel
1:
Main power switch. Key switch allows for prevention of unauthorized use of the
instrument.
2:
"Power" LED. Indicates that system is connected to the supply and that the power
switch is on.
3:
"Signal" light bar. Indicates strength of optical power returned to the
interferometer from the target. Use it to adjust optical head front lens to optimum
pointing efficiency and light collecting efficiency.
4:
Displacement decoder range indicator LCD. Shows selected scale factor in µm/V.
Available ranges are 0.5, 2, 8, 20 and 80 µm/V.
_____________________
Man-OFV-2200-9602-e01
2-8
5:
Displacement range selection keys. Pressing +/- key increases/decreases scale factor
of displacement decoder.
6:
"Displacement CLEAR" button. Allows manual reset of the fringe counter (displacement decoder).
7:
"Displacement CLEAR" BNC socket. Allows for synchronized resetting of the fringe
counter. Synchronized resetting is helpful for eliminating slow drift effects from periodic signals.
8:
Displacement output BNC socket. Provides demodulated output signal proportional to
displacement of target.
9:
Velocity decoder range indicator LCD. Shows selected scale factor in mm ⋅ s-1/V.
Available ranges are 5, 25 and 125 mm ⋅ s-1/V.
10:
Velocity range selection keys. Pressing +/- key increases/decreases scale factor of
velocity decoder.
11:
Velocity output BNC socket. Provides demodulated output signal proportional to
velocity of target.
12:
High-pass selection knob. "ON" position enables a 100 Hz high-pass for the velocity
output.
13:
Low-pass selection knob. Allows for selection of two different cutoff frequencies
and bypass.
_____________________
Man-OFV-2200-9602-e01
2-9
2.3.2 Rear Panel Description
The rear panel is shown in fig. 2.7. In the following, the rear panel functions will be described
with reference to the numbering shown in fig. 2.7.
Fig. 2.7: OFV-2200, rear panel of the controller processor
1.
"Interferometer" D-SUB connector. Connects with the optical sensor (either OFV303, -501 or -502 type) by means of the OFA-300 main cable. Provides power, RF
and signal level information to the interferometer and accepts the return signal from
the interferometer.
Note !!!
Always install the interconnection cable to interferometer before switching on
the main power switch.
2.
"SIGNAL" out. Provides a DC voltage proportional to the logarithm of the RF
carrier signal strength.
3.
"RS-232". Not installed.
4.
"GPIB/IEEE-488". Not installed.
5.
"PC-Fringe Counter". Interface required for operation of OFV-600 PC fringe counter
card. This card allows for an increase of the standard 12 bit-range of the
_____________________
Man-OFV-2200-9602-e01
2-10
displacement decoder up to 32 bits. It provides comfortable signal evaluation
features, e.g. an FFT of the displacement signal.
6.
"Remote Focus". Interface for connecting the optional hand-held control unit OFV310 for operation with OFV-303.
7.
Cooling fan.
Caution !!!
Always make sure that sufficient space is left behind the instrument in order to
allow for a good cooling air flow ! We recommend a minimum clearance of
50 mm.
8.
Line connector / fuse holder / voltage selector combi element.
Caution !!!
Before applying AC line power to your instrument, ensure that the voltage
selector is set to your national voltage and that the correct line fuses are
installed. Rated fuses are 2.5 A time delay for 100/115 V mains voltage and
1.25 A time delay for 230 V.
Line voltage selector. Line voltage can be set to nominal values 100, 115 and 230
VAC. Voltage variations within the range - 10 % to + 10 % can be tolerated.
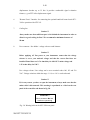
Caution !!!
If, for any reason, you have to open the instrument, always make sure that the
mains cable is disconnected. This warning is reproduced as a label on the rear
panel of the controller and shown in fig. 2.8.
WARNING !
Disconnect Mains
before opening
Fig. 2.8: Warning label on the OFV-2200 rear panel
_____________________
Man-OFV-2200-9602-e01
2-11
2.4
Making a Measurement
This section provides initial instructions on how to perform a vibration measurement using
the laser vibrometer. Proper alignment of the optical setup and suitable selection of the
measurement range will ensure accurate results of the vibration investigation.
2.4.1 Aligning the Optical Head
Place the sensor head approximately 60 cm from the surface under investigation. The laser
beam must be directed along the velocity vector of interest, in general orthogonal to the
surface element. Rotate the lens ring to closest focus distance.
Switch the instrument on at the key switch and rotate the beam attenuator to "on", allowing
the laser beam to exit the measurement head.
Now focus the laser beam slightly by rotating the lens ring. Optimum alignment is indicated
when the signal level display is at maximum bar length. However, even when no dot of the
indicator is on, the system is still able to measure in many cases.
It might prove necessary to change the operating distance in order to optimize the signal
strength, as observed at the signal level display. This is explained by the cyclic nature of the
visibility function generated by the presence of several modes in the laser:
In all cases where the signal level is weak or undergoes strong low frequency
fluctuations, reset the system using an operating distance which is about 11 cm different
to the current value. (Ref. chpt. 3.1.4).
_____________________
Man-OFV-2200-9602-e01
2-12
2.4.2 Choosing the Measurement Range
Once a good signal level has been obtained, connect the velocity output to an oscilloscope
and switch the velocity range to 125 mm/s/V. Provided the object vibrates, a sinusoidal trace
should be observed on the screen. With a stationary object, a noise-free base line should
occur.
If the velocity signal is smaller than 4 Vp-p, the lower ranges may be used to upscale the
velocity trace. Otherwise, if the velocity signal is too large, a "HI" symbol on the LCD will
indicate an overdrive.
Using a dual beam oscilloscope, the displacement output signal can be observed
simultaneously. To begin with, the CLEAR button should be pressed to reset the fringe
counter. With a stationary object, the scope should show a noise-free base line after resetting.
In this state, the maximum peak-to-peak measurement range for a vibrational displacement is
available.
If the experimental setup suffers from thermal drift or other slow relative motion between
target and optical sensor, the scope will truly reproduce this behaviour by showing a drifting
base line. To prevent this, a cyclic reset should be applied by either pressing the CLEAR
button repeatedly or by feeding a suitable TTL pulse to the corresponding CLEAR BNC
socket. For CLEAR signal conditions ref. to chpt. 5.4.
An overdrive of the selected displacement measurement range is indicated by a sawtooth-like
signal with a 16 V peak-to-peak magnitude at the displacement output. This is caused by a
cyclic overflow of the internal counter when the number of interferometric fringes is too
large. In this case, the next decoder range must be selected if available.
_____________________
Man-OFV-2200-9602-e01
2-13
2.1.1
2.4.3 Choosing Optimum Filter Settings
The velocity decoder section of the OFV-2200 vibrometer is equipped with switchable highand low-pass filters which adapt the measurement bandwidth to the application.
Filters are generally very useful for the signal analysis in the time domain, as they can
suppress unwanted, interfering components or noise in the measurement signal. For a signal
analysis in the frequency domain, as performed with spectrum analyzers, filters play an
insignificant role.
As technically realizable filters, especially analog filters, do not have ideal properties, their
employment in measurement applications which demand high accuracy must be considered
carefully.
Each type of filter represents a certain compromise between the behaviour in the pass band
and the stop band or between amplitude and phase accuracy. A further aspect is the
transmission behaviour for pulse-shaped signals which is closely linked to the phase response.
The OFV-2200 uses high-quality Butterworth-type filters which are optimized for a high
amplitude accuracy in the biggest part of the pass band combined with a good phase response.
Despite this, using these filters always implies unavoidable transmission errors in the pass
band, which increase with the proximity of the measurement frequency to the cutoff
frequency of the filters. A good rule of thumb for the installed 3rd order Butterworth-type
low-pass filters is the 70 %-rule:
At 70 % of the cutoff frequency the amplitude error is approximately -5 % and the phase lag
is -90°. This range can be used for exact amplitude determination at good phase linearity. The
top 30 % of the filter pass band should only be used for orientating measurements.
Special care should be exercised when using the high-pass filter. A 4th order Butterworthtype filter with 100 Hz cutoff frequency was installed in order to suppress the range of low
frequency ambient disturbances efficiently. With this filter the range for exact amplitude
measurements (-5 % error) starts at approximately 150 Hz. Note the phase lead in the range
100 Hz to 1,000 Hz. The filters and especially the high-pass filter should be switched off in
applications where phase shift is unwanted.
When using the high-pass filter there is an additional risk of an internal saturation of the
velocity decoder when a small measurement signal is superimposed by large low frequency
spurious components. An unwanted frequency component below 100 Hz, that comes, for
instance, from a machine vibration, can be suppressed effectively in the output signal with the
_____________________
Man-OFV-2200-9602-e01
2-14
help of the filter. In order to detect the higher-frequency signal under investigation with a
better resolution, the next measurement range with a higher sensitivity might be chosen.
However, the higher amplitude of the interfering signal can lead to an internal saturation of
the velocity decoder in this range which is indicated by the "HI"-symbol in the display. Given
this, a distortion-free decoding of the measurement signal is no longer possible.
A further filter, installed in the instrument's RF section is the so-called TRACKING FILTER.
This filter improves the RF signal quality, especially when the returned optical signal is weak
or suffers from drop-outs. The action of this special filter is not switchable by the operator,
but coupled to the velocity range setting.
Because this filter effectively reduces the bandwidth available for the modulated RF carrier, it
limits the slew rate for the demodulated signals at the same time. With respect to the velocity
information, this means an acceleration limit and with respect to the displacement signal, this
means a velocity limit. The limits for the individual measurement ranges are given with the
decoder specifications (ref. to chpt. 5).
Because the Tracking Filter affects both signal decoders and its setting is coupled to the
velocity range setting, the latter must be taken into account even when only the displacement
output is used:
In order to prevent an unwanted slew rate limit but at the same time benefit from a optimum
tracking filter efficiency, the velocity decoder should be set to the lowest possible, nonsaturated, range (no "HI" symbol). This should be taken into account especially when making
measurements in the higher displacement ranges at frequencies in the kHz range.
_____________________
Man-OFV-2200-9602-e01
3-1
3 MORE DETAILED DESCRIPTION OF THE SYSTEM
3.1
The Optical Sensor Head
3.1.1 Interferometry Basics
The Polytec OFV-303 optic vibrometer head uses an interferometric technique to measure
vibration. Optical interferometry allows the measurement of displacements much smaller than
the wavelength of light by utilising the sinusoidal relationship between the output of an
interferometer and the difference in optical path lengths traversed by its beams. By allowing
the motion of the surface of interest to modulate the path lengths travelled by the laser beams,
the interferometer can be used to detect vibrational signals of sub-nanometer amplitude.
Interference is a phenomenon observed when two beams of light (from a common origin) are
made to coincide. The resultant intensity after re-combination is seen to vary sinusoidally
with the relative phase difference between the beams.
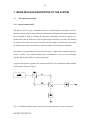
A typical arrangement to generate this situation artificially is the well-known Mach-Zehnder
interferometer as shown in fig. 3.1.
Fig. 3.1: The Mach Zehnder Interferometer as the working principle of a laser vibrometer
_____________________
Man-OFV-2200-9602-e01
3-2
Light from a laser source is divided at BS1 into two beams, of approximately equal intensity.
Beam 1 travels along a path of length L1, equivalent to an optical phase (θ) given by L1/λ.
Similarly, beam 2 travels an equivalent phase θ2 given by L2/λ
The sinusoidal dependence of the interferometer outputs then produce intensities given by
I(1) and I(2) at the detectors D1 and D2. I0 is the original input laser intensity.
I(1) = ½ I0 (1 - cos (θ2 - θ1))
(3.1)
I(2) = ½ I0 (1 + cos (θ2 - θ1))
(3.2)
We can see that simple interferometers of this kind can be used to measure the path length
difference ∆z between two light beams. The cosinusoidal relationship reveals two problems
still to be resolved in a practical realization of an interferometer:
A)
The interference signal does not provide directional information.
B)
The sensitivity of the system is a function of phase. When the output intensity is zero
or a maximum, the sensitivity given by output intensity against phase shift will be
zero.
How this problem is solved in the Polytec Vibrometer optical heads is described below.
_____________________
Man-OFV-2200-9602-e01
3-3
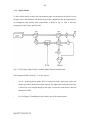
3.1.2 Optics Scheme
To allow object motion to affect the interferometer phase, one beam must be allowed to exit
from the "inner" interferometer cell, hit the target and be coupled back into the interferometer.
An arrangement that satisfies these requirements is shown in fig. 3.2. This is the basic
arrangement of the Polytec optical heads.
Fig. 3.2: The Polytec Optical Head: A modified Mach-Zehnder interferometer
The arrangement differs from fig. 3.1 in two respects:
-
Use of a polarising beam splitter BS2, in conjunction with a quarterwave plate (not
shown), provides a directional coupler function: The light beam coming from the laser
is allowed to travel straight through to the target, whereas the return beam is directed
downwards to BS3.
-
Use of a Bragg Cell modulator in the reference arm of the interferometer.
_____________________
Man-OFV-2200-9602-e01
3-4
The Bragg cell is a type of optical modulator that frequency-shifts the traversing light beam
by an amount fB that is determined by an electrical drive signal (denoted RFin in fig. 3.2). This
frequency shift fB results in a modulation of the detected interference signal with the RF
carrier used. With this modification taken into account, the intensities from equations (3.1)
and 3.2) can be rewritten as:
I (1) = ½ A2 {1 + cos [2π (fBt + 2∆z/ λ)]}
(3.3)
I (2) = ½ A2 {1 - cos [2π (fBt + 2∆z/ λ)]}
(3.4)
∆z denotes the displacement of the target with respect to a fixed reference position.
Subtracting the output signals from the photodetectors by an operational amplifier and
removing the DC content of the signal by capacitive coupling yields a SIG OUT voltage u
that reads
u = K cos [2 π ( f B t + 2 ∆z / λ) ]
(3.5)
It is the output signal of the sensor head and the input signal to the OFV-2200 that must be
processed to extract the displacement information ∆z. K is a proportionality constant taking
into account detector efficiency and amplifier gain.
_____________________
Man-OFV-2200-9602-e01
3-5
3.1.3 The Doppler Effect
Equation (3.5) relates the output voltage u from the optical head to a displacement of the
target; displacing the target by an amount ∆z phase-shifts the detected RF-signal by
θ RF = 4π ∆z /λ
(3.6)
If the target moves towards the head at a constant speed v = ∆z / ∆t, the output phase shift
turns into an output frequency shift, the well-known Doppler shift fD with
fD = 2 v / λ
(3.7)
Thus, the output frequency of the head can be expressed as:
fout = fB + fD
(3.8)
Depending on the direction of the movement, the sign of v changes (and so does that of fD):
Positive v is defined as a movement towards the head, negative v denotes a movement away
from the head.
_____________________
Man-OFV-2200-9602-e01
3-6
3.1.4 Multimode Laser Effects
The Polytec series of vibration measuring interferometers all use a multimode Helium-Neon
laser as coherent light source. These lasers are longitudinally multimode and linearly
polarised with an output power between 2.2 and 3.0 mW. Due to the fact that these lasers are
multimode, there is a cyclic dependence of signal quality on operating distance. The optimum
signal quality is obtained when the optical path length difference is an integer multiple of 2 x
laser cavity length. In this case, the optical path length extends twice as fast as the operating
distance, as the beam travels there-and-back. Thus a peak signal is obtained once per cavity
length, in this case 205 mm. In practice, it is not usually necessary to search out the
maximum, as firstly the system is usually sensitive enough to measure adequately even near
the minimum, and secondly, the true minimum is only actually present when two adjacent
modes are of equal power. The mode distribution is mainly affected by thermal expansion of
the laser tube, and passes through this balanced condition repeatedly during the warm-up
period. The mode distribution, which is obtained once the laser tube reaches thermal
equilibrium, is thus almost random.
Should a signal level minimum be encountered, indicated by a fluctuation of signal level
during laser warm-up, then changing the operating distance by half laser cavity length
(=105 mm) should resolve the problem.
The optimum operating distances for the OFV-303 sensor head:
approx. 232, 437, 642 mm etc. as measured from the front surface of the head's front plate.
_____________________
Man-OFV-2200-9602-e01
3-7
3.2
Signal Processing Unit
3.2.1 Signal Flow
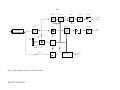
The signal flow of the vibrometer unit is relatively straightforward and can be discussed with
reference to fig. 3.3. In order to clarify the interrelation between optics and electronics, the
diagram comprises both the sensor head and the signal processor arrangement schematically.
_____________________
Man-OFV-2200-9602-e01
3-8
Converter
Counter
Quadr. Dem.
Phase Mult.
COUNT
∆ϕ
12 bit
D
DIR
n* ∆ϕ
Low Pass
Displacement
Output
A
CLEAR
QD
Mixer
Amplifier
Sensor Head
FM Demod.
RF
RF
ref
f
IF
Low Pass
Velocity
Output
LF
V
f
Level
Indic.
lo
Level
Detector
Local
Oscillator
Control Bus
Signal Strength
LO
Bragg Cell Drive
_____________________
Man-OFV-2200-9602-e01
QD
ref
System Control
Master
Oscillator
Fig. 3.3: Block diagram of the OFV-2200 electronics
ref
Amplifier
Human
Interface
3-9
A MASTER OSCILLATOR provides an RF signal, used to drive the Bragg cell modulator at
a frequency of 40 MHz, and various reference frequencies for the LOCAL OSCILLATOR
stage and the QUADRATUR DEMODULATOR unit.
The frequency and phase modulated RF signal returned from the optical head contains
measurement information on both vibration velocity and displacement. After signal
conditioning, this RF signal (initially 40 MHz carrier frequency) is fed directly to the
displacement decoder. Another part of this signal carrier is downmixed, using the local
oscillator frequency fLo, to the lower IF value. The IF signal contains the same modulation as
an input for the velocity decoder section.
A LEVEL DETECTOR provides a DC voltage proportional to the logarithm of the RF signal
strength. This voltage drives a level indicator on front panel and is also fed to the "SIGNAL"
socket on rear panel for external use.
The vibration velocity information is recovered by an FM DEMODULATOR stage, the socalled velocity decoder. The velocity decoder provides 3 measurement ranges of high
linearity and frequency bandwidth, covering the entire velocity range from less than 1 µm/s to
1.25 m/s. The decoder ranges are controlled from the front panel via the internal CONTROL
BUS, which also controls the local oscillator frequency corresponding to the velocity range.
The LF output of the velocity demodulator passes through a switchable HIGH-PASS/LOWPASS filter section.
The displacement information is recovered by a digital PHASE DEMODULATOR unit. Five
measurement ranges are selectable covering a peak-to-peak displacement range from 8 µm
through 1.3 mm. The decoder is controlled from a separate front panel section via the internal
CONTROL BUS.
The displacement decoder output signal passes a fixed low-pass filter with a 250 kHz cutoff
frequency.
________________________
Man-Vib-OFV2200-1299-01e
3-10
3.2.2 Front Panel Control
All system functions are controlled from individual front panel sections (ref. to fig. 2.6). Each
decoder has its own section including range display, range keys and output socket. In
addition, the DISPLACEMENT control section includes a CLEAR key and socket for output
voltage reset to zero.
Range selections are made by simply pressing the "+" or "-" RANGE key. The scale factor of
the current range is displayed by the individual LCD in mm ⋅ s-1/V and µm/V respectively. In
cases where the peak velocity is too large for the range, a "HI" symbol is displayed instead of
a number in the VELOCITY range display.
For ease of adjustment, a SIGNAL LEVEL light bar is also provided at the front panel. The
display is fed with the output signal from a LEVEL DETECTOR that measures the RF signal
level entering the processor unit from the sensor head. Adjustment of the measuring beam on
the target should always be such that the returning light power (and thus the displayed RF
SIGNAL LEVEL) is at a maximum.
The VELOCITY FILTER section allows for selection of HIGH-PASS and LOW-PASS filters
for the velocity output. If the individual knob is in "OFF" position, the filter is bypassed.
________________________
Man-Vib-OFV2200-1299-01e
3-11
3.2.3 The Velocity Decoder
As described in chapter 3.1, the Doppler effect due to the motion of the surface under
investigation causes a frequency shift of the interferometer output signal. This Doppler
frequency shift is directly proportional to the velocity of the surface and therefore, when
decoded using an FM demodulator (= frequency to voltage converter), produces a velocitydependent output voltage. For vibration applications, the range, linearity, slew rate and
bandwidth of conventional radio-based FM demodulators are not sufficient and more complex
techniques are required. The advanced FM demodulator used in this Polytec Vibrometer
employs a down-mixing process and a high-precision demodulation circuitry to provide
velocity decoding in a wide measurement range with high linearity and large bandwidth.
The demodulation circuitry itself as well as the oscillator for the down-mixing are switched
over via the system control bus dependent on range setting.
A fixed low-pass filter with 250 kHz cutoff frequency limits the maximum vibrational
frequency to this value, also preventing spurious higher frequencies from emerging at the
output.
An additional low-pass filter of 3rd order Butterworth type can be set at either 10 kHz or 50
kHz cutoff frequency, providing optimum noise suppression if higher frequencies are not of
interest.
A 4th order high-pass filter with fixed 100 Hz cutoff frequency can be advantageously used to
suppress ambient vibrations. Both high-pass- and low-pass filters can be bypassed via the
system control bus. In this case, the velocity decoder covers a vibration frequency range from
< 0.5 Hz through 250 kHz.
________________________
Man-Vib-OFV2200-1299-01e
3-12
3.2.4
The Displacement Decoder
The phase of the interferometer output signal is the carrier of the displacement
information. A displacement of the object by ±
λ
2
produces a full modulation period
at the interferometer output, namely a fringe passage. Therefore the electrical signal
also undergoes a phase shift at the photoelectric receiver by one period or 2 π rad.
The amount of complete signal periods is consequently an incremental measure for
the total object displacement with a resolution of
λ
2
, for HeNe laser therefore 316,4
nm. As the interferometric phase changes continuously with the object displacement,
displacements smaller than
λ
2
can also be evaluated by a phase demodulation of the
electrical interferometer signal. This is realized in the high-resolution displacement
decoder of the Polytec vibrometer 2200, using a special circuitry called Phase
Multiplier.
As mentioned above, Polytec vibrometers operate on the basis of the heterodyne
interferometer, therefore the phase information of the interference signal, as with the
Doppler frequency shift, is modulated onto the 40 MHz carrier signal. The required
information rides on the phase difference between Bragg cell driver signal and the
modulated signal at the photo detector. With the help of a so-called quadrature
demodulator, the interferometric phase information can be reconstructed from these
two signals.
________________________
Man-Vib-OFV2200-1299-01e
3-13
Please refer to fig. 3.3 to understand the function of the displacement decoder. Its
function will be explained first without considering the block PHASE
MULTIPLIER.
The quadrature demodulator reconstructs the phase information in a digital form out
of the 40 MHz reference signal (PM Ref) and the interferometer signal (RF). At its
output the pulse sequences COUNT and DIRECTION develop. A COUNT pulse
corresponds to each 2 π period of the interferometer signal and an object
displacement of
λ
2
. The binary value of the DIRECTION signal informs on the
direction of the phase shift, i.e. on the motion direction of the object. Both pulses are
led to a binary up-/down counter whose counter status is consequently a measure for
the present position of the object. The counter range is 12 bit, i.e. 4096 steps. As
each step corresponds to an object displacement of 316.4 nm, a range of
approximately 1.3 mm with a resolution of 0.3164 µm can be detected in the socalled Direct Count Mode. In order to make full use of the counter range, the counter
is set to zero in the resting position with the help of an external CLEAR pulse. Thus,
with a vibrational motion of the object, the maximum amplitude can be 0.65 mm.
In order to observe the displacement signal in real time, for instance with the help of
an oscilloscope, the digital counter status is converted via a fast 12 bit D/A converter
into a voltage signal. At the output of the D/A converter, a voltage signal
approximated by steps originates according to the resolution of the converter. This is
flattened by a low-pass filter at higher vibration frequencies.
The chosen working principle of the displacement decoder determines its accuracy.
As long as the optical signal shows no drop-outs, the interferometer output signal is
phase-continuous and at the output of the quadrature demodulator, a COUNT pulse
generates for each 2 π phase cycle of the interferometer. The accuracy of the
corresponding displacement of 316.4 nm is only determined by the wavelength
stability of the laser which is of the order of 10-5. It is known that HeNe lasers
constitute an acknowledged standard for length measurements.
Therefore the change of the digital fringe counter status corresponds fairly exactly to
the displacement of the object, independent of ageing effects. However, a part of the
physically provided accuracy is lost again by the following analog components, as it
is known that these can cause static and dynamic amplitude- and phase errors in the
________________________
Man-Vib-OFV2200-1299-01e
3-14
output signal. Especially with vibrational movements above 100 kHz, dynamic errors
caused by the low-pass filter may occur which should not be neglected.
It is often desirable to have available an even higher resolution. In the highresolution displacement decoder installed in the OFV-2200 system, this is achieved
by the additional component "Phase Multiplier" (ref. fig. 3.3). In this functional
block the RF-signal is pre-processed before the quadrature demodulation in the
frequency domain. By means of digital procedures, an integer, up to a 160-fold,
multiplication factor of the instantaneous phase deviation compared to the direct
signal, is achieved.
In the lowest measuring range the incremental counter value is therefore around
2 nm.
As the counting capacity is always 12 bit, the total measuring range is reduced by the
multiplication factor when the phase multiplier is applied. In the lowest measuring
range with a scale factor of 0.5 µm/V, displacements up to approximately 8 µm
(vibrational amplitude ± 4 µm) can be detected.
Unfortunately, an increase of the original bandwidth of the modulated signal and the
pulse frequency at the counter is involved with the phase multiplication. The
technical limits of the system are reached in the Direct Count mode (80 µm/V) at a
motion velocity of 1.6 m/s. In the higher resolving measurement ranges, starting
from this value, the limiting velocity decreases, approximately according to the
multiplication factor.
________________________
Man-Vib-OFV2200-1299-01e
3-15
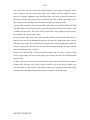
Fig. 3.4 shows the limits for all displacement measurement ranges of the OFV-2200.
Fehler! Kein gültiger Dateiname.
Fig. 3.4: Operating range diagram of OFV-2200 displacement decoder
For a harmonic vibration the following equation applies:
Vpeak = 2 π fv · xpeak
whereas
xpeak = vibration amplitude
vpeak = peak velocity
fv = vibrational frequency
Because of the velocity limits according to the bandwidth, the full scale amplitude of
the corresponding ranges can therefore only be made use of up to a certain
frequency. For higher frequencies, a proportional derating of the maximum
amplitude occurs.
With higher motion velocities, counting losses would occur which present
themselves as a distortion of the measuring signal.
________________________
Man-Vib-OFV2200-1299-01e
4-1
4 FAULT DIAGNOSIS
4.1
Introduction
If there is any malfunction of the instrument, please first ensure that the connection cable
between optics and controller is correctly installed (with screws fixed), that the controller is
plugged into the mains, that the power switch is on and that the shutter is open (ref. chapter
2.2.1).
The "power" LED on the front of the controller and "Laser" LED on the optical head should
be lit. If they are not, a faulty mains voltage supply could be the cause. In this case check the
fuses at rear panel.
Warning:
To avoid an electric shock, do not remove the covers while the instrument
is connected to the mains!
If the fault is not corrected, the following tests should be performed to locate the defective
unit. On completion, please contact our service personnel for further information and
assistance.
4.2
Checking the Optics
Failure of an optical head can be caused by either a faulty laser, damage to or misalignment of
the optical components or the electronic circuitry. If an optical power meter and/or a
polarisation analyser is available, it is possible to quickly test some basic functions of the
interferometer.
a)
Is a laser beam emitted from the front lens ?
If not:
Possible sources of failure could be the laser tube, the laser HV supply (inside interferometer
unit), or a missing -15V supply voltage. To check the latter, continue with 4.3.
________________________
Man-Vib-OFV2200-1299-01e
4-2
A failure can also occur if the controller power switch was switched on prior to connecting
the interferometer to the controller. If so, switch off controller and switch on again.
b)
Does the "SIGNAL" display (on interferometer controller front panel or optical head)
respond to changes in the reflectivity of a target ?
To check, place a sheet of well reflecting material in the laser beam. Optimum distance to
position the target from the front lens is about 60 cm.
c)
What power is emitted from the optical head ?
(Typically > 0.8 mW).
d)
Is the laser power stable ?
(Typically < 5 % variation after the instruments have warmed up).
e)
Is the polarisation okay ?
The correct polarisation state for the output beam is circular, which means that when a
polariser is rotated in the beam, the power should remain constant.
(Typical fluctuations are < 20 %).
________________________
Man-Vib-OFV2200-1299-01e
4-3
4.3
Checking the Signal Processor
Failure analysis on the signal processor is restricted to measurement of low voltages on
connectors located on the front and rear panels. These include time-variable signals (decoder
output), which should be analysed using an oscilloscope as well as DC power supply
voltages. The latter should be measured using a multimeter, as reading an oscilloscope trace is
generally not precise enough.
The location of the connectors in question can be seen from fig. 4.1.
a)
Measurement of decoder output
The sensor head must be connected to the controller and a sufficient level of light
coupled back from a retro-reflective target.
a1)
Is a signal indicated by the front panel LED indicator ?
a2)
Does the decoder output respond to vibration at all ?
a3)
If the output does not respond: Is a significant DC offset to be observed ?
a4)
Is the output signal noisy or does the scope show a clear straight line when the
object does not vibrate ?
(Note: Noise must occur when no light is reflected or when the laser beam is
blocked).
b)
Measurement of power supply voltage levels
Before performing these measurements using a multimeter, the processor/interferometer
connection cable should be disconnected. Then, the D-type connector on the instrument rear
panel labelled "INTERFEROMETER" becomes accessible and the correct operation of the
power supply module can be checked by measuring the voltages -15/-5/+5/+16 Volts as
referred to ground. The permitted tolerance levels are ± 5 %. Fig. 4.1 shows the pin
assignment of the connector.
________________________
Man-Vib-OFV2200-1299-01e
4-4
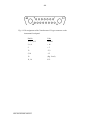
Fig. 4.1: Pin assignment of the "Interferometer" D-type connector on the
instrument's back panel.
Pin No.
Volts
1, 4, 7, 8, 15
Ground
3, 6, 9
+ 16
2
+5
13
- 5,2
5, 10
- 15
12
(Sig. Level)
11, 14
N.C.
________________________
Man-Vib-OFV2200-1299-01e
5-1
5 SPECIFICATIONS
5.1
GENERAL DATA / OPERATING CONDITIONS
Power requirements
Voltage:
100 / 115 / 230 VAC, + 10 %, 50/60 Hz; selectable on rear panel
Power cons.: max. 140 VA
Fuses:
2.5 A / 250 V time delay for 100 V or 115 V
1.25 A / 250 V time delay for 230 V
Environmental conditions
Operating temperature:
+5 °C to +40 °C (41 °F to 104 °F)
Storage temperature:
-5 °C to +60 °C (23 °F to 140 °F)
Rel. humidity:
max. 80 %, non-condensing
Dimensions:
450 mm x 360 mm x 135 mm (19" x 14" x 5.3")
Weight:
10.5 kg (controller only)
Protection class:
I (protective grounding)
Safety standards applied:
EN 60950 (IEC 950), DIN VDE 0805,
EN 61010 (IEC 1010)
Conforms to EMC standards
for emission:
for immunity:
________________________
Man-Vib-OFV2200-1299-01e
EN 55011 / EN 55022, Class B
(DIN VDE 0871 Class B, FCC Class B)
EN 50082-1
EN 50082-2
(IEC 801-1...-5)
5-2
5.2
Optical Sensor Head
Laser type:
Helium Neon
Laser wavelength:
633 nm
Cavity length:
205 mm
Laser output power/classification:
2.3 mW/ IIIb (USA IIIa)
System output power/classification
< 1mW / II
Meets laser safety requirements:
CFR 1040.10, BS 4803,
DIN VDE 0837, IEC 825
Environmental temperature:
+ 5 °C to + 40 °C
(41 °F to 104 °F)
Humidity
20 % to 80 %
Power requirements:
± 5 Volts, ± 15 V
as supplied by Polytec controller processors
Range of standoff distances
30 cm to 30 m
(depending on front lens used):
Dimensions (incl. front lens):
34.4 x 12.0 x 8.0
(13.5 x 4.7 x 3.2")
Weight:
Fig. 5.1: Dimensions OFV-303 (all dimensions in mm)
________________________
Man-Vib-OFV2200-1299-01e
3.5 kg
5-3
5.3
Velocity Decoder Specifications
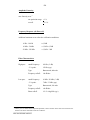
Measurement Ranges:
Range
Resolution1
Full Scale
Output
peak-to-peak
5 mm/s/V
25 mm/s/V
125 mm/s/V
100 mm/s
500 mm/s
2 500 mm/s
Max. Vibration Max.
Frequency
Acceleration
(-3 dB)
0.5 µm/s
2 µm/s
5 µm/s
250 kHz
250 kHz
250 kHz
8 000 g
25 000 g
200 000 g
Voltage Output:
Output swing:
+ 10 V
Output Impedance:
50 Ω
Min. load resistance:
10 kΩ (-0.5 % add. error)
Overrange indicator
threshold:
95 % of fullscale + 5 %
Calibration Accuracy:
+ 1.5 % of rms reading @T = (25 + 5) °C
+ 2.5 % of rms reading in full operating temperature range
Conditions:
sinusoidal vibration of frequency 1 kHz and amplitude
70 % of FSR
load resistance > 1 MΩ
1
Resolution is defined as the signal amplitude at which the signal-to-noise ratio is 0 dB in a 10 Hz spectral
resolution bandwidth.
________________________
Man-Vib-OFV2200-1299-01e
5-4
Amplitude Linearity:
max. linearity error 2
one particular range: + 1 %
overall:
+ 2.5 %
Frequency Response: (all filters off)
Additional maximum error referred to calibration conditions:
10 Hz - 10 kHz
± 0,2 dB
10 kHz - 50 kHz
+ 0,2 dB/- 0,5 dB
50 kHz - 250 kHz
+ 0,2 dB/- 3 dB
Filter Characteristics:
High-pass:
Low-pass:
2
cutoff frequency:
100 Hz (-3 dB)
- 5 % point:
150 Hz (typ.)
Type:
Butterworth, 4th order
Frequency rolloff:
-80 dB/dec.
cutoff frequency:
10 kHz / 50 kHz (-3 dB)
- 5 % point:
7 kHz / 33 kHz (typ.)
Type:
Butterworth, 3rd order
Frequency rolloff:
-60 dB/dec.
Phase rolloff:
-12/-2.4 deg/kHz (typ.)
Linearity error is defined as the amplitude-dependent, relative deviation of the scale factor referred to the
nominal scale factor calibrated at reference conditions.
________________________
Man-Vib-OFV2200-1299-01e
5-5
5.4
Displacement Decoder Specifications
Measurement
Range
µm/V
Full Scale Output
(Peak-to-Peak)
mm
0.5
2
8
20
80
1
Resolution
0.008
0.032
0.13
0.32
1.3
Calibration accuracy:
µm
Max. Vibration
Frequency
kHz
0.002
0.008
0.032
0.08
0.32
Max.
Velocity
m/s
25
75
75
250
250
0.06
0.25
1.0
1.6
1.6
+ 2 % of reading + 1 step (up to 100 kHz)
(1 step corresponds to the resolution limit of the
selected range)
Linearity error:
+ 2 steps
Output swing:
± 8 Volts
Output impedance:
50 Ω
Min. load resistance:
10 kΩ (0.5 % add. error)
Manual triggering is possible using the CLEAR button on the front panel.
Sychronized triggering is possible feeding TTL pulses to the related BNC connector.
Trigger (clear input):
1
Standard logic signal:
TTL
Trigger threshold:
+ 0.7 V (typ.). falling edge
max. input voltage:
+ 12 V
min. input voltage:
-7V
max. pulse rate:
50 kHz
min. pulse width:
10 µs
The resolution is defined as one digit of the fringe counter output.
________________________
Man-Vib-OFV2200-1299-01e
Appendix A: Size of Measurement Spot
The size of the laser beam generated on the surface of the test object is sufficiently
well defined by a simple "magnification" calculation. To calculate the image spot size
we must know
1) the object spot size
2) the lens focal length
3) the image distance.
The object spot size is in the case of fiber systems given by the core (mode field)
diameter and in the case of 302, 352, 303, 353 systems by the internally focused
spot size.
The focusing lens within the 300 series heads is identical to that used to launch the
laser beam into the fiber and produces roughly the same spot size, taken to be 5
microns in diameter.
The imaging lens is different depending on the system used and given by the table
below
Head Type
Focal Length
302 std
352 std
302 sv
501/2/8 std
OFV-100
303/353 std
303/353 long range
50 mm (Nikon)
50 mm (Nikon)
85 mm (Nikon)
16 mm (Polytec)
20 mm (Polytec)
60 mm (Polytec)
100 mm (Polytec)
The "image" distance is then given by the distance between lens and test object.
The spot size on the test object is then given approximately by
Dimage =
Im age dis tan ce
⋅ 5 µm
Object dis tan ce
in which we can roughly take object distance = focal length, provided the image
distance is much greater than the focal length. Assuming this is the case we can
define spot sizes per meter distance as follows:
303 std:
303 long range:
84 microns/meter
50 microns/meter
_____________________
Man-OFV-2200-9602-e01
5-2
500 series std:
OFV-100:
312 microns/meter
250 microns/meter
________________________
Man-Vib-OFV2200-1299-01e