1
Worksheet 2 – Descriptives:
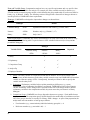
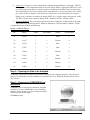
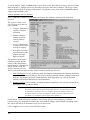
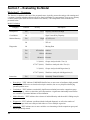
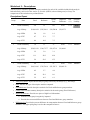
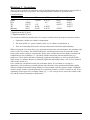
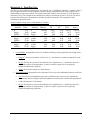
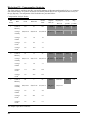
The Descriptives worksheet presents descriptive statistics for each of the variables included in the analysis
broken down by each level of the Analyze by Variable (SSEGs) selected during Analysis Setup. The
components of this worksheet are presented below:
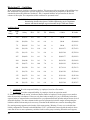
Descriptives Report
Group
Data
Focal
Reference
Grand
Total
Impacted/
Difference
Diff.
(%)
Potential
Liability
1
Count of Minority
276
87
363
Focal
17.16
High
$18,414.38
$22,230.11
$19,328.90
$3,815.73
Avg of PPA
2.0
1.8
1.9
Avg of TIC
4.7
17.1
7.7
Avg of TIJ
4.6
16.9
7.5
Count of Minority
14
13
27
Focal
6.51
Medium
$28,211.36
$30,175.77
$29,157.19
$1,964.41
Avg of PPA
3.2
3.0
3.1
Avg of TIC
11.1
28.2
19.4
Avg of TIJ
2.9
29.2
15.5
Count of Minority
80
7
87
Focal
33.61
Medium
$49,314.03
$74,279.14
$51,322.71
$24,965.12
Avg of PPA
4.2
5.7
4.4
Avg of TIC
6.8
28.1
8.6
Avg of TIJ
5.2
16.3
6.1
Avg of Salary
2
Avg of Salary
3
Avg of Salary
•
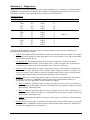
Analyze By/SSEG: Represents the analysis groups selected by the analyst (e.g., Job Group).
•
Data: Indicates the type of descriptive statistics computed.
•
Focal/Reference: Provide descriptive statistics for Focal and Reference group members.
•
Grand Total: Provides summary descriptive statistics for the entire group (Focal+Reference).
•
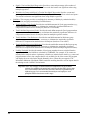
Impacted/Difference: Provides two pieces of high-level information:
•
o
Indicates which group is negatively impacted.
o
Provides the raw mean difference between Focal and Reference group members.
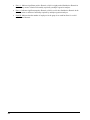
Difference (%): Provides the percent difference in compensation between Focal and Reference group
members. The higher paid group is used as the computed reference.
19