1
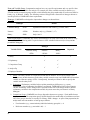
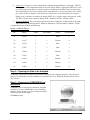
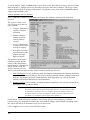
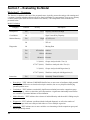
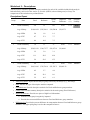
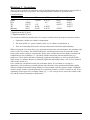
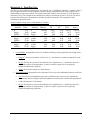
Results Summary
Category
Problem
Comp Analysis
Yes
Yes
Yes
Yes
No
No
Yes
Liabilities
•
Severity
Description
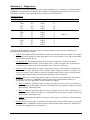
3 of 3 (100%) Signif. t-Test
477/477 (100%) Workforce in Groups with Signif. t-Test
Difference
2/3 (67%) Signif. Regression
390/477 (82%) Workforce in Groups with Signif. Regression
Difference
0/3 (0%) Non-Signif. t-Test but Signif. Regression
0/477 (0%) Workforce in Groups with Non-Signif. t-Test but
Signif. Regression Difference
1/3 (33%) Signif. t-Test but Non-Signif. Regression
Yes
87/477 (18%) Workforce in Groups with Non-Signif.
Regression but Signif. t-Test Difference
Yes
$2,694,480.55 Total Liabilities t-Test (Focal)
Yes
$1,348,823.71 Total Liabilities Regression (Focal)
No
$0.00 Total Liabilities t-Test (Reference)
Yes
$89,649.33 Total Liabilities Regression (Reference)
Yes
$11,027.23 Liability Excluded: N=10
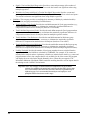
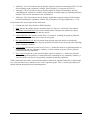
Comp Analysis: This section of the report provides several high-level perspectives on compensation
differences.
o
Signif. t-Test: Provides a count and percentage of SSEGs (e.g., job groups, job titles, etc.) that
exhibited significant pay disparities based upon t-Test results.
o
Workforce in Groups with Signif. t-Test Difference: Provides a count and percentage of the total
workforce in SSEGs with significant pay disparities based upon t-Test results.
o
Signif. Regression: Provides a count and percentage of the SSEGs that exhibited significant pay
disparities based upon multiple regression results.
o
Workforce in Groups with Signif. Regression Difference: Provides a count and percentage of the
total workforce in SSEGs with significant pay-disparities based upon multiple regression results.
o
Non-Signif. t-Test but Signif. Regression: Provides a count and percentage of the number of
SSEGs that were not-significant based upon t-Test results but became significant when using
multiple regression.
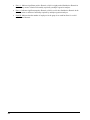
o
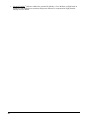
Workforce in Groups with Non-Signif. t-Test but Signif. Regression Difference: Provides a count
and percentage of the workforce in SSEGs where pay disparities were not significant when using
a t-Test but became significant when using multiple regression.
17