1
Worksheet 3 – Correlations:
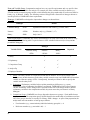
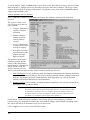
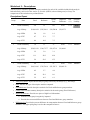
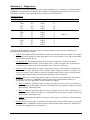
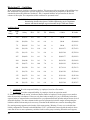
The Correlations worksheet is particularly useful for helping identify those factors that are most powerful in
explaining the company’s pay practices. The components of this worksheet are presented below:
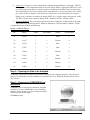
Correlation Report
Variable Name
Salary
Salary
-PPA
0.849**
TIC
0.217**
TIJ
0.062
Minority
0.034
Notes:
* Significant at the .05 level
** Significant at the .01 level
PPA
0.849**
-0.1*
-0.042
-0.091*
TIC
0.217**
0.1*
-0.902**
0.813**
TIJ
0.062
-0.042
0.902**
-0.856**
Minority
0.034
-0.091*
0.813**
0.856**
--
The correlation coefficients included in the Correlations worksheet allow the analyst to determine whether:
•
Explanatory variables are related to compensation;
•
The focal variable (i.e., gender, minority status, etc.) is related to compensation; or
•
There are relationships between the various predictors that could lead to multicollinearity.
When reviewing the Correlation Report, pay particular attention to the second column (to the immediate right
of the Variable List column). This column indicates the correlations between each factor and the variable
being used to measure employee compensation. Ideally, those variables that are most highly correlated with
compensation are the explanatory (i.e., job related) variables and not the protected characteristic (e.g.,
gender/race). Those factors that share a statistically significant relationship at p <0.05 are identified with a
single asterisk (*) and those that have a statistically significant relationship at the p <0.01 level are identified
with a double asterisk (**).
Next, examine the correlations between each of the other factors. If a correlation is very high (i.e.,
approaching 1.00), it indicates a potential problem with collinearity which would mean that both variables
cannot be included in the model without leading to serious problems with the regression model. COMPARE
includes specific measures of multicollinearity in a separate tab, but this is a useful visual tool as well. If two
explanatory factors appear to be too highly related (e.g., r > .80), it may be best to remove the variable of the
two with the weakest relationship to compensation
21