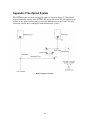
1
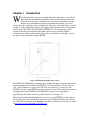
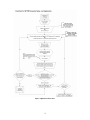
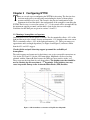
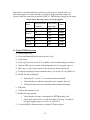
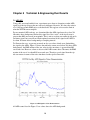
NATIONAL OPTICAL ASTRONOMY OBSERVATORY WIYN Consortium WTTM User Manual WI YN O B S E R V AT O R Y WTTM User Manual Last Updated: January 28, 2005 950 North Cherry Avenue Tucson, AZ 85719 Phone 520-318-8000 i Table of Contents Chapter 1 Introduction ..................................................................................................... 1 Chapter 2 Quick Start....................................................................................................... 3 Chapter 3 Configuring WTTM ........................................................................................ 5 3.1 Choosing a beamsplitter and aperture ....................................................................... 5 3.2 WTTM Filters and CCD Characteristics................................................................... 8 3.3 Guide Star Selection.................................................................................................. 9 3.4 WTTM Control Software & Parameters ................................................................. 11 3.5 Data Acquisition Computer..................................................................................... 16 3.6 APD Normalization................................................................................................. 16 Chapter 4 Observing ...................................................................................................... 17 4.1 Start of Night........................................................................................................... 17 4.2 Typical WTTM Observing...................................................................................... 18 4.3 Offsetting................................................................................................................. 19 4.4 End of Night ............................................................................................................ 19 Chapter 5 Technical & Engineering Run Results .......................................................... 20 5.1 APD S/N.................................................................................................................. 20 5.2 Ghost Images........................................................................................................... 21 5.3 Use WTTM Aperture #5 ......................................................................................... 21 5.4 Image Quality Limits .............................................................................................. 22 5.5 Improvements from Tip-Tilt ................................................................................... 22 5.6 Spend Time to Focus Properly................................................................................ 22 5.7 Stopping and Re-starting Acquisition ..................................................................... 22 5.8 WTTM Control Software Idiosyncrasies ................................................................ 23 5.9 Wind Buffeting........................................................................................................ 23 5.10 Turn the APDs off ................................................................................................. 23 5.11 Task and Update Frequencies ............................................................................... 23 Chapter 6 WTTM CCD Characteristics......................................................................... 24 Chapter 7 WTTM Performance ..................................................................................... 25 7.1 Typical Gains .......................................................................................................... 25 7.2 WTTM Throughput................................................................................................. 25 7.3 Radial Dependence.................................................................................................. 26 ii 7.4 Using Non-Recommended Parameters ................................................................... 27 Chapter 8 Data Handling ............................................................................................... 28 8.1 Media....................................................................................................................... 28 8.2 Taping Using IRAF................................................................................................. 28 8.3 Taping Using UNIX ................................................................................................ 29 8.4 Writing CDs and DVDs .......................................................................................... 29 8.5 Safe Taping ............................................................................................................. 29 8.6 Save The Bits .......................................................................................................... 29 Appendix 1 CLI Commands ......................................................................................... 30 Appendix 2 Photometry Demonstration ....................................................................... 31 Appendix 3 The Optical System ................................................................................... 34 iii Figures Figure 1 WTTM Image Quality Improvement.................................................................... 1 Figure 2 QuickStart Flowchart............................................................................................ 4 Figure 3 APD Count Rate as a function of Tip-Tilt Star Magnitude .................................. 5 Figure 4 85/15 Beam Splitter Transmission Function ........................................................ 6 Figure 5 95/5 Beam Splitter Transmission Function .......................................................... 7 Figure 6 Kron/Johnson Filter Transmission Curves ........................................................... 8 Figure 7 Sloan Filter Transmission Curves......................................................................... 9 Figure 8 APD Count Rate as a function of Tip-Tilt Star Magnitude ................................ 10 Figure 9 WIYN IAS Guide and Focus Star Fields............................................................ 11 Figure 10 Main Control GUI............................................................................................. 12 Figure 11 Error Sensor Control GUI................................................................................. 13 Figure 12 Feedback GUI ................................................................................................... 13 Figure 13 APD Signal to Noise Demonstration ................................................................ 20 Figure 14 Example Ghost Image of a 6th Magnitude Star................................................ 21 Figure 15 WTTM Image Quality Improvement................................................................ 25 Figure 16 Radial Dependence of WTTM FWHM ............................................................ 26 Figure 17 Optical Schematic ............................................................................................. 34 iv Tables Table 2-1 Recommended Tip-Tilt Parameters .................................................................... 3 Table 3-1 Aperture Number vs. Diameter........................................................................... 7 Table 3-2 Available Filter Data........................................................................................... 9 Table 3-3 GUI Names and Function ................................................................................. 12 Table 3-4 Recommended Tip-Tilt Parameters .................................................................. 15 Table 4-1 Dome Flat Lamp Settings for 85/15 Beamsplitter ............................................ 18 v Chapter 1 W Introduction hen the light from a star passes through the earth’s atmosphere, it is refracted many times by the turbulent atmosphere. This introduces image motion and distortion at the telescope. In addition, the telescope itself introduces image motion due to windshake and imperfect mechanical couplings to its drive motors, the dome, and other sources of vibrations. Exposures of an object that are several seconds or longer will be blurred due to the image motion introduced by the atmosphere and telescope. The WIYN Tip-Tilt Module (WTTM) is used to compensate for the motion of the image caused by the atmosphere and telescope vibrations. Higher resolution images than would normally be possible are often the result. Figure 1 shows the gains a user may obtain using the WTTM. Figure 1 WTTM Image Quality Improvement The WIYN Tip-Tilt Module is an optical and near-IR re-imaging system that utilizes fast tip-tilt compensation. The f/# for the WTTM is 7.43 which provides a field of view of 3.84 x 4.69 arcminutes at a plate scale of 0.1125 arcseconds per 13.5µm pixel. The WTTM is attached to the WIYN Instrument Adapter System (IAS) at the Nasmyth focus. Changing between the WTTM and the MiniMosaic imager is accomplished in approximately 30 seconds by moving a pick-off mirror (see Figure 17). This manual contains the information necessary to set up the WTTM in order to obtain the best images possible. Information on how to use the ARCON interface that controls the CCD itself is contained in the MiniMosaic manual available at the telescope or online at http://www.wiyn.org/minimo_27nov01.ps.gz. 1 Minimally, please read chapters 2-5 at least once prior to using WTTM. WTTM is not simply another imager and using WTTM is both a highly active and non-intuitive process. Reading the documentation will improve understanding of the instrument and decision making when choosing WTTM settings during the night. This manual is available online at http://www.wiyn.org/wttm/WTTM_manual.html . If you have further questions (after reading the manual) please contact Dr. Steve Howell ([email protected]), WIYN Telescope Scientist, or Eugene McDougall ([email protected]), instrument support. 2 Chapter 2 T Quick Start his section provides a minimal procedure for field acquisition and setup. The information provided below should be useful to new observers as well as those who have used the WTTM for a few nights and want a quick way to ensure that all of the necessary steps have been taken each time a new field is acquired. Resetting the focus and acquiring an IAS focus star at each field are considered essential to the optimal operation of the WTTM. It is highly recommended that an IAS guide star be obtained for each field in order to judge the native image quality, telescope tracking, wind buffeting, etc. Table 2-1 shows the recommended values for the X and Y milligains and the integral settings for a given task frequency. These values are all explained in detail in section 3.4.2. Figure 2 shows the acquisition process in the form of a flowchart for easy reference. Information on guide and focus star selection is given in section 3.3. Table 2-1 Recommended Tip-Tilt Parameters APD & DIO Tip/Tilt Integral Term Task Fq (Hz) X & Y Milligain Time Constant Gain 500 200 10 5 200 200 10 5 100 250-300 10 5 50 300 15 5 101 300 20 5 1 A task frequency of 10 Hz is not recommended. 3 Figure 2 QuickStart Flowchart 4 Chapter 3 T Configuring WTTM here are several steps to configuring the WTTM for observing. The first involves decisions made prior to an observing run including the choice of beamsplitter, aperture and filters to be used. The second is the physical configuration of the instrument itself and the third is the configuration of the computers controlling the WTTM. The first step is covered in sections 3.1 - 3.3, the second will be accomplished by the instrument support personnel, and the third is done by the observer each night. Guidelines for this third part are given in sections 3.4 and 3.5. 3.1 Choosing a beamsplitter and aperture Currently there are two beam splitters available. The first nominally reflects ~85% of the light incident on it to the science detector and transmits ~15% through to the error sensor. The 2nd nominally reflects ~95% of the light and transmits ~5%. These percentages are approximate and wavelength dependent (see Figure 4 and Figure 5) and more similar than the 85% and 95% suggest. Check with the assigned observing support personnel for availability of beamsplitters. The task frequency and count rate for the faintest stars to give acceptable corrections are 14.8 for the 85/15 and 13.5 for the 95/5 beamsplitter. Magnitudes are based on data obtained with the Johnson R filter because the APDs are most sensitive in the “red”. These represent the faint limit for each beamsplitter. The brightest star that should be used to calculate tip-tilt corrections is ~7th magnitude. Using brighter stars may cause irreparable damage to the Avalanche Photo Diode (APD) modules. Figure 3 APD Count Rate as a function of Tip-Tilt Star Magnitude 5 Figure 3 shows the relationship between R-band stellar magnitude and APD count rate per second. Note that the count rate shown on the graph is given for 1 Hz task frequency and should be scaled to make sure that for the task rate and star brightness selected there are at least 35 counts above background per sampling interval. Figure 4 and Figure 5 show the transmission functions of the beam splitters as a function of wavelength. The discontinuity at ~8600Å is not a characteristic of the beam splitters, but of the measurement process. The APD response (not shown) is <10% below 4200Å increasing through 45% at 5500Å to 70% at 7000Å. The response above 10000Å is <15%. Figure 4 85/15 Beam Splitter Transmission Function 6 Figure 5 95/5 Beam Splitter Transmission Function The WTTM has a number of apertures from which to choose. It is recommended that aperture 5 be used. This aperture blocks most of the ambient sky light while allowing for a reasonable amount of movement of the starlight relative to the error sensor position before vignetting occurs. The Aperture/pupil is positioned between the beamsplitter and the APD array – it is not in the science beam (see Figure 17). Table 3-1 Aperture Number vs. Diameter Aperture Number Aperture Diameter 1 0.5” 2 0.707” 3 1.00” 4 1.414” 5 2.00” 6 2.83” 7 3.2 WTTM Filters and CCD Characteristics The filters are 2x2 inches square and 5mm thick. The thickness is extremely important due to the need to conjugate the error sensor with the science detector. Filters are only in the science beam and must have a uniform, known optical thickness (see Figure 17). Because the filters are not all exactly the same optical thickness there are small focus offsets between them, as shown in Table 3-2 Available Filter Data. The bandpass characteristics of the WTTM filters are shown in Figure 6 and Figure 7. Note: If filters with thickness differing from 5mm are used then, in order to bring the science image into focus, the telescope secondary will need to be positioned such that the tip-tilt star is no longer in optimal focus on the APD array. This will result in errors in the tip-tilt solution of unknown magnitude with unknown effect on the science images. Filters up to 6mm thick have been used and appear to work reasonably well. The CCD quantum efficiency is over-plotted on the filter transmission curves in Figure 6 and Figure 7. These figures can be used to determine the most efficient regions to use the WTTM and help planning the length of exposures necessary for acceptable SNR for a particular filter. See also section 7.2 and Appendix 1 for more detailed information on the WTTM throughput. Figure 6 Kron/Johnson Filter Transmission Curves 8 Figure 7 Sloan Filter Transmission Curves Table 3-2 Available Filter Data Filter Number Filter Name Focus Offset Filter Thickness P (mm) 1 Kron B +10±5 5.105 2 Kron V -10±5 5.055 3 Johnson R Reference1 5.029 4 Kron I 0±2 4.902 5 Sloan g´ 0±10 4.902 6 Sloan r´ 0±10 4.953 7 Sloan i´ 0±10 5.055 8 Sloan z´ 0±5 5.131 The Johnson R filter is the reference filter for the WTTM. Its focus is – PWR– PZLWKUHVSHFWWR MiniMosaic with the Harris R. 1 3.3 Guide Star Selection Telescope guiding is required to provide the full dynamic range of tip-tilt correction. Without guiding, the tip-tilt of the mirror will remove tracking errors by compensating 9 with tip and/or tilt. This can lead to the tip-tilt mirror moving to a limit in one or both of the tip-tilt axes. Telescope guide signals can be generated by WTTM itself (preferred) or by the IAS guide probe. These corrections are on a much longer time scale (~1-5 seconds) than the tip-tilt corrections. In general a guide period of 5 seconds should be used. However, the observer may modify this based on observing conditions and the observed behavior of the telescope. The user and telescope operator must communicate whenever a change in guiding is desired or necessary. Figure 8 APD Count Rate as a function of Tip-Tilt Star Magnitude Figure 8 (identical to Figure 3 but repeated for clarity) shows the approximate number of counts that the WTTM APDs will record for a given magnitude of guide star. Also plotted are the faintest recommended magnitudes of tip-tilt star that allow the WTTM to run properly at 50 and 100 Hz. It is recommended that both an IAS focus star and an IAS guide star be acquired for any field which will be observed for more than 10 minutes. Sustained observations (>10 minutes) using WTTM without a focus-star will not yield optimal results. Defocus of +/10um will normally negate the majority and possibly all of the improvement provided by the WTTM. The IAS guide-star provides important real-time feedback on seeing conditions, reference position, wind buffeting, defocus and sky conditions (cloudiness). It will save time to use the information provided by Figure 8 and Figure 9 to pre-select guide and focus stars and give that information to the WIYN OA when acquiring a new 10 field. This information could be included in the comment field when submitting coordinate caches. Figure 9 WIYN IAS Guide and Focus Star Fields Figure 9 shows the positions, relative to the WTTM Field of View, where the IAS focus and guide probes can be used to acquire stars for autofocus and qualitative analysis of image quality, sky conditions, etc. 3.4 WTTM Control Software & Parameters Full operation of the WTTM requires the observer to use three computers called sand, wiyn-wttm and navajo. Sand is the computer used for MiniMosaic observing and serves only as a display console for both wiyn-wttm and navajo. Wiyn-wttm is the computer that communicates with and is used to control the WTTM. Navajo serves as the data acquisition computer that runs the ARCON CCD control system. Information on how to use the ARCON interface is available in the MiniMosaic manual. 11 3.4.1 WTTM Control Software Three GUIs are used to control the WTTM. A command line interface (CLI) is also available, but is generally only used to turn the APD power on and off. Table 3-3 GUI Names and Function Labview Module Purpose/Function WttmControlVI Controls WTTM acquisition parameters wttmGetTaskValuesVI Provides visual plots XyManVI Controls the position of the error sensor Figure 10 Main Control GUI 12 Figure 11 Error Sensor Control GUI Figure 12 Feedback GUI 13 The procedure used to start the GUIs follows. 1. Log in to sand The first task is to start up the Tip-tilt software on wiyn-wttm and have the GUI’s displayed on sand. Start by logging onto sand as “wiyn_ccd” . The password should be the normal mountain observer password and should be posted on the monitor. 2. Export the wiyn-wttm display to sand Once logged in, open a new terminal by clicking the right mouse button anywhere on the screen and choosing the “Unix Xgterm” menu item. In this terminal window, type: wiyn_ccd@sand% ssh wttm@wiyn-wttm the password is once again the normal mountain observer password. At this point any commands that would normally bring up X-windows clients will display on sand. 3. Start the GUIs In the terminal window, which now has a [wttm@wiyn-wttm wttm]$ prompt, type: [wttm@wiyn-wttm wttm]$ wlv-sand start This will start the WTTM Labview software that enables the user to control the operation of the tip-tilt module. This terminal window now functions as the CLI for the WTTM. A few status messages will appear followed by a list of low-level commands. See Appendix 1 for frequently used CLI commands. Three GUIs with titles: wttmControlVI, wttmGetTaskValuesVI and xyManVI will then appear on sand’s monitors. The control system is a complex interaction between software, I/O, hardware, and the user interface. If problems occur, such as the GUIs not updating, the GUIs becoming unresponsive, or the system behaves in an unexpected manner, stop the WTTM control software (wlv-sand stop) and restart (wlv-sand start). 3.4.2 WTTM Control Parameters There is no quantitative measurement indicating the level of delivered image quality (DIQ) improvement being provided by the WTTM. In other words, with the tip-tilt corrections on, there is no metric provided to the user that would indicate what the uncorrected seeing would be in real-time. There are several values that can be used to qualitatively judge the performance of the WTTM. The easiest values to utilize are Xerror and Yerror (See Figure 12). These values will have some noise associated with them, but the amount of scatter in these terms should be as small as possible. Use of the range of values for the WTTM parameters given in this manual will cause the WTTM to deliver RIWKHLPSURYHPHQWVWKDWLWLVDEOHWRSURYLGH7KH:770 parameters that the user should consider adjusting are: 14 1. Choice of “Tip-Tilt” star – This is not really a WTTM parameter but is probably the most important factor because it influences the possible choices for all other parameters. The star should be chosen to be bright enough to use a relatively rapid tip-tilt task frequency. The star should also be as close to the science object as possible. A star between 10th and 14th magnitude has been found to be optimal, while fainter stars may be used (see Figure 8). 2. Task Frequency – This is how often the APDs are read out and tip-tilt corrections applied. The optimal value is the highest frequency that gives a sufficient number of counts above background per sampling interval. Approximately 30-40 counts above background is the minimum to provide full tip-tilt improvements. The number of counts is inversely proportional to the task frequency. 3. X and Y milligains – See Table 3-4 Recommended Tip-Tilt Parameters for the recommended values of X and Y milligains. These values represent the amount of correction applied for any single calculation of the tip-tilt error. For example: if the system were perfect, the Task frequency set to 500 Hz and the milligains set to 200, then if an image deviated from its nominal position by 1 arcsecond the tip-tilt system would move the image back 0.2 arcseconds toward its nominal position in 0.002 seconds. 4. Integral Term – This term basically accelerates the correction provided by the system in the case where multiple corrections are being done for a single excursion. A “ gain only” system provides poor response to large excursions of the tip-tilt star and the integral term improves the performance of the WTTM in this case. Table 3-4 Recommended Tip-Tilt Parameters APD & DIO Tip/Tilt Integral Term Task Fq (Hz) X & Y Milligain Time Constant Gain 500 200 10 5 200 200 10 5 100 250-300 10 5 50 300 15 5 300 20 5 101 1 A task frequency of 10 Hz is not recommended. The recommended values for the tip-tilt parameters (shown in Table 3-4 above) will provide RIWKHSRVVLEOHJDLQWKDWWKH:770FDQDFKLHYHLQPRVWFRQGLWLRQV Observers may use values outside of the recommended settings, but this is advised against (unless they have extensive experience using WTTM) and is done at their own risk. Before changing to a set of non-standard parameters please consult section 7.4 and your observing support person. 15 3.5 Data Acquisition Computer The data acquisition takes place on navajo. Access to navajo is through a vncviewer. The observing support personnel will instruct the observer on vncviewer use and the observing associate operating the telescope will be able to assist the observer if any difficulties occur. Along with various ARCON windows, an IRAF Data Acquisition Window will be available. Right click and (Re)start ARCON from the background menu if it is not already running. In order to bring the ARCON software up the user will be asked if they want to synchronize parameters (the answer to this is yes) and what filter is in wheel 1 (the answer to this is the “ short” name of the filter in position 1). The “ long” and “ short” filter names should be posted on sand’s monitor. Information on the ARCON interface is available in the MiniMosaic manual. Note 1: To display images an Ximtool or DS9 may be started on sand using the correct background menu item. Note 2: A Data Capture Agent (DCA) must be running in order to acquire data. The DCA must know which computer should be receiving the data. Therefore, it is important that the correct menu item is used to start up the DCA on sand. 3.6 APD Normalization The procedure below is used to normalize the counts acquired from the 4 APD modules given a uniform light source. This is important because if one of the APD channels is reporting higher counts for the same number of photons it will cause the centroid used by the tip-tilt calculations to be biased. Observing support will use the following procedure to ensure that the APDs are responding uniformly. If the procedure needs to be repeated during an observing run please consult with observing support. Setup on flat field with High Lamps at 750 – Domeflat GUI – APDs OFF Set x-y position to 1100/1100 x-y pixel or ~20,000/20,000 encoder units – xyManVI GUI Set all APD milligains to 1000 – wttmControl GUI Turn APD power on. In the CLI: wttm_pwr apd on Begin acquisition Run the script NormalizeAPDs in a CLI window This will produce 5 columns of numbers. The first is a counter and the other four are the average counts recorded per time interval by each of the APDs. These will be referred to as APD0_count, APD1_count, APD2_count and APD3_count. 7. Obtain 100+ points (cntl-c to stop) 8. Calculate the mean of the 4 APD count values on the last line of output from the script. This value is the APD_Mean. 9. Normalization constant for APD# is: APD_Mean*1000/APD#_counts 10. Enter the calculated normalization constants into the wttmControlVI GUI, click on Update 11. Record these values 1. 2. 3. 4. 5. 6. Typical values for the normalization constants range between 700 and 1500. The average of the four normalization constants should be close to, but generally not equal to, 1000. 16 Chapter 4 T Observing his chapter explains how to set up, take observations and then shut down the system on a normal observing night. The procedure for setting up on an object is slightly more complicated than it normally is for an imager. The full procedure is detailed below. One major difference is the need to focus the telescope (as one normally would), then set up the tip-tilt star for each new object and finally take a second “ fine” focus to ensure best focus. The WTTM provides telescope guide signals and this must be set up each time a new object is acquired. The acquisition of data is slightly different from the regular WIYN imager because the data is stored on sand while the CCD control (ARCON) is run from navajo. The data acquired cannot be accessed from the data acquisition window. Any manipulation or reduction of the data must be done using an IRAF Data Reduction window on sand. 4.1 Start of Night At the start of each night there are several steps to be accomplished prior to observing. There are two major categories involved in this setup: computer setup and instrument testing and calibration. The computer setup consists of logging into wiyn-wttm via sand, opening the vncviewer to navajo and making sure that the proper software is running on each. To bring up the GUIs for controlling the WTTM log into sand as “ wiyn_ccd” , bring up an xterm using the background menu, ssh to wiyn-wttm as “ wttm” and do a wlv-sand start to bring up the GUIs on sand (see section 3.4.1 for more detail). There should be a background menu item to open the vncviewer to navajo. A DCA and image viewer should be opened on sand. The systems should be tested to ensure that they are running properly. Starting the acquisition using the WTTM control GUIs and turning on power to the APDs one should be able to see some random noise coming from the APDs. Taking a “ zero” one should be able to discern whether the ARCON system is acquiring, reading out and displaying data properly. Instrument testing consists of taking dome flats through two or three filters to check that the filter wheel moves, the shutter opens and closes and that the WTTM slide can be inserted and retracted. The WTTM slide needs to be “ in” to direct light from the tertiary mirror to the WTTM. Other calibration frames include zeros, dome and sky flats. In order to take biases one should make sure that lights in the dome are turned off as small light leaks exist that will effect the exposures. To take dome flats the mirror covers will have to be opened, either by the observing assistant or the daytime technical support. The observer can then open the Dome flat GUI on either sand or navajo using the background menu, insert the WTTM slide and adjust the flat lamps to their proper intensity (see Table 4-1). Please ensure that the APD power is turned off while doing dome flats. There is no reason to have them on and high light levels can cause the modules to self-destruct. 17 Dome flats are recommended, but it will be up to the observer, with the advise of observing support, to decide if sky flats are required. Suggested lamp settings and exposure times for dome flats are listed in Table 4-1. The flat lamp settings are not linear. Table 4-1 Dome Flat Lamp Settings for 85/15 Beamsplitter Filter Exposure Time Lamp Setting Counts (seconds) (high lamps) 5 2500 22,000 10 1630 30,000 5 1750 21,000 Johnson R 3 1500 24,500 Kron I 4 1000 23,000 Sloan z´ 5 900 20,000 Kron B Kron V 4.2 Typical WTTM Observing a) Slew to target (OA) b) Select and obtain IAS guide and focus stars (OA) c) Focus frame d) Select tip-tilt star to be used. X,Y coordinates may be found using mscexamine. e) Turn on APDs (get an estimate of the background level) (wttm_pwr apd on) f) Move the x-y stage to the position of the tip-tilt star (check signal level) g) Set tip-tilt and integral terms to nominal values (see section 3.4.2 and Table 3-4) h) Enable Tip-Tilt and Integral • Verify that Xerror and Yerror are small and centered around 0 • Verify that there is sufficient signal above the estimated sky level • Verify that count levels are reasonably balanced between channels i) Fine focus j) Lock on IAS autofocus (OA) k) Enable telescope guiding • Verify that the telescope is configured for WTTM guiding (OA) • Set the guider interval to 5 seconds for regular observing, 1 second for telescope jogging using x-y sensor (see section 4.3) l) Use the ARCON software interface to obtain CCD observations 18 When finished with the current target: m) Stop acquisition (turns off all WTTM functions but keeps APD power on) n) Reset Tip-Tilt mirror (Main control GUI button) o) Turn off APD power (wttm_pwr apd off) p) Slew to new target (back to (a) or end the WTTM session) 4.3 Offsetting There are two ways to accomplish telescope offsets when using the WTTM. Assuming the system is running (tip-tilt corrections and WTTM guiding are enabled) and the offset desired is on the order of 2-3 arcseconds, the easiest way to offset the telescope is by moving the x-y stage and letting the WTTM guiding ‘drag’ the telescope to the new position. For larger offsets the following steps should be executed. 1. Stop acquisition and have the OA offset the telescope 2. Reset tip-tilt mirror (Main control GUI button) 3. Move the x-y sensor to the new position 4. Set the X and Y milligains to zero 5. Restart acquisition and check for counts 6. Reset X and Y milligains to non-zero values 7. Observe Either type of offset may be accomplished during the CCD readout. 4.4 End of Night At the end of the night’s observing one should shutdown the WTTM and the computer systems as gracefully as possible. This will make starting up again the next night less prone to problems. To end the night shutdown ARCON using the background menu on navajo. Once this process has completed the observer can close the vncviewer to navajo. In the CLI window on sand/wiyn-wttm turn off the APD power (wttm_pwr apd off) and then type in wlv-sand stop. This should kill all the GUI windows on sand that control the WTTM. One can then exit the ssh session and log out of sand. 19 Chapter 5 Technical & Engineering Run Results 5.1 APD S/N Using a 0.5 arcsecond artificial star, experiments were done to determine at what APD signal level the tip-tilt error become adversely influenced by noise. We chose the criteria of +/- 0.05 arcseconds RMS noise as the threshold. This appears to be near the limit of what the WTTM can accomplish. For any nominal APD task rate, we determined that the APD signal must be at least 3040 counts above background. Below this signal level, the “ noise” of the tip-tilt error is greater than 0.05 arcseconds in magnitude. This is not to say that you cannot tip-tilt guide on fainter signal, but you will not obtain optimal corrections if the signal at the APDs is less than 30 counts above background per sampling interval. To illustrate the case, we present an actual on-sky case where clouds were diminishing the signal to the APDs. Figure 13 shows that when the counts were below 30 (above APD background), the RMS motion of the star, after tip-tilt corrections, is greater than 0.05 arcseconds rms. However, when we observed the APD counts above 30 counts, the RMS motion of the star is less than 0.05 arcseconds rms. Therefore, good signal from the tiptilt star matters in terms of the noise introduced to the tip-tilt corrections. Figure 13 APD Signal to Noise Demonstration All APD counts listed in Figure 13 are values above the APD background. 20 5.2 Ghost Images Stars of magnitude VKRZDJKRVWLPDJHLQUHODWLYHO\VKRUWH[SRVXUHVaVHFRQGV due to internal reflections in the WTTM. An illustration of this is shown in Figure 14. The ghost image always shows up ~475 pixels from the “ real” image in the positive x direction. This corresponds to ~ 53” east of the “ real” image. Figure 14 Example Ghost Image of a 6th Magnitude Star 5.3 Use WTTM Aperture #5 The WTTM apertures are used to limit the amount of sky signal passed to the APDs. We have used the #4 and #5 setting extensively, but have found the #5 optimal. The advantage of this aperture is that it allows larger motions of the star without losing signal. For lower aperture settings, the WTTM guiding is less able to respond to large excursions, and the star may be lost. See Table 3-1 for a listing of all available apertures. 21 5.4 Image Quality Limits When the seeing is greater than about 1-1.2 arcseconds FWHM, WTTM offers little benefit in most cases. Image motion that is a result of wind buffeting of the telescope might be the exception. At WIYN, we have never observed sustained seeing measuring < 0.3 arcseconds in the Ror I-bands with or without the WTTM. 5.5 Improvements from Tip-Tilt Improvements obtained using WTTM depend on many factors: wind buffeting, atmospheric turbulence, local telescope/dome induced seeing and others. How one chooses to quantify the improvement obtained will depend on the type of science to be performed. Therefore, improvements in FWHM may not always be the appropriate metric, however it is the metric used for many of the results/recommendations presented in this manual. As a general rule, WTTM will provide FWHM improvements of 10-15% (V- R- and Ibands). However, we have seen entire nights, and periods within a night, where WTTM provided no improvement to the FWHM and other times when the improvement was up to 0.3-0.4 arcseconds. If the DIQ of the telescope is 0.6 arcseconds, R-band, one can assume that WTTM will likely provide 0.45-0.5 arcseconds FWHM in R, but that improvement is not guaranteed. This is illustrated in Chapter 7. Using WTTM provides the opportunity to obtain the best DIQ delivered by the telescope, but it will not guarantee a specific FWHM value. 5.6 Spend Time to Focus Properly Focus regularly to ensure defocus does not negate gains in using tip-tilt guiding. At WIYN, defocus of 10µm matters and will degrade the image quality on the order of 0.1 arcseconds. This approximately equals the amount of improvement to the image quality provided by using tip-tilt, therefore, if the telescope is PRXWRIIRFXVDOORIWKH improvement being achieved by the WTTM is being lost. 5.7 Stopping and Re-starting Acquisition If one halts acquisition, for example due to clouds, it is best to disable the tip-tilt and integral terms before turning the acquisition back on. Verify that the tip-tilt star is still being detected by the APDs before trying to re-start tip-tilt corrections. If the tip-tilt corrections are enabled while there is no tip-tilt star being detected the result is highly unpredictable with the worst case requiring a complete system reboot. 22 5.8 WTTM Control Software Idiosyncrasies The control software can get into some bizarre states, especially if the proper procedures for field acquisition are not followed, or when control GUIs are exited incorrectly. We plan to find procedures to recover, but for now we recommend that you simply stop and re-start the control system (wlv-sand stop/start). This will often provide the quickest recovery. In extreme cases, a reboot of the wiyn-wttm computer will be necessary, but consult the OA or observing support person before doing so. 5.9 Wind Buffeting In most cases, WTTM can handle wind buffeting of the telescope. However, when the image motion is as large as the WTTM aperture, typically 2 arcseconds, the WTTM guide star will likely be lost. In such cases one needs to either point to a different object (in another part of the sky) or wait for the wind buffeting to subside before continuing to observe with the WTTM. 5.10 Turn the APDs off Always turn the APDs off when the system is not in use. This is especially important if the dome and/or telescope area will be exposed to bright light, for example the flat field lamps. The maximum allowed count rate is 1e6 counts/second, but we strongly recommend that the count rate be kept far below this level (1e5 counts/second). The APD modules will burn up if left on while light levels are too high. This means that the brightest tip-tilt star should be approximately 7th to 8th magnitude. Remember that a star this bright will create a ghost image. 5.10.1 Slewing Always stop acquisition and turn off the APDs when slewing to a new field. The APD modules will burn up if left on while light levels are too high. 5.11 Task and Update Frequencies The Task frequency is the rate that APD modules are read out and corrections are sent to the Tip-Tilt mirror. The update frequency is the rate that the telemetry is updated on the GUIs. The update frequency must be less than the task frequency or the GUIs will hang and/or crash. The recommended rate for the “ update frequency” is 10 Hz. 23 Chapter 6 T WTTM CCD Characteristics he camera consists of a 2k x 4k EEV device mounted in a Kitt Peak universal dewar. The dewar is mounted on an extension to the existing IAS. The WTTM CCD characteristics are given below. The CCD is an engineering grade device and has some flaws. There are several hot pixels and columns. One of the pixels looks very similar to a star (especially in focus frames). There is also a gradient in the dark current. In a 1000 second dark exposure there is a difference of approximately 7-10 ADUs from line 0 to line 2500 when plotting a column. We hope to upgrade the CCD in the near future. The basic CCD parameters are: 13.5µm pixels @ 0.1125 arcseconds/pixel FOV = 3.84 x 4.69 arcminutes – vignetted at corners 2048x2500 pixels readout @ 16 bits/pixel Image size (with header) ~10.58 Mbytes readout time = 2.6 minutes read noise = 4.5egain = 1.3e-/ADU CCD is linear to 84,000 e- (64615 ADUs) at 0.1% plate scale = 8.53” /mm Please refer to the MiniMosaic imager manual for instructions on how to acquire data using the ARCON control software. 24 Chapter 7 WTTM Performance 7.1 Typical Gains Figure 15 shows that the typical image quality at the WIYN telescope is approximately 0.65-0.75” . In this regime much of the data collected shows that there can be a 0.1-0.15” improvement in the FWHM. This is not guaranteed. There have been periods of time within nights and even complete nights where the WTTM has provided no gain over images obtained without the WTTM. As stated in section 5.4 when the native seeing is -1.2” or <0.35” there will normally be no gain obtained by using the WTTM. Figure 15 WTTM Image Quality Improvement 7.2 WTTM Throughput The throughput of the WTTM is always going to be less than that of a comparable imager attached directly to the WIYN port. This is due to the loss of light at the 5 mirrors and beamsplitter in the WTTM. When compared to the MiniMosaic imager the throughput of the WTTM in the B-band is 0.78, V-band is 0.69, R-band is 0.47 and I-band is 0.57 with the 85/15 beamsplitter installed. 25 These numbers are based on the stellar photometry presented in Appendix 2 and include the effect of the extra reflection to get the light into WTTM, as well as the reflections within the WTTM. They also reflect any passband and filter throughput differences. Because the WTTM should reduce the blurring effects produced by the atmosphere and telescope motion, some of this throughput loss should be recovered when calculating signal to noise. However, it is anticipated that most of the projects using the WTTM will be more concerned with improved resolution than signal to noise. 7.3 Radial Dependence The WTTM correction is based on the principle that light from stars close together in the sky passes through basically the same atmosphere. Therefore, we measure the motion of one star in an imaging field and correct the entire image based on that measurement. Because every star’ s light travels through a slightly different portion of the atmosphere there is some inherent error in this process. It is logical to assume that the error has some dependence on the amount of separation between the tip-tilt star and any sources of interest – their radial distance. The amount of this error at any one time is impossible to calculate due to the changeable nature of the atmosphere. The error will also generally not be entirely symmetric, however, Figure 16 shows that this error is generally small over the FOV of the instrument. At worst a 0.05” degradation can be seen if the tip-tilt star and the object are at opposite corners of the WTTM CCD field. Figure 16 Radial Dependence of WTTM FWHM 26 7.4 Using Non-Recommended Parameters As stated in section 3.4.2 the WTTM does not provide direct feedback to tell the user the amount of improvement in image quality being provided. Adjustments in the parameters are therefore ‘blind’ and can only be partially confirmed by obtaining exposures with the tip-tilt on and off. Taking such exposures requires a high overhead in CCD readout and is therefore not typically recommended. When deviating from the recommended WTTM parameters you are doing so at your own risk. We have learned that it is generally best to sample and correct as fast as one can. However, there is limited freedom choosing the guide star (it must be in the field of view of the CCD). Often one is trying to achieve a balance between good signal above background (minimally 30-40 counts above background) and a high sampling rate. The user will normally need a 14th magnitude tip-tilt star or brighter to fully optimize both signal and sampling. There are two cases where the user will be tempted to use parameters outside of those recommended. The first is when a very bright star is available and/or must be used and the second is when a relatively faint star must be used. In the first case adjust the sampling/correction rates to a higher value while keeping the signal at or above 30-40 counts above background. This ensures adequate signal and the fastest possible sampling. The highest frequency to sample and correct with is 1000 Hz. In the second case (faint star) adjust the sampling frequency to smaller values. The signal to noise limit to achieve any reliable corrections is 10 counts above background and the recommended minimum sampling rate is 50Hz. As the sampling rate is decreased the user must raise the x and y milligains (see Table 3-4). Some improvement in image quality can be achieved at lower rates, but the correction will only be for coherent image motion such as that caused by windshake. It is unlikely that any ‘true’ tip-tilt improvements will be achieved with rates slower than 50Hz. As stated in section 3.4.2 the Xerror and Yerror plots on the WTTM control GUI may be examined to try and optimize the parameters by minimizing the scatter in the Xerror and Yerror values. 27 Chapter 8 R Data Handling ight now there are no portable storage media available on navajo, therefore, the data is kept on sand. Exabyte and DAT tapes, as well as CDs and DVDs are available. 8.1 Media The types of data storage media available at WIYN are: • DAT – DDS 2/3/4. • Exabyte • CD – ~60 images/CD. • DVD You can take your data home on CDs, but be forewarned, you will need about 4-5 CDs per night of observing. They hold only about 650 Mbytes of data (~60 10.58Mb images). 8.2 Taping Using IRAF On sand mta is the Exabyte and mtb is the DAT drive. The DAT supports DDS-4 densities (20 Gbytes per tape). The DAT on sand is internal to the tower box while the Exabyte is external. Because of the multi-extension format of WTTM data (although actually it is only a single CCD with one amplifier), you must use the IRAF mscwfits and mscrfits commands. To use the DAT drive type: cl> allocate mtb from sand. In order to check to see what is on the tape, you can list the titles in an IRAF window on sand by typing: cl> mscrfits mtb 1-999 list+ short+ original+ To direct this output into a file, you can add a >tapelist to the end, and then you can print that list on the lineprinter using lprint tapelist. NOTE: If you write additional files to an “ old tape” (one containing useful data but which had previously been removed from the drive) make certain that the software (IRAF and UNIX) is aware that the tape has been rewound before starting to write new data or your old data may be overwritten! To safeguard against this possibility we suggest that you ALWAYS swap tapes by first: cl>deallocate mtb Physically swap tapes. cl>allocate mtb To use the exabyte tape drive substitute mta for mtb in the procedure listed above. 28 8.3 Taping Using UNIX If one is using UNIX commands such as mt and tar in order to archive data from sand the DAT drive’ s designation is /dev/st1 and the Exabyte drive is /dev/st0. 8.4 Writing CDs and DVDs There are detailed instructions for writing CDs available at: http://www.wiyn.org/cd_write.html and for DVDs at: http://www.wiyn.org/WIYN-dvd-instructions.html. 8.5 Safe Taping We recommend the following “ safe taping” procedures. 1) Each night write data to tape. 2) Read the tape: cl> mscrfits mtb list+ to substantiate everything is there. 3) Deallocate the drive, remove the tape, and stick it under your pillow. 4) Make a second copy of your tape. (This tape could be a cumulative copy of the data throughout your run.) Check this tape with mscrfits! 8.6 Save The Bits All data taken at WIYN (and the other Kitt Peak telescopes) are automatically saved to tape. Extracting a night’ s worth of data from these tapes is extremely labor-intensive, and we strongly emphasize the need for the “ safe taping” procedures in section 8.5. But, if you ever do need to recover a night’ s worth of data, take heart! You can send email to [email protected] . 29 Appendix 1 CLI Commands T he Command Line Interface, or CLI, is the terminal window that the observer uses to start the GUIs that control the WTTM. The CLI can be used to give various commands directly to the WTTM. Currently the commands the observer needs to know and input to the CLI are: wlv-sand start wlv-sand stop – start the GUIs – exit the GUIs wttm_pwr apd on – turns the APD power on wttm_pwr apd off – turns the APD power off The first two are scripts that use lower level commands to correctly start and display the control GUIs so that they are easily accessible. When the observer first starts the control GUIs a list of other possible commands is shown in the CLI window. Most of these are only used when troubleshooting the system and should not be used except at the direction of support personnel. 30 Appendix 2 Photometry Demonstration September, 2003 Contributed by: Abi Saha On the night of UT 030516, several Landolt standard fields were observed with the WTTM, in the B,V,R,I passbands. The 85/15 beam splitter was in use. The standard star observations were processed in the usual way, and photometric solutions were obtained for this night, solving for atmospheric extinction, as well as color terms. Let bp, vp, rp and ip be the instrumental magnitudes in the B,V,R, and I pass bands respectively. These are of the form: xp = -2.5 ⋅ Log10(DN) + 30.00 where DN is count rate from a star in Data numbers, analog to digital units in passband x then, we can write: ΜTrue= xp C0 C1&airmass C2Dp where ΜTrue is the true magnitude, xp is the instrumental magnitudes, C0 the zero-point constants, &the airmass, and Dp the instrument color terms, like vp-ip, vp-rp, etc. 31 The solution for the night of UT030516 are then the coeffs C0, C1, and C2 which were determined for all filters and all possible color combinations. The full solution is given immediately below: UT 030516 WTTM 85/15 beam splitter Passband Dp C0 C1 C2 Rmsres Errmean V bp-vp -4.548 -0.178 -0.148 0.012 0.003 V vp-rp -4.593 -0.170 -0.176 0.021 0.005 V vp-ip -4.603 -0.193 -0.089 0.020 0.005 B bp-vp -4.434 -0.386 0.208 0.019 0.005 B bp-rp -4.418 -0.379 0.109 0.022 0.006 B bp-ip -4.387 -0.371 0.076 0.021 0.005 R bp-rp -4.889 -0.016 -0.053 0.017 0.005 R vp-rp -4.902 -0.016 -0.115 0.017 0.005 R rp-ip -4.920 -0.043 -0.117 0.018 0.005 I vp-ip -5.338 -0.107 -0.019 0.011 0.003 I bp-ip -5.334 -0.106 -0.012 0.011 0.003 I rp-ip -5.362 -0.097 -0.041 0.011 0.003 RMS residuals are 0.02 magnitudes or less, which is typical of a clear (but not pristine photometric) night. The extinction coefficients are also typical of a clear night, but on pristine nights they are up to 30% smaller. 32 WTTM Count Rates & MiniMosaic For a star of zero intrinsic color and B=V=R=I=20.0, we can surmise the count rate in photons per second from the above, given that the WTTM ‘gain’ was set to 1.33 electrons per DN. These rates are derived to be: WTTM Count rate MiniMosaic Count rate (photons/s) (photons/s) B 221 284 V 205 295 R 150 321 I 97 170 Passband On the night of UT030602, a similar calibration was done with MiniMosaic, with a ‘gain’ setting of 1.4 electrons per DN. This night was only 21 nights after the WTTM data discussed above -- and the telescope mirrors and optics can be assumed to be in an equivalent state for reflectance and scattering. Thus, a comparison of count rates between the MiniMosaic results of UT030602 with WTTM results from UT030516 is meaningful comparison of throughput. The count rates derived from MiniMosaic observations on UT030602 (for a star with B=V=R=I=20.0 magnitude) are included in the table above. Thus the comparative throughput in WTTM85/15 vs. MiniMosaic is: 0.78 in B 0.69 in V 0.47 in R 0.57 in I These differences INCLUDE the effect of the extra reflections to get the light into WTTM, as well as the reflections within the WTTM. They also reflect any passband and filter throughput differences. 33 Appendix 3 The Optical System The WTTM science and error sensing light paths are shown in Figure 17. The pickoff mirror (technically outside of the WTTM), M1, the tip-tilt mirror, M2, M3 and the beam splitter are the optical surfaces not present in the Mini-mosaic science beam. The filter and dewar window have counterparts in the Mini-mosaic system. Figure 17 Optical Schematic 34