1
6.2.2
Graphs
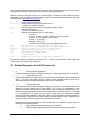
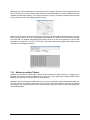
This window allows presenting in graphical form both data 1) that is now being acquired, and 2) data
previously acquired and that is saved in the instrument log memory (not implemented at the time of this
writing). Similar to the previous windows whereby one can display up to 64 channels from 4 instruments, this
window can also display up to 64 channels.
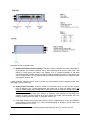
The example below shows a graph while data is being acquired.
The code behind this window is quite heavy, so this window may sometime appear non-responsive; please
be patient!
Description of some options that are offered to you:
•
•
•
•
•
You can adjust the colors of the window background, marker style, etc. With the 3D option, more
variances are available, such as graph rotation, etc.
The graphic can be zoomed, by first right-clicking anywhere in the graphic area, and select “Zoom”;
then select an area that you would like to zoom with your mouse. The zoom is cancelled either after
one minute, or by clicking the “Zoom out” button.
The graphic can be panned, by first right-clicking anywhere in the graphic area, and select “Pan”;
then use your mouse to move the graphic area.
The window can be saved as an image (jpeg, png or gif), and can be printed.
A “Pause Graph” option is useful if one want to examine in details some parts of the graphic. The
graphic can be later resumed, without loss of data.
6.3 Optical channel settings tool
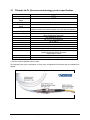
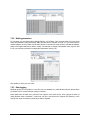
This tool is useful to set up parameters that are related to the optical channel of your T/Guard system. You
need to connect (only if you are not already connected) and then “Get Config” to download the current
information, which will be displayed as follow (for an 8-channel system):
Document no. G1041r03
Copyright Neoptix Canada LP
26