1
5
Port Snapshot Error
Displays the CRC error count between sampling periods for all the ports on a
switch.
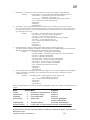
Advanced Monitoring
Graphs
Description
SID/DID Performance
Displays the traffic between SID and DID pair on the switch being managed.
SCSI vs. IP Traffic
Displays percentage of SCSI versus IP frame traffic on each individual port.
AL_PA Errors
Displays CRC errors for a given port and a given AL_PA.
SCSI Commands by port and LUN
(R, W, R/W)
Displays the total number of read/write commands on a given port and
read/write commands to a specific LUN.
User-Defined Graphs
You can modify the predefined graphs based on parameter fields such as SID/DID, LUN, AL_PA, and port to create
your own customized graphs. These user-defined graphs can be added and saved to canvas configurations.
Using Advanced Web Tools, Advanced Performance Monitoring allows you to set up a canvas of performance graphs.
The canvas can hold up to eight graphs per window. Multiple canvases can be set up for different users or different
scenarios.
Up to 20 individual canvases, each with up to eight graphs, can be saved. Each canvas is saved with a name and an
optional brief description.
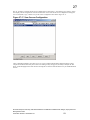
In addition to the graphs, the Performance Monitoring Resource Usage Display shows which filter slots have been used
for each port, and which are available.
Advanced Performance Monitoring also has an extensive set of CLI commands for additional information, refer to the
Fabric OS Reference Manual and the Fabric OS Procedures Guide .
The Brocade Advanced Performance Monitoring license must be purchased from your switch supplier.
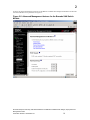
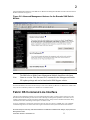
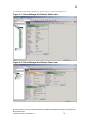
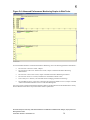
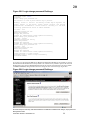
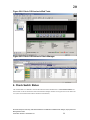
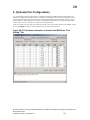
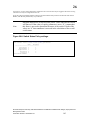
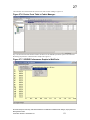
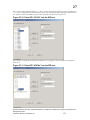
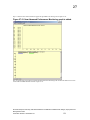
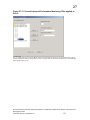
An example of the Basic and Advanced Performance Monitoring graphical user interfaces choices launched from
Advanced Web Tools is shown in Figures 5-2 and 5-3.
Brocade Enterprise and Entry SAN Switch Modules for IBM eServer BladeCenter Design, Deployment and
Management Guide
Publication Number: 53-0000561-01
35