1
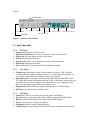
dlgv32 -- Windows 95 Display Software for DLG and DRG Data
Users Manual
(software version 3.7)
October, 1999
Neither the U.S. Government nor any agency thereof nor any of their employees make
any warranty, expressed or implied, or assume any legal responsibility for the accuracy,
completeness, or usefulness of any information, apparatus, product, or process disclosed
herein or represent that its use would not infringe privately owned rights. Reference to
any specific commercial product, process, or service by trade name, trademark,
manufacturer, or otherwise does not necessarily constitute or imply its endorsement,
recommendation, or favoring by the U.S. Government or any agency thereof.
1. Introduction
2. SDTS Data
3. Terms and Menus
3.1 dlgv32 Menu Bar
3.1.1 File Menu
3.1.2 View Menu
3.1.3 Tool Menu
3.1.4 Help Menu
3.2 Tool Bar
4. Loading Files
4.1 Loading Multiple Files
4.2 Projections and Datums
5. View Attributes
5.1 Header Information
5.2 DLG Object Attributes
5.3 DLG/SDTS Attributes
5.3.1 Spatial objects
5.3.2 Metadata
6. Change Display Characteristics
6.1 Background Color
6.2 DLG
6.3 DRG/ DOQ
6.4 Elevation Models (DEM, DEM/SDTS, GTOPO30, TerrainBase)
6.4.1 General Options
6.4.2 Vertical Options
6.4.3 Shader Options
7. Navigation and Attribute Tools
7.1 Zoom
7.2 Pan
7.3 Distance
7.4 Pick
7.5 PolyRegion
7.5.1 Hide Selected Parts of Image
7.5.2 Joining DRG Quadrangles
8. Printing Images
1. Introduction
This manual is for dlgv32 Version 3.7. Earlier versions of the software may not contain
all the features documented here. Later versions may contain additional features, or
behave differently. To see the version of your software, select [Help/About DLG
viewer] from the Menu Bar.
Version 3.7 fixes a few minor bugs that were present in version 3.6, and implements one
new data format: the native USGS format for digital orthophotoquads (DOQ). The bug
fixes do not change any of the program’s documented behaviors.
The dlgv32 software runs on Windows NT and Windows 95. It installs using the “run”
option located on the start menu. A box will appear in which you type the name of the
program and Windows will open it for you.
Earlier versions of the software should be uninstalled [Start/Settings/Control
Panel/Add, Remove Programs] before installing later versions.
dlgv32 displays the following types of data. Refer to the dlgv32 web page at
html://mcmcweb.er.usgs.gov/viewers/dlg_view.html for links to data sources and sample
data sets.
•
Vector data
USGS digital line graph optional (DLG-O)
USGS digital line graph, spatial data transfer standard (DLG/SDTS)
•
Elevation data
USGS digital elevation models (DEM)
USGS digital elevation model, spatial data transfer standard (DEM/SDTS)
USGS digital elevation models, GeoTIFF format
GTOPO30 global digital elevation models
NOAA TerrainBase digital elevation models
•
Image data
USGS digital raster graphics (DRG), GeoTIFF format
USGS digital orthophoto quadrangles (DOQ) in GeoTIFF format
USGS digital orthophoto quadrangles (DOQ) in native USGS format
•
Point data
NOAA DSDATA geodetic control, SDTS format
dlgv32 is not a substitute for commercial geographic information system (GIS)
software. The program is a data viewer, designed to allow preview of USGS data. It
contains no editing, analysis, or other GIS functions. This is a result of deliberate
government policy to avoid competition with private-sector software.
dlgv32 is not a stand-alone tutorial for learning about USGS cartographic data. For
technical information about format, content, and structure of USGS digital cartographic
products, see the National Mapping Program Standards page at
http://mapping.usgs.gov/standards
dlgv32 is public domain software and may be freely copied and distributed.
2. SDTS Data
The Spatial Data Transfer Standard (SDTS) is a format standard for GIS data. The
purpose of SDTS is to permit static transfers of spatial data between dissimilar computer
systems. SDTS is a transfer format, not a processing format; it does not replace any
internal formats of any GIS. SDTS is also a good archive format; an archive can be
thought of as a data transfer through time rather than through space.
Although the SDTS was approved as a Federal Information Processing Standard (FIPS)
in 1992, the format is not widely implemented in commercial software and is therefore
still experimental. In 1995-96, the USGS produced data in SDTS format from its DLG
holdings, and made these data available on the Internet. The intent was to promote SDTS
use by serving large amounts of data for free. The DLG-O native format has not been
discontinued, nor have any production or sales policies toward DLG-O data changed.
DLG-O data are still being produced, and are still available from the same sources, at the
same prices, as previously.
Because of the lack of commercial implementations, SDTS has gained a reputation for
being extraordinarily complicated. The format is complex, but arguably no more so than
other modern data formats. dlgv32 demonstrates that software can hide the complexity of
SDTS from the end user, just as the complexity of other data formats is hidden by
appropriate software.
However, users of SDTS data will find that retrieving these data and preparing them for
use is not particularly easy. This is not due to SDTS, but rather to policy and data
packaging decisions made when DLG-O and DEM data were mass-converted to SDTS.
Some of these decisions were unavoidable, but others were simple mistakes, caused by
inexperience with the SDTS format.
Separate documents explain how to download and organize DLG/SDTS data for use with
this viewer. An SDTS data tutorial is available through the dlgv32 web page at
http://mcmcweb.er.usgs.gov/viewers/dlg_view.html. For general information about
SDTS, see http://mcmcweb.er.usgs.gov/sdts
3. Terms and Menus
This section briefly reviews the menus and commands in order to understand the basic
purpose of each. Figure 1 shows the program Menu Bar and Tool Bar as they appear at
startup.
Menu Bar
Open on top of
Open alone
Zoom In
Tool Bar
Pan
Zoom Out
Full View
Zoom Tool
Distance Finder
Pick
About
Define Polygon Region
Open Control Center
Figure 1. Menu bar and tool bar.
3.1 dlgv32 Menu Bar
3.1.1
File Menu
• Open as New opens an overlay by itself.
• Open into Current opens an overlay on top of overlays already loaded.
• Unload All clears the display screen of all overlays.
• Print prints the displayed overlays.
• Print Preview allows user to displayed overlays as they would print.
• Print Setup configures the printer.
• Exit exits the dlgv32 viewer and closes the application window.
3.1.2
View Menu
• Toolbar toggles the display of the Toolbar window on-screen. If the Toolbar is
currently selected (Toolbar is displayed), there is a check beside the command. To
deselect the Toolbar (Hide the Toolbar), click on the command.
• Status Bar toggles the display of the Status Bar at the bottom of the DEM viewer.
The Status Bar contains information about the X and Y coordinates of the mouse, the
ground reference system coordinates, and which tool is in use. In addition, it also
shows the rendering progress when raster redraws itself.
• Background opens a window to change the background color of the display.
• Full View resizes the overlay to fill the screen.
3.1.3
Tool Menu
• Zoom allows the user to zoom in on a specific point in the display.
• Pan changes the center point of the image without changing the magnification.
• Distance calculates the distance between two points on the display.
• Pick chooses an object to display its attributes.
• PolyRegion defines a region within the display.
• Control Center opens a dialog box that allows the user to manipulate the currently
displayed overlays.
3.1.4
Help Menu
• Help Topics offers an index for on-line help.
• About DLG Viewer opens a window to display the version of the software.
3.2 Tool Bar
The Tool Bar icons are shortcuts to commonly used Menu Bar functions. Descriptions of
all Tool Bar functions are therefore in section 3.1. See Figure 1 for the names that are
associated with each icon.
4. Loading Files
Choose [open alone] icon from the Tool Bar. A standard Windows 95 open window
appears. This window can be set to display only files of selected type with the “Files of
Type:” subwindow.
dlgv32 does not depend on file naming conventions to open or correctly display data. For
example, a DEM file that has no file extension or is incorrectly named with a DLG
extension (.do or .opt), will still display correctly. The file type subwindow is a
convenience for the user, not a necessary mechanism for identifying data types.
Attempts to display formats that the program cannot read (GIF images, for example) will
usually be diagnosed correctly and trapped. However, corrupted data in nominally
correct formats often results in erroneous “Out of Memory” errors or program crashes.
This is a common problem with compressed data that have been retrieved from USGS ftp
sites. These data were designed several years ago for UNIX users, and are tar’d and
gzip’d. They can be unpacked with Windows software if proper procedures are followed,
but improper procedures may corrupt the data. See the SDTS data tutorials (section 2)
for details.
4.1 Loading Multiple Files
dlgv32 will display multiple data sets in correct geospatial positions; that is, adjacent data
sets can be mosaicked, and DLG data can be displayed on top of DRG or DEM data.
Choose [open on top of] from the Tool Bar and select files.
4.2 Projections and Datums
The dlgv32 display space adopts the coordinate system of the first data set opened.
Subsequent data sets will be transformed to the coordinate space of the first data set as
they are loaded. This is a very powerful feature; it makes differences in projections and
datums transparent to the user.
This feature also means that the order in which data sets are loaded can have a significant
impact on the appearance of the display. This is most obvious when working with data
sets of widely varying scales. For example, consider simultaneous display of a
7.5-minute UTM data set in Florida and a 1:10,000,000 Albers data set of North America.
If the North America data are loaded first, the UTM data will be reprojected to Albers.
Both data sets will look relatively “normal.” However, loading the Florida data first will
cause the Albers data to be reprojected to an eastern U.S. UTM zone. This will result is
severe and obvious distortion of the western part of the North America data set.
The software will behave correctly for even more extreme cases. It is possible to distort
large-area maps almost beyond recognition by forcing them to inappropriate projections.
Creative use of this feature can be very helpful for visualizing characteristics of different
map projections.
5. View Attributes
5.1 Header Information
Choose the control panel icon from the Tool Bar or select [Tools/Control Center] from
the Menu Bar. Select one of the currently loaded overlays. Click the metadata button.
The resulting display depends on the type of overlay selected. See the appropriate
product standards for explanations of header information.
5.2 DLG Object Attributes
DLG spatial objects (lines, nodes, areas) have cartographic feature attributes attached to
them. Attributes are stored as numeric codes. dlgv32 simply displays the codes without
attempting to interpret them. Refer to section 7.4 for details on how to view attribute
codes.
5.3
DLG/SDTS Attributes
5.3.1
Spatial objects
Spatial objects (lines, nodes, areas) of SDTS transfers are selected in the same way as
spatial objects for DLG-O data. Refer to section 7.4 for details on how to view attributes.
Unlike DLG-O, SDTS data permits attributes to be stored as English text, or any other
form the data producer believes appropriate. In the conversion of DLG-O data to SDTS,
the USGS preserved the DLG-O attribute codes, but also interpreted these codes and
stored the interpretations in the SDTS data. dlgv32 displays both of these attributes. The
software does not actually interpret the major-minor codes, but rather displays whatever
information is contained in the SDTS data dictionary about the meaning of the attribute
codes.
5.3.2
Metadata
The SDTS requires that the data producers provide some statement of the sources and
quality of the data. To view these statements, and other information about the transfer,
select the [control center] icon or select [Tools/Control Center] from the Menu Bar,
then select metadata.
6. Change Display Characteristics
6.1 Background Color
Choose [View/Background] from the Menu Bar. An array of sample colors will be
displayed. Select the color desired for the display background, and then click OK.
6.2 DLG
Select [Tools/Control Center] or the control center icon. Select an overlay to apply
changes to.
•
•
•
•
Options/Line Width modifies the thickness of the pen used to draw DLG elements.
Options/Node (or Area) Shapes changes the shape of the point symbols used to
draw nods and areas.
Hide Areas (or Nodes or Lines) will turn off the display of symbols for areas, lines
or nodes for a DLG.
Options/Line Color allows selection of the color or DLG elements.
6.3 DRG/ DOQ
Select [Tools/Control Center] or the control center icon. Select an overlay to apply
changes to. Select the Options button on the control center.
•
Color Intensity controls whether displayed pixels are lightened or darkened before
being displayed. It may be useful to lighten or darken raster overlays in order to see
overlaying vector data clearly.
• Transparent allows a particular color to be displayed transparently, making it
possible to see through a layer to the layers underneath. For example, when viewing
a DRG on top of a DOQ, making the white in the DRG transparent makes it possible
to see much of the DOQ underneath.
• Bilinear Interpolation is used to reduce pixelation (large squares of the same color)
that occurs when zooming beyond the resolution limits of an overlay. Pixel
neighborhoods are averaged to smooth the appearance of the image.
• Texture Map allows a 2D raster overlay to be draped on top of a 3D elevation
overlay. Selecting the check box causes the overlay to use any available data from
underlying elevation layers to determine how to color the DRG or DOQ. The result is
a shaded relief map.
6.4 Elevation Models (DEM, DEM/SDTS, GTOPO30, TerrainBase)
Select [Tools/Control Center] or the control center icon. Select an overlay to apply
changes to. Select the Options button.
6.4.1
General Options
The general options work the same for elevation data as for DOQ/DRG data, except that
texture mapping is not an option for elevation data. See section 6.3.
6.4.2
Vertical Options
In [Tools/Control Center/Options], select the Vertical Options tab.
•
A pull-down menu box allows selection of different shading algorithms. The
available shaders are:
•
•
•
•
•
•
•
•
•
•
•
•
Color Ramp Shader: Ramps color from blue for low elevations to red for the
highest elevations.
Daylight Shader: Determines the intensity of a pixel from the lighting angle
and the surface at that point and then applies the shader’s color.
Gradient Shader: Moderates the color with elevation between the low
elevation and the high elevation.
HSV Shader: Maps the elevations onto the HSV (hue saturation value) color
space.
Enable Lighting is an option to view elevation data as shaded relief. With this option
off, the map appears flat, with elevations distinguished by color only.
Lighting Direction sets the position of the light source (the "sun"). Note that
cartographic azimuth and altitude are used.
Ambient Lighting is used to brighten up particular dark looking data sets.
Vertical Exaggeration is used to control the exaggeration of relief features.
Water Transparency controls the clarity of the water if applied. Clearer water
allows more of the underlying relief to show through, while opaque water allows
none.
Water Level sets the level at which water is displayed. By default this is at an
elevation of 0 meters above sea level.
Water Color sets the color of the water. The default is pure blue.
Water Enabled is an option to enable the display of water.
6.4.3
Shader Options
In [Tools/Control Center/Options], select the Shader Options tab.
Daylight Shader
Set Surface Color: Sets the color for the calculated surface intensity.
Gradient Shader
Set Low Color: Sets the color of the lowest elevation value.
Set High Color: Sets the color of the highest elevation value.
HSV Shader
Low Color Start (Advanced): Sets where in the HSV color range the lowest
elevation will be.
Value (Advanced): Modifies the HSV value parameter.
Saturation (Advanced): Modifies the HSV saturation parameter.
Range: Modifies how much of the full HSV range is to be used. Increasing this
value leads to color wraparound.
7. Navigation and Attribute Tools
7.1 Zoom
To zoom on the current center of the image, choose the plus icon from the Tool Bar. The
image will magnify by factors of 2. To zoom out on the current center of the image,
chose the minus icon and the image will de-magnify by a factor or 2.
To zoom in on a specific point, choose the [zoom tool] from the Tool Bar or, Tool/Zoom.
A magnifying class icon should appear on the screen. To zoom in, left click without
dragging the mouse. The view is centered on where the mouse was clicked and will
zoom in by a factor of two. To zoom out, right click without dragging the mouse. The
view will zoom out by a factor of two, centered on where the mouse was clicked.
To zoom to an area, choose the magnifying glass icon from the Tool Bar or select
[Tools/Zoom] from the Menu Bar. Click and drag the left mouse button to define a
rectangle. Release the mouse button to display the selected area in a full screen.
7.2
Pan
To change the center point of the image without changing the magnification, choose the
pan tool from the Tool Bar or select [Tools/Pan] from the Menu Bar. Click on the
image to define the new center point.
7.3 Distance
To find the distance between two points on the display choose the distance tool icon
from the Tool Bar or select [Tools/Distance] from the Menu Bar. Left click on the point
to begin the measurement. Move the mouse, which will draw a line, to the point where
the measurement should stop. Click and release the left mouse button and a dialog box
showing the distance should appear. The distance can be displayed in kilometers, meters,
miles and feet by selecting one of the choices in the dialog box.
7.4 Pick
To pick objects, select the pick tool icon or select [Tools/Pick] from the Menu Bar.
Either press and release the left mouse button near the object(s) to be picked or hold
down the left mouse button a drag a selection box around the area the object is to be
picked from. This will select all objects within the box. If more than one object was
picked, click the right button to cycle though the selected objects.
When an object is picked, it will be highlighted and a dialog box will appear displaying
the corresponding, DCU Name, Category, Element ID, Element Type, Attribute Codes,
and Description.
7.5 PolyRegion
This tool is used to render selected parts of selected overlays transparent to other data.
To define a polygon region select the [polyregion icon] or select [Tools/PolyRegion]
from the Menu Bar. Click the left button once. Drag the mouse and click the left button
at each vertex of the polygon. To finish the polygon, click the right button and select the
overlays to apply the clipping region to from the Overlay Selector dialog box.
7.5.1
Hide Selected Parts of Image
Choose the polyregion icon from the Tool Bar. Click (do not hold) on a point in the
image. As the cursor is moved, a line is drawn from the point of the mouse click. Click
again to define a second fixed point. Repeat as many times as needed to define a
polygon. Click the right mouse button to close the polygon.
When the polygon is closed, a window appears with a list of currently open overlays.
Select the overlays that the polygon should apply to and click OK. The area inside the
polygon remains displayed, while the area outside the polygon (on the selected overlays)
becomes invisible.
To undo region hiding, choose the control center icon. Select an active overlay, and
choose remove clip regions.
7.5.2
Joining DRG Quadrangles
To join two adjacent DRG’s, (refer to section 3.3, Loading Multiple Files) use the
polyregion tool to trace the neatline of the top DRG (refer to section 6.4, Hide Selected
Parts of Image). Pan and zoom can be used without resetting the polyregion tool.
Clipping can be suspended by selecting one of the other tools. You can therefore zoom
out and zoom in on another point on the image between polygon point selections.
The boundaries of a USGS quadrangle are not straight lines, but are close enough that
defining a polygon with the four corners is usually adequate for 7.5-minute quadrangles.
To get a more accurate approximation of the quadrangle boundary, select additional
points between the corners.
Quadrangles are joined only in the dlgv32 display space. The program does not provide
capabilities to save joined images as new data files.
8. Printing Images
dlgv32 contains a simple capability to print portions of images. The program uses
standard Windows 95 printing techniques, and should work with any printer that works
with other Windows 95 applications. A small but significant number of users have
reported various problems with the print function, but USGS programmers have been
unable to trace most of these problems to any software bug. Printing is not one of the
program's strong features, and obtaining high-quality or customized printouts usually
requires other, more specialized software.
•
•
•
Zoom to the area you are interested in printing. Center the features of interest in the
display.
Select [File/Print Preview] from the Menu Bar. A page will display showing what
your printout will look like. Select the close button to close the print preview window.
Select [File/Print Setup] to change printer settings. For example, to change page
•
orientation from portrait to landscape.
Select [File/Print] to send the page to the printer.
The appearance of printed page depends on several things, including the size and shape
of your display window, printer type, and printer settings. dlgv32 attempts to reproduce
the magnification of the currently displayed image on the paper. Depending on the size
and shape of the display relative to a paper page, more of the image may be printed than
is displayed. Color and resolution characteristics depend on the type of printer.
dlgv32 provides no desktop publishing functions, such as the abilities to add boarders,
legends, additional data overlays, or custom symbolization.