1
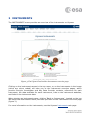
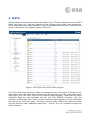
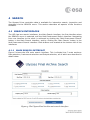
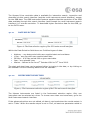
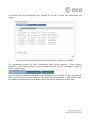
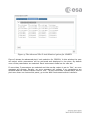
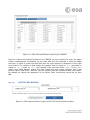
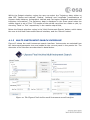
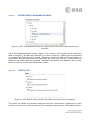
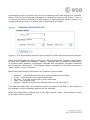
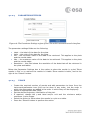
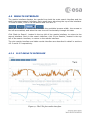
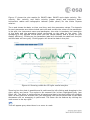
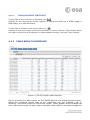
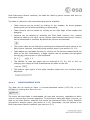
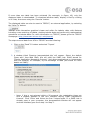
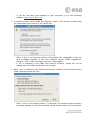
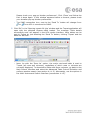
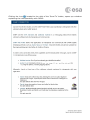
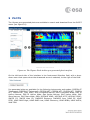
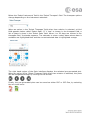
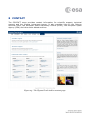
ULYSSES FINAL ARCHIVE
USER MANUAL
Science Archives and VO Team
Table of contents
1
INTRODUCTION TO THE ULYSSES FINAL ARCHIVE ........................ 3
2
INSTRUMENTS ............................................................................... 5
3
DATA .............................................................................................. 6
4
SEARCH .......................................................................................... 8
4.1 SEARCH INTERFACES ................................................................................ 8
4.1.1 MAIN SEARCH INTERFACE................................................................... 8
4.1.1.1
4.1.1.2
4.1.1.3
DATE SELECTION ...................................................................................... 9
INSTRUMENT SELECTION ........................................................................... 9
OUTPUT SELECTION ................................................................................ 12
4.1.2.1
4.1.2.2
4.1.2.3
4.1.2.4
4.1.2.5
INSTRUMENT/PARAMETER TREE ................................................................ 14
PANEL LIST ............................................................................................. 14
PRESENTATION SETTINGS ........................................................................ 15
PARAMETER SETTINGS ............................................................................. 16
USAGE ................................................................................................... 16
4.2.1.1
DOWNLOADING THE PLOTS ...................................................................... 19
4.2.2.1
DOWNLOADING DATA .............................................................................. 20
4.1.2
MULTI-INSTRUMENT SEARCH INTERFACE ........................................... 13
4.2 RESULTS INTERFACE ............................................................................... 17
4.2.1 PLOT RESULTS INTERFACE................................................................ 17
4.2.2
TABLE RESULTS INTERFACE .............................................................. 19
5
PLOTS .......................................................................................... 25
6
SOFTWARE ................................................................................... 27
7
HELP ............................................................................................ 28
8
CONTACT ..................................................................................... 29
1 INTRODUCTION TO THE ULYSSES FINAL ARCHIVE
This document is the User Manual for the Ulysses Final Archive (UFA). The home page
for the UFA is located at http://archives.esac.esa.int/ufa :
Figure 1: The Ulysses Final Archive homepage.
The goal of the UFA is the long term preservation at the European Space Agency of
the unique data from the Ulysses mission (launched on 6th October 1990, and
remained operational until 30th June 2009). The UFA is a web application where users
can explore and download the data sets and relevant documentation, search through
the data, list or plot results and share them with external scientific applications.
To exploit all the functionalities provided by the UFA, we recommend the following
web browsers: Chrome, Firefox and Safari (latest versions). The UFA can be seen in
other browsers such as Opera and Internet Explorer, however, Internet Explorer
versions 9 and lower are not recommended.
The top menu of the home page provides links to the main search interface of the UFA
(under SEARCH), information regarding the Ulysses instruments (INSTRUMENTS),
direct access to the Ulysses mission data and directories (DATA), access to the mission
pre-generated plots (PLOTS), information and access to available software
(SOFTWARE), a help page (HELP) and contacts page (CONTACT):
Figure 2: The Ulysses Final Archive menu.
The following sections of this document are arranged in the same order as the menu;
section 2 summarises the instruments pages, section 3 describes the data interface,
section 4 the search interfaces of the UFA, section 5 the pre-generated plots interface,
and sections 6, 7 and 8 summarise the software, help and contact pages respectively.
2 INSTRUMENTS
The INSTRUMENTS menu provides an overview of the instruments on Ulysses.
Figure 3: The Ulysses Final Archive Instruments overview page.
Clicking on the instrument names in the top menu, or on the instruments in the image
(which are colour coded) will take you to the instrument overview pages, which
provide Principle Investigator and Key Data Provider contacts, references for each
instrument, the data available for each instrument, links to the instrument websites,
and links to the instrument data.
When viewing an instruments page, clicking ‘Back to Instruments’, located on the top
left below the instruments menu, will take you back to the instruments overview page
(figure 3).
For more information on the instruments, see the Ulysses Instruments web page.
3 DATA
Ulysses data can be accessed and downloaded via an FTP-like interface from the DATA
menu (see figure 4). Data are ordered on the left-hand side under three categories:
Prime Resolution Data, High Resolution Data, and Additional Data Sets. Clicking on the
arrow to the left of the category opens up the tree.
Figure 4: The Ulysses Final Archive Data interface.
The Prime and High Resolution Data are categorised by instrument. Clicking on the
instrument name will show the available files and directories in the right-hand region
(see figure 4 for the VHM_FGM Prime resolution data example). Note that the Prime
resolution data are also available through the UFA SEARCH interface, with the
exception of GRB data which has 5 minute resolution data available (a lower resolution
than the prime resolution data). The high resolution data, GRB prime resolution data,
and the cdroms (under Additional Data Sets -> Other) are only available through the
DATA interface.
This DATA interface provides extra functionality than a normal FTP interface, including
whole directory downloads, start time metadata information for prime resolution data
files, and the ability to visualise the contents of zip files.
To navigate into directories, left click on the directory of interest, in the right-hand
region of the page, and select ‘See contents’. Four columns are displayed; the file
name, file size, first event start time and last event start time. Columns can be
ordered by clicking on the column header. To navigate backwards, click on the file
structure at the top of the right-hand region.
Finally, to download data, left-click and select ‘Download’. Individual files or whole
directories can be downloaded.
4 SEARCH
The Ulysses Prime resolution data is available for interactive search, inspection and
download via the SEARCH menu. This section describes all aspects of the functions
available.
4.1 SEARCH INTERFACES
The UFA has two search interfaces, the Main Search interface, the first interface when
the SEARCH menu is selected, and the Multi-Instrument Search interface. Navigating
from one interface to the other is achieved by clicking the ‘Multi-Instrument Search’
button in the Main Search interface, and by clicking the ‘Main Search’ button in the
Multi-Instrument Search interface. Both buttons are located at the bottom left of the
interfaces.
4.1.1
MAIN SEARCH INTERFACE
Figure 5 shows the UFA main search interface. This is divided into 3 main sections:
Date selection, Instrument selection and Output selection, all of which are described in
detail below.
Figure 5: The Ulysses Final Archive main search interface.
The Ulysses Prime resolution data is available for interactive search, inspection and
download via this search interface (and the multi-instrument search interface), except
for the GRB data. The GRB instrument footnote explains that the resolution of the GRB
data available through this search interface (and through the multi-instrument search
interface) is 5 minute resolution. To download higher resolution data for the GRB, go
to the DATA menu.
4.1.1.1
DATE SELECTION
Figure 6: The Date selection region of the UFA main search interface.
Within the Date Selection field there are 5 defined types of date:
•
•
•
•
•
Arbitrary – any date period with user supplied start and end dates.
1 Day – any day with user supplied start date.
26 Days – a 26 day period from a given start date.
Year – any calendar year
Mission – defined to be from 6th October 1990 to 30th June 2009.
The start and stop times can be entered either by typing in the date, or by clicking on
the calendar icon and choosing dates from the calendar.
4.1.1.2
INSTRUMENT SELECTION
Figure 7: The Instrument selection region of the UFA main search interface.
The Ulysses instruments are listed in the Instrument selection region. Only one
instrument can be selected at a time. To choose more than one instrument, go to the
Multi-Instrument search interface.
If the advanced options are not edited, all data is retrieved when the results output is
set to ‘Table’. When the results output is set to ‘Plot’, at least one parameter needs to
be chosen from the ‘Advanced’ link. Figures 8, 9 and 10 show the ‘Advanced’ link
options.
Figure 8: The Advanced ‘Table Column Selection’ options for COSPIN.
The Advanced options for each instrument have three sections: ‘Table Column
Selection’, ‘Plot-Y-Axis Selection’, and ‘Advanced Search’. A user navigates to each by
clicking on the tabs:
Figure 8 shows the advanced table column selection for COSPIN. In this window the
user can select which parameters will be retrieved and displayed in the results table.
By default all parameters are selected. Each instrument mode has its own tab.
Figure 9: The Advanced ‘Plot Y-Axis Selection’ options for COSPIN.
Figure 9 shows the advanced plot Y-axis selection for COSPIN. In this window the user
can select which parameters will be retrieved and displayed in the plots. By default
none of the parameters are selected. Each instrument mode has its own tab.
If more than 5 parameters are selected and the results output is set to ‘Plot’, an error
message will appear. Equally, an error message will appear if no parameters are
selected and the results output is set to ‘Plot’. To plot more than 5 parameters, and to
plot more than one instrument panel, go to the Multi-Instrument search interface.
Figure 10: The ‘Advanced Search’ options for COSPIN.
Figure 10 shows the advanced search for COSPIN. In this window the user can apply
simple mathematical constraints on the data that will be retrieved in both the table
and plot. A value is typed into the field and the logic applied is displayed in the right
grey button. The options in this button are greater than or equal to: >= ; less than or
equal to: <= ; equal to: == ; and greater than and less than: <=>. In the <=>
option two fields appear where the user inputs the first value (greater than) and
second value (less than), and will retrieve results that fall between these two values.
By default no values are displayed in the fields. Each instrument mode has its own
tab.
4.1.1.3
OUTPUT SELECTION
Figure 11: The Output selection region of the UFA main search interface.
Within the Output selection region the user can select the Trajectory data, either no
data ‘Off’, ‘Radius and Latitude’, ‘Radius’, ‘Latitude’ and ‘Longitude’ (combinations of
Ulysses radial distance, heliographic latitude and Carrington longitude extracted from
trajectory information). The trajectory data is displayed in the lower panel when the
results output is set to ‘Plot’. The output of the results can either be a table or plot, by
choosing ‘Table’ or ‘Plot’ respectively in the results output field,
Below the Output selection region is the ‘Multi-Instrument Search’ button, which takes
the user to the Multi-Instrument Search interface, and the ‘Submit’ button.
4.1.2
MULTI-INSTRUMENT SEARCH INTERFACE
Figure 12 shows the multi-instrument search interface. Instruments are selected from
the instrument/parameter tree and added to the current panel in the panels list. The
elements of the interface are described in detail below.
Figure 12: The Ulysses Final Archive multi-instrument search interface.
4.1.2.1
INSTRUMENT/PARAMETER TREE
Figure 13: The Instruments/Parameter region of the UFA multi-instrument search
interface.
The Instrument/Parameter region (figure 13) is where the Ulysses prime resolution
data is selected. The data are ordered in a 4 level hierarchy. Folders can be expanded
or collapsed by clicking on the arrows. Selecting a folder will add all the instruments in
that folder. Multiple selections are supported by using the Ctrl key. Instruments are
added in the order they are selected. Selected instruments are added to the current
panel by clicking on the ‘Add Parameter’ button.
4.1.2.2
PANEL LIST
Figure 14: The Panels region of the UFA multi-instrument search interface.
The panel list shows the panels configured and the instruments configured for each
panel (see figure 14). New panels may be created by selecting the ‘New Panel’ button.
Instruments can be removed from the list by selecting them and clicking the ‘Remove’
button. The list can be cleared completely by clicking the ‘Remove All’ button. There is
no limit to the number of panels, or the number of parameters per panel, however, we
recommend no more than 4 panels, and 5 parameters per panel.
4.1.2.3
PRESENTATION SETTINGS
Figure 15: The Presentation Settings region of the UFA multi-instrument search interface.
Within the Presentations Settings region the user can select the Trajectory data, either
no data ‘Off’, ‘Radius and Latitude’, ‘Radius’, ‘Latitude’ and ‘Longitude’ (combinations
of Ulysses radial distance, heliographic latitude and Carrington longitude extracted
from trajectory information). The trajectory data is displayed in the lower panel when
‘Show results in Plot’ is selected.
Within the Date Selection field there are 5 defined types of date:
•
•
•
•
•
Arbitrary – any date period with user supplied start and end dates.
1 Day – any day with user supplied start date.
26 Days – a 26 day period from a given start date.
Year – any calendar year
Mission – defined to be from 6th October 1990 to 30th June 2009.
The start and stop times can be entered either by typing in the date, or by clicking on
the calendar icon and choosing dates from the calendar.
Below the Presentation Settings box is the ‘Main Search’ button, which takes the user
to the Main Search interface.
4.1.2.4
PARAMETER SETTINGS
Figure 16: The Parameter Settings region of the UFA multi-instrument search interface.
The parameter settings fields are the following:
•
•
•
•
•
Label – the label of the data for the plots.
Units – the units of the data for the plots.
Min – the minimum value of the data to be retrieved. This applies to the plots
and the results table.
Max – the maximum value of the data to be retrieved. This applies to the plots
and the results table.
Resolution – this field shows the resolution of the data that will be retrieved in
the plots and tables.
Below the Parameter Settings box is the option to show the results in a plot ‘Show
results in Plot’ or to retrieve the results in a table ‘Show results in table’, and to the
right is the ‘Submit’ button.
4.1.2.5
•
•
•
•
•
•
USAGE
Create the required number of panels and add parameters to them from the
instrument/parameter tree (this can be done in any order, but the order in
which the parameters are added is the order in which they will be displayed).
Select an appropriate date range
Set the desired trajectory information of the plot.
If required, change the y-axis label and/or unit and the minimum and/or
maximum y-axis ranges.
Select the action to either show the results in a plot or a table.
Press the ‘Submit’ button to perform the action.
4.2 RESULTS INTERFACE
The results interface displays the results from both the main search interface and the
multi-instrument search interface. Each result has a tab along the top of the interface.
To close a result, click on its tab button and click the ‘x’:
When the number of results tabs exceeds the available browser width, the arrows to
the left are enabled, and allow the user to scroll horizontally through the tabs.
Click ‘Back to Search’, located in the top left of the results interface, to return to the
search interface. Once in the search interface, click ‘Go to Results’, located in the top
left of the search interface, to return to the results interface.
The plot results interface and table results interface are described in detail in sections
4.2.1 and 4.2.2 respectively.
4.2.1
PLOT RESULTS INTERFACE
Figure 17: The UFA plot results interface.
Figure 17 shows the plot results for SWICS data: SWICS main alpha velocity, C6+
velocity, O6+ velocity, and Ne8+ velocity (upper panel) and trajectory data:
heliocentric radius and heliographic latitude (lower panel) for the entire Ulysses
mission.
The x-axis shows the date, or time, and the y-axis the parameter values. The legends
for each parameter are shown below each plot and contain the colour of the parameter
in the plot, the instrument name and parameter, the units in brackets, the resolution
of the data and the averaging being performed on the data by the plots. This
averaging is only applied to the plots (not the results tables) and is purely for plot
display efficiency. Clicking on the parameter label will eliminate the data from the plot
and the label will turn grey. Clicking again will show the data in the plot.
Figure 18: Zooming within the UFA plot results interface.
Zooming into the plots is possible and is performed by left-clicking and dragging to the
right, within any panel. The region to be zoomed into is then highlighted grey (see
figure 18). The zoom is performed on all panels and has to be done within the plotting
area. As the plots are zoomed into, the averaging time period performed on the data
decreases until no averaging is performed. The zoom can be undone by clicking the
undo arrow in the top right:
This will appear grey when there is no more to undo.
4.2.1.1
DOWNLOADING THE PLOTS
To the right of the undo icon is the save icon:
Clicking on the icon brings up the options for saving the plots: as a JPEG image; a
PNG image; or a PDF document.
To the right of the save icon is the print icon:
Clicking on the icon brings up the print preview. To print, click the ‘Print’ button which
will open up the local print options, to close without printing, click the ‘Close’ button.
4.2.2
TABLE RESULTS INTERFACE
Figure 19: The UFA table results interface.
Figure 19 shows the table results for the SWICS data for the whole Ulysses mission.
Below the numbered results tabs lie the Instrument tab and Trajectory tab (if
selected), and below these the instrument modes. These appear when the data has
been retrieved through the Main Search interface. When data is retrieved through the
Multi-Instrument Search interface, the tabs are listed by panel number and then by
instrument mode.
The table is interactive with the following functions available:
•
Table columns can be sorted by clicking on the headers. An arrow appears
showing the sort as either ascending or descending.
•
Table columns can be resized by clicking on the right edge of the header and
dragging.
•
Columns can be deleted by selecting the Filter table columns icon, located
above the table on the right. In the column select window that opens, columns
can be unselected or selected. By default all columns are selected:
•
The column data can be filtered by selecting the Advanced Search option in the
Main Search interface, and performing another search (see section 4.1.1.2).
•
Table pages are navigated through by clicking on the arrows located below the
table on the left. Alternatively, a page number can be inputted and navigated
through by clicking enter on your keyboard:
•
The number of rows per pages can be changed to 25, 50, 100 or 200, by
changing the ‘Page size’ field located below the table on the left:
•
The bottom right region of the table interface shows the row numbers being
displayed:
4.2.2.1
DOWNLOADING DATA
The data can be saved as either a Comma-separated values (CVS) file, or as a
VOTable, by clicking the ‘Save As’ icon:
The entire retrieved table is downloaded (all rows and columns), regardless of which
rows or columns are currently displayed. To download a table with fewer columns, go
back to the Main Search Interface and select the Advanced Table Column Selection
and perform another search (see section 4.1.1.2). Alternately, use the options in the
Multi-Instrument Search Interface (see section 4.1.2).
If more than one table has been retrieved (for example, in figure 19), only the
displayed table is downloaded. To download another table, display it first by clicking
on it’s tab, then save using the ‘Save As’ button.
The displayed table can also be sent to TOPCAT, an external application, by selecting
the ‘Send To’ button:
TOPCAT is an interactive graphical viewer and editor for tabular data, with features
including cross matching of tables, plotting tabular data and performing mathematical
operations on tabular data. For more information on TOPCAT, please go to the TOPCAT
homepage: http://www.star.bris.ac.uk/~mbt/topcat/
The steps to send data from UFA to TOPCAT are the following:
1. Click on the ‘Send To’ button and select ‘Topcat’.
2. A window titled ‘Opening jsampwebhub.jnlp’ will appear. Select the default
‘Open with’ Java Web Start, this will open the SAMP hub. SAMP stands for
‘Simple Application Messaging Protocol’, and allows applications to interoperate
with one another, for example, by the exchange of data (see below for more
details on SAMP).
o
Note: if this is not selected within ~30 seconds, the registration times out
and a window appears in the UFA interface saying ‘SAMP Registration
timeout’. Click ‘Close’ and follow the first 2 steps again. If a SAMP hub is
already open in your computer, the jsampwebhub window will not appear
and the interface goes from step 1 to step 3.
o
If you do not have java installed in your computer, go to the following
website: http://www.java.com
3. A second window, titled ‘SAMP Hub Security’ opens. This security window asks
for authorisation to connect to the SAMP hub.
o
Note: if this is not selected within ~30 seconds, the registration times out
and a window appears in the UFA interface saying ‘SAMP Registration
timeout’. Click ‘Close’ and follow the first 3 steps again.
o
If ‘No’ is selected in the SAMP Hub Security window, Topcat will not be
loaded, and the SAMP registration will timeout.
4. When ‘Yes’ is selected in the ‘SAMP Hub Security’ window, a final window opens
titled ‘Opening tocpat-full.jnlp’.
o
Note: if this is not selected within ~30 seconds, the window times out and a
message appears in the UFA interface saying ‘topcat could not be launched.
Please check your pop-up blocker preferences’. Click ‘Close’ and follow the
first 4 steps again. If this window appears before a timeout, please check
your browser pop-up blocker preferences.
o
The SAMP connection icon, next to the ‘Send To’ button will change from:
to:
once UFA is connected to SAMP.
5. Click ‘OK’ in the ‘Opening topcat-full.jnlp’ window and the Topcat application will
open with the selected Ulysses table loaded. The message ‘Table details
successfully sent’ will appear in the UFA results interface. More tables can be
sent to Topcat by just selecting the ‘Send To’ button, clicking ‘Topcat’ and the
table will be sent:
o
Note: As with the ‘Save As’ option, the entire retrieved table is sent to
Topcat (all rows and columns), regardless of which rows or columns are
currently displayed. To download a table with fewer columns, go back to the
Main Search Interface and select the Advanced Table Column Selection and
perform another search (see section 4.1.1.2). Alternately, use the options in
the Multi-Instrument Search Interface (see section 4.1.2).
Clicking the icon: , located to the right of the ‘Send To’ button, opens up a window
explaining the interoperability with SAMP:
5 PLOTS
The Ulysses pre-generated plots are available to search and download from the PLOTS
menu (see figure 20).
Figure 20: The Ulysses Final Archive pre-generated plots interface.
On the left-hand side of the interface is the Instrument Selection field, with a dropdown menu that opens when the downward arrow is selected, to the right of the field:
Pre-generated plots are available for the following instruments and modes: COSPIN AT
Telescope1; COSPIN AT Telescope2; COSPIN HET; COSPIN HFT; COSPIN KET; COSPIN
LET; COSPIN LET_PHA; EPAC; GAS Composite Narrow; GAS Composite Wide; GAS IS
Helium Narrow; GAS IS Helium Wide; Gas Jupiter Narrow; GAS Jupiter Wide; GAS
Stars Narrow; GAS Stars Wide; GRB; HISCALE IONS; HISCALE LEFS; HISCALE LEMS;
SWICS CS; SWICS Main CS; SWOOPS Electrons; SWOOPS Ions; URAP DF; URAP
PFRP; URAP RARP High; URAP RARP Low; URAP Summary; URAP WFBA; URAP WFEA;
VHM FGM.
Below the ‘Select Instrument’ field is the ‘Select Timespan’ field. The timespan options
change depending on the instrument selected:
When an option in the ‘Select Timespan’ field other than mission is selected, a third
field appears below called ‘Select Date’. If ‘1 Year’ is chosen in the timespan field, a
list of years is given in the ‘Select Date’ field. When 1 or 26 days are chosen in the
timespan field, a calendar appears. The calendar is colour coded, dates where data is
available are highlighted blue and the current selected date is highlighted orange:
The right hand region of the Plots interface displays the selected pre-generated plot.
When an option in the ‘Select Timespan’ field other than mission is selected, the plots
can be navigated through by clicking on the arrows:
Finally, the pre-generated plots can be saved as either PDF or GIF files, by selecting
the top right icons:
6 SOFTWARE
The SOFTWARE menu provides information on Ulysses software resources and links to
the software. Two software resources are available: The SWICS Archive and the UDS
Viewer.
Figure 21: The Ulysses Final Archive software page.
7 HELP
The HELP menu provides help about all pages of the Ulysses Final Archive, and is a
repeat of all information given in this manual. A link to download the user manual is
also provided.
Figure 22: The Ulysses Final Archive help page.
8 CONTACT
The CONTACT menu provides contact information for scientific support, technical
support and the Ulysses instrument teams. It also provides links to the Science
Archives Team, the European Space Astronomy Centre (ESAC), the European Space
Agency (ESA) and other solar-based archives.
Figure 23: The Ulysses Final Archive contact page.
Contact
http://archives.esac.esa.int/ufa
Science Archives and VO Team technical support helpdesk:
http://www.sciops.esa.int/helpdesk_ufa