1
2104-9010-02
March 2008
User manual
EnVision™
Software version 1.12
PerkinElmer Life and Analytical Sciences, Wallac Oy, P.O. Box 10, FIN-20101 Turku, Finland.
Tel: 358-2-2678111. Fax: 358-2-2678357 Website: www.perkinelmer.com
Contents
Contents
Introduction................................................................................................... 3
Software installation .................................................................................... 5
Start up......................................................................................................... 5
Shut down .................................................................................................... 6
Using this manual ........................................................................................ 7
Conventions used......................................................................................... 8
Introduction to the User Interface............................................................... 9
Reader control window................................................................................ 9
Reader control toolbar ............................................................................ 12
Configuring your user interface ............................................................. 13
Navigation Tree...................................................................................... 14
Shortcut Bar............................................................................................ 15
Recycle Bin ............................................................................................ 17
Tabs in the Reader control window ........................................................... 18
Reader control window - Counts............................................................ 18
Reader control window - Graph ............................................................. 21
Reader control window - Temperature................................................... 25
Reader control window - Events ............................................................ 27
Inventory ................................................................................................ 28
Options for running Envision .................................................................... 33
Do you have a protocol ready? .................................................................. 33
Do you have the plate and label combination optimized?......................... 34
Types of optimization ................................................................................ 35
Plate orientation ......................................................................................... 39
Using the Assay Start Wizard .................................................................... 41
Assay Start Wizard .................................................................................... 41
Use of an optimization plate................................................................... 41
Steps in running the Assay Start Wizard ................................................... 42
i
Contents
Running an assay without the Assay Start Wizard ................................. 61
Running an assay (no protocol barcodes, no stacker) ............................... 61
Running an assay with protocol barcodes (no stacker) ............................. 64
Running an assay with a stacker (no protocol barcodes) .......................... 66
Running an assay with a stacker and protocol barcodes ........................... 67
Buttons on EnVision ................................................................................. 69
START button........................................................................................ 69
STOP button........................................................................................... 70
LOAD button ......................................................................................... 70
Order of Dual label measurement in single detector instruments ............. 70
Result viewing ............................................................................................. 75
Results filters............................................................................................. 76
Results toolbar buttons .............................................................................. 77
Latest...................................................................................................... 78
Results window ......................................................................................... 78
Assay...................................................................................................... 78
Protocol .................................................................................................. 79
Notifications........................................................................................... 80
Plate........................................................................................................ 80
Group ..................................................................................................... 81
Calculations............................................................................................ 83
Adding additional calculations............................................................... 94
Export..................................................................................................... 98
Advanced Optimization ........................................................................... 101
Plate dimension optimization .................................................................. 101
Measurement height optimization ........................................................... 105
Detector gain optimization (FI and FP)................................................... 107
Crosstalk correction opt. (Enh. lum. and Ultra Sensitive lum.) .............. 110
Crosstalk correction opt. (AlphaScreen and HTS AlphaScreen) ............ 111
ii
Contents
Dispenser Control ..................................................................................... 115
Maintenance............................................................................................. 115
Initialization.......................................................................................... 115
Rinse..................................................................................................... 116
Fill tubing ............................................................................................. 119
Retrieve liquid ...................................................................................... 121
Test dispense ........................................................................................ 124
Empty syringe....................................................................................... 126
Fill syringe............................................................................................ 129
Show advanced options ........................................................................ 131
Settings .................................................................................................... 133
Dispenser guidelines................................................................................ 135
When starting operation ....................................................................... 135
Before daily work................................................................................. 135
After operation ..................................................................................... 136
Changing a tip mount ........................................................................... 136
Index........................................................................................................... 139
iii
Trademarks
Trademarks
Wallac. LANCE, FP2 and EnVision are trademarks and PerkinElmer,
AlphaScreen and DELFIA are registered trademarks of PerkinElmer, Inc.
Windows, Windows XP and Windows Vista are registered trademarks of
Microsoft Corp. in the U.S. and other countries.
iv
Chapter 1
Introduction
1
2
Introduction
Introduction
The EnVision™ high throughput screening microplate
reader from PerkinElmer Life and Analytical Sciences is a
complete platform for quantitative detection of lightemitting or light absorbing markers. It is suitable for
measurement of fast or glow luminescence, absorbance,
fluorescence intensity, fluorescence polarization ([FP]2™),
high-sensitivity time-resolved fluorometry (DELFIA®) and
homogeneous time-resolved fluorometry (LANCE™).
Very high sensitivity measurements can be made with the
Ultra Sensitive luminescence option.
A laser-equipped model allows AlphaScreen measurements
to be made. HTS AlphaScreen allows faster throughput
than standard AlphaScreen.
Another option with an external laser enables enhanced
time-resolved fluorescence measurements.
The monochromator option allows a wide range of
wavelengths for absorption measurements. The dual
monochromator option allows also wavelength selection
for both excitation and emission light in fluorescence
intensity measurements.
EnVision is a very compact, small footprint bench top unit
with features such as shaking, reading from above or below
and scanning.
Also available are a dispenser with up to two pumps and
temperature control of the instrument chamber.
3
Introduction
The software is a 32-bit application running under
Windows XP® or Windows Vista®. Output can be to a file
on the PC and/or to a laser printer or on the network.
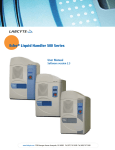
Figure 1. Wallac EnVision with a stacker
Figure 2. Wallac EnVision without a stacker
4
Introduction
Software installation
Note! Installation must be done only by PerkinElmer
service personnel.
Note! The following instructions assume that EnVision, the
CAN-card or optional control unit, PC and printer have
been connected up and switched on (see the installation
instructions in the Instrument manual).
1. Load the software CD.
2. The setup loader will start automatically. This will
guide you through the installation.
3. When you have completed the installation you should
remove the CD from the PC.
Start up
1. Switch on EnVision.
2. If you have a control unit, switch it on. This is a
separate CPU used to run the instrument software. In
an alternative configuration the job is handled by the
workstation PC without a separate control unit.
3. Wait until the red light on the EnVision panel is steady
(not blinking). This takes a couple of minutes.
4. Switch on the user PC.
5. Start Wallac EnVision Manager by clicking the
EnVision icon.
Caution! For users with the Stacker option - keep your
hands away from the stacker area when the software is
started or restarted. The rods in the stacker will come up
during the initialization process.
5
Introduction
Shut down
1. To shut the loading door, press the LOAD button.
2. Close Wallac EnVision Manager by clicking File and
Exit, or closing the window in the usual way. You will
be given a choice to shut down either the workstation
software only or the whole EnVision software. Choose
the option you want and click OK.
3. Shut down the user PC.
4. If you have a control unit, press the ON/OFF button to
shut it down. Wait while the light is flashing on the
control unit (two or three minutes). Only if this button
has not ceased flashing after several minutes should
you press the same button again.
5. Shut down EnVision.
Note! If you are not going to use EnVision for a while, you
can leave the power to the various units switched on but
you should shut the loading door.
6
Introduction
Using this manual
This manual describes the main steps to be followed when
running samples on EnVision. It assumes that protocols
have been set up and that all the needed components
(filters etc.) have been installed.
Please refer to the Reference manual for detailed
information about all types of parameter setting.
Part 1 Introduction
Tells you how the system works in general.
Part 2 Operation
Takes you through use of the Assay Start Wizard
including optimization and proceeding to running assays.
Part 3 Results
Describes result viewing and output.
Part 4 Advanced Optimization
Explains some of the additional steps involved in
optimization if you choose to use the Advanced selection
in the Assay Start Wizard.
Part 5 Dispenser Control
Describes the software parameters used to control
operation of the dispenser option. Gives guidelines for
daily use of the dispenser option. Please refer to the
Instrument manual for routine maintenance of the
dispenser. Tip Mount and Temperature Control settings
are described in the Reference manual.
7
Introduction
Conventions used
Buttons or other software items to be clicked with the
mouse are in bold text e.g. File.
Items in the main Navigation Tree are in bold italic e.g.
Protocols.
Buttons on the instrument that need to be pressed are in
block letters e.g. START.
Note! The term "AlphaScreen" refers to both standard
AlphaScreen and HTS AlphaScreen unless a distinction is
specifically made. The term "special luminescence" refers
to Enhanced luminescence and Ultra Sensitive
luminescence.
Note! If there are features described in this manual which
are not in your software, it means that the feature is an
option which is not installed in your instrument. Please
consult the Order guide for a list of options which can be
installed by a service person.
8
Introduction to the User Interface
Introduction to the User Interface
When you boot the system, the main Reader control
window appears. You can start assays by clicking the Start
button. This begins the Assay Start wizard. You can also
select from a list of ready protocols and start running them
with the Run button.
Reader control window
This is the window used to control and view a run. The
main parts are shown in the figure.
The menu title bar has six titles:
9
Introduction to the UserInterface
File menu
This menu allows Exit from the software.
Edit menu
Not used in Reader control.
View menu
You can use this to go to one of the views e.g. Results, etc.
Keyboard shortcut can also be used and these are shown in
the View menu. If you have a tree displayed then you can
move back or forward in the tree or go up to the next
highest level. You can also select whether you want the
Shortcuts bar and/or the Navigation Tree to appear.
Tools menu
The Assay start Wizard shows you how to optimize and
start running plates.
Before moving the instrument click Prepare Instrument
for Transport. Confirm the selection by clicking OK.
Actions menu
The following functions are available under Action:
Latest Results - display the results that have been most
recently obtained.
Edit protocol –edit the protocol shown in the drop-down
menu on the Reader control toolbar.
Run Assay – start running an assay using the protocol
shown in the drop-down menu on the Reader control
toolbar.
10
Introduction to the User Interface
Pause – this is only enabled if an assay is running. You can
temporarily stop the run and then continue it by clicking
Run. Note that with on-the-fly and HTS AlphaScreen
measurements, measuring continues until the end of the
row before pausing.
Stop – this is only enabled if an assay is running. The run
stops, any results are saved and the instrument returns to
the Idle state.
Unload / Load – the function available depends on if
there is a plate in the instrument to be unloaded, or if there
is no plate, in which case one can be loaded.
Re-stack - this allows you to move plates from the output
stack to the input stack.
Full Screen Plate – select this to see a full screen view of
the counts tab plate. Press Esc or right click the mouse to
close this view.
Help menu
Click this to get help on the use of the software. At any
point during operation pressing the F1 key will cause the
appearance of help information relevant to that particular
operation.
If your software malfunctions, you can select Create
Error Report to generate a report of the software status.
This will help the service person handling your case. The
report is created as a zip file on your computer desktop.
Copy and paste this into an email with information about
the problem and send it to your service engineer.
11
Introduction to the UserInterface
Select Save Screenshot To File if you want a screenshot
of your user interface at any phase in its operation. The file
format is bmp. You must give the path to where the file is
to be saved.
About gives information about the software version.
Reader control toolbar
Below the menu title bar is the toolbar. Some of the
buttons always remain the same, others change according
to the view selected.
Buttons that do not change
Three buttons, Back, Forward and Up, allow you to
navigate in the tree structure of the Navigation Tree. The
same commands are found in the View menu.
You can also view latest results by clicking the Latest
button at the top of the window.
The Logout button appears if you have the Enhanced
Security option.
The Start button allows you to optimize and run plates.
The Assay Start Wizard guides you through these steps.
12
Introduction to the User Interface
Buttons that change
The buttons here depend on the view selected. In the
Reader control view the buttons enabled are Edit, Run
and Load.Pause, Stop and Re-stack are disabled. See the
Action menu for a description of these functions.
The drop-down menu allows you to select the label you are
going to use. Labels with a green bar and an asterisk (*) in
front are valid labels i.e. all the necessary modules and
components are installed..
Configuring your user interface
The View menu allows you to select whether you want the
Shortcuts bar and/or the Navigation Tree or neither to
appear.
13
Introduction to the UserInterface
Navigation Tree
This gives you access to all of the functions of the
workstation. There are various folders e.g. Reader Control,
Results etc. most of which have sub-folders.
If you are in a sub-folder, you can move to the next higher
level by clicking the Up button.
Click the Back button to go to the previous location in the
tree. If you have gone back, you can go forward by
clicking the Forward button. Clicking the arrows beside
one of these buttons allows you to see the possible
locations in the tree and to jump directly to the one you
want.
Clicking the right mouse button leads to a menu:
14
Introduction to the User Interface
Open –opens the selected item
New shortcut – makes a short cut of the selected item
Hide Navigation Tree – closes the navigation tree. Select
it from the View menu to reopen it.
Shortcut Bar
It may be that the Navigation Tree contains a lot more
items than you normally want to use. E.g. if you just work
with Reader control and Results, you may find it more
convenient to use the shortcut bar and set it to only show
these two items.
To edit the contents of the Shortcut Bar, first move the
functions from the Navigation Tree to the Shortcut Bar
by dragging them (or selecting a function in the
Navigation Tree, clicking the right mouse button and
selecting New Shortcut). When you have the items you
want in the Shortcut Bar, you can use the View menu (or
15
Introduction to the UserInterface
right mouse button menu) to close the Navigation Tree.
You can then just use the icons in the Shortcut Bar until
such time as you need some additional function from the
Navigation Tree.
To delete a shortcut from the Shortcut Bar, right click on
a shortcut and select Delete From Shortcut Bar.
With the right mouse button menu, you can also Reset
Shortcut Bar so that it goes to the default configuration
(Reader Control and Results), or Hide Shortcut Bar.
You can also create other shortcut Groups, e.g. you could
have one group with shortcuts for running and viewing
results and a second group connected with protocol editing.
You can freely Delete Group or Rename Group (except
if there is only one group, then it cannot be deleted). You
can select whether you have Large icons or Small icons in
a group depending on what appearance you like.
All these operations are possible with the menu under the
right mouse button.
Note! The Advanced Use group contains all the main icons
from the Navigation Tree.
16
Introduction to the User Interface
Recycle Bin
The Recycle Bin folder stores deleted results, protocols,
plates etc.
To restore a deleted item, select it and click the Restore
button on the toolbar. Alternatively you can click the right
mouse button. A Restore button will appear. Click this.
The item will disappear from the Recycle Bin and will be
restored to the location from which it had been deleted.
Note! When a protocol is deleted, all results measured with
that protocol are also deleted. When you restore a deleted
protocol, any results that were deleted with it are not
restored.
You can also permanently delete all items from the Recycle
Bin. Click the Empty button on the toolbar. Confirm that
you want to permanently delete all items by clicking OK
or click Cancel to avoid deleting the contents of the
Recycle Bin.
17
Introduction to the UserInterface
Note! If you are using Enhanced Security, there are
restrictions on deletion and restoring. See the Enhanced
Security Administrator manual for more details.
Tabs in the Reader control window
In the Reader control window there are four tabs: Counts,
Graph, Temperature or Events.
Reader control window - Counts
Note! If results have been obtained after clicking Run the
intensity of the signal from each well is shown by how the
well is colored. If it is gray, the sample has saturated the
detector.
At the top of the window is information about the
measurement. The status of the instrument is shown and
information is given on what you can do. E.g. if it is Idle
you can start the run by clicking Run.
The side-bar on the right of the window gives you the
following options.
18
Introduction to the User Interface
View
Three option buttons allow you to select how you want
results displayed. The options are: by Color, Value
(numerically) or Color and value.
If you select Color then the stronger the signal, the more
red the color is. The weaker the signal the more blue it is.
If you select Value you will see the actual counts or
absorbance values on a white background.
If you select Color and value, then they will appear on a
colored background where the color shows the signal
strength.
There is a drop-down list where you can select the size of
the plate display. You will need this for numerical values
and higher density plates where the values are hard to read.
Magnification can be up to 300%. Select Size to fit if you
19
Introduction to the UserInterface
want the software to determine the optimum size for seeing
the whole plate.
Note! Press Ctrl F to see a full screen view of the plate.
Press Esc or right click the mouse to close this view.
Track current well checkbox – select this if you want the
current well to be always visible during a live display. This
is useful when the plate is magnified and only some of the
wells appear in the live display.
Color scale
Logarithmic – if this checkbox is not selected then the
scale for the signal intensity is linear.
The range for the scale is selected from the drop-down list
box. If no label has been selected then this will be a
Generic range. If the label is selected then there is a
selection of scales to choose from. These go from Extra
low (1- 1000) to UltraHigh (1 to 100 000 000).
The default range for most labels is UltraHigh and linear
scale.
For fluorescence polarization it is Extra low and linear
scale.
For absorbance the scale is 0 – 6 and logarithmic.
The scale that is selected is then used the next time the
label is measured.
There is also a color scale with sliders. You can move the
sliders using the mouse.
20
Introduction to the User Interface
The numbers by the sliders depend on the scale range
chosen and the position of the slider within that range. Any
results that are smaller than the lower slider will appear in
e.g. violet. Any results higher than the upper slider will
appear in e.g. red.
You can define the colors in Reader settings.
Results between the values of the two sliders will appear in
a color that corresponds to the value.
It is also possible to manually change the range by typing a
value in the box and then pressing Enter.
Note! The type and number of colors used can be changed
in Reader settings.
Reader control window - Graph
Select this view if you are doing Plate or Assay repeats,
Kinetic measurement or Dispense Measurement.
21
Introduction to the UserInterface
The side-bar on the right of the window gives you the
following options.
View
Plate – select this to see a picture of the plate. For each
well you will see a curve showing how the signal changes
with time.
There is a drop-down list where you can select the size of
the plate display. You will need this for numerical values
and higher density plates where the values are hard to read.
Magnification can be up to 300%. Select Size to fit if you
want the software to determine the optimum size to see the
whole plate.
Note! Press Ctrl F to see a full screen view of the plate.
Press Esc or right click the mouse to close this view.
Track current well checkbox – select this if you want the
current well to be visible during a live display. This is
useful when the plate is magnified and only some of the
wells appear on screen.
Overlaid curves – before you select this, click the cursor
on the wells you are interested in. Each time you have
selected a well, click the Add curve button (you can also
double click the well). The well coordinates will be added
to the list under the Overlaid curves button.
22
Introduction to the User Interface
When you have selected all the curves you want, click the
Overlaid curves button. The selected curves will be
displayed with measured values plotted against time.
23
Introduction to the UserInterface
To remove a curve from the display, select it from the
Overlaid curves list and click Remove curve.
Click Remove all if you want to get rid of all curves from
the Overlaid curves list.
Curve scale
These check boxes are only visible if the Plate option is
selected.
Relative to greatest –all the curves are scaled relative to
the greatest value of all the curves on the plate. This
enables you to compare all of the curves but it may hide
the variation in values for each curve if there is a large
difference between curves. If this check box is not selected,
then each curve is scaled independently. This way you get
the greatest range of values for each curve but you cannot
compare the size of curves with each other directly.
Show points – select this if you want the actual points to
be visible. It requires adequate magnification to see the
points.
24
Introduction to the User Interface
Reader control window - Temperature
Temperature and humidity values are shown in this chart.
These values are the temperature inside and outside the
instrument and the humidity inside the instrument.
Consistent AlphaScreen measurements require a stable
temperature. This is ensured by the cold plate which is in
close proximity to the assay plate. You can check from this
chart that the temperature has remained stable during the
time of your measurements. See Temperature control in
the Reference manual for how to set the temperature for
AlphaScreen.
25
Introduction to the UserInterface
The temperature control system allows you to raise and
stabilize the temperature inside the instrument for cellbased and enzyme measurements which require e.g. 37 °C.
See Temperature control in the Reference manual for how
to adjust the temperature control.
The side-bar on the right of the window gives you the
following options.
Values
These are the current temperature around the instrument
(Ambient) and in the instrument at the position of the plate
(Chamber). The humidity in the instrument is also given.
Show raw data – click this to see more detailed
temperature information from:
- the sensor inside the instrument at the position where air
is sucked out of the instrument (right back corner at the
conveyor level). This is a little above ambient.
- the upper sensor above the plate
- the lower sensor below the plate conveyor.
The chamber temperature is obtained from the upper
sensor unless the required temperature is set. In this case
the chamber temperature is the average of the upper and
lower sensors.
Legend
This identifies the different curves on the temperature and
humidity graphs.
26
Introduction to the User Interface
Reader control window - Events
This tab shows a log of the operations performed by the
instrument during a run. The log is in chronological order
with the most recent operation first. The log is cleared
when you shut down the Manager software.
27
Introduction to the UserInterface
Inventory
This window shows you visually which components are
installed in your EnVision. These components are:
Filter slides – individual filters are shown in their slides
Mirror modules (top and bottom)
Tip mounts
Apertures
From this information you can determine if you have the
components installed that are necessary for the operations
you wish to perform. If a component is missing any
protocol that needs it will not be valid i.e. there will not be
an * and a green bar beside the protocol name in the
protocol list.
28
Introduction to the User Interface
Install any missing components and ensure you have a
valid protocol before attempting to run the assay.
Refer to the reference manual for information about setting
up protocols, filters, mirror modules etc.
Refer to the routine maintenance section of the Instrument
manual for how to physically install components.
29
Introduction to the UserInterface
30
Chapter 2
Operating EnVision
31
32
Options for running EnVision
Options for running Envision
The following questions guide you to the information you
need to run EnVision in the best way for you.
Do you have a protocol ready?
No
Yes
Use the Assay Start/
Optimization Wizard under
Tools, or the Start button, to
create and optimize one.
Or go to the protocol editor
Protocols and create a
protocol, then come back to
these questions.
Note! The protocol created by
the Assay Start Wizard has
default parameters for a single
plate and single label. It allows
you to do an optimization and
then run a single plate assay.
You can edit the protocol later.
To start with a protocol using
parameter values different
from the default ones, you
must create it first before using
the Assay Start Wizard.
33
The next question is then
concerned with
optimization.
Options for running EnVision
Do you have the plate and label
combination optimized?
No
Yes
Use the Assay Start
Wizard to do the
optimization.
No protocol barcodes:
Note! Optimization is the
procedure for fine tuning
the parameters for your
plate and label combination
to get the very best results.
For some applications you
can get satisfactory results
by using the default settings
without optimizing. See the
table.
•
•
Use the Assay Start
Wizard
Or select the protocol
and click the Run
button on the user
interface
Protocol barcodes and the
barcode mode selected:
•
•
Note! For multiple label
assays you must run the
Assay Start Wizard for
each label.
Use the Assay Start
Wizard
Or press the START
button on the instrument
These options are described
as well as the use of a
stacker with barcodes or
without barcodes.
Note! If you later change the
label or plate parameters
used in optimization you
must redo the optimization.
34
Options for running EnVision
Types of optimization
Plate dimension optimization (All technologies)
This enables EnVision to determine the exact positioning
of the plate being used. The position of each of the four
corner wells of the plate is measured. It requires a plate
with samples in each of the four corner wells using the
label you intend for normal measurements. E.g. a full plate
is suitable.
Measurement height optimization (All technologies)
This enables EnVision to determine the optimum focal
point for measurement. A single sample is required for this.
Unless you choose otherwise, the strongest sample will be
identified and used. The plate is measured over a range of
35
Options for running EnVision
vertical positions and the one giving the highest signal is
determined.
Monochromator wavelength optimization (Abs)
This optimization determines the wavelength at which
maximum absorbance occurs. A single sample is used.
Select the lower and upper limits of the wavelength range.
Select also the step length between wavelength
measurements and the number of flashes. A plot of
wavelength against counts is displayed and the wavelength
for the lowest counts value is selected. You can adjust the
result manually if required by clicking on the wavelength
you want.
Monochromator wavelength optimization (FI)
This optimization determines the wavelength at which
maximum emission occurs. A single sample is used. Select
the lower and upper limits of the wavelength range. Select
also the step length between wavelength measurements and
the number of flashes. A plot of wavelength against counts
is displayed and the wavelength for the highest counts
value is selected. You can adjust the result manually if
required by clicking on the wavelength you want.
TRF window optimization (TRF)
This optimization determines the best delay between the
excitation flash and the opening of the measurement
window. It also determines the duration of the window.
This minimizes the background fluorescence in the
measurement window while allowing the measurement to
start as soon as possible and be as short as possible, thus
reducing the measurement time. A low and a high sample
are required. The number of flashes to be used for the
36
Options for running EnVision
optimization needs to be selected, the default is 50. Two
sets of results are displayed. The first proposes an optimum
value for the delay, based on the signal to background ratio
obtained. The second proposes the duration of the window.
Three criteria are available for determining the optimum
duration. These come from different parameter values in
the equation: Y = a * S/Smax + b * [S/B]/[S/B]max.
a = 1 b = 0.5
a = 0.5 b = 1
a=1 b=1
Choose between these three options to get the plot that
most clearly helps you determine the window you want to
use. You can adjust the delay and window width manually
if required.
Detector gain optimization (FP and FI)
This optimization determines the optimum gain for the
detector. A single sample is required. This sample should
represent the strongest intensity in the assay. Unless you
choose otherwise, the strongest sample will be identified
and used in the case of fluorescence intensity. For G-factor
optimization in fluorescence polarization a low binding or
free fluorophore sample is needed. The optimum gain is
the one that is the maximum possible without saturating the
detector for high signal samples.
Z’ optimization (All technologies)
The optimization determines how well the sample results
are separated from the background when the scatter of
results is taken into account. Six high samples and six lows
samples are needed. You can select the target Z’ factor, the
default is 0.6. In the results, the minimum number of
37
Options for running EnVision
flashes to achieve the Z’ target is selected. You can adjust
this flash number manually if required.
Flatfield correction
This corrects for variation in the signal across a plate due
to e.g. plate curvature. In such a case the signal at the edges
may be less than at the center due to the difference in
distance from the detector. Identical samples need to be
used in each well of the plate. The system determines the
differences between each part of the plate. The correction
factors calculated are applied to subsequent plate
measurements. Since the position of samples for this
correction cannot be combined with the positions for other
optimizations, this correction has to be performed
separately.
Crosstalk correction optimization (special
luminescence)
This allows the glow crosstalk to be measured and
corrected for. A single normal sample and a blank are used
for the glow crosstalk measurement. Additional blanks are
used to obtain an average blank value. See Special
luminescence for more information about this optimization.
An optimization plate must be used.
Crosstalk correction optimization (AlphaScreen)
This allows three types of crosstalk to be measured and
corrected for. These are: glow, afterglow and bleaching. In
order to measure these different types of crosstalk several
configurations of samples are needed on the plate. The
wizard shows what is necessary. See " AlphaScreen " for
more information about this optimization. An optimization
plate with a specified plate map must be used.
38
Options for running EnVision
Plate orientation
The figure shows how a plate is to be orientated when
loading it manually into the instrument. The same also
applies when loading the plate to a magazine of the stacker.
The A1 position must be in the left corner furthest from
you i.e. the side that enters the instrument first.
Note! If you are using strip plates, make sure the strips are
not sticking up at all but are properly in position, otherwise
the plate may jam in the instrument. Results will not be
correct if strips are not properly in position.
If you are using barcodes, these can be attached to the plate
on the front or back (long) side or right (short) side,
depending on which is selected in Reader Settings.
39
Options for running EnVision
Note! Correct plate labeling, sample preparation and
sample order on a plate are critical factors in obtaining
correct results.
40
Using the Assay Start Wizard
Using the Assay Start Wizard
To get optimum results with EnVision you should optimize
the measurement technology and plate combination you are
going to use in your measurements.
Assay Start Wizard
The Assay Start Wizard guides you through the process
of optimization. If you have an optimized plate and
technology combination you can still use the Assay Start
Wizard to start your run.
Use of an optimization plate
For most technologies you do not need a special
optimization plate, although you can use one. A normal full
assay plate is sufficient. When you have done an
optimization with an assay plate you can start to run it
directly from the Assay Start Wizard.
Note! Special luminescence and AlphaScreen require an
optimization plate to be used.
Click the Start button to start the assay start wizard.
41
Using the Assay Start Wizard
Steps in running the Assay Start Wizard
1. Welcome to the Assay Start Wizard
Click Next.
2. Select action
Three option buttons allow you to select your action.
Select the option button and click Next.
42
Using the Assay Start Wizard
The table shows the different steps of the wizard
depending on the option you have selected
Create new
protocol
Optimize
existing
protocol
Select folder for
new protocol
Run existing
protocol
Select protocol
Select plate
Select technology
Select optimization
Define plate layout
Run optimization
Finish
The following explanation is based on the Create new
protocol option with comments about the other options
where relevant.
Note! The protocol created with the Assay Start
Wizard will use default parameter settings and is for
one plate only. You must use the protocol editor
Protocols if you want to define the protocol parameters
yourself.
43
Using the Assay Start Wizard
3. Protocol
If you are creating a new protocol you will be asked to
tell in which folder the protocol is to be saved. Select
the folder from the tree and click Next.
Note! If instead you are using an existing protocol for
optimization or running, select it from the tree.
Note! If you select a protocol for a run but the protocol
is not optimized, an error message will appear and you
must optimize the protocol.
44
Using the Assay Start Wizard
4. Select plate
Select the plate to be used. The name of the plate
selected will appear at the bottom of the window. Click
Next.
5. Select technology
45
Using the Assay Start Wizard
Select the technology to be used. The name selected will
appear at the bottom of the window. Technologies
marked with * are ready to be used for measurements.
Click Next.
Note! If you are using a protocol with multiple
technologies, you must run the Assay Start Wizard as
many times as there are labels to optimize. When the
final technology is optimized, then you can run the
assay.
6. Optimization information
Note! This step in the wizard and the following ones are
common to both the Create new protocol and
Optimize existing protocol options.
46
Using the Assay Start Wizard
This shows you which optimizations are needed for the
plate and technology combination you have chosen and
if any of these optimizations have been done already.
You can select any or all of the first four optimizations.
The fifth, Flatfield, will be disabled because it cannot be
done at the same time as any of these.
Alternatively, if you select Flatfield correction the other
four will be disabled.
Note! If the optimization involves the TRF laser
technology, there will be a TRF optimization instead of
Detector Gain.
47
Using the Assay Start Wizard
Choose the optimizations you want to be done or
redone. Check boxes allow you to make this selection.
If you click Next without selecting an optimization, the
wizard will jump to the last window.
Note! Check Advanced only if you want to inspect or
change the selections made by the software.
This example continues without Advanced being
selected. See "Advanced Optimization" for examples of
screenshots that appear when Advanced is selected.
Click Next.
48
Using the Assay Start Wizard
7. Plate preparation
The first example shows where samples must be placed
for the optimizations selected when Detector Gain is
one of the optimizations.
The second example shows where samples must be
placed for the optimizations selected when TRF is one
of the optimizations.
49
Using the Assay Start Wizard
If Plate dimension optimization is selected, you must
have samples at least in the corners of the plate, e.g. an
assay plate with samples in every well would be
suitable.
The sample for height optimization can be the same as
the A1 corner well for plate optimization.
The sample for Gain optimization is a separate sample
in well B1.
Z’ optimization requires high and low samples in the
positions shown in the screenshot.
50
Using the Assay Start Wizard
If flatfield correction is select a platemap appears
showing where samples must be placed. Every well
should have an identical sample in it so that the flatfield
correction can be calculated.
When you have ensured that your samples are in the
correct layout in the plate, load your plate and click
Next.
Note! In general, unless you have selected Advanced
you should not edit the Number of Flashes or Size of
the Scanned Area even though you can do this. See
"Advanced Optimization" for information about these
parameters.
Note! If your protocol uses fluorescence polarization,
the Advanced check box will be selected by default. If
51
Using the Assay Start Wizard
Detector Gain optimization is selected, you can select
to use a Blank sample and give the Target mP value.
This is so that you can check that the S and P signal
levels are in a suitable range (200 000 - 400 000 per
flash) and that they match the target mP value.
The blank sample should be put next to the Gain sample
on the cassette.
52
Using the Assay Start Wizard
Note! For AlphaScreen and special luminescence you
must use an Optimization plate with the correct
arrangement of samples to do crosstalk correction.
Crosstalk correction optimization (special
luminescence)
The plate map shows the correct arrangement of
samples.
53
Using the Assay Start Wizard
Crosstalk correction optimization (AlphaScreen)
The plate map shows the correct arrangement of
samples.
54
Using the Assay Start Wizard
Note! The platemap for 1536 AlphaScreen is set so that
samples can be transferred from 384-well plates (shown
in the map) by a robotic system using 384 needles (tips).
8. Optimization progress
This is what you see if the optimizations are selected.
55
Using the Assay Start Wizard
This is what you see if flatfield correction is selected.
9. Results
If TRF optimization is selected you will first be shown a
window with a proposed delay.
56
Using the Assay Start Wizard
You can accept this or move the cursor to the delay you
want. Then click Next.
The proposed window setting will appear. Once again
you can approve it or modify it by moving the cursorThen click Next.
Note! These windows will not appear if TRF is not
selected.
The next window only appears if Z’ is selected.
57
Using the Assay Start Wizard
You will be shown the results of the Z’ optimization and
asked to check it and if necessary change the number of
flashes to be used.
58
Using the Assay Start Wizard
You can also see the results numerically.
When you have done this, click Next. The last window
of the wizard will appear.
59
Using the Assay Start Wizard
10.
Wizard completed
The Start the Assay check box in the last window of
the wizard allows you to select if you actually want to
run a plate using the optimization just done, or if you
just want to save the optimization information. For
optimizations where a special optimization plate is not
necessary, this box will be checked by default. If an
optimization plate is necessary, the box will be
unchecked by default. In the latter case the window will
just close when you click Finish.
If Start the assay is checked, the currently loaded plate
will be run and the results displayed.
You can add a note that will be included in Result
Notification.
60
Running an assay without the Assay Start Wizard
Running an assay without the Assay Start
Wizard
There are different ways of operating EnVision depending
on the combination of plate loading method and barcode
setting you have. Read the text describing the combination
you are going to use.
Note! Before beginning any loading make sure your plates
are orientated properly.
Running an assay (no protocol barcodes,
no stacker)
1. If the plate carrier is in the instrument, press the LOAD
button or click the Unload button on the toolbar.
The plate carrier will come out.
61
Running an assay without the Assay Start Wizard
Note! The software button shows Unload if the plate
carrier is in the instrument and Load if it is out.
2. Load your first plate. Make sure the plate is orientated
correctly with the A1 position in the left hand corner
furthest from you.
3. Select the protocol you want to use from the drop-down
list of protocols.
62
Running an assay without the Assay Start Wizard
4. Use the mouse to click the Run button on the user
interface. The plate carrier with the plate will go into the
instrument and measurement will begin.
Note! If START is pressed on the instrument, the last
run protocol is repeated, not the one selected from the
drop-down list.
During a run you can click either the Pause or Stop
buttons on the toolbar if you need to pause or stop the
measurement.
Pressing the STOP button on the instrument has the
same effect.
5. You can follow the measurement by means of the plate
map with colors indicating the intensity of the signal
63
Running an assay without the Assay Start Wizard
from each well. At the top of the window there is
information about the status of the measurement.
Depending on the measurement, you can select the
Source of the signal (e.g. which channel is displayed)
from the drop-down list (fluorescence polarization also
has the mP value calculated).
6. When the plate has been measured, the plate carrier will
come out and you can remove the plate. If more than
one plate has been defined in the protocol then load the
next one.
7. Press the START button on the instrument or click Run
on the user interface.
Continue this procedure until the run stops. It will stop
automatically when the number of plates defined in the
protocol has been reached.
If Number of Plates is Unlimited, you have to press
STOP or click Stop to end the protocol.
Running an assay with protocol barcodes
(no stacker)
Note! Make sure you set the barcode mode in Reader
settings under the Barcode tab. You must select there the
barcode to be read and then either select Define the
protocol using or Split barcode for the protocol. You
must also have defined the links between the barcodes and
protocols as described in Barcode settings.
Note! In Barcode mode the Run button is not enabled.
64
Running an assay without the Assay Start Wizard
1. If the plate carrier is in the instrument, press the LOAD
button or click the Unload button on the toolbar.
The plate carrier will come out.
Note! The software button shows Unload if the plate
carrier is in the instrument and Load if it is out.
2. Load your first plate. Make sure the plate is orientated
correctly with the A1 position in the left hand corner
furthest from you. The plate should have a barcode on it
to select the protocol to be used to count it.
3. Press the START button on the instrument. The plate
carrier with the plate will go in to the instrument and
measurement will begin. During a run you can click
either the Pause or Stop buttons if you need to pause or
stop the measurement. Pressing the STOP button on the
instrument has the same effect.
4. You can follow the measurement by means of the plate
map with colors indicating the intensity of the signal
from each well. At the top of the window there is
information about the status of the measurement.
5. When the plate has been measured, the plate carrier will
come out and you can remove the plate. If more than
one plate has been defined in the protocol then load the
next one.
6. Press the START button on the instrument.
65
Running an assay without the Assay Start Wizard
Continue this procedure until the run stops. It will stop
automatically when the number of plates defined in the
protocol has been reached.
Note! If plates after the first one have no barcodes they will
be counted with the protocol defined by the first plate
barcode. If they have their own barcode then the protocol
defined by that barcode will be used to count the plate.
Running an assay with a stacker (no
protocol barcodes)
1. Load the stacker. In Reader settings Stacker you can
select which stacker is for loading plates and which for
unloading. Make sure the plates are orientated correctly
with the A1 position in the left hand corner furthest
from you.
Note! Check that the handles of both magazines are
down during a run so that the plates can move upwards
without hindrance.
66
Running an assay without the Assay Start Wizard
2. Select the protocol you want from the drop-down list of
protocols.
3. Use the mouse to click the Run button on the user
interface.
During a run you can click either the Pause or Stop
buttons if you need to pause or stop the measurement.
Pressing the STOP button on the instrument has the
same effect.
Note! If you want to run assay repeats with an undefined
number of plates in the magazine (i.e. select Unlimited)
then select “End the assay when stacker is out of plates”
in Reader settings Stacker.
4. You can follow the measurement by means of the plate
map with colors indicating the intensity of the signal
from each well. At the top of the window there is
information about the status of the measurement.
All the plates in the stacker will be measured if you have
selected the Unlimited number of plates mode in
Protocols. Otherwise the run will stop when the selected
number of plates has been counted.
Running an assay with a stacker and
protocol barcodes
Note! Make sure you set the barcode mode and have
defined the links between the barcodes and protocols as
described in Barcode settings.
67
Running an assay without the Assay Start Wizard
1. Load the magazines into the stacker. One of the
magazines should have plates loaded in it and the other
should be empty. In Reader settings Stacker you can
select which stacker is for loading plates and which for
unloading. Make sure the plates are orientated correctly
with the A1 position in the left hand corner furthest
from you. At least the first plate should have a barcode
on it to select the protocol to be used to count it.
Note! Check that the handles of both magazines are down
during a run so that the plates can move upwards without
hindrance.
2. Press the START button on the instrument. The plate
carrier with the plate will go in to the instrument and
measurement will begin.
During a run you can click either the Pause or Stop
buttons if you need to pause or stop the measurement.
Pressing the STOP button on the instrument has the
same effect.
3. You can follow the measurement by means of the plate
map with colors indicating the intensity of the signal
from each well. At the top of the window there is
information about the status of the measurement.
All the plates in the stacker will be measured if you have
selected the Unlimited for the Number of plates parameter
in Protocols. Otherwise the run will stop when the selected
number of plates has been counted.
68
Running an assay without the Assay Start Wizard
Note! If plates after the first one have no barcodes they will
be counted with the protocol defined by the first plate
barcode. If they have their own barcode then the protocol
defined by that barcode will be used to count the plate.
Buttons on EnVision
These buttons have the following functions:
START button
This button will light up when you press it and remain lit
as long as a measurement is continuing. If the plate carrier
is out when you press the START button, the carrier will
go into the instrument and the measurement will start with
the last protocol that has been run. If the system has just
been switched on there is no previous run and no
measurement is done.
69
Running an assay without the Assay Start Wizard
When a plate has been measured, the plate carrier will
come out. If other plates have been defined in the protocol,
the START light will be on. If all the plates required by the
protocol have been measured, the START light will be off.
STOP button
The light on this button will be lit as long as no
measurement is occurring.
If there is a run occurring and you press this button the run
will stop and the plate carrier will come out and the STOP
light will come on.
The raw results of the samples measured up to the time
when the STOP button was pressed will be valid.
LOAD button
Press the LOAD button to bring out the plate carrier so that
you can load a plate. When you have loaded the plate,
either press the LOAD button again or press START to
move the plate carrier and plate into the instrument. The
LOAD button will light up during the time the loading or
unloading is occurring, otherwise it will be off.
Order of Dual label measurement in single
detector instruments
In the case of single detector instruments, a different
procedure is followed for dual label measurements than for
instruments with two detectors. This is to decrease the
70
Running an assay without the Assay Start Wizard
number of times the emission slide moves and to speed up
the measurement of dual labels. The order of
measurements is:
•
•
•
•
Well 1 emission slide position 2 followed by emission
slide position 1
Well 2 emission slide position 1 followed by emission
slide position 2
Well 3 emission slide position 2 followed by emission
slide position 1
etc.
Note! This is valid for Dual excitation labels which are
always measured with one detector (e.g. two excitation
filters and one emission filter as in the case of the Fura-2
label shown with the Dispenser option in simulation
mode).
71
Running an assay without the Assay Start Wizard
72
Chapter 3
Result viewing
73
74
Result viewing
Result viewing
To see results click on Results in the Navigation Tree. A
list of assays and dates will appear.
In the view window a number of selection criteria appear.
If you have many protocols, use a selection criterion to
limit what appears so that you can more easily find the one
you want. More than one selection can be used at the same
time.
Note! All results of a protocol can be viewed under the
protocol in the Result folder.
75
Result viewing
Results filters
The selections are:
Selection by protocol
Select the protocol from the drop-down list.
Selection by amount
You can select how many of the most recent results are
listed.
Selection by date and time
Give the first date and time and the last date and time for
the period you want to select.
Note! Each time you make a change to the selection
settings, you must click the Refresh button. Any assays in
the selected range will be listed in a pane below the filter
options along with their date and time of running.
The example shows the results of selecting by Protocol.
76
Result viewing
Results toolbar buttons
In the variable part of the Results toolbar there are three
buttons:
Filter
If you click this button once, the filter options disappear
leaving only the assay list. Click it again and the filter
options reappear.
Open
Clicking this button when you have selected an assay from
the list of assays causes the results of the run to be
displayed in a separate window. You can also double-click
on the result to open it.
Delete
Select the results you want to delete.
You can select several adjacent results by holding down
the left mouse button and dragging the cursor over the ones
you want. Hold down the Ctrl button and click individual
results to select results that are not adjacent. When the
results are selected, click the Delete button. Confirm the
deletion by clicking OK.
Note! Results can be restored from the Recycle Bin
provided it has not been emptied
77
Result viewing
Latest
The Latest button enables you to see the results of the
most recent run. It opens a separate results window just
like the one that appears when you select Open.
Results window
When you open the results window you will see the results
tree in the left pane. Click on a branch to see the
corresponding view.
Assay
This displays information about the assay.
78
Result viewing
Protocol
This displays the parameters of the protocol used to run the
assay. Select either a short list with the Basic tab or a
longer list with the Extended tab.
79
Result viewing
Notifications
If any error messages or warnings have been produced,
they will appear if you click Notifications. A yellow
exclamation mark shows a warning e.g. if the signal has
been too high so that the detector is saturated. A red cross
along with the Assay ID icon shows an error. Other
notifications are in blue.
Plate
Selecting this will show information about the plate.
80
Result viewing
Group
This view has three tabs. The first two, Counts and Graph
(the same as Kinetics) correspond to those described in
Reader control.
81
Result viewing
The same features and side-bar functions are available as in
Reader control.
The third tab, List, shows results in the form of a list of
numerical values.
Note! In Group view, any saturated result will be
highlighted with gray under the Counts tab.
82
Result viewing
Calculations
All the calculations selected for the protocol are listed.
Note! If a calculation error has appeared in Notifications,
the calculation that has been defined might disappear from
the list with no results shown.
To see the results of these calculations, click on them one
by one in the navigation tree. Each time you select a
calculation, the main pane in the window will show the
results of the calculation.
83
Result viewing
Normally the Counts view will be open but if the
calculation is curve fitting, the Graph view will open
automatically to show the curve. This shows the points
from the standards that were measured and the curve fitted
to them. Clicking the Show fitting info check box causes
additional information to appear beside the curve.
Curve fitting calculations
84
Result viewing
If you click on one of the unknowns listed in the right hand
pane, the intercept with the curve from the response of the
unknown and the appropriate concentration will be shown
on the graph. If the response of the unknown is outside that
of the range of the calibration curve, no intercepts will be
shown on the graph. The response and concentration values
will be listed in red instead of the normal black.
To edit the curve, select the Calc button from the toolbar.
A new window appears showing a curve and various curve
fitting parameters (see Advanced parameters) as well as
the concentrations of the standards and the units.
There is a button Advanced parameters giving you the
following options:
85
Result viewing
Show info frames – an extra pane appears with more
information about the curve including the slope, the
intercept, the estimated dose at various percentages and the
variance.
86
Result viewing
Edit fitting parameters – a dialog appears allowing you to
set many parameters which affect the curve fitting. Some
of the parameters to do with curve fitting also appear in the
main calculation window.
Fitting: select from the following types:
Linear regression
Spline – in this case the Spline smooth parameter is
enabled
4PL
5PL
MichaelisMenten
Spline smoothing: this only appears if Spline is
selected. You can select the amount of smoothing
applied to the Spline curve from simple interpolation
87
Result viewing
through various percentages of smoothing to full autosmoothing
Weighted fit: click this check box if you want the fit to
be weighted
Curve direction: select if the curve must go up or down
or without a special direction
Transformations for the X and Y axes: Hyperbolic,
Logarithmic or None in the case of the X axis and many
more in the case of the Y axis
Scale factor for the X and Y axes: for hyperbolic
transformations select from: Log, 0.1,1 or 10
Curve read only parameters: these cannot be changed,
they just tell about the: Fitting status, Intercept,
Summing count and Variance ratio
Curve name: You can edit the name in this field if you
want
Outlier rejection: you can set criteria for rejecting
outliers. If a point satisfies one of these criteria then it
will be rejected and not included in the curve
Adjust with reference curve: the default selection is
No but you can also select Constant or Linear. In these
cases the other parameters are enabled so that you can
edit them if required.
Edit display parameters: you can adjust how the curve is
displayed by changing these parameters. You can
88
Result viewing
experiment with the options and check boxes to see which
one gives you the display you want.
There are three tabs.
In the first one the option buttons allow you to select which
metrics are to be used and if a difference plot is displayed.
The next tab shows check boxes which determine the way
the curve is displayed.
89
Result viewing
The last tab gives you options to select the axis boundary
limits.
90
Result viewing
Activate/Inactivate replicate points: if you want to see
the effect of omitting a replicate point, you can do this by
unchecking the box for the point.
The unused point appears as an open square on the graph
instead of a cross.
91
Result viewing
Show gridlines: this toggles the gridlines on and off
Calc unknowns: type in a response value and see the
concentration calculated from the curve. The response
value must be within the range of the curve
92
Result viewing
Other types of calculations
If you select a calculation that does not use a curve e.g.
Average of type, then the display is different:
If you now click the Calc button, the display shows details
of the calculation:
93
Result viewing
Adding additional calculations
Note! If a calculation was not added to the protocol prior to
measurement, it can be done afterward. First click the Calc
button in the Results window.
94
Result viewing
In the calculation window that appears, select the arrow
beside the Calc button to see the list of calculations:
Note! The calculations available depend on the measured
labels and the measurement operations.
Select the calculation type you want to add. The new
calculation will be added to the calculation list.
95
Result viewing
There may be parameters you need to set. See
"Calculations" in the Reference manual for more
information.
Click Apply to obtain results using the calculation. The
Results window will open with the additional calculation
added.
Note! The raw data is not changed by adding or removing
calculations.
96
Result viewing
To delete a calculation, click the Calc button to get the
calculation window. Select the calculation you want to
delete, then click the Delete button then click Apply.
If you click the Cancel button instead of Apply, the
calculation window will close without making changes.
97
Result viewing
Export
Clicking this button on the toolbar allows you to send
results to a file and/or printer. The options for the format of
the output are the same as described in Protocol Output.
.
98
Chapter 4
Advanced Optimization
99
100
Advanced optimization
Advanced Optimization
These windows normally appear only if you selected
Advanced in the Optimization Info window of the Assay
Start Wizard. Only the additional advanced windows are
described here, otherwise operation is as described in
Assay Start Wizard. In normal optimization you would
not change these parameters but you may want to as part of
Advanced optimization.
Plate dimension optimization
The plate map parameters are as follows.
101
Advanced optimization
Number of flashes
You can select the number of flashes to be used. This can
be different from the number set in the label parameters.
E.g. if in the label parameters the number of flashes is set
to 30 you can change it to e.g. 10 to speed up the
optimization process. With AlphaScreen the measurement
time is fixed and it cannot be changed. The measurement is
made with an AlphaScreen sample.
Size of scanned area
Enter the size of the edges of the area of the wells to be
scanned. See the table for typical size settings.
Size settings
No. of wells
Spacing of
centers
(mm)
Typical size
setting
(mm)
Allowed
range (mm)
1536
2.25
1.8
1 - 4.5
384
4.5
2.7
1 - 9.0
96
9
6.3
1 - 18
Note! There are 10 movements in the scan (in both the
horizontal and vertical directions producing a measurement
of 121 points in an 11 x 11 array).
102
Advanced optimization
Z’ value target
Give the Z’ target value. This is typically between 0.6 and
1.0.
When you click Next the optimization will begin.
If Plate optimization has been selected a window will
appear with four tabs each with a picture showing the
distribution of signal intensity across a corner well. These
pictures are to enable you to mark the center of each well.
This will be the area with the most intense signal (in the
case of absorbance the signal will be lowest here). Color
coded contours show the signal intensity with red the most
intense.
The order of the wells is:
Well 1 - upper left corner
Well 2 - upper right corner
Well 3 - lower left corner
Well 4 - lower right corner
103
Advanced optimization
Note! In fluorescence intensity and fluorescence
polarization measurements, the signal should not exceed
500 000 RFUs for a single flash, otherwise saturation of
the detector may occur and you will not be able to be sure
of the position of greatest intensity. In this case, and if the
red area is not symmetrical, you should point to the center
of the corner well as indicated by the general shape of the
contours.
The crosshairs should be in the centre of the well. If they
are not, you can move them with the mouse or by clicking
the Step arrows. You can also select the size of the step.
When you are satisfied with the position for each well,
click Next.
104
Advanced optimization
Measurement height optimization
If you leave the Scan plate for strongest sample check
box checked then the position of the sample to be used for
the measurement height optimization is determined by the
system.
If you uncheck this box, you can either accept the default
position which is shown in the plate map
105
Advanced optimization
or you can show the position of the sample you want to use
by clicking on the plate map using the left mouse button
and selecting the word Height that appears in the tool tip.
When you click Next, the optimization will begin.
106
Advanced optimization
An additional window will appear to allow you to
manually adjust the optimum height of the plate. Click the
height you want to select. The red line will move to that
position and the height at that position will be displayed.
Click Next to continue.
Detector gain optimization (FI and FP)
If you leave Scan plate for strongest sample checked, the
position of the gain sample is determined by the system.
Note! When you use the Scan plate for strongest sample
option in fluorescence polarization, it is recommended that
you check with a low binding assay sample that the S and
P signal levels are in a suitable range (200 000 - 400 000
per flash) and that they match the target mP value which is
shown as part of the optimization results.
If you uncheck this box, you can either accept the default
position that is shown in the plate map (along with the
Height sample if that optimization has been accepted)
107
Advanced optimization
or you can show the position(s) of the sample(s) you want
to use by clicking on the plate map using the left mouse
button. Select the sample type, Height or Gain.
108
Advanced optimization
When you click Next, the optimization will begin. An
additional window will appear to allow you to check and, if
you want, to adjust the gain.
Click Next to go to the final window of the wizard.
109
Advanced optimization
Crosstalk correction optimization (Enh.
lum. and Ultra Sensitive lum.)
After you have run the optimization, as described in Assay
Start Wizard, the results will appear:
You can also click the tab to see the Raw results.
Click Next to go to the final window of the wizard.
110
Advanced optimization
Crosstalk correction optimization
(AlphaScreen and HTS AlphaScreen)
After you have run the optimization, as described in Assay
Start Wizard, the results will appear:
You can also click the tab to see the Raw results.
Click Next to go to the final window of the wizard.
111
Advanced optimization
112
Chapter 5.
Dispenser control
113
114
Dispenser Control
Dispenser Control
Click Dispenser Control to access functions and
parameters involved in the operation of the dispenser.
There are two tabs: Maintenance and Settings.
Maintenance
You can perform maintenance operations with the
dispenser by selecting the pump and the operation.
Initialization
Select the pump or pumps to be initialized then click the
Init button to perform initialization.
115
Dispenser control
Initialization resets the pumps by setting the valves and
syringes to their home positions. This may involve liquid
being expelled through the aspiration tube into the liquid
reservoir. If you are not sure what liquid was used last,
direct the aspiration tube into an empty reservoir to avoid
accidentally mixing liquids.
Note!: the other maintenance operations are disabled until
Init has been clicked and initialization performed.
Rinse
This operation allows you to dispense a selected volume of
liquid into the waste container. You can use this operation
to empty tubing if you perform it with the inlet tube in air.
Click Next to continue.
This operation allows you to rinse the tubing of the
selected pump or pumps.
116
Dispenser Control
Select the tip mount to be used. This must be the one in the
instrument as shown by the * mark.
See Show advanced options for some extra parameters
you can edit.
Click Next to continue or Back to return to the
Maintenance page.
117
Dispenser control
Click Start or press the PUMP1 button on the dispenser.
Rinsing will then take place.
An animation will show what is happening.
You can repeat this operation if required to rinse with
PUMP2.
Click Finish. The Maintenance display will reappear.
118
Dispenser Control
Note! If any PUMP button is pressed while the dispenser is
operating, that operation will be terminated immediately
and dispenser initialization must be done again.
Fill tubing
This operation aspirates enough liquid to fill the tubing. A
small extra amount (about 150 µL) will be aspirated to
ensure there are no air bubbles in the tubing. The excess
will be dispensed into the waste container.
Click Next when you have selected this option.
This operation allows you to fill the tubing of the selected
pump or pumps.
Select the tip mount to be used. This must be the one in the
instrument as shown by the * mark.
119
Dispenser control
See Show advanced options for some extra parameters
you can edit.
Click Next.
Click Start or press the appropriate PUMP button on the
dispenser. Tubing will be filled.
120
Dispenser Control
An animation will show what is happening.
You can repeat this operation if required to fill tubing for
PUMP2.
Click Finish. The Maintenance display will reappear.
Retrieve liquid
121
Dispenser control
Returns liquid from the syringe and tubing to the liquid
reservoir (use this if the liquid is expensive reagent!).
Click Next when you have selected this option.
Select the pump or pumps from which you want to retrieve
liquid.
Select the tip mount to be used. This must be the one in the
instrument as shown by the * mark.
See Show advanced options for some extra parameters
you can edit.
Click Next.
122
Dispenser Control
Click Start or press the PUMP button on the dispenser.
Liquid will be retrieved to the liquid reservoir.
An animation will show what is happening.
You can repeat this operation if required to retrieve liquid
from PUMP2.
Click Finish. The Maintenance display will reappear.
123
Dispenser control
Test dispense
This operation allows you to dispense a set volume into the
waste container.
Click Next when you have selected this option.
Note! When the instrument lid is open, you can, by hand or
with a tool, move the tip mount outside the instrument so
that you can observe the flow of liquid through the tip. In
this case the tip mount used must be identified.
124
Dispenser Control
Select the pump or pumps with which you want to do a test
dispense.
Select the tip mount to be used. This must be the one in the
instrument as shown by the * mark.
See Show advanced options for some extra parameters
you can edit.
Click Next.
125
Dispenser control
Click Start or press the PUMP button on the dispenser.
Liquid will be dispensed to the waste container.
An animation will show what is happening.
You can repeat this operation if required to dispense liquid
from PUMP2.
Click Finish. The Maintenance display will reappear.
Empty syringe
This operation drives the syringe to the empty position.
Liquid will be expelled into the liquid reservoir.
126
Dispenser Control
Click Next when you have selected this option.
Select the pump or pumps with the syringe(s) you want to
empty.
See Show advanced options for some extra parameters
you can edit.
Click Next.
127
Dispenser control
Click Start or press the PUMP button on the dispenser.
The syringe will be emptied into the liquid reservoir.
You can repeat this operation if required to empty the
syringe of PUMP2.
Click Finish. The Maintenance display will reappear.
128
Dispenser Control
Fill syringe
This operation drives the syringe to the full position.
Liquid will be aspirated from the liquid reservoir to fill the
syringe.
Click Next when you have selected this option.
129
Dispenser control
Select the pump or pumps with the syringe(s) you want to
fill.
See Show advanced options for some extra parameters
you can edit.
Click Next.
Click Start or press the PUMP button on the dispenser.
The syringe will be filled from the liquid reservoir.
130
Dispenser Control
You can repeat this operation if required to fill the syringe
of PUMP2.
Click Finish. The Maintenance display will reappear.
Show advanced options
Select Show advanced options if you want to see or
change certain basic parameters. If you do not select this
option then the default values will be used. There are two
sets of identical parameters for Pump1 and Pump2.
131
Dispenser control
(Total) Volume
This parameter determines the volume of liquid aspirated.
For Rinse the default is 2000 µl and the range 500 – 10000
µl. The parameter name is Total volume because several
dispensings occur and this parameter is the total volume
used for all the dispensings.
For Fill the default is 50 µl and the range 50 – 10000 µl.
The parameter name is Volume.
For Test the default is 50 µl and the range 2 – 475 µl. The
parameter name is Volume.
132
Dispenser Control
Speed 100 – 500 µl/s
This parameter determines the volume per second of liquid
aspirated. The default is 200 µl/s. The more viscous the
liquid the higher the speed you should use.
Tip tube volume 50 – 2000 µl
The volume of the tube between the syringe and the tip
mount is known for a particular tip type and this volume
appears as the default parameter value. The software
allows you to change this value if it is necessary.
Aspiration tube volume µl
The value of this parameter is fixed here but can be
changed under the Settings tab.
Total tube volume µl
This is the sum of the Tip tube volume and the Aspiration
tube volume.
If you change these parameters and want to save the
changes, select Remember settings.
Settings
Select the Setting tab to see these parameters.
Note! the following settings only take effect if you click
the Set button.
133
Dispenser control
Stirring
Select this check box and then select the speed to be used
for stirring the liquid in the liquid reservoir. The range is
100 to 500 revolutions per minute.
Heating
Select this check box and then select the temperature for
the liquid in the liquid reservoir. The range is 25 to 60 ºC.
Advanced settings
Select this to see extra parameters for both Pump1 and
Pump2.
Connected to tip – select which tip you want each pump
to be connected to: 1, 2 or None.
Aspiration speed is x% of dispensing speed – the range
is 5 to 100% and the default 70%.
Aspiration tube volume – set the volume for the
aspiration tube if it is different from the default 270 µl. The
allowed range is 50 to 700 µl. This value is used in Show
134
Dispenser Control
Advanced options for the various dispense operations to
calculate the Total tube volume by adding it to the Tip
tube volume.
Dispenser guidelines
When starting operation
Perform Initialization when:
- you have switched on EnVision
- software is rebooted after being completely shut down
- you have pressed a PUMP button during dispenser
operation
The software will tell you that you cannot run assays
requiring dispensing if you have not initialized the system.
Before daily work
At the beginning of a working day we recommend that you
perform the following operations depending on the
situation:
- if the tubing has been rinsed and emptied when operation
finished the previous time, (recommended procedure) then
Fill the tubing with reagent.
- if reagent has been left in the tubing (not recommended),
some may have been lost through evaporation. First
Retrieve the reagent and then Fill the tubing.
135
Dispenser control
- if rinse liquid has been left in the tubing, then you have to
get rid of this before dispensing reagent. You can Retrieve
the rinse liquid and then Fill the tubing. Alternatively you
can empty the tubing using Rinse without aspirating any
liquid i.e. with the inlet tube in air. Then replace the inlet
tube in the reagent reservoir and Fill the tubing.
After operation
Empty syringe then Retrieve reagent back into the
reagent reservoir. Replace this reservoir with one
containing rinse liquid. Rinse the tubing. Either leave the
tubing filled with rinse liquid or empty it i.e. Rinse with
the inlet tube in air.
All these operations, as well as others, can be found under
the Maintenance tab when you click Dispenser Control.
Changing a tip mount
Note! before changing a tip mount, the tubing should be
emptied. You can do this by selecting Retrieve liquid or
Rinse with the inlet tube in air. To change a tip mount
follow the instructions in the Routine maintenance part of
the Instrument manual.
136
Index
137
138
Index
Index
Calculation
Adding additional, 103
Calculations, 90
Deleting, 106
Color, 20, 31
Color coding, 20
Color scale, 22
Generic range, 22
Logarithmic, 22
Colors, 14
Connected to tip, 146
Control unit, 6
Conventions used, 8, 9
Buttons, 8
Navigation Tree items, 8
Counts, 88
Counts view, 91
Crosstalk correction optimization,
58, 59, 120, 121
AlphaScreen, 41
Enhanced luminescence, 41
HTS AlphaScreen, 41
Ultra Sensitive lumines., 41
Curve fitting, 92
Calculate unknowns, 100
Curve parameters, 93
Editing display parameters, 97
Fitting options, 95
A
Absorbance, 3
Active protocols, 68, 73
Add curves, 24
Advanced settings, 145
AlphaScreen, 3
Aperture, 30
Aspiration speed, 146
Aspiration tube volume, 144, 146
Tip tube volume, 146
Total tube volume, 146
Assay
Results, 85
Assay combinations, 67, 70, 72,
74
Assay Start Wizard, 45, 111
Asterisk, 14, 31
B
Barcode
Running with, 70, 74
Buttons on the instrument, 75
C
Calc, 83
139
Index
Replicate points, 99
Show gridlines, 100
Show info frames, 93
Curve fitting types, 95
Curve parameters, 93
Curve scale, 26
Relative to greatest, 26
Show points, 26
D
Delete, 83
Detector gain optimization, 39,
117
Different combinations, 76, 77
Dispenser, 4
Dispenser control, 125
Animation, 129
Maintenance, 148
Settings, 144, 145
Show advanced options, 127,
142
Dispenser guidelines, 146
Dual label measurement, 77
E
Edit protocol, 12
Empty syringe, 137
Empty tubing, 148
Empty tubing with rinse, 127
EnVision
With stacker, 4
Without stacker, 5
Exit, 6
Export, 107
F
File, 11
Fill, 130, 147
Fill syringe, 140
Filter, 83
Filters, 30
Fitting options, 95
Flatfield correction, 40, 51
Fluorescence intensity, 3
Fluorescence polarization, 3
G
Gain
Detector gain optimization, 39
Generic range, 22
Graph, 23
Graph view, 91
Grid view, 19, 23
Group, 88
Counts, 88
Kinetic, 88
List, 88
Results, 88
Guidelines for dispenser use, 146
H
Heating, 145
Help, 12, 13
140
Index
Init button, 125
Initialization, 125
Retrieve liquid, 133
Rinse, 127
Test dispense, 135
Maintenance tab, 148
Measurement height optimization,
38, 115
Menu title bar, 11
File, 11
Help, 12
Pages, 11
Settings, 11
Mirror modules, 30
Monochromator, 3
Absorbance, 38
Fluorescence intensity, 38
About, 13
Create Error Report, 13
Save Screenshot to File, 13
I
Init button, 125
Initialization, 146
Installation of software, 5
Instrument buttons, 9
Inventory, 30
K
Kinetic, 88
Kinetics, 23
L
Laser option, 3
List, 89
Load button, 67, 71
LOAD button, 67, 71, 77
Loading plates, 42
Logarithmic, 22
Logout, 14
Luminescence, 3
N
Navigation tree, 8, 15
Back button, 15
Forward button, 15
Right mouse button, 16
Up button, 15
Notifications
Results, 87
Number of flashes, 111, 112
Number of Flashes, 56
M
Magazines, 74
Maintenance, 125
Empty syringe, 137
Fill, 130
Fill syringe, 140
O
Open, 83
Optimization, 111
141
Index
Advanced, 56
Assay notes, 66
Crosstalk correction, 120, 121
Detector gain, 39, 54, 117
Detector Gain, 57
Flatfield, 51
Flatfield correction, 40
Measurement height, 38, 115
Monochromator, 38
Number of flashes, 56
Plate dimension, 37, 111
Plate maps, 55
Size of scanned area, 56
TRF window, 39, 54, 61
Wavelength, 38
Z', 40, 63
Z' target value, 113
Optimization plate, 45, 65
Output, 4
Overlaid curves, 24
Remove all, 26
Overview, 3
P
Pause button, 69, 71, 73, 75
Plate
Loading, 42
Optimization, 45, 65
Orientation, 42
Results, 87
Plate dim. optimiz., 37, 55, 111
Plate view, 19, 26
Prepare inst.for transport, 11
Protocol
Results, 85
Pump
Connection to tip, 146
PUMP button, 128, 131, 134, 137,
139, 141
R
Reader control, 19
Counts, 19
Events, 19
Kinetics, 19
Temperature, 19
Reader control window, 10
Menu title bar, 10
Toolbar, 10
Relative to greatest, 26
Remember settings, 144
Remove curve, 26
Result view
Export, 107
Results, 81
Assay, 85
Group, 88
Notifications, 87
Plate, 87
Protocol, 85
Refresh, 82
Selection by amount, 82
Selection by date and time, 82
Selection by protocol, 82
142
Index
Groups, 17
Large icons, 17
New shortcut, 16
Rename groups, 17
Reset shortcuts bar, 17
Right mouse button, 17
Small icons, 17
Show advanced options, 142
Show fitting info, 91
Show points, 26
Size of the scanned area, 112
Size of the Scanned Area, 56
Size to fit, 24
Software, 4
Software installation, 5
Speed, 144
Speed of stirring, 145
Stacker, 6, 74
Magazines, 72, 74
Running with, 72, 74
Start, 128, 131, 134, 137, 139, 141
Start button, 73
START button, 36, 72, 73, 74, 76
Stirring, 145
Stop button, 69, 71, 73, 75
STOP button, 69, 71, 73, 75, 77
Strip plates, 42
Switch on, 6
Results tree, 85, 87, 88
Results window, 84
Retrieve, 147
Retrieve liquid, 133
To empty tubing, 148
Rinse, 127, 147
Aspiration tube volume, 144
Show advanced options, 142
Speed, 144
Tip tube volume, 144
To empty tubing, 148
Total tube volume, 144
Total volume, 143
Run button, 69
Run log, 29
S
Save Screenshot to File, 13
Scan plate for strongest sample, 56
Scanning, 4
Settings, 145
Advanced settings, 145
Aspiration speed, 146
Aspiration tube volume, 146
Connected to tip, 146
Heating, 145
Set button, 145
Stirring, 145
Shaking, 4
Shortcuts bar, 16
Delete, 17
Delete groups, 17
T
Temperature, 27
Temperature of reservoir, 145
143
Index
Test dispense, 135
Time-resolved fluorometry, 3
Homogenous, 3
Tip
Connection to pump, 146
Tip mount, 127, 130, 133, 136
Tip mounts, 30
Tip tube volume, 144
Toolbar, 13
Total tube volume, 144, 146
Aspiration tube volume, 146
Total volume, 143
Track current well, 21, 24
Transport - prepare for, 11
TRF window optimization, 39
V
Value, 20
View, 20, 24
Both, 20
Color, 20
Overlaid curves, 24
Plate, 24
Size to fit, 21, 24
Track current well, 21, 24
Value, 20
W
Wavelength optimization, 38
Wizards
Assay Start, 111
U
Unlimited, 74, 75
Unload button, 67, 71
Z
Z' optimization, 40
144