1
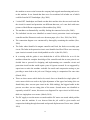
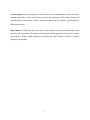
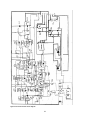
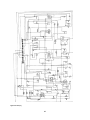
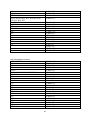
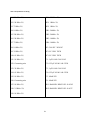
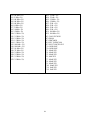
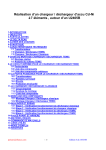
FAULT DIAGNOSIS, DESIGN AND IMPLEMENTATION OF CONTROL CIRCUIT FOR INSTRON FATIGUE TESTING MACHINE A thesis submitted in partial fulfillment of the requirements for the degree of Bachelor of Technology in Electrical Engineering By TULJAPPA M LADWA Roll No.10602005 Under the guidance of: Prof. B.D. SUBUDHI Prof. SANDIP GHOSH Department Of Electrical Engineering National Institute Of Technology Rourkela-769008 Dedicated to Indian Scientific Community National Institute of Technology Rourkela CERTIFICATE This is to certify that the project entitled, “FAULT DIAGNOSIS, DESIGN AND IMPLEMENTATION OF CONTROL CIRCUIT FOR INSTRON FATIGUE TESTING MACHINE” submitted by Tuljappa M Ladwa is an authentic work carried out by him under our supervision and guidance for the partial fulfillment of the requirements for the award of Bachelor of Technology Degree in Electrical Engineering at National Institute of Technology, Rourkela. To the best of my knowledge, the matter embodied in the project has not been submitted to any other University / Institute for the award of any Degree or Diploma Date- 07/05/2010 Rourkela ( Prof. B.D. Subudhi ) Dept. of Electrical Engineering ( Prof. Sandip Ghosh ) Dept. of Electrical Engineering Abstract Instron 1603 Electromagnetic Resonance Fatigue testing machine tests the Fatigue in the materials. This machine was imported to NIT Rourkela in 1988.After years of service this machine had stopped working due to various reasons. The service to this machine was also stopped from the supplier of this machine. In an intention to start the machine, it was necessary to know about the machine and there was no material available through which the author could know the functioning of the subcomponents of the machine. Reverse Engineering came to the rescue and the literature foundation of the machine has been done. The fault diagnosis of the machine was done to fix many faults in the machine. One point of time author realized that it would be difficult to proceed to fix the machine with the given data derived out of the machine. The fatigue testing was compromised and tensile and compression testing could be done with development of new control circuit designed and fabricated. Author has suggested some steps to be taken to restore the machine as fatigue testing machine or even design the new machine with latest technology. Acknowledgement There were many people behind the success of this project. First I would like to thank The Director of NIT Rourkela Prof S.K.Sarangi for initiating this project. I would like to take this opportunity to extend my deepest gratitude to my guide Prof B.D.Subudhi for providing me the necessary resources and going an extra mile to make me comfortable in this project. This project would not produce result without the technical guidance of Prof S.Ghosh. I am indebted to him for the valuable time he has spared for me during this work. He is always there to meet and talk about my ideas and he is great moral support behind me in carrying out my project work. I cannot forget the input of the mentor of this project Prof P K Ray and his project student Sanjay Chauhan. I am grateful to Prof A.K.Panda for permitting me to use the resources of the power Electronics Lab. I am indebted to Prof B.Chitti Babu for clarifying my doubts during crucial stage of my project. I would like to thank lab assistants Mr Ravindra Nayak, Mr Vishwanath Sahoo, Mr Chumnu Tirkey for their helping hand while repairing the motors and assembling the machine. I am grateful to Mr. Gangadhar Bag for his technical guidance in diagnosing the converter. I would like to thank Prof P C Panda and Prof Saradindu Ghosh for moral input in class and their ocean knowledge of machines and power systems which has helped at difficult times in this project. Finally I would like to thank my parents for their support and permitting me stay for more days to complete this project. Place: Rourkela Date: 10/5/2010 Tuljappa M Ladwa TABLE OF CONTENTS LIST OF FIGURES LIST OF TABLES 1. INTRODUCTION 1 1.1 Motivation for the present work 2 1.2 Objectives 3 1.3 Approach 3 1.4 Is Reverse Engineering Legal 5 1.5 Organisation of thesis 6 2. DESCRIPTION AND FUNCTIONALITIES OF THE FATIGUE 8 TESTING MACHINE 2.1 Introduction 9 2.2 System Description 10 2.3 Specification 16 3. DESCRIPTION OF SUBCOMPONENTS OF THE MACHINE 18 AND FAULT DIAGNOSIS 3.1 Power flow diagram 19 3.2 Converter 21 ` 3.3 Limit Switch 21 3.4 Automen Switch 24 3.5 Relay circuit 25 3.6 DC Motor 28 3.7 Single Phase servomotor 29 3.8 Electro Magnet 30 3.9 Load cell 30 3.10 Control Circuit 31 3.11 Protection Circuit 41 3.12 Magnet Controller 58 3.13 AC Series Motor 64 4. DESIGN OF CONTROL CIRCUIT AND ITS IMPLEMENTATION 65 4.1 Control circuit 66 4.2 Motor control for upper load string 67 5. CONCLUSION AND FUTURE WORK 70 5.1 Project outcomes and expectations 71 5.2 Future work 71 5.3 Approaches for future work 72 REFERENCES 75 LIST OF FIGURES 2.1 Mechanism of operation 9 2.2 Architecture of Instron Fatigue testing machine 12 2.3 Electronic control Block diagram 15 3.1 Power flow diagram 20 3.2 AC to DC Converter (photograph taken from the machine) 22 3.3 AC to DC converter circuit diagram (redrawn as per reverse engineering process) 23 3.4 AutoMen Switch (photograph taken from the machine) 25 3.5 Motor switch for AC series motor (photograph taken from the machine) 25 3.6 Relay circuit (photograph taken from the machine) 25 3.7 Circuit diagram of the Relay circuit (redrawn as per reverse engineering process) 26 3.8 Circuit Diagram of the logic card present in Relay circuit (redrawn as per reverse engineering process) 27 3.9 DC Motor (photograph taken from the machine) 30 3.10 Single phase AC servo motor (Photograph taken from the machine) 30 3.11 Load cell (Photograph taken from the machine) 31 3.12 Hardware of the control circuit (photograph taken from the machine) 34 3.13 Total circuit diagram of the control circuit (redrawn as per reverse engineering process) 35 3.14 A1115-1053 [2] (redrawn as per reverse engineering process) 36 3.15 A1115-1124 [2] (redrawn as per reverse engineering process) 38 3.16 A1115-1121 (redrawn as per reverse engineering process) 39 3.17 A1115-1017 (redrawn as per reverse engineering process) 40 3.18 Hardware of protection circuit (photograph taken from the machine) 44 3.19 Complete circuit diagram of protection circuit (photograph taken from the machine) 45 3.20 A1115-1016 (redrawn as per reverse engineering process) 46 3.21 A1115-1014 (redrawn as per reverse engineering process) 47 3.22 A1115-1137 [2] (redrawn as per reverse engineering process) 48 3.23 A1115-1131 [2] (redrawn as per reverse engineering process) 52 3.24 A1115-1141 [2] (redrawn as per reverse engineering process) 54 3.25 D115-1060 [2] (redrawn as per reverse engineering process) 55 3.26 1090 (redrawn as per reverse engineering process) 56 3.27 Hardware of Magnet Controller (photograph taken from the machine) 59 3.28 T1115-1470 [2] (redrawn as per reverse engineering process) 59 3.29 T115-1488 [2] (redrawn as per reverse engineering process) 60 3.30 T115-1130 [2] (redrawn as per reverse engineering process) 61 3.31 T115-1126 [2] (redrawn as per reverse engineering process) 61 3.32 Logic card of T115-1488(redrawn as per reverse engineering process) 62 4.1 Control circuit 66 4.2 AC series motor 68 4.3 Winding connection 68 4.4 Hardware of the relay based control circuit 69 5.1 Modified power flow diagram 73 LIST OF TABLES 3.1 Specification of the converter 24 3.2 Specification of relay circuit 28 3.3 Specifications of Logic card of the relay circuit 28 3.4 Specification of DC Motor 28 3.5 Specification of AC servo motor 29 3.6 Functions of the different Buttons in Control and protection circuit 33 3.7 Specification of A115-1053[2] 37 3.8 Specification A115-1124 [2] 37 3.9 Specification of 1121 41 3.10 Specification of 1017 41 3.11 Specification A115-1137 [2] 49 3.12 Specification A115-1131 [2] 49 3.13 Specification A115-1141 [2] 51 3.14 Specification A115-1060 [2] 53 3.15 Specifications of 1014 57 3.16 Specifications of 1016 57 3.17 Specifications of 1090 58 3.18 Specification A115-1470 59 3.19 Specification A115-1130 60 3.20 Specification A115-1126 61 3.21 Specification of logic card of T115-1488 63 4.1 Specification of control circuit hardware. 69 Chapter – I Introduction 1 Instron 1603 Electromagnetic Resonance machine is a fatigue testing machine. Fatigue and tensile strength are data’s which are very important to know about the materials and are mandatory to know before the material is used in the applications. There have been many accidents due to manipulation or wrong measurement of these data. Fatigue: It has been found experimentally that when a material is subjected to repeated stresses, it fails at stress below the yield point stress. Such type of failure of material is known as Fatigue. The failure is caused by means of a progressive crack formation which are usually fine and of microscopic size. The failure may occur even without any prior indication. The fatigue of material is affected by the size of the component, relative magnitude of static and fluctuating loads and the number of load reversals. Instron 1603 was imported to NIT Rourkela in 1988.This machine after giving many years of service stopped working from past 3-4 years. The service to this being stopped by the supplier forced The Director of NIT Rourkela Prof S.K.Sarangi to initiate the project of restoring this machine for some use. The project was handed over to Prof B.D.Subudhi, he brought in Prof S.Ghosh in this project and I being student, Head of the department pitched in this project with collaboration of Prof P K Ray authority of the machine and his student Sanjay Chauhan. 1.1 Motivation for the present work 1. Instron is presently selling its 8000 series fatigue testing machine and the principle of operation is hydraulic based due to which the cyclic loading which can be applied is limited to 6Hz where as 1603 is Electromagnetic based machine which can be tested till 150 Hz cyclic loading. 2. Instron testing machines are highly expensive and nonoperational machine is worth nothing and one day it could have been sold to some scrap vendor in an aim to use the space occupied by the machine for some other purpose. 2 This motivated Electrical Engineering department to take up this hilarious task in an aim to restore the machine to some use and develop indigenous skills in this respect. 1.2 Objectives 1. To make the existing old Instron machine operational. 2. To achieve 1, the following sub objectives are planned a. To understand the basic working principle of the fatigue Testing machine b. To dismantle the machine by feruling the wires and draw all the electrical circuits on paper. c. To construct the connection diagram of the machine with respect to different motors, power circuit and other components d. To understand the functionality of individual circuits in view to replace/redesign the damaged/non functioning ones 3. To redesign the control circuit. 4. To reassemble the machine and connect the individual components together. 5. Testing of the machine for confirmation of its working. 1.3 Approach I had a meeting with project guides to understand the objective of the project. (Aug, 2009) The room was opened after many years. There was no electricity in the room so first few days were spent on getting the electricity. (Aug, 2009) After I saw the machine and the circuits, it was noticed that the condition of the circuits were very bad. The rats in the room had cut the wires between the components and made it difficult to guess which wire will be connected to which electronic component. (Aug 2009) The manual which was provided with machine had only information about the usage and features of the machine, there was no information about the circuits or their diagrams, so I had to wait to interact with the service engineer of Instron India who was about to visit mechanical department. It was understood from the engineer that the circuit diagrams of 3 the machine no more exists because the company had stopped manufacturing and service to this machine. It was learned that there were few machines left in India one of which could be found in NIT Jamshedpur. (Sep, 2009) I visited NIT Jamshedpur and found out that their machine also does not work and also the circuit for control and protection was different than ours, so I came back with some pictures of the different components of the machine.(Sep, 2009) The machine was dismantled by carefully feruling the connected wires (Oct, 2009) The individual circuits were identified as control circuit, protection circuit and magnet controller and the Electronic cards were drawn on paper. (Oct - Nov, 2009; Jan, 2010) The connection diagram was constructed by thoroughly examining the machine (Nov, 2009) The faults where identified in magnet controller and fixed, the faults were mainly open circuit. The faults in the protection circuit were identified and fixed. There were too many open circuits in control circuit which jumbled us to fix it (Jan-Feb, 2010) In a meeting with the guides it was decided that it will be difficult for us to fix the machine without the complete knowledge of the controller and also at some point it was decided that to proceed for designing and implementing new controller circuit and protection circuit but that would require years of rigorous research. It was suggested by supervisors to make the machine workable for tensile and compression testing or just providing a mean load to the job even if fatigue testing is compromised for some time (March, 2010) There are three motors which had to be tested. One was identified as single phase AC series motor which was used to day light adjustment of the upper load string (this was found faulty, there was an open circuit in the field winding), the biggest hurdle in this process was there was no rating plate of the motor. Second motor was identified as separately exited DC motor, this motor was diagnosed for open circuit in field circuit, third was single phase servo motor. (March, 2010) The DC supply to test the motor was made and the DC motor was tested which paid the way to start the machine. It was observed that the job could be given tensile and compression loading through downward and upward displacement of lower mass. (March 2010) 4 The switching arrangement for bidirectional movement of the AC series motor was solved. The motor was started, paying way to daylight adjustment of the upper load string of the machine (March, 2010) The relay circuit was studied and it was realized that there was a need to design our own relay control circuit for the desired operation.(March 2010) The control circuit was designed and fabricated. (April 2010) Control circuit was installed in the machine.(May,2010) The machine was assembled and the machine passed the testing for desired operation(May,2010) 1.4 Is Reverse Engineering Legal? The Literature survey about reverse engineering if done one can find journal papers on reverse engineering in software engineering. There are many books written on this basically dealing with the machines and methods required for reverse engineering. Before arguing about its legality one should have understanding about reverse engineering. So what is Reverse Engineering? Reverse engineering is taking apart an object to see how it works in order to duplicate or enhance the object. Why use Reverse Engineering? [3] Following are some of the reasons for using reverse engineering The original manufacturer no longer exists, but a customer needs the product,e.g., aircraft spares required spares required typically after an aircraft has been in service for several years. The original manufacturer of a product no longer produces the product, e.g., the original product has become obsolete. The original product design documentation has been lost or never existed. Creating data to refurnish or manufacture a part for which there are no CAD data, or for which the data have become obsolete or lost. Inspection and/or quality control-comparing a fabricated part to its CAD description or to a standard item. 5 Some bad features of a product need to be eliminated e.g, excessive wear might indicate where a product should be improved. Strengthening the good features of a product based on long-term usage. Analyze the good and bad features of competitor’s products. Exploring new avenues to improve product performance and features. Creating 3-D data from a model or sculpture for animation in games and movies. Creating 3-D data from an individual, model or sculpture to create, scale, or reproductive artwork. Architectural and construction documentation and measurement. Fitting clothing or footwear to individuals and determining the anthropometry of a population Generating data to create dental or surgical prosthetics, tissue engineered body parts, or for surgical planning. Documentation and reproduction of crime scenes. The above list is not exhaustive and there are many more reasons for using reverse engineering, than documented above. Today Reverse engineering is protected by laws with different provisions in US and other countries. The only argument I would like to propose in defence of Reverse engineering is this technique can bridge the technological gap between West and the developing countries. The technologies decoded through reverse engineering will be cheaply available to the organizations, bringing down the cost which will create more jobs and wealth hence reducing poverty and violence in the society. 1.5 Organisation of the Thesis The thesis is divided into five chapters. Second chapter deals with Description and Functionalities of the machine. In this chapter reader will know about the working principle of the machine and its features. Third chapter deals with System Subcomponents and Fault Diagnosis. In this chapter reader will know about the Reverse Engineering of the machine and faults discovered and how the author rectified the faults. 6 Fourth chapter Deals with Design of Control circuit and its implementation. After reader goes through chapter three, reader will feel the necessity and importance of the design. Design and implementation of the control circuit is discussed in detail and the hardware specifications for fabricating the same. Fifth Chapter is Conclusion and Future work. In this chapter reader will learn about the project outcomes and expectations. The future work emphasizes on the approaches to be taken to restore the machine as fatigue testing machine or to redesign the whole machine to make it a genuine product to get patented. 7 Chapter – II Description and functionalities of Fatigue testing machine 8 2.1 Introduction [1] The Instron Model 1603 EMR (Electro Magnetic Resonance) Machine has been designed for high cycle fatigue testing of materials (mainly metals) which includes: Production of data for S/N curves. Pre-cracking of compact tension and bend specimens for fracture toughness determinations. Crack growth studies, i.e. number of load cycles per unit crack length increase. Fatigue of fastenings, i.e. bolts etc. Fatigue of components, i.e. welded joints, gear teeth, etc. These tests may be carried out while cycling through zero loads, or about an entirely tensile or compressive mean load. The test specimen is held vertically in a frame that has its design based on a resonant spring/mass system. The principle of operation is that a cyclic load is produced in a specimen by exerting the natural resonance of a mass supported by a spring, of which the specimen is a part. The model 1603 EMR Machine is basically two contra-oscillating masses with the spring between them. Upper mass 1 2 3 4 5 Lower mass 6 (1)Upper Mass (2) Upper grip (3) Specimen (4) Lower grip (5) Lower cell (6) Lower mass Figure 2.1: Mechanism of operation[1] 9 As the specimen, its grips and adaptors are part of the spring / mass system, the characteristics of these components largely dictate the performance of the machine during a test. The specimen can only be tested if it will respond as a spring, i.e. a metal tested within its elastic range. In the model 1603 Machine, the basic spring/ mass is suspended on support springs, an electro- magnet is positioned below the two masses to maintain oscillation at the natural resonant frequency. A position screw enables adjustment of the height of the upper specimen grip and can also, if necessary apply a mean load by deflection of the support springs. The spring mass is maintained at resonance by magnet drive pulses , generated in a power amplifier , in synchronism with the natural frequency of the resonant system , using the load cell output as a timing waveform. The design of the power amplifier is novel and is the subject of a patent application. Normally the magnet would be powered by a large linear amplifier of about 1,000 W with a frequency spread of about 50-400 Hz. The power dissipation of such an amplifier results in considerable heat with consequent loss of reliability. The amplifier of the Model 1603 EMR Machine works as a switching device with considerably reduced dissipation and makes a further power reduction by feeding back into the power supply the energy produced by the magnet back EMF. This results in a power consumption of only 150 W, approximately, to maintain the full load capabilities of the machine. The mean load is automatically maintained on the specimen by four Achme screws at the corners of the support spring structure. The springs are belt driven from a reversible drive motor through worm gear boxes and the motor is energized in the required direction by a servo system which constantly compares the required mean load with the actual mean load and turns the screws to adjust for the difference. In addition, the speed of rotation of the motor can be adjusted to meet test requirements so that the rising speed under stress is correct. 2.2 SYSTEM DESCRIPTION [1]: The model 1603 EMR machine frame (fig 2.2) comprises two masses separated by a stiff spring. The ‘spring’ consists of the specimen being tested, its gripping attachments and load cell. The spring/mass system is supported and guided by leaf springs. Each mass is attached to four leaf springs; the upper mass is attached to its support springs through two long columns. The two sets of support springs are separated by four Acme screws which pull together or push apart the nodal points of the upper and lower mass springs are to apply a compressive or tensile mean load when 10 rotated by a servo motor through worm gears. The nodal points of the upper and lower mass springs are rigidly held to a cruciform and the use of two contra – oscillating masses eliminates the need for a heavy and cumbersome seismic block. The frame assembly is isolated from the machine base by anti- vibration mounts between the plinth and the cruciform. These mounts ensure that very little vibration is passed through to the floor on which the machine stands. The machine covers are free – standing to avoid contact with the resonance frame. The electro- magnet is fixed to the cruciform and positioned on a servo- driven wedge, enabling the air gap between the armature, attached to the lower mass, and the magnet to be controlled. When the magnet is energized, the air- gap closes applying a tensile load to the specimen. The magnet is energized by high current pulses generated at the natural frequency of the spring/mass assembly so that a resonant system is maintained. A mean load is applied to the specimen by establishing a reference level on a potentiometer labeled ‘M.L.Demand’. A servo motor energized by a comparator amplifier in the base of the test frame drives the four Acme screws between the upper and lower mass support springs, so as to apply the required mean load in tension or compression. During a test the specimen under load will yield and, as a result, the mean load will tend to fall off. The servo, when set for automatic operation, will operate during the test to maintain the demanded load. The application or change of mean load changes the gap between the faces of the electro- magnet and its armature. An LVDT (Linear Variable Differential Transducer) is mounted across the gap and senses the change. The LVDT output actuates the servo operated wedge to drive in or out to maintain a pre-selected air – gap. The selection of air–gap size is made by the operator based on the predicted specimen excursion for the load being applied. A graduated knob for setting the airgap is sited on the lower mass. The force developed by the magnet is controlled by the magnet is controlled by varying the pulse width of the drive signal to the power amplifier. Figure [2.3] shows the electronic control in the block diagram form. The object of the electronic control is to make the pulse width of the drive signal proportional to the magnitude of the peak load error signal generated by summing amplifier A7. 11 Figure 2.2 courtesy Instron [1] 12 The output of the load cell is approximately proportional to the load applied to the specimen. This is input to a load cell amplifier in the console. The load cell amplifier magnifies the load signal in the range 0 to 10 volts, where 10 volts is the output for the maximum capacity of the load cell. The load cell amplifier output is applied to three stages of the controller circuit: a sine to square wave converter, a peak load detector, A2, and the mean level detector A3. The sine to square wave converter provides a digital signal that is used to synchronize the control system to the dynamic load waveform. The converter has been designed to operate from load signals as low as 0.1% of the maximum load range. The peak load detector A2 extracts the dynamic load value from the load cell amplifier output. This is summed with a peak load demand value in the summing amplifier A7 to produce an error signal. The mean load detector A3 extracts the mean load from the load cell amplifier output. This is fed to the matter selector switch as is the peak load from A2 for display on the console digital voltmeter. The output of the sine to square wave converter is applied to an exclusive-OR gate; the other input to the gate is logic 0 or 1, depending on the sign of the load error signal output by the summing amplifier A7. The effect of a logic level shift is to change the phase of the synchronizing signal at the output of the EX-OR gate by 1800 relative to the load signal. The synchronized drive resulting pulse is now in phase or 1800 out of phase with the load signal, the latter resulting in a magnet force which has damping effect on the resonant system. This prevents the load in the specimen exceeding the set demand enables the high ‘Q’ system to follow more effectively any programmed demand fed in from an external source. The programmable performance of the Model 1603 EMR Machine is another feature which makes it superior to any other spring/mass resonance machine currently available in the market. The output of the Ex-OR gate operates a transistor switch which resets the ramp generator A5 in synchronism with load signal. The ramp generator circuit consists of a servo loop in which the rectified and smoothed ramp produced by A5 is compared with a D.C reference at A4 to give a D.C error voltage which is used to generate the ramp and to determine and control ramp amplitude. As stated before, ramp frequency is synchronized with dynamic load waveform. 13 The DC error voltage A4 is proportional to frequency and is scaled in amplifier A6 to produce a voltage between 1.00 V and 3.00 V to display on the panel meter as 100 to 300Hz. The load cell amplifier output for a purely dynamic load is seen as a sine wave in which, by convention, the positive peak represents tension in the specimen whilst negative represents compression. For the magnet to generate a force which is driving the system, it is necessary to ensure it is switched on only when the gap is already closing as a result of the natural oscillation period. It is important that peak force coincides with the zero point on the load error signal. This pulse is used to trigger the power amplifier in the test frame but is gated to provide start/stop facilities. In the resonating system, the load cell and grips, when under-going an acceleration force(G), exhibit a dynamic load in anti-phase to that applied to the specimen and equal to the specimen and equal to approximately half the weight of the cell and grips. A signal is generated in the dynamic compensation Module, Factored for G as measured by an accelerometer at the load cell, and applied to the dynamic load signal so as to give a true representation of the peak mean load. The console front panel is also fitted with a time/cycle counter. This gives a visual indication of the lapse of a preselected time or of prescribed number of cycles at the natural resonant frequency. 14 Figure 2.3 Courtesy Instron [1] 15 2.3 SPECIFICATION [1] Load capacity: Dynamic Load ± 100KN Mean Load ± 100KN Frequency Range: 100Hz to approximately 300Hz dependent on specimen stiffness. Maximum cyclic Extension: 1mm for dynamic load of ±100KN 3mm for dynamic load of ±100KN The maximum dynamic loads attainable will depend on the damping losses in the specimen, grips and fixtures Load measurement Accuracy: ± 0.5% of indicated force or ±0.2% of full scale, whichever is the greater Load control Accuracy: ± 1% Magnet Air Gap Control: Accuracy ±0.1mm (Automatic) Range to 5mm speed 10mm/min Horizontal Daylight: 580mm Vertical daylight: Adjust 100mm to 600mm Load Frame: Control console: weight 1500Kg Height 2500mm Floor Area 980 x 1000mm weight Size Power Requirements: 20kg 510x350x280mm 720maximum-1200W peak 200 to 250 volts 50Hz or 110V 60Hz single phase Automatic Mean Level Control System Mean load control: Accuracy ± 1% Maximum Travel: ±10mm 16 Speed: ±1 to ± 10mm/min Signal Inputs Mean Load Dynamic Load ± 0.01 V DC for 1% range Peak Load maximum Peak Load minimum Frequency: +0.01V per Hz Synchro: 50mV for 1% Accuracy: ± 1% of value External inputs Mean level: Dynamic Level: 0 to -10V for 0 to +100% +10V to -10V for -100% to +100% 17 Chapter – III Description of Subcomponents of the Machine and Fault Diagnosis 18 3.1 POWER FLOW DIAGRAM When any house hold appliance let’s say television is not functioning, we call the service provider to repair the television. The service engineer is well known with the circuit diagram of the television and he checks the voltage and impedance at certain test points and gets the clue of which devices are faulty. Once the faulty devices are replaced with new ones the television works normally. The only requirements the service engineer should know are the exact voltage and impedance at the test points for the particular model. The service engineer does not have to know all the details of working of the machine. The machine I had to fix had neither service manual nor the details about the functionality of the different components of the machine. To understand the functionality of the machine subcomponents and its architecture the machine was dismantled by carefully feruling the wires so that the machine can be reassembled. The reverse engineering started with this process. I felt the necessity to know the power flow diagram of the machine and also how the different circuits are interconnected. This gives vital information about the power continuity, if some component close to the circuit is not receiving the power then that component should be attempted to fix first. The power flow diagram gave lot of hints about the possible functionality of the subcomponents of the machine. Figure (3.1) shows the power flow diagram of the machine. The single phase 230V, 50Hz supply is distributed to Panel (which consist of circuit boards), converter and magnet controller. 19 Supply to panel Power distribution 1-ph,230 V,50 Hz AC to DC converter Limit Switch Resistance Pot Relay Circuit M 195V to Field Auto Men Switch 1ph Servo Motor 8.1 uF M Magnet Controller Protection Circuit Electromagnet Instron Port Load cell Control Circuit Port Instron Box Figure 3.1 Power Flow Diagram The analysis of this power flow diagram can be divided into four segments. AC to DC converter converting single phase voltage to DC voltage. A fixed voltage of 195V supplied to field of the DC motor and the armature voltage is supplied to the DC motor through relay control. The Resistance potentiometer is used by the user to vary the voltage of the armature so that speed of the Motor can be controlled. Relay control is controlling the voltage to Armature of the DC Motor. Limit switch senses the limits of the load. Through Auto men switch one can switch to the man mode where the load can be controlled by the user. In Auto mode, the load can be set by the user. There exists a feedback mechanism which sets the lower load cell displacement such that particular set can be applied. The protection circuit and the control circuit can be imagined as one circuit. The mean Load can be set here. The limits such as Maximum and minimum load limits can be set here. There are various parameters which the user can control from here and also there are displays provided for certain parameters, details of this will be discussed later. The circuits are doing the said operation through relay control of the DC motor and control of Electromagnet through magnet controller. The Load cell is feeding the load or force information necessary for the feedback control. These two circuit boards are situated in a panel. Except these circuit rests other sub components shown in the block diagram are situated in machine. 20 Magnet controller is actually the one responsible for fatigue testing. This controls the power signals input to the Electromagnet. It controls the air gap in the electromagnet through a single phase servo motor as shown in the figure [3.1]. The Subcomponents of the machine and their possible fault diagnosis as taken up for detail discussion as follows 3.2 Converter: This is converting AC supply to DC supply which will be supplied to armature and field coils of the DC traction motor. The field is directly connected to the converter which is supplying 195V DC and the armature is connected through relay circuit and the voltage can be varied using Resistance Pot provided in the machine. This can vary the speed of the motor through armature voltage control. Figure (3.3) shows the circuit diagram of the converter circuit and Figure (3.2) shows its hardware. Table (3.1) lists the components used in the circuit. The circuit diagram was made after tracing the hardware. Following are the salient features of the converter The 195V DC field supply is output of bridge made of diodes and a voltage drop in resistor. The armature supply is variable and output of semi controlled bridge. The two SCR’s used are TYN 604, the variable supply is achieved by varying the firing angle to the SCR’s. The gate firing angle circuit is a RC logic. Approach used for fault diagnosis Checked the circuit for continuity. Checked the healthiness of the capacitors, diodes, transistors, SCR’s, pulse transformer.LM324 and resistors Replaced the blown up Fuse. Checked the voltage of different test points in CRO, it was found that all the test points except the test point in the pulse transformer responded the sign of healthiness of the circuit. The diodes and pulse transformer was replaced and the converter functioned. 3.3 Limit switch: When the machine is given tensile load then a lower displacement limit exist for the load cell below which the machine may get damaged, similarly upper displacement limit exist for 21 compression loading. These limits are been sensed by limit switches and the information is fed to relay circuit to stop the DC motor. The limit switches are normally closed type and when the limit is reached it opens the circuit. Figure 3.2 AC to DC Converter, courtesy: Instron 22 Figure 3.3 AC to DC Converter Circuit diagram 23 R1 = 0Ω(POWER RESISTOR) R39 = 470Ω ± 2% R2,R3,R4,R21,R31,R34 = 22KΩ ± 2% R42 = 720 ± 2% R5,R8,R9,R48 = 1KΩ ± 2% R43 = 12KΩ ± 2% R6 = 150Ω ± 2% R44 = 51KΩ ± 2% R7,R10 = 27Ω ± 2% R46 = 27KΩ ± 2% R11,R22 = 220KΩ ± 2% R47 = 560KΩ ± 2% R13 = 7200Ω ± 2% R49 = 1200Ω ± 2% R14,R29,R30,R33,R36,R45,R51,R52 = 10KΩ ± 2% R50 = 1500Ω ± 2% R15,R16,R40,R41 = 3300Ω ± 2% TR1,TR2 = TYN604 R17 = 67KΩ ± 2% TR3,TR5,TR6 = MPS6531 R18 = 33KΩ ± 2% TR4 = GE2N4991 R19 = 220Ω ± 2% D1,D2,D5 = ITT BY 255 R20,R32 = 470KΩ ± 2% D3,D4 = ITT133 R23 = 2200Ω ± 2% D15,D18,D19 = 46C R24 = 67MΩ ± 2% C1,C4,C9 = 22nF,250V R25 = 15KΩ ± 2% C2,C8,C13 = 4µF,35V R26,R38 = 100Ω ± 2% C3,C11,C12 = 22µF,25V R27,R37 = 150 Ω ± 2% C7,C5,C10 = 1µF,250V R28 = 1KΩ ± 2% C6 – B32538 10nK 400 T1 – IT253 Table 3.1 Specifications of converter 3.4 Auto Men Switch: This switch is used to direct the machine in automatic mode where in the load is applied to the job as preset and the motor adjusts the lower mass automatically to get the desired load in the job or the machine can also be operated in manual mode where in the load cell can be moved in desired direction using respective switches provided. 24 Figure 3.4 Auto Men switch, courtesy: Instron Figure 3.5 Motor switch for AC series Motor, courtesy: Instron 3.5 Relay circuit: This basically consists of 2 relays of 15 V, 1A DC which will be used to control upward and downward motion of the lower load cell coupled to the motor with a mechanical arrangement. It is receiving DC power from the converter which has to be fed to the DC Motor armature. The polarity of the supply will decide the direction of rotation of the motor. It receives information from Limit switch and Auto Men Switch and protection circuit. A logic circuit is present to process information from Limit Switch, Auto Men switch and protection circuit. The 15V DC voltage required for relay and electronics devices in logic circuit is received from protection circuit. Figure [3.6] shows the hardware of the relay circuit. Figure 3.6 Relay circuit, courtesy: Instron 25 Figure 3.7 Relay circuit Daigram 26 Figure 3.8 Circuit Diagram of the logic card present in Relay circuit 27 Figure [3.7] is the circuit diagram of the relay circuit and figure [3.8] shows the circuit diagram of the relay logic card. Table [3.2] shows the specification of the relay circuit and Table [3.3] shows the specification of logic card of the relay circuit. R1-R4 R5-R10 C1-C4 C5-C6 T1,T2 100Ω ± 2% 220Ω ± 2% 100nF 100uF,40V 6531 Table 3.2 Specifications of relay circuit C1,C2- 100µF,40V R3,R11 – 100Ω ± 2% TR1,TR2,TR5 – MPS6531 R6,R10 – 5600Ω ± 2% TR3,TR6 – MPS6534 R7,R9,R14 – 1000Ω ± 2% D1,D2,D3,D4 – 1N4148 R8,R12 – 27000Ω ± 2% R1,R2,R4,R5,R13 – 10KΩ ± 2% VR1,VR2 – 2KΩ ± 2% Table 3.3 Specifications of Logic card of the relay circuit 3.6 DC Motor: This is separately exited DC motor [4] manufactured by HELY, France. The rating of the motor is as follows 245 W Useful Power Rotation per min Rated armature voltage Rated field voltage Maximum armature current maximum field current 3000 T/mn 180V 195 V 1.7A 0.19A Table 3.4 Rating of the DC motor The field is exited from convertor and armature by relay circuit. Figure [3.9] shows the DC motor. The motor is connected to gear mechanism whose rating is as shown in the table [3.4]. Motor is a two pole machine. The field resistance was found to be 10.1 KΩ where as the resistance calculated from the rating is 1026 Ω. Approach for fault diagnosis The motor with the gearing system were decoupled from the belts attached to the shaft. 28 The gearing system was decoupled from the motor. The oil from the gearing system was removed and replaced with gear Mobil. The shaft of the motor coupled with the gearing system was rusted due to which there was mechanical jamming. The rust was cleared by polishing the shaft with fine emery paper. The motor was dismantled. Continuity test [7] was performed on the field coil which it did not pass. The insulation was removed and the field coils were removed from the shoe. One field coil passed the continuity test but the other did not. After removing the insulation and the cloth tape in the field coil which did not pass the continuity test, it was found that a flash had occurred due to which few strands of wire had opened. A fine soldering was done to join the strands of copper and then insulation was given and kept for drying. A cotton tape was given the coil and placed back to surround the shoe. The field resistance was found to be 1300Ω, which is close to the rated field resistance. The motor was coupled with gearing system and No load test was carried out. The motor passed the No load test. The motor gear system was placed back in the machine and the belts were coupled with the system. The test was carried using rheostat in series with armature of the motor which it passed successfully. 3.7 Single phase servo motor: This is exited from magnet controller and used for adjusting the air gap in the magnet. Figure [3.10] shows the servo motor [8], the rating of the motor is as follows Voltage Frequency Rotation per min Current Capacitor rating Insulation class 220 V 50 Hz 1340 T/mn 0.41 A 8.2uF B Table 3.5 Rating of the Single phase servo motor 29 Figure 3.9 DC Motor, courtesy: Instron Figure 3.10 Single phase AC servo motor, courtesy: Instron 3.8 Electro Magnet: This is used in the fatigue testing operation. This is basically an electromagnet which is receiving pulses from magnet controller. The rating of electromagnet is yet to be known. 3.9 Load cell: A load cell (figure (3.11)) is a transducer which converts force into a measurable electrical output. The load cell used in this machine is ± 100 KN rating. The type of load cell is not known yet. It gives information about load which it gives in terms of voltage ranging from -10V to 10V, the other sensor which is mounted below the load cell gives the information about the frequency of operation in terms of voltage ranging from 0-5V.The voltages of the sensor and the load cell are input to male of the port. The male of the port is connected to the female of the cable connected to protection circuit. 30 Figure 3.11 Load cell, courtesy: Instron 3.10 Control Circuit: The machine can be started and stopped from here. This has various displays as shown in the figure which display load, frequency. This machine consists of four logic cards. The +15V and 15V DC source required for the logic circuits and the various other chips in the control circuit, protection circuit, relay circuit and magnet controller is generated here. Table [3.6] shows the functions of the switches used in control and protection circuit. Figure [3.12] shows the hardware of the control circuit. Figure [3.13] shows the Total circuit diagram of the control circuit where the cards will be connected. Figure [3.14], [3.15], [3.16], [3.17] shows the circuit diagrams of the logic cards. This circuit had suffered the maximum damage which forced the author to restore the machine for mean loading only compromising the fatigue testing for some time. The total circuit diagram drawn is not complete. Following is the table of functions of different switches used in the control circuit. 31 Control console controls and indicators [1] Mains switch This is a push-on push-off switch with a red lens. The red lens is marked with a sine wave and, when ON, the switch is illuminated. This switch also connects the mains to the Console DVM. Counter on/off pushbuttons This is set to ON when the Time/cycle counter is Required This has a six digit display for total count and a separate six digit display and presenting facility located behind a red transparent cover. A small rectangular pushbutton, adjacent to the lower display is used to reset the counter and also release the transparent cover The switches select methods of count for the counter circuit, either time lapse in seconds, or number of cycles of oscillation of the resonant system. The figures set and displayed by the counter must be scaled and displayed by the appropriate factor selected by these switches This module makes it possible to exclude from the total load the component due to the moment of inertia caused by the load cell and the specimen gripping system. If the switch on this module is moved to Set, the load cell input to the control circuits is replaced by that of an accelerometer located near the load cell in the frame. The potentiometer is used to generate a D.C. level equivalent to the accelerometer’s input level but in the opposite sense so that they cancel. This compensates for the inertia due to the load cell and specimen grips etc. and shows the recorded total load dynamic compensation is measured and applied with the load string minus the specimen mounted in the frame and with the system operating. This control is used to balance the output of the load cell for the weight of the specimen, grips and adaptors, so that the output of the load cell after balancing is representative of the load applied to the specimen. This control adjusts the gain of the load cell amplifier board so that 10 volt output represents the output of the load cell when Counter Unit Seconds x1, x10, x102 Cycles 102, 103, 104 Dynamic compensation Module Balance Controls Calibrate Controls 32 loaded to its capacity in tension or compression. Cal. Pushbutton This button connects the calibration circuit into load measuring circuit. Load cell protection The red warning light comes on when the total load (mean + peak) exceeds the permissible level. The machine then stops. The system can be restarted by pressing the small button on the load cell protection module. The machine cannot operate when red warning light is on. NOTICE: This warning light is not active in mean-load and does not prevent ant any manual overloading. Dynamic Load Demand Control This is a potentiometer and a SET push button used in conjunction with DVM to set the required peak load demand. Gain Control The potentiometer adjusts the Servo loop gain of the resonant system. It is adjusted for the maximum response (minimum time lag) commensurate with the smooth operation of the system light. Current limit warning light This warning (in parallel with the amplifier one) comes on when amplifier is saturated and the magnet current has reached its maximum permitted limit of 10A. Mean Load Demand The required mean load is applied by the potentiometer on this module. With the DVM SET button is selected , the small push button on the module is held depressed and the potentiometer turned until the DVM records the required mean level,-for a compressive load and + for a tensile load. Peak load Module meter switch When setting the peak load demand the DVM is connected via set switch, to peak load module by small black push button mounted on below the peak load demand control. Table 3.6 Functions of the different Buttons in Control and protection circuit [1] 33 Figure 3.12 HARDWARE OF THE CONTROL CIRCUIT, courtesy: Instron 34 Figure3.13 Total circuit diagram of the control circuit. [2] 35 Figure 3.14 1053 [2] 36 R1,R4,R5,R7,R22,R23 R2,R6,R31 R3 R8 R9, R13, R16, R18, R21 R10 R11 R12 R14 R15,R17, R19, R20, R24,R27,R29,R30 R25 R26 R28 C1 C1-C8 IC1 IC2 IC3 IC4 IC5 51 KΩ ± 2% 100 KΩ ± 2% 17 KΩ ± 2% 22 KΩ ± 2% 10 KΩ ± 2% 1MΩ ± 2% 2.7KΩ ± 2% 10Ω ± 2% 7.5KΩ ± 2% 3.3 KΩ ± 2% 2.2KΩ ± 2% 47Ω ± 2% 18Ω ± 2% 2.4KΩ ± 2% 2 µF/63V 100 nF, 50 V 2480C L8613 MC-1741C L8519 MC-1458CP P8504 MM-5611BN CD-4011BCN 340C SN-7403N Table 3.7 Specification of A115-1053 [2] R2,R6,R7 R1,R5 R3,R9 R4,R8 R10 R11, R12 R13,R14 R15 R16 R17 IC1 IC2 IC3 C1,C2 C3 220 KΩ ± 2% 330 KΩ ± 2% 2 KΩ ± 2% 9.1 KΩ ± 2% 24 KΩ ± 2% 51 KΩ ± 2% 2.2 KΩ ± 2% 3.3 KΩ ± 2% 750 Ω ± 2% 3.7 KΩ ± 2% M8408 741CN MC1741 K8610 MC1741CP L8613 100 nF/50V 4 µF/7K63/65.1 Table 3.8 Specification of A115-1124 [2] 37 Figure 3.15 1124 [2] 38 Figure 3.16 1121 39 Figure 3.17 1017 40 VR1,VR2 - 500Ω ±2% R2,R5 – 10000Ω ±2% VR3,VR4 – 10KΩ ±2% R10 – 22KΩ ±2% IC1,IC2,IC3,IC4,IC5 – MC1741CP,L8613 R11 – 51000Ω ±2% R7,R12,R13,R14,R15,R18 – 100KΩ,0.02%(POWER RESISTOR) R17,R20 - 9100Ω ±2% R8,R9,R16,R19 – 10KΩ,0.02%(POWER RESISTOR) R1,R3,R4,R6,R21,R22,R23,R24 – 1000Ω ±2% C1,C2 - 47µ,25V C3,C4 – 100nF,50V Table 3.9 Specification of 1121 R1,R2,R3,R12 = 47Ω ± 2% D1 - BZX46C R4,R5,R6,R7,R8,R13,R14,R16,R24 = 2200Ω ± 2% D2 – 1N4148 R9 = 1200Ω ± 2% D3 – 1N 4007 R10 = 33KΩ ± 2% C3, C7, C6, C1, C5, C4,C11,C10,C18,C8,C15 – 10nF,50V R11 = 100Ω ± 2% R15 = 390Ω ± 2% R17,R19,R22 = 670Ω ± 2% R18 = 750Ω ± 2% R20 = 100KΩ ± 2% C9,C13 – 1Nf C12 – 0.47µF C14 - 1000µF,16V C16 - 22µF,10V R21,R23,R25 = 330Ω ± 2% Table 3.10 Specification of 1017 3.11 Protection Circuit: This is communicating with control circuit. The user can set the parameters required for the experiment. Figure [3.18] shows the hardware of the protection circuit. Figure [3.19] shows the complete circuit diagram of the protection circuit diagram of the circuit where the logic cards will be fixed. Figure [3.20 – 3.26] shows the circuit diagrams of the logic cards. 41 Specimen Protection Module [1] The specimen protection module may be used to: Protect the test specimen from over load and under load conditions. Stop the test on a specimen when preset condition has been achieved. The module has two identical limit functions which operate independently on one another. The control parameter to be limited is selected from a column of four switches. The preset limit value is set on a ten turn potentiometer; the level can be displayed on the console D.V.M by depressing the set button near the corresponding potentiometer. An analogue comparator compares the selected control parameter with preset limit value and illuminates a LED when coincidence is reached. On coincidence the peak dynamic signal from the console to the testing frame will cease, although the mean level will be maintained, and the counter, if in use, will be stopped. Three position switch above the preset level potentiometer is set for the direction from which the preset limit is approached by the control parameter, the central position of the switch is ”off” position for that particular half module. The four control parameters on the left hand half of the module are: Dynamic Load Mean Load Mean load + Dynamic Load Resonant Frequency The four control parameters on the right hand half of the module are: Dynamic Load Mean Load Mean load - Dynamic Load Resonant Frequency When the central switch is on STOP, at coincidence machine will stop. If on ‘opposite position’, the test will not stop but the LED will light to indicate that a limit condition has reached; in both cases the counter, if in use, will stop. 42 Operation Before the module is put into operation, there are three functional details to be carefully considered:1. The signal polarity convention used for the EMR system is, that the more tensile the load the more positive the signal representing the load, up to a maximum of 10 volts. The more compressive the load and the more negative the signal representing the load, up to a maximum of -10 volts. 2. The console D.V.M displays level in 10 mV steps, and a decimal point is inserted in front of the first digit. This causes 10 volt displayed as 100.0, i.e DVM displays load signal as a percentage of the capacity of the load cell. Therefore before setting a limit, desired level should be converted into the percentage of the load cell’s capacity. 3. If the preset limit is more positive than the corresponding control parameter, the direction toggle should set upwards. If the preset limit is more negative than the corresponding control parameter, direction of the toggle switch should be set downwards. Procedure Ensure that the both direction switches are OFF. Select STOP or WARNING mode Select the control parameter to be limited. If the mean – dynamic is a parameter, use the left hand half module, if the mean + dynamic is a parameter, use the right hand half module. Depress the set button in the same half module as the control parameter selected and the potentiometer till the console DVM displays the limit level required. Dynamic load can set anywhere between 0 and 100%. Mean load +dynamic load and Mean Load –Dynamic load can be zero to 100%. Resonant frequency can be 100 to 300 Hz. Release the Set button, start the test on the specimen, and switch in the limit circuit by setting the direction switch above the potentiometer upwards or downwards as appropriate. When the limit trips, the machine will stop(or not)and the LED adjustment to the SET button will light. Set the direction switch to OFF, press the Set button and the LED will extinguish. 43 During a test the level of the control parameter being limited can be displayed on the console D.V.M by selecting the appropriate switch under the D.V.M. Figure 3.18 HARDWARE OF PROTECTION CIRCUIT, COURTSEY: INSTRON Approach for Fault Diagnosis The circuit had rusted. Petrol and thinner were used to clean the circuit board and remove the rust out of the circuit board. A thorough continuity test was carried out with help of multi meter. The damaged components were replaced. Why petrol is used? Petrol is a non conductor of electricity. The petrol is a solvent which dries up very quickly. Thinner was used to remove the rust. 44 Figure 3.19 COMPLETE CIRCUIT DIAGRAM OF PROTECTION CIRCUIT [2] 45 Figure 3.20 1016 46 Figure 3.21 1014 47 Figure 3.22 1137 [2] 48 R1 R2, R4 R3,R5,R29,R36 R6, R7, R8, R9, R11, R12, R14, R15, R18, R20, R21, R22, R25 R10, R24, R37 R13, R19 R23 R24,R37 R26 R27 R28 R30 R32 R30 R35 50 KΩ ± 2% 51 KΩ ± 2% 100 KΩ ± 2% 10 KΩ ± 2% 3.3 KΩ ± 2% 4.7 KΩ ± 2% 20 KΩ ± 2% 1 MΩ ± 2% 4.7 KΩ ± 2% 13 KΩ ± 2% 8 KΩ ± 2% 1 KΩ ± 2% 15 KΩ ± 2% 33 KΩ ± 2% 20 Ω ± 2% 670 Ω ± 2% 670 KΩ ± 2% 2.7 KΩ ± 2% Table 3.11 Specification of 1137[2] Table 3.12 Specification of 1131 [2] R1,R4,R12,R19 R2 R2 R2 R6, R7 R8,R9,R13,R24,R25,R31,R34,R35 R10,R15 R11 R14 R16,R21 R17 R18 R20 R22 R23, R32 R26 R27 R28 R29 R30 R33 R37, R40 100 KΩ ± 2% 150 KΩ ± 2% 67 KΩ ± 2% 5.1 KΩ ± 2% 10 KΩ ± 2% 2.2 KΩ ± 2% 2 KΩ ± 2% 120 KΩ ± 2% 670 Ω ± 2% 47 Ω ± 2% 36 KΩ ± 2% 6.7 MΩ ± 2% 670 Ω ± 2% 220 Ω ± 2% 330 Ω ± 2% 460 KΩ ± 2% 39 KΩ ± 2% 16 KΩ ± 2% 2.4 KΩ ± 2% 15 KΩ ± 2% 100 Ω ± 2% 1.2 KΩ ± 2% 49 R39 R40 C1 C2 C3 C4 C5,C6 C7 C11 C12 C13, C14, C15, C16 C17 VR1 VR2 VR3 IC1 IC2 IC3 IC4 IC5 IC6 IC7 51 KΩ ± 2% 1.2 KΩ ± 2% 1 µF/100V 0.1 µF/10/250 100 µF/25V 111 µF/111V 100 nF/50V 470 pF 47 µF/25V 0.1 µF/10/250 10 nF/50V 47 nF 100 kΩ 50 kΩ 10 kΩ MC1458CP L8509 2458DC 406 M 8408 741CN 8522BS SN 7486N 7403PC 8248 8423C SN 7400N P8448 DM 7412N 50 Table 3.13 Specification of 1141[2] R1- 220 KΩ ± 2% R20- 2.2 KΩ ± 2% R2- 120 KΩ ± 2% R21- 1 KΩ ± 2% R3- 72 KΩ ± 2% R22- 1 KΩ ± 2% R4- 10 KΩ ± 2% VR1- 20 KΩ ± 2% R5- 220 KΩ ± 2% VR2- 20 KΩ ± 2% R6- 120 KΩ ± 2% VR3- 10 KΩ ± 2% R7- 72 KΩ ± 2% VR4- 10 KΩ ± 2% R8- 10 KΩ ± 2% IC1- 344 SFC 2458 DC R9- 39 KΩ ± 2% IC2- LF 356H T8538 R10- 61 KΩ ± 2% IC3- LF 356H T8538 R11- 10 KΩ ± 2% C1- 1 µF/10/100 344-21105 R12- Connecting wire C2- 0.22 µF/10/100 944-21224 R13- 39 KΩ ± 2% C3- 1 µF/10/100 344-21105 R14- 61 KΩ ± 2% C4- 0.22 µF/10/100 944-21224 R15- 10 KΩ ± 2% C5- 100nF/50V R16- Connecting wire C6- 100nF/50V R17- 10 KΩ ± 2% RL1- HAMLIN HE822 C05-10 8505 R18- 2.2 KΩ ± 2% RL2- HAMLIN HE822 C05-10 8517 R19- 10 KΩ ± 2% 51 Figure 3.23 1131 [2] 52 R1- 100 KΩ ± 2% R2- 51 KΩ ± 2% R3- 100 KΩ ± 2% R4- 100 KΩ ± 2% R5- 100 KΩ ± 2% R6- 10 KΩ ± 2% R7- 33 KΩ ± 2% R8- 2.4 KΩ ± 2% R9- 2.2 KΩ ± 2% R10- 2.2 KΩ ± 2% R11- 2.2 KΩ ± 2% R12- 2.2 KΩ ± 2% R13- 1.2 KΩ ± 2% R14- 1.2 KΩ ± 2% R15- 100 KΩ ± 2% R16- 100 KΩ ± 2% R17- 10 KΩ ± 2% R18- 33 KΩ ± 2% R19- 2.4 KΩ ± 2% R20- 2.2 KΩ ± 2% R21- 2.2 KΩ ± 2% R22- 2.2 KΩ ± 2% R23- 170 Ω ± 2% R24- 170 Ω ± 2% R25- 2.2 KΩ ± 2% R26- 2.2 KΩ ± 2% R27- 47 Ω ± 2% R28- 47 Ω ± 2% R29- 47 Ω ± 2% R30- 47 Ω ± 2% R31- 100 KΩ ± 2% R32- 100 KΩ ± 2% IC1- 340C SN7403N IC2- P8444 IC3- DM7400N IC4- SFC 2458DC 406 IC5- MC174 MCP L8315 C1- 0.01K/400V C2- 0.01K/400V C3- 100nF/50V C4- 100nF/50V C5- 100nF/50V C6- 10nF/50V C7- 100nF/50V C8- 100nF/50V C9- 100nF/50V C10- 100nF/50V C11- 10nF/50V C12- 10nF/50V Table 3.14 Specification of 1060 [2] 53 Figure 3.24 1141 [2] 54 Figure 3.25 1060 [2] 55 Figure 3.26 1090 56 R1 – MX500,27R4,1.0,8604 R12 – 100KΩ,0.02%(POWER RESISTOR) R2 – 301KΩ,1%(POWER RESISTOR) R13 – 100KΩ ±2% R3 – R0654,100R IC1 – 3626BP R4 – 34K8 IC2 – MC1458CP;L8442 R5,R10 – 330Ω ±2% IC3 – UA741CN;KOP244 R6 – 20KΩ ±2% C1,C2 – 0.022/K/400 R7 – 68kΩ ±2% C3,C4 – 100Nf,50V R8 – 2K32 D1 - 6V2 R9 – 13KΩ ±2% D2 – 5V6 R11 – 51KΩ ±2% Table 3.15 Specifications of 1014 VR1 – 10KΩ R12 – 470KΩ ±2% D1,D2,D3,D4,D5,D6 – 4148 R13 – 270Ω ±2% C1,C5 – 1nk R17 – 160KΩ ±2% C2 – 70pF R18 – 2700Ω ±2% C3,C4,C7,C8 – 100nF,50V R19 – 2400Ω ±2% IC1,IC3 – MC 1458CP ; L8519 R20 – 220Ω ±2% IC2 – HA17741 R22 – 270Ω ±2% R1,R2,R5 – 100KΩ ±2% R23 – 20Ω ±2% R3,R6,R7,R15 – 10KΩ ±2% R24 - 100Ω ±2% R11,R21 – 20000Ω ±2% Table 3.16 Specifications of 1016 57 R1 = 2200Ω ± 2% R17 = 160K ± 2% R2,R11 = 10MΩ ± 2% R18 = 100K ± 2% R4,R19 = 1KΩ ± 2% IC1 = LF356H;T8538 R3,R20 = 100KΩ ± 2% IC2,IC3 = MC1458CP; 18519 R5,R7,R8,R10 = 10KΩ(POWER RESISTOR) C1,C2 = 100nF,50V R6 = 20KΩ(POWER RESISTOR) C3 = R9,R13 = 4700 ± 2 % C4 = 1µF/10/100 R12 = 3K(POWER RESISTOR) C5 = 0.68/10/100 R14 = 140K(POWER RESISTOR) C6,C7 = R16 = 210K ± 2% Table 3.17 Specifications of 1090 3.12 Magnet controller: The circuit is shown in the figure [3.27]. This has a power amplifier (T8610) and power diode mounted on heat sink which is supplying electric pulse to the electromagnet. The functioning of the each individual circuit is yet to be explored. 58 Figure 3.27 Magnet controller, courtesy: Instron Figure [3.28-3.32] shows the circuit diagrams of the magnet controller. LED3 R1 -15 V +15 V - L 0 +24 V INC C2 C1 LED1 R4 D1 D2 R5 LED2 N DEC COM R2 C4 C3 Figure 3.28 T1115-1470 [2] R1,R2 R3,R4,R5 C1,C2 2200 KΩ 100Ω 100nF Table 3.18 Specification table for T1115-1470 59 R3 Q1 D1 R2 C4 D3 C3 D4 C5 R1 C2 C1 Q3 D2 Q2 Figure 3.29 T115-1488 [2] R1,R5 R2,R6,R7 R3,R9 R4,R8 R10 R11 R12 TR1,TR2,TR3 IC1, IC2, IC3 C1,C2 C3 C4 VR1 33000Ω 22Ω 2000Ω 9000Ω 26000Ω 150000Ω 24000Ω 6531 741CN 100 nF,50 V 47 uF, 25V 1uF 50KΩ Table 3.19 Specification table of the circuit T115-1130 60 R7 R1 R10 R6 R3 R11 R12 C4 R2 0% R13 R4 R5 IC1 IC3 IC2 C3 R14 D1 Q1 D3 R9 D2 Q2 C1 C2 1 32 Figure 3.30 T115-1130 [2] R1 C1 R2 C2 R3 C3 R6 LED1 To Magnet controller R4 R5 L1 Figure 3.31 T115-1126 [2] R1,R2,R3 C1,C2,C3 R4,R5 R6 R7 10KΩ 10000 uF, 100V DC,9.5A 1KΩ 100Ω 290KΩ Table 3.20 Specification of T115-1126 61 C4 R7 Figure 3.32 Circuit diagram of logic card of T115-1488 62 R1 = 47Ω ±2% C1,C4 = 100Nf,50v R2,R7,R10 = 670Ω ± 2% C2 = 47µF, 25V R3,R9,R13 = 2700Ω ± 2% C3 = 1µF,40V R4,R15 = 10000Ω ± 2% C5,C6 = 10Nf , 50V R5,R8 = 220Ω ± 2% IC1 - 18344 R6,R25 = 2200Ω ± 2% IC2 – 6N136 R11,R17 = 170Ω ± 2% IC3 – MCI4011 BCC R14 = 9100Ω ± 2% TR3, TR4,TR5,TR6,TR9 – MJE340 R18 = 27000Ω±5% TR1,TR7 – MPS6534 R20 = 7500Ω ± 2% TR2,TR8 – MPS6531 R21 = 2500Ω ± 2% R22,R23 = 1MΩ ± 2% R24 = 330KΩ ± 2% R27,R26 = 1.5 KΩ ± 2% Table 3.21 Specification table of logic card of T115-1488 63 Approach for Fault diagnosis The circuit boards were cleaned and by petrol and the rust was removed using thinner. The open circuits were identified. The open circuits were fixed by fine soldering and using a tape for joining and insulation. 3.13 AC series motor [8] This motor is used to control the motion of upper load string and works on a single phase supply. The upward and downward movement is controlled by a switch as discussed in [4.2].The motor coupled with the load string through a gearing arrangement. The motor was not in working condition and had to be diagnosed. Approach for Fault Diagnosis There was no rating plate on the motor, which made the job of diagnosing very difficult. The motor was decoupled from the belt and the machine. The motor was dismantled and it was found that the motor is 2 pole machine. The rotating rpm is 3000 but the shaft actually rotates at 440 rpm, a gearing arrangement was discovered in the motor which converts 3000 rpm to 440 rpm. It was discovered that the two field coils were in series connected by jumper. There was open circuit in the jumper and the field coil was also damaged. Rewinding of the field coil was done. New jumper was made and the field coils were connected. It is to be noted that the author only knew that a single phase supply is given to the motor. The type of single phase motor was not known. The motor was started by trial and error basis. It was found that the motor is a single phase AC series motor. The logic for clockwise and anti clock wise rotation was solved which will be discussed in next chapter. The motor was assembled back and tested for no load condition. After it passed the no load test and worked for designed contactor logic it was placed back in the machine. The tension in the belt was adjusted. Testing was carried out which it passed successfully. 64 Chapter – IV Design of control circuit and its Implementation 65 4.1 CONTROL CIRCUIT The relay circuit in the machine was tested by giving +15V supply to the terminals which previously where connected to the protection circuit, the relays did not become operational. The decision was made to design the circuit using the control signals from limit switch. The objective is to provide flexibility to the load cell for both tensile and compression operation, when the load cell attains lower or upper limit of the loading then the relay [6] should trip the motor driving the load cell. Figure shows the control circuit for the said operation. Relay Limit switch Push Button R1 R2 12 V DC Supply Ladder logic of the Relay control circuit R1 A1 From convertor R2 A2 Power circuit to feed DC power to armature using relay control Figure 4.1 The logic here is a 12 V DC supply should be given to the coil of the relay only when the limit switch does not gets actuated and the push button [5] for the desired operation is pressed. The limit switch is such that it has normally closed switch and when the said limit is attained the switch gets opened. 66 Let’s say we want to apply tensile load on the job then we would want the load cell to displace in downward direction, this is achieved when we push the button for downward operation, this completes the circuit where in 12V DC supply is given across the coil and the armature gets attracted to complete the power circuit for tensile loading. When the load cell displaces downwards then at certain point the limit switch is pressed mechanically which opens the normally close switch which further opens the control circuit and the supply to motor gets opened leading to halting the load cell. The compression type loading also operates on the same principle. The tensile or compression loading is decided by the polarity of the supply given to the armature. In this machine the mechanical coupling mechanism is such that when positive supply bus is connected to A1 and negative bus is connected to A2 then machine runs for tensile loading. Figure 1 shows the power circuit, if the relay2 is operated by pressing the downwards switch then positive bus is connected to A1 and the normally open switch of relay 2 gets closed due to which negative bus is connected to A2.The compression loading can be given to the job if negative bus is connected to A1 and positive bus connected to A2. Figure [4.4] shows the hardware fabricated. Table [4.1] shows the specifications of the material used. 4.2 MOTOR CONTROL FOR UPPER LOAD STRING The circuit diagram for the motor operation is shown in the figure 4.2. The motor is single phase AC series type which is coupled to the upper load string of the machine with mechanical arrangement. The arrangement is such that when the motor rotates in an anticlockwise direction the upper load string moves up and when rotated clockwise then the upper load string moves down. The upper load string is only used for fitting the job according to the size of the job. 67 Figure 4.2 When the switch for upward motion is operated the current direction is from A2 to A1. When the switch for downward motion is operated the current direction is from A1 to A2. The figure 4.3 shows the different winding arrangements and the current direction for the above said operation. L A2 N Winding connection when A1 F2 L F1 N A1 Winding connection when switch is oprated Figure 4.3 68 A2 F2 F1 switch is oprated Figure 4.4 Hardware of the Relay based control circuit Name of the Instrument Relay Diodes Transformer Push Buttons Rating 12V,60Ω 200V PIV 230V:12V NA Quantity 2 4 1 2 Table 4.1 Specification of the Hardware 69 Chapter – V Conclusions and Future work 70 The project and the entire process gave the foundation of skills of Reverse engineering to me. The project started with the intention of restoring the machine as fatigue testing machine but ended with the reverse engineering of the machine and modification in its functionality, making it work as compression and tensile testing. The reverse Engineering helped in rectifying the faults as stated in chapter 4 and also lighted the lamp of hope that if the right approach is taken the machine can be restored as fatigue testing machine in future. 5.1 PROJECT OUTCOMES AND EXPECTATIONS 1. Skills and self confidence was developed in identifying the fault and diagnosing it. 2. The machine working principle was understood. 3. All the electronic circuits were drawn on paper and an effort was made to understand the same. 4. The faults in the circuits were identified and fixed. 5. The faulty motors were fixed. 6. The control circuit to operate the machine for tensile and compression testing was designed and fabricated. 7. The machine was made operational. 8. The future expectations from this project is that measurement system for load will be developed and I am currently working on this. 9. In future the machine can be restored back if some fault occurs because the documentation of the machine has been done keeping the same in mind. 5.2 FUTURE WORK The future course of work can be seen in two contexts, one as restoring the machine back to the fatigue testing machine and another framing a problem statement in an intention to redesign the entire machine with same fundamental working principle but with modification in the old technology into new. The development of microprocessors, operating system took a fast track after 90’s; these technologies can be utilized to redesign this old machine. 71 This project has laid the literature foundation of the machine. We know the functionalities of the subcomponents and their architecture. I suggest following approach for the future course of work. 5.3 APPROACHES FOR FUTURE WORK 1. The functionalities of the chips used in the circuit diagrams obtained in the reverse engineering process should be understood. The block diagram of the entire power flow diagram should be constructed by neglecting the parasitic resistances and capacitances. This will improve the depth of the understanding of the machine. 2. As of the present stage of the project it can be used for mean loading, so now the load cell calibration has to be done to standardize the voltage according to the load applied. 3. All the circuits and the other subcomponents should be connected according to the power flow diagram and a thorough simulation should be carried out. This will help to rectify any open circuit in the circuits. A proper modeling of the machine is necessary to completely understand the technical details of the machine. 4. There are software’s available in the market to simulate the mechanical transmission system. Simulation should be carried out whether the entire machine electrical system is capable of driving the desired transmission system. 5. All the Subcomponents like protection circuit, control circuit and the measuring system can be replaced by software in the computer. To make this software to drive the actuator we need to simulate this circuits and answer to this basic questions that I. How they are starting the machine? II. How they are commanding the actuators to control the parameters? III. How the feedback mechanism is taking place? IV. How they are measuring the said parameters and displaying it? If we can answer these questions then a new algorithm can be developed and software can be written to replace this circuit system. 72 6. The magnet controller can be redesigned with new power efficient power amplifiers. The electromagnet specification should be chosen according to the new controller. 7. The relay circuit should be replaced with power transistor logic based controller. 8. The AC to DC converter can be replaced with the converter with software controlled firing of the gate pulse for the same power rating. The speed control should be software based logic so that a fine control of the displacement of the load cell can be achieved. 9. More number of parameter measurements should be added so that one machine can be used by the researchers working on materials. 10. The mechanical arrangement system should be more power efficient and reliable. Following Figure is my imagination for power flow diagram for the machine. Supply to panel Power distribution 1-ph,230 V,50 Hz AC to DC converter Power Electronic switch gear Limit Switch Firing angle control M 195V to Field Auto Men Switch 1ph Servo Motor 8.1 uF M Magnet Controller Computer Electromagnet Port Instron Box Figure 5.1 Modified Power Flow Diagram 73 Software Instron Port Load cell To realize this model following sub objectives are proposed 1. The interfacing of the load cell port to the computer should be done. 2. Algorithm should be constructed keeping following points in mind The automatic loading should be possible on command from the computer. This can be realized if the algorithm is written on the lines of LMS algorithm or some other latest algorithm based on Kalman filter. The DSP processor available from Texas instruments may be used or FPGA preferably from Xilinx can also be used to realize the algorithm. The lower mass should vibrate at the frequency set by the user in the computer. A rigorous research has to be made with reference to the latest advancement in automation technology. The protection of the machine should be given highest preference even if it calls for reducing the limit for frequency. 74 Reference 1) Handbook, Instron 1603 material testing machine,England,1987 2) Mohapatra Romit, Panda Ashutosh, Fault Detection and circuit analysis of Instron 1603 fatigue testing machine, BTech Thesis submitted to NIT Rourkela-may 2010. 3) Raja Vinesh, Fernandes Kiran.J, ”Reverse Engineering, An Industrial Perspective ”,London : Springer,2008. 4) Herman Stephen L, Alerish Walter N, “Industrial Motor control”, New York: Delmar publishers, 1998. 5) T. A. Hughes, Programmable Controllers, Resources for Measurement and Control Series (Instrument Society of America): NC, 1997. 6) J. L. Blackburn and T. J. Domin, “Protective Relaying: Principles & Applications”, New York : CRC Press, 2006. 7) A.S. Langsdorf,” Theory of A. C. Machines” , New Delhi : Tata Mcgraw Hill, 2001. 8) L. Kosow, Electric Machinery & Transformers, New Delhi: Prentice Hall of India, 2001. 75